Financial systems
Do data centers raise electric bills?
PJM’s monitor estimates a wholesale capacity cost. Utility filings show where individual bill components changed.
The short version
- The independent monitor estimates modeled data center demand raised 2026/27 PJM capacity auction revenue by $7.27 billion, or 45.1% of the auction's observed revenue.
- My illustration puts the rest-of-PJM capacity price increase at $9.01 a month for a household with 5 kW of allocated capacity and full pass-through, within a $5.41–$12.62 range.
- Dominion's standard bill rose $30.87 a month at 1,000 kWh between July 2025 and July 2026, and the documents do not assign it all to data centers.
- ERCOT reported 474 GW of large-load interconnection requests as of June 2026 and 9,456 MW approved to energize in its September report; requests are not connected load.
In PJM’s wholesale capacity market, the independent monitor estimates that modeled data center demand raised 2026/27 auction revenue by $7.27 billion, equal to 45.1% of the auction’s observed revenue. The delivery year runs from June 2026 through May 2027. The rate orders below identify specific bill changes but not the share data centers caused.1
Your household bill depends on your utility, which charges changed and who pays for the added infrastructure.
Electricity prices by utility
| Utility | States | Bundled price change, 2019–25 (%) | Delivery-only price change, 2024–25 (%) | Documented data center evidence | Attributed residential share (%) |
|---|---|---|---|---|---|
| AEP Texas Central Company | TX | — | 2.77 | — | — |
| AEP Texas North Company | TX | — | 7.67 | — | — |
| AES Indiana | IN | 30.65 | — | — | — |
| Alabama Power Co | AL | 33.56 | — | — | — |
| ALLETE, Inc. | MN | 43.17 | — | — | — |
| Ameren Illinois Company | IL | 77.26 | 5.75 | — | — |
| Appalachian Power Co | VA;WV | 51.05 | — | — | — |
| Arizona Public Service Co | AZ | 25.24 | — | Data centers were about 5% of 2025 system peak. Among the 15 largest customer sites, data centers increased from two in 2020 to nine in 2025. | — |
| Atlantic City Electric Co | NJ | 46.36 | -2.59 | — | — |
| Austin Energy | TX | 21.2 | — | — | — |
| Avista Corp | ID;MT;WA | 36.46 | — | — | — |
| Baltimore Gas & Electric Co | MD | 64.78 | 13.96 | — | — |
| Berkeley Electric Coop Inc | SC | 22.52 | — | — | — |
| Bluebonnet Electric Coop, Inc | TX | 11.08 | — | — | — |
| CenterPoint Energy | TX | — | 9.66 | — | — |
| Central Hudson Gas & Elec Corp | NY | 60.97 | 8.88 | — | — |
| Central Maine Power Co | ME | 58.22 | 32.52 | — | — |
| City of Chattanooga - (TN) | GA;TN | 18.41 | — | — | — |
| City of Colorado Springs - (CO) | CO | 20.47 | — | — | — |
| City of Huntsville - (AL) | AL | 22.16 | — | — | — |
| City of Lakeland - (FL) | FL | 10.48 | — | — | — |
| City of Memphis - (TN) | TN | 31.98 | — | — | — |
| City of San Antonio - (TX) | TX | 16.03 | — | — | — |
| City of Seattle - (WA) | WA | 29.65 | — | — | — |
| City of Tacoma - (WA) | WA | 19.24 | — | — | — |
Prices use residential revenue per kWh. Bundled service includes energy and delivery. Delivery-only prices cover the delivery utility’s charges. Blank cells indicate unavailable evidence. The CSV includes additional periods, exposure classifications and source links.
Why is my electric bill so high?
Your bill can rise because electricity costs more per unit, because you use more, or because fixed and other charges change. The latest comparable national data show prices up but do not say how much data centers caused.
A kilowatt-hour, or kWh, measures electricity consumed. EIA’s realized residential price divides utilities’ revenue by the electricity they sold to homes; it is not a quoted tariff for a particular household. For January–August 2026, that price was 18.19 cents/kWh, against 16.36 cents/kWh in the same months of 2024: 11.2% higher. The monthly data were released October 23 and remain preliminary for 2026.2
In Ohio, both the unit price and consumption rose. Its realized price rose 18.1%, from 15.92 to 18.81 cents/kWh, over the same periods. Revenue per residential customer-month—a measure of the average account’s bill—rose 20.5%, from $140.88 to $169.82. Average consumption also increased, from 884.7 to 902.7 kWh per customer-month.2
Holding Ohio’s 2024 average usage fixed, the higher realized price explains $25.54 of the monthly difference. Valuing the extra usage at the 2026 price explains another $3.40. Together they reproduce the $28.94 increase. This is an accounting decomposition; neither component is assigned to data centers.
Ohio’s average residential bill rose 20.5% from 2024 to 2026, against 13.1% nationally
Change in residential price per kWh and in average account bill, January–August 2024 to January–August 2026, nominal, %
Numbers and method
| % change | Price per kWh | Average account bill |
|---|---|---|
| US | 11.2% | 13.1% |
| Ohio | 18.1% | 20.5% |
Source: EIA-861M monthly revenue, sales and customer counts; January–August 2024 and 2026, retrieved November 12, 2026. Workbook: PriceCalc. Prices and bills are nominal; the chart is not causal attribution.
For a hypothetical Ohio household using 1,000 kWh every month, applying the change in the statewide realized price gives $28.87 more per month. A real bill differs with supplier contract, fixed charges and consumption pattern. To check a real bill, compare the same billing period’s kWh, energy price, delivery charges and riders, which are specific billing adjustments, against the earlier bill.
Data centers and PJM wholesale capacity costs
PJM’s independent monitor provides direct evidence of an effect on wholesale capacity costs. It does not calculate a data-center charge on each residential account.
PJM coordinates a regional electricity market. Its capacity market pays resources to be available to support reliability in a future delivery year. The energy market pays for each kWh generated. The independent market monitor, Monitoring Analytics, reruns the auction after removing specified data center demand while holding the other auction assumptions fixed.1
For the current 2026/27 delivery year, reported auction revenue is $16.12 billion. The monitor’s counterfactual without all modeled data center demand is $8.85 billion. The difference is $7.27 billion, or 45.1% of reported auction revenue.1
The newest analysis, published October 30, 2026, covers the later 2028/29 delivery year. Its corresponding difference is $6.27 billion, or 38.2% of reported revenue. Removing only the modeled data center demand above the monitor’s baseline gives $5.73 billion.3
PJM’s market monitor attributes $7.27 billion of the 2026/27 capacity auction’s $16.12 billion to data center demand
PJM capacity auction revenue with and without all modeled data center demand, by delivery year, USD billions
- Without modeled data center demand
- Data center contribution
Numbers and method
| USD billions | Without modeled data center demand | Data center contribution |
|---|---|---|
| 2025/2026 | $5.35bn | $9.33bn |
| 2026/2027 | $8.85bn | $7.27bn |
| 2027/2028 | $9.91bn | $6.50bn |
| 2028/2029 | $10.14bn | $6.27bn |
Source: Monitoring Analytics auction analyses for delivery years 2025/26–2028/29, published June 2025–October 2026; retrieved November 12, 2026. Workbook: PJMCalc. The counterfactual holds other auction assumptions fixed. Future delivery years are not current bills.
Three assumptions carry the interpretation. First is how much data center demand is included in the forecast and how much connects. Second is the available supply and auction rules, including the price collar that limits clearing prices. Third is how wholesale costs reach customers through supply contracts, self-supply and retail allocation. Changing any of these changes the bill result; the monitor itself calls its simulations “not forecasts or predictions.”3, 4
The full simulation uses confidential auction offers.
How much more could a household pay?
My illustration gives $5.41–$12.62 per month, with a $9.01 base case, for the rest-of-PJM auction-price increase. It assumes full wholesale pass-through at the stated capacity obligations.
The rest-of-PJM capacity price rose from $269.92 per MW-day in 2025/26 to $329.17 in 2026/27, a $59.25 difference. One MW-day means one megawatt of accredited capacity for one day; it does not mean one megawatt-hour of electricity consumption. The model assumes an allocated capacity obligation of 3, 5 or 7 kW in equivalent unforced-capacity (UCAP) units, which reflect availability. That obligation must already incorporate the supplier’s applicable allocation factors; an unadjusted meter peak cannot simply be inserted.5
| Illustrative case | Allocated capacity | Retail pass-through | Monthly price-change effect |
|---|---|---|---|
| Low | 3 kW | 100% | $5.41 |
| Base | 5 kW | 100% | $9.01 |
| High | 7 kW | 100% | $12.62 |
The base calculation is 5 kW ÷ 1,000 × $59.25/MW-day × 365 days ÷ 12 months = $9.01 per month. A smaller retail pass-through scales it proportionately.
| Allocated capacity | 25% pass-through | 50% | 75% | 100% |
|---|---|---|---|---|
| 3 kW | $1.35 | $2.70 | $4.05 | $5.41 |
| 5 kW | $2.25 | $4.51 | $6.76 | $9.01 |
| 7 kW | $3.15 | $6.31 | $9.46 | $12.62 |
Source: published PJM prices; all capacity obligations and pass-through percentages are stated assumptions. Period: June 2026–May 2027 versus the preceding delivery year.
Location matters. Dominion and BGE had prior local auction prices of $444.26 and $466.35 per MW-day, respectively, above the current $329.17. Applying the rest-of-PJM increase to those zones would get even the direction wrong.5
Are rates rising faster near data centers?
The result changes sign when the method for selecting comparison utilities changes, so the direction of the retail price effect is unresolved.
The panel covers the 150 largest distribution utilities by 2025 residential customer count, following those legal utility identifiers back to 2015. It contains 1,617 observed annual utility-years out of 1,650 possible, with missing years left blank rather than imputed. It also includes January–August monthly observations for 128 utilities in 2026. The utility roster stays fixed at the 2025 ranking throughout the series. Panel files
The two core cases have primary evidence of operating growth: Dominion reported 744 MW of data center capacity connected in 2025, and Georgia Power attributed its 4.1% weather-adjusted commercial sales growth in 2025 primarily to new and existing data centers. Capacity and energy growth are different measures. These disclosures identify data center exposure and leave annual changes in metered load open.6, 7
The base comparison matches each case to the three nearest utilities with the same ownership type and Census region, using 2019 price, customer scale, commercial/industrial sales share and 2015–2019 price growth. Utilities must have at least 95% bundled residential customer coverage at the three comparison endpoints. Bundled service includes electricity supply and delivery; delivery-only utilities cannot be treated as if their reported revenue includes a retail supplier’s energy charge.
From 2019 to 2025, the two cases’ mean realized price rose 29.9%, versus 35.9% for their weighted donors: 6.1 percentage points less. The same-region, one-donor specification instead gives 3.3 percentage points more. Removing Appalachian Power from the donor pool and rematching gives 1.1 points more. Donor pairs and weights
The matched comparison flips from 6.1 points below its donors to 3.3 points above as the donor choice changes
Price growth in two data center growth cases minus matched donor utilities, 2019–2025, residential, percentage points
Numbers and method
| percentage points | Case minus donors |
|---|---|
| Same region, three donors (base) | −6.1 pp |
| Same division, three donors | −4.9 pp |
| National, three donors | −2.1 pp |
| Same region, one donor | 3.3 pp |
| Same region, omit pretrend | 1.0 pp |
| Remove Appalachian Power, rematch | 1.1 pp |
Source: EIA-861 final 2015, 2019 and 2025 source rows; calculations and independent replication retrieved/completed November 12, 2026. Workbook: MatchCalc. Two selected growth cases; donor data center exposure is UNKNOWN. This is not a causal effect estimate.
The base uses only four comparison utilities; Appalachian Power and Duke Progress each receive one-third of the aggregate weight. Georgia’s prices and those of its comparison utilities also differed meaningfully before the period. Data center exposure at the comparison utilities is unverified. Regional capacity effects can reach both cases and donors. There is no common treatment date, comparable load-growth intensity or adjustment for every fuel, storm and investment change. A 2025 customer-coverage screen also uses information from the end of the comparison period.
An additional comparison includes NOVEC and APS. It uses account counts and APS’s sample of its largest customers as proxies for utility-wide connected MW. Earlier original research, including a 2015–2024 causal preprint, reports that load growth can spread existing fixed costs over more sales; its historical period and design do not settle the later capacity-constrained case.8
The nationwide causal effect remains unestimated. A credible estimate needs an annual, utility-mapped series of energized data center demand and defensible low-exposure comparisons, alongside the approved cost-allocation records.
Why did Dominion’s electric bill rise?
Dominion’s published standard bill rose $30.87 per month between July 1, 2025 and July 1, 2026, at 1,000 kWh. Every dollar reconciles to published bill components, but the documents do not assign the whole increase to data centers.9, 10
| Bill component group | Monthly change, USD |
|---|---|
| Base rates, covering mixed functions | +$11.17 |
| Fuel and deferred-fuel financing | +$7.42 |
| Generation and related asset riders | +$6.38 |
| Policy, environmental and assistance riders | +$2.88 |
| Transmission rider outside base rates | +$2.10 |
| Distribution and broadband rider | +$0.92 |
| Total: $149.92 to $180.79 | +$30.87 |
These groups count each charge once. Some purposes overlap: offshore wind is both a generation investment and a policy-related resource, for example. The transmission amount already embedded in base rates is not added again. Both years assign the broadband charge to distribution to account for its move between line items.9, 10
Base rates and fuel and financing account for $18.59 of Dominion’s $30.87 monthly bill increase
Change in Dominion’s standard 1,000 kWh residential bill by component, July 1, 2025 to July 1, 2026, USD per month
Numbers and method
| USD per month | Change in monthly bill |
|---|---|
| Base rates | $11.17 |
| Fuel and financing | $7.42 |
| Generation assets | $6.38 |
| Policy / environmental | $2.88 |
| Transmission rider | $2.10 |
| Distribution and broadband | $0.92 |
Source: Virginia SCC annual status reports, 2025 printed p.5 and 2026 printed p.13, current July 1 columns. Workbook: BillCalc. The columns show the July 1 bill in each year.
In the same regulator’s standard example, Appalachian Power’s bill fell from $173.63 to $168.19 over those July dates. Lower fuel charges and financing changes offset increases elsewhere. That is evidence that ordinary cost components matter; it does not certify Appalachian as a utility without data centers.9, 10
Who pays for data center power lines and plants?
Large customers often pay for dedicated connections and agree to minimum bills, security and exit charges. Whether those protections cover every shared-network and generation cost depends on each tariff and allocation order.
A minimum bill makes a customer pay for some reserved demand even if its site uses less than expected. Security and termination payments address the risk that facilities are built for a project that arrives late or disappears. Neither term proves the absence of all cost shifting, and neither directly measures a past household benefit.
| Utility or system | Verified protection or rule | Status as of November 12, 2026 |
|---|---|---|
| Dominion Virginia | New GS-5 agreements: 14-year minimum; 85% of contracted transmission/distribution demand and 60% of generation demand | Approved class begins January 1, 2027 |
| AEP Ohio | Qualifying new data center load of at least 25 MW; up to four ramp years plus eight years; minimum demand and credit obligations | Effective tariff; direct commission-document access gap recorded |
| Georgia Power | Qualifying load of at least 100 MW pays the higher of tariff charges or contract minimum; contract-specific staff review | Approved rules and compliance order; no universal duration inferred |
| PPL Electric | Dedicated connection funding, security and a ten-year term; 50 MW single-site or 75 MW nearby aggregation threshold | LP-6 effective |
| SRP | New or forecast 20-MW customers generally face an 80% forecast-demand billing floor | Effective, with customer-funded-resource and other stated exceptions |
| Texas | Direct interconnection costs and staged security for qualifying new or expanded large loads | Interconnection rule effective October 8, 2026. Transmission-allocation changes remain proposed |
Sources and exact locators: large-load tariff ledger, western input ledger, and utility rate-case ledger. The percentages apply to the billing base specified by each tariff.
The ledger reviews 15 priority utilities and five supplementary cases, chosen for their exposure and available documents. A complete data-center-attributable residential share is UNKNOWN across them. The ledger separates a full bill-component bridge from a partial increase or a single rider and does not set missing categories to zero.
PECO withdrew its 2026 distribution case; APS’s requested increase remained pending in its latest filing; and Duke’s large-load settlement was still a proposal in the record reviewed. An approved current tariff, a pending request and a future contract cannot occupy the same “rate increase” column.11, 12, 13
How many data centers are connecting to Texas?
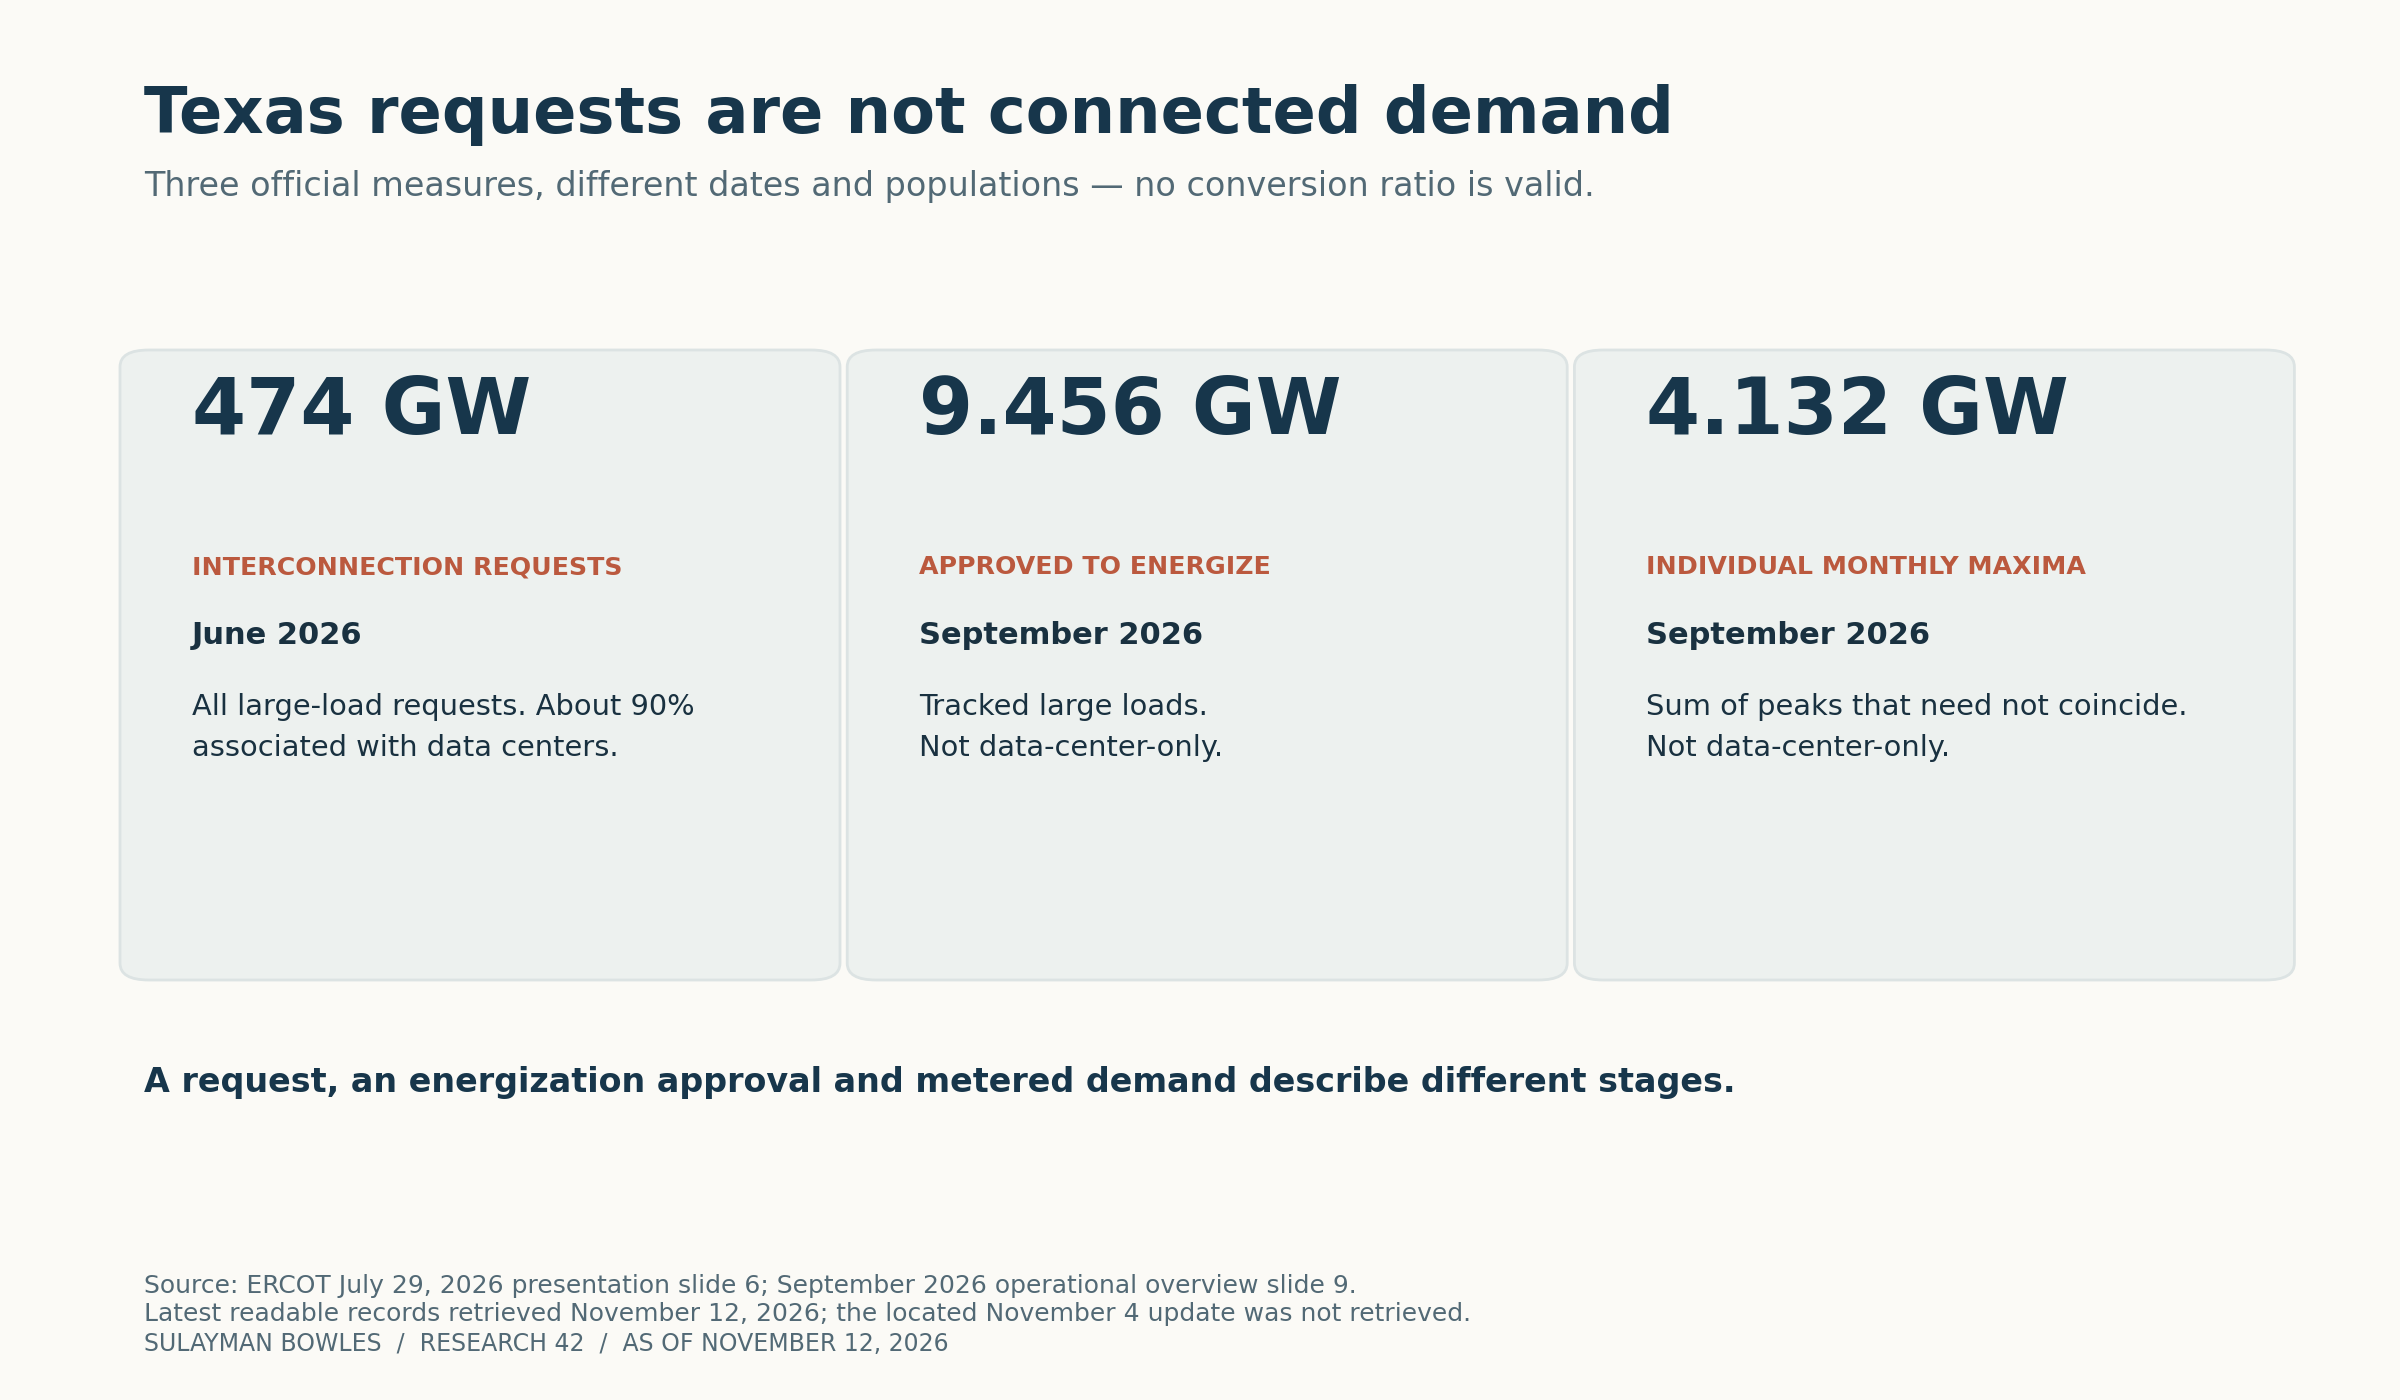
The latest ERCOT records measure different populations and dates, so they cannot be divided into a connection rate. Texas has an enormous request queue, but requests are not connected load.
ERCOT reported 474 GW of large-load interconnection requests as of June 2026, about 90% associated with data centers. Its September operating report shows 9,456 MW approved to energize and 4,132 MW as the sum of individual monthly maximum demands for tracked large loads. Those operational measures include other load types, and the individual maxima need not occur at the same time.14, 15
 (opens the full-size image)
The queue is not a probability-weighted demand forecast. ERCOT’s September Batch Zero presentation contains a conflicting studied-load total, and I did not retrieve the contents of a November 4 filing, so this is not a complete November queue reconciliation.16
Texas’s 2025 Senate Bill 6 directed financial and reliability protections for large loads. The adopted interconnection rule generally reaches sites at 75 MW and requires initial security of $50,000 per MW, with later security tied to the greater of that amount or allocated upgrade costs. Customers pay direct interconnection costs. A different proposal would change transmission billing; it was not yet the current formula in the records reviewed.17, 18
Under the present relevant Oncor tariff, large customers’ transmission billing demand uses the average of their demand during the 15-minute ERCOT peaks in June, July, August and September of the previous year. This is called four coincident peaks, or 4CP. Reducing load during those intervals can reduce that customer’s allocated transmission charge.19
For a hypothetical transmission-service customer whose average 4CP demand falls from 100 MW to 50 MW, the current $6.260839 per kW per month factor implies $313,041.95 less per month, or $3,756,503.40 annualized if the rate stays unchanged. That is its own charge reduction. It does not measure how much any household subsequently absorbs; that requires the revenue requirement, allocation factors and tariff reset. No observed data center curtailment series was obtained.19
For more on ERCOT’s market, see What does a Texas grid battery earn?.
What else is raising electricity costs?
Fuel, storm recovery, replacement of old equipment and higher construction costs are measurable competing explanations. They can operate alongside data center demand, so a residual after one cost is removed is not automatically a data center cost.
Fuel varies by month and utility. EIA’s delivered natural-gas price for the US power sector was $10.50 per thousand cubic feet in January 2026, but $3.22 in August 2026, compared with $3.26 in August 2025. A winter shock and a relatively flat late-summer comparison can both be true. Utility fuel charges also reflect local procurement and the timing of cost recovery.20
Oncor’s approved self-insurance accrual rose. The annual revenue increase was $560 million. The accrual for storm costs and other self-insured losses rose from $122 million to $200 million: $78 million, or 13.9% of the increase. The remaining $482 million is not thereby assigned to data centers. These approved-order amounts are reported in the issuer’s SEC filing; the underlying commission order was not independently retrieved.21
A bill can rise while its fuel charge falls. Austin Energy’s approved inside-city example at 860 kWh rose from $117.07 in fiscal 2026 to $120.73 in fiscal 2027, effective October 1, 2026. Base charges added $2.99 and regulatory charges $3.96; the power-supply adjustment fell $1.77, with other components producing a net $3.66 increase. The final tariff rebuilds the published total.22, 23
Austin Energy’s example bill rises $3.66 a month while its power supply charge falls $1.77
Change in an inside-city 860 kWh residential bill by component, approved FY2026 to FY2027, USD per month
Numbers and method
| USD per month | Change in monthly bill |
|---|---|
| Base rates | $2.99 |
| Power supply adjustment | −$1.77 |
| Regulatory charge | $3.96 |
| Service area lighting | $0.16 |
| Energy efficiency | −$0.40 |
| Customer assistance | −$1.28 |
Source: Austin Energy budget presentation, slide 15, and approved FY2027 tariff, pp.7–8; retrieved November 12, 2026. Workbook: BillCalc. The regulatory charge includes transmission and administration; the figure does not isolate a data center share.
Replacement, resilience and equipment prices matter beyond new demand. Berkeley Lab’s current research uses FERC Form 1, EIA and regulatory records to distinguish distribution, transmission and operating costs. It identifies aging equipment, hardening, supply constraints and wildfire mitigation among the drivers. Its wildfire comparisons mix scopes and sometimes approved and proposed spending, so this report does not convert them into a standardized national data center-versus-wildfire percentage. Our utility panel is nominal.24, 25
What changed in the 2026 election?
The ballot inventory records 47 November 3 measures across ten states, including 21 in Ohio, based on the jurisdictions and election records found through November 12. A prior secondary inventory reported 34 measures.
Election authorities published vote counts that could be checked for 36 measures. Another 11 entries still need an official count. Alhambra’s county report showed 19,022 votes for Measure DB and 3,647 against in its unofficial tally. North Berwick’s town clerk certified its 2,114 to 582 result on November 3. Los Angeles County results · North Berwick clerk return.
The commission table covers 15 seats in nine states. It includes election-authority counts for 14 races, with the Oklahoma candidate-level return still missing. The ballot review could identify no project-specific affected megawatts. A measure’s eligibility threshold describes which projects it covers.
The October UT/Texas Politics Project poll finds 58% of registered voters opposed to a nearby data center: 17% somewhat and 41% strongly opposed. August’s poll measured 57%. The one-point difference is within sampling uncertainty.26, 27
The energy secretary’s categorical “data centers do not raise bills” wording was not verified in a primary transcript. DOE’s July minutes record the narrower claim that growing-demand regions “generally maintained stronger price performance than regions with stagnant or declining demand.” That comparison does not identify each new project’s marginal cost or who bears it.28
What evidence would change the answer?
The most useful new evidence would connect energized demand to approved cost allocation and the bills customers pay. More announcements alone would not resolve the missing retail attribution.
A utility-level causal conclusion would become stronger with consistent annual data center MW and MWh, documented opening dates, reliable low-exposure comparisons and source-verified tariff changes. A household-dollar conclusion would additionally need class billing determinants, capacity allocations, procurement or hedge effects and the approved treatment of shared lines and plants. If those records show costs fully covered by new customers, or a measured shortfall charged to homes, the lookup should report that result and its exact denominator.
The next price update is due November 24, 2026, when EIA schedules its next Electric Power Monthly. Refresh natural-gas observations after November 30; election returns at a December 1 editorial checkpoint; ERCOT’s verification/community-impact material after December 10; and Texas transmission rules by December 31, 2026. Recheck the December PJM auction and any major rate order immediately, and rebuild the utility panel with the next annual EIA release.
How were the figures checked?
Recalculations from original EIA workbooks, Monitoring Analytics reports and Virginia SCC tables reproduce the headline figures at their displayed precision, and the donor assignments and matching sensitivity reproduce from the utility inputs.
EIA’s current annual files differ materially for 2018: 933,798 MWh of all-sector sales and $78.314 million of revenue. I found no cause in the reviewed footnotes; the Electric Power Annual is the canonical national history here. The monthly subtotals include small rounding differences.
The monitor’s reports contain a cumulative addition error and dollar-level display inconsistencies. They do not change the current or latest headline estimates. What can be traced is the PJM wholesale counterfactual and specific approved bill components. What cannot yet be traced is a national—or complete utility-by-utility—residential data center share.
Frequently asked questions
What did PJM find about data center demand?
PJM’s independent monitor estimates a $7.27 billion increase in wholesale capacity auction revenue for June 2026–May 2027. The effect on a household depends on its supplier and approved cost allocation.
How much have home electricity prices risen since 2024?
US residential revenue per kWh rose 11.2% between January–August 2024 and the same months of 2026, from 16.36 to 18.19 cents/kWh.
Are Ohio electric bills up more than 20%?
The statewide average account bill rose 20.5% between matching January–August periods in 2024 and 2026. The realized price per kWh rose 18.1%. Higher consumption explains part of the bill change.
Who pays for data center power lines?
Many tariffs charge large customers for dedicated connections and require minimum bills, security or exit payments. The approved allocation determines who pays for shared-network and generation costs.
How much new load has ERCOT approved to energize?
ERCOT’s September 2026 report recorded 9,456 MW of tracked large loads approved to energize. Its June tally of 474 GW measures interconnection requests at a different date and includes a different population.
Sources
- Monitoring Analytics. Analysis of the 2026/2027 RPM Base Residual Auction Part A. Document date: 2025-10-01; Revenue: Table9 printed p. .18/PDFp.19; cleared quantities: Table13 printed p. .20/PDFp.21. Retrieved 2026-11-12. ↩
- US EIA. EIA-861M monthly aggregate sales, revenue and customers. Document date: 2026-10-23; US-YTD monthly rows and Monthly-States; exact Excel row in US/state monthly CSVs. Retrieved 2026-11-12. ↩
- Monitoring Analytics (PJM independent market monitor). Analysis of the 2028/2029 RPM Base Residual Auction, Part A. Document date: 2026-10-30; Printed pp. 3-4, 13, 21, 24, 26; Tables 1, 2, 6, 11-17. Retrieved 2026-11-12. ↩
- PJM. 2028/2029 auction result. Document date: 2026-07-14; Auction quantities and cap. Retrieved 2026-11-12. ↩
- PJM. 2026/2027 auction result. Document date: 2025-07-22; 2026/27 clearing price; 2025/26 RTO, Dominion and BGE prices. Retrieved 2026-11-12. ↩
- Dominion Energy. 2025 Annual Report. Document date: 2026; Printed pp. 3, 5. Retrieved 2026-11-12. ↩
- Southern Company / Georgia Power. 2025 Annual Report. Document date: 2026-02; Georgia Power MD&A retail revenues: 2025 sales table and following paragraph. Retrieved 2026-11-12. ↩
- Watten, Bistline and Blanford. Have Data Centers Raised Your Electric Bill? Causal Evidence from the United States. Document date: 2026-06-18; Abstract and stated 2015-2024 scope. Retrieved 2026-11-12. ↩
- Virginia SCC. Status Report: Implementation of the Virginia Electric Utility Regulation Act. Document date: 2025-10-31; Printed pp. 4-7; current July 1 columns. Retrieved 2026-11-12. ↩
- Virginia SCC. Status Report: Implementation of the Virginia Electric Utility Regulation Act. Document date: 2026-10-30; Printed pp. 7-8, 12-15; current July 1 columns and footnotes. Retrieved 2026-11-12. ↩
- Exelon / PECO / ComEd. Quarterly report September30 2026. Document date: 2026-10; Note 2 Regulatory Matters; printed p. 54 and ComEd rate proceedings. Retrieved 2026-11-12. ↩
- Issuer or regulator identified in document. APS Q32026 Form10Q PinnacleWest. Document date: 2026-11; Note 3 Regulatory Matters 2025 rate case; Note 7 DPC. Retrieved 2026-11-12. ↩
- Duke Energy. Quarterly report September30 2026. Document date: 2026-11; Printedp60 NC fuel; regulatory matters DEC/DEP2023 and pending2025cases. Retrieved 2026-11-12. ↩
- Issuer or regulator identified in document. ERCOT Senate Committee presentation July29 2026. Document date: 2026-07-29; slide 6. Retrieved 2026-11-12. ↩
- Issuer or regulator identified in document. ERCOT Monthly Operational Overview September2026. Document date: 2026-10-16; slide 9. Retrieved 2026-11-12. ↩
- Issuer or regulator identified in document. ERCOT Batch Zero Update board presentation. Document date: 2026-09-11; slides 1, 3-6. Retrieved 2026-11-12. ↩
- Issuer or regulator identified in document. Texas SB6 enrolled act 89th legislature. Document date: 2025; PURA § 37.0561; Sections 6-7. Retrieved 2026-11-12. ↩
- Issuer or regulator identified in document. Official SOS full-text index of Oct2 adopted rules. Document date: 2026-10-02; lines 1390-1528; 51 TexReg 6931-6940. Retrieved 2026-11-12. ↩
- Issuer or regulator identified in document. Oncor current retail delivery tariff. Document date: 2026-10-04; printed pp. 67, 73, 77, 79-81, 98, 108. Retrieved 2026-11-12. ↩
- US EIA. Natural Gas Electric Power Price, monthly history. Document date: 2026-10-30; 2024, 2025 and 2026 rows; USD per thousand cubic feet. Retrieved 2026-11-12. ↩
- Issuer or regulator identified in document. Sempra Form8K Apr17 2026 Oncor final rate order. Document date: 2026-04-17; Item 8.01; PUCT docket 58306. Retrieved 2026-11-12. ↩
- Issuer or regulator identified in document. Austin Energy FY2026-2027 electric tariff. Document date: 2026-10-01; residential pp. 7-8; excess facilities p. 5; PSA p. 31; regulatory p. 36. Retrieved 2026-11-12. ↩
- Issuer or regulator identified in document. Austin Energy FY2027 budget commission presentation. Document date: 2026-07-20; slide 15 bill table; slides 7, 9 cost drivers. Retrieved 2026-11-12. ↩
- Lawrence Berkeley National Laboratory. Retail Electricity Price Trends and Drivers, July update. Document date: 2026-07; Printed slides 31-36, methods pp.4-6. Retrieved 2026-11-12. ↩
- Lawrence Berkeley National Laboratory. Electric Utility Distribution Costs: Trends, Drivers, and Impacts on Retail Prices. Document date: 2026-05; Research publication and linked methods. Retrieved 2026-11-12. ↩
- University of Texas at Austin. University of Texas / Texas Politics Project poll topline. Document date: 2026-10; p.50 Q40; p.1 methods. Retrieved 2026-11-12. ↩
- University of Texas at Austin. University of Texas / Texas Politics Project poll topline. Document date: 2026-08; p.44 Q41; p.1 methods. Retrieved 2026-11-12. ↩
- US Department of Energy. Secretary of Energy Advisory Board meeting minutes. Document date: 2026-07-20; Printed p.5, Secretary remarks. Retrieved 2026-11-12. ↩
Supporting material
- Excel model (XLSX file) Sourced inputs, live calculations and reported outputs.
- Source and model data (CSV collection) (ZIP file) Data tables, source references and calculation exports.
- Utility lookup 150 (CSV file) Download as CSV.
- Ballot results 2026 (CSV file) Download as CSV.
- Commission races 2026 (CSV file) Download as CSV.
- Priority rate case ledger (CSV file) Download as CSV.
- Source registry (CSV file) Download as CSV.