Texas business
What does a Texas grid battery earn?
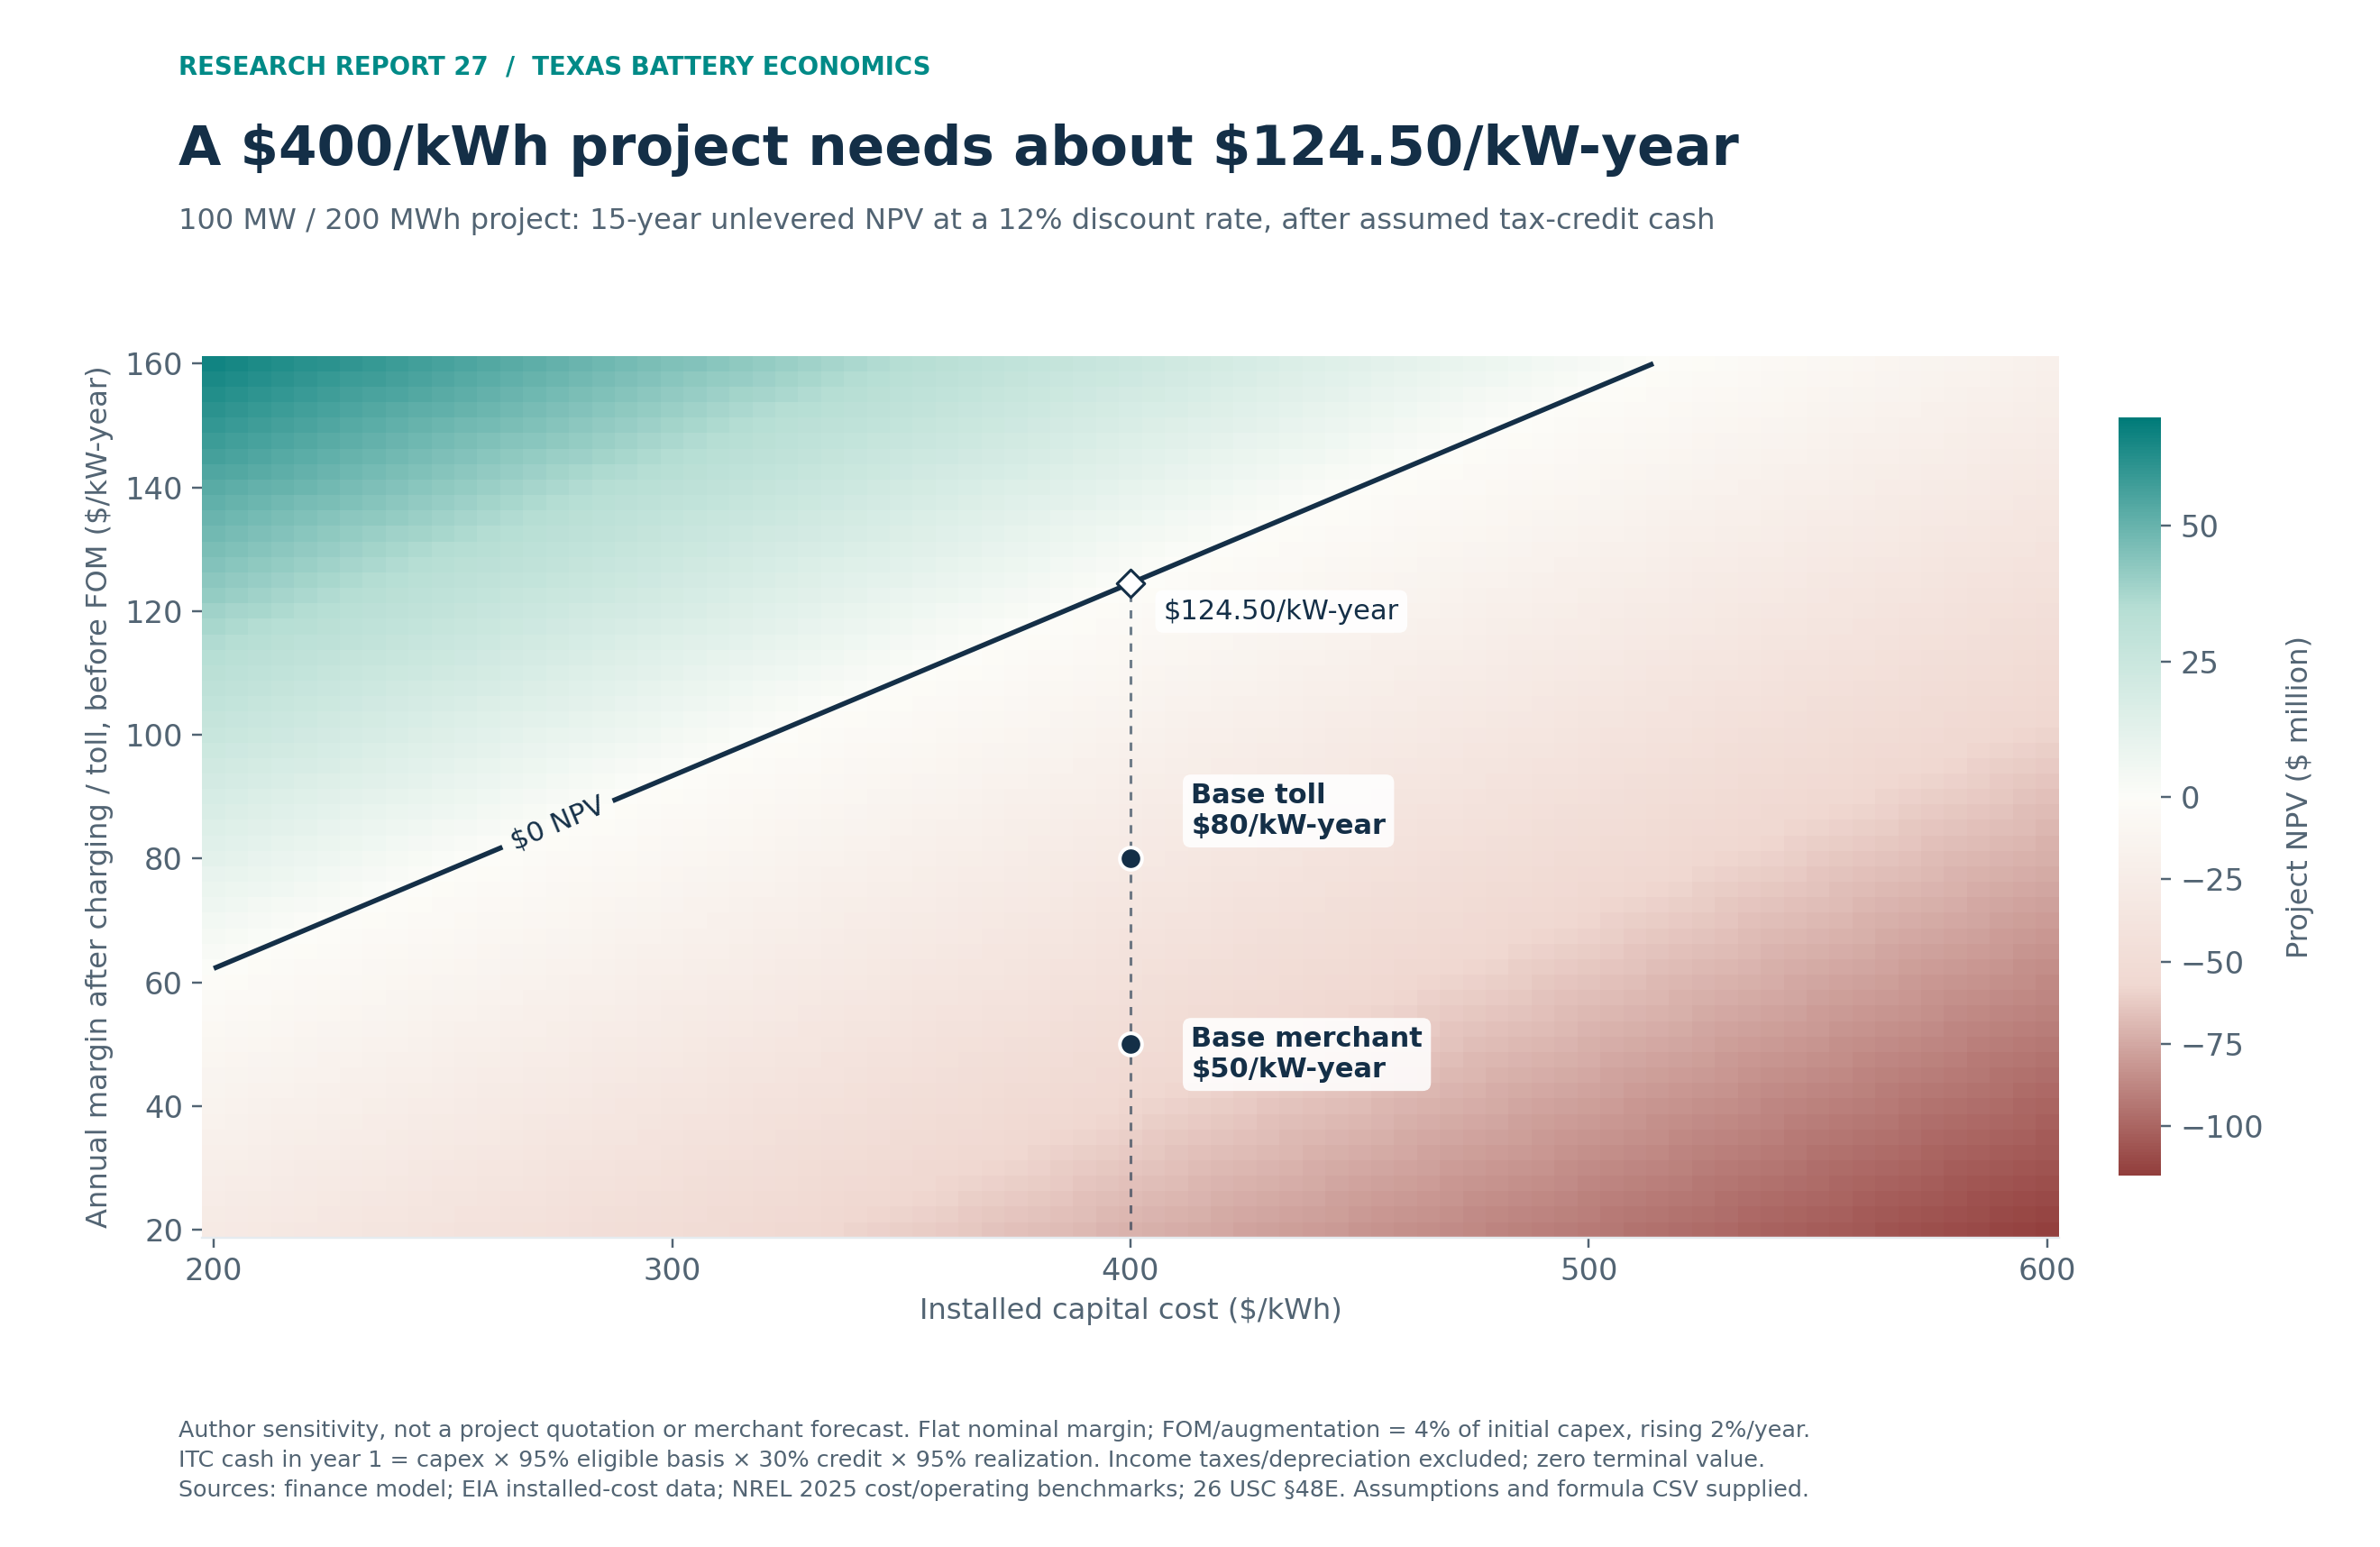
The 2026 two-hour energy model returned an annualized $23–31 per kW. At $400 per kWh of installed cost, the project needs $124.50 per kW-year to earn 12%.
A two-hour battery would have earned $23–31/kW-year from energy trading under a day-ahead forecasting rule using January–October 2026 prices at four ERCOT hubs. For a modeled 100 MW / 200 MWh battery, that is an annualized $2.3–3.1 million after charging energy and before operating costs, augmentation, financing and taxes. Giving the same model perfect foresight raises the estimate to $37–47/kW-year.prices
The disclosed-data reconstruction is weaker: the eligible two-hour cohort’s Q2 2026 energy-plus-reserve proxy annualizes to $19.21/kW, equivalent to about $1.92 million at 100 MW before owner expenses. The estimate combines energy valued from telemetry at the North hub with a reserve benchmark calculated from disclosed awards. It annualizes 91 days of activity using maximum observed operating limits as its capacity denominator.disclosures
For investment underwriting, this report tests $25/$50/$90 per kW-year of total merchant margin after charging and $500/$400/$300 per kWh of installed cost. The downside, base and upside cases use assumed merchant margins and installed costs. At the base $80 million capital cost, a $50/kW-year merchant margin produces only $1.8 million of first-year operating cash before debt and one-off tax-credit proceeds. Under the stated conservative loan test it supports no ten-year term debt and earns a −12.0% project and owner IRR over 15 years, including modeled tax-credit cash.
A full fixed-fee toll changes financeability more readily than profitability. At an assumed $80/kW-year fee, the same project supports approximately $30.8 million of debt, but its project IRR is only 1.3%, and borrowing at 7% pushes owner equity IRR to −5.7%. These are nominal returns before income tax, after investment-credit cash, with augmentation-inclusive operating expense. They are not after-tax investment returns.
The attractive case is a cheaper asset with stronger revenue. At $300/kWh and a $100/kW-year toll, modeled owner IRR reaches 19.7%. At $400/kWh, a flat annual margin or fee needs to reach approximately $124.50/kW-year to earn a 12% unlevered project return under the baseline assumptions. At an $80 fee, the corresponding maximum installed cost is approximately $257/kWh. Those thresholds make the diligence question concrete: what verified cost, contract, tax treatment or operating advantage closes the gap?
There is an important empirical limit. The accompanying files reconstruct disclosed day-ahead awards and a post-co-optimization reserve benchmark by battery, and calculate an explicitly labeled energy proxy. Calculating realized settlement revenue and owner profit would require more data. Historical nodal prices, settlement-meter prices and MWh, a reliable meter/bus crosswalk, and QSE-level allocations are the missing inputs. A leaderboard that silently substitutes hub prices and telemetry would imply more certainty than the evidence supports.
1. The premise holds, with an exception that matters
ERCOT’s independent market monitor reports that capacity-normalized storage revenue fell almost 37% in 2025, even as total fleet net revenue increased about 8%. Aggregate net energy revenue after charging rose 57%, while aggregate ancillary-service revenue fell more than 37%. More batteries shared a growing aggregate energy opportunity and a weakening reserve market. The monitor reports these changes alongside its revenue chart.imm
The latest price files extend that diagnosis into 2026, but “all reserves keep falling” is wrong. The following are independently calculated simple hourly averages for January–October, using the same calendar window in each year:
| Day-ahead service, $/MW/hour | 2024 | 2025 | 2026 |
|---|---|---|---|
| Regulation up | 6.684 | 2.964 | 2.058 |
| Regulation down | 3.850 | 1.577 | 1.321 |
| Responsive reserve | 6.405 | 2.789 | 1.571 |
| ERCOT contingency reserve, ECRS | 9.489 | 2.515 | 1.940 |
| Non-spinning reserve | 7.052 | 2.851 | 4.175 |
Non-spin is up about 46% against the comparable 2025 period. It remains below 2024. Each service has its own qualification, duration and operating requirements. These averages give each hour equal weight. ERCOT’s operational reports weight prices by awarded capacity.asprices
Supply has changed substantially. ERCOT’s October 2026 capacity workbook records approximately 22.07 GW of operational battery capacity and 42.46 GW of solar, compared with restated end-2024 totals of 10.01 GW and 29.34 GW. Those are increases of approximately 120% and 45%. “Operational” can include commissioning, so it is not interchangeable with a commercial-operation-only fleet or the monitor’s normalization denominator.capacity
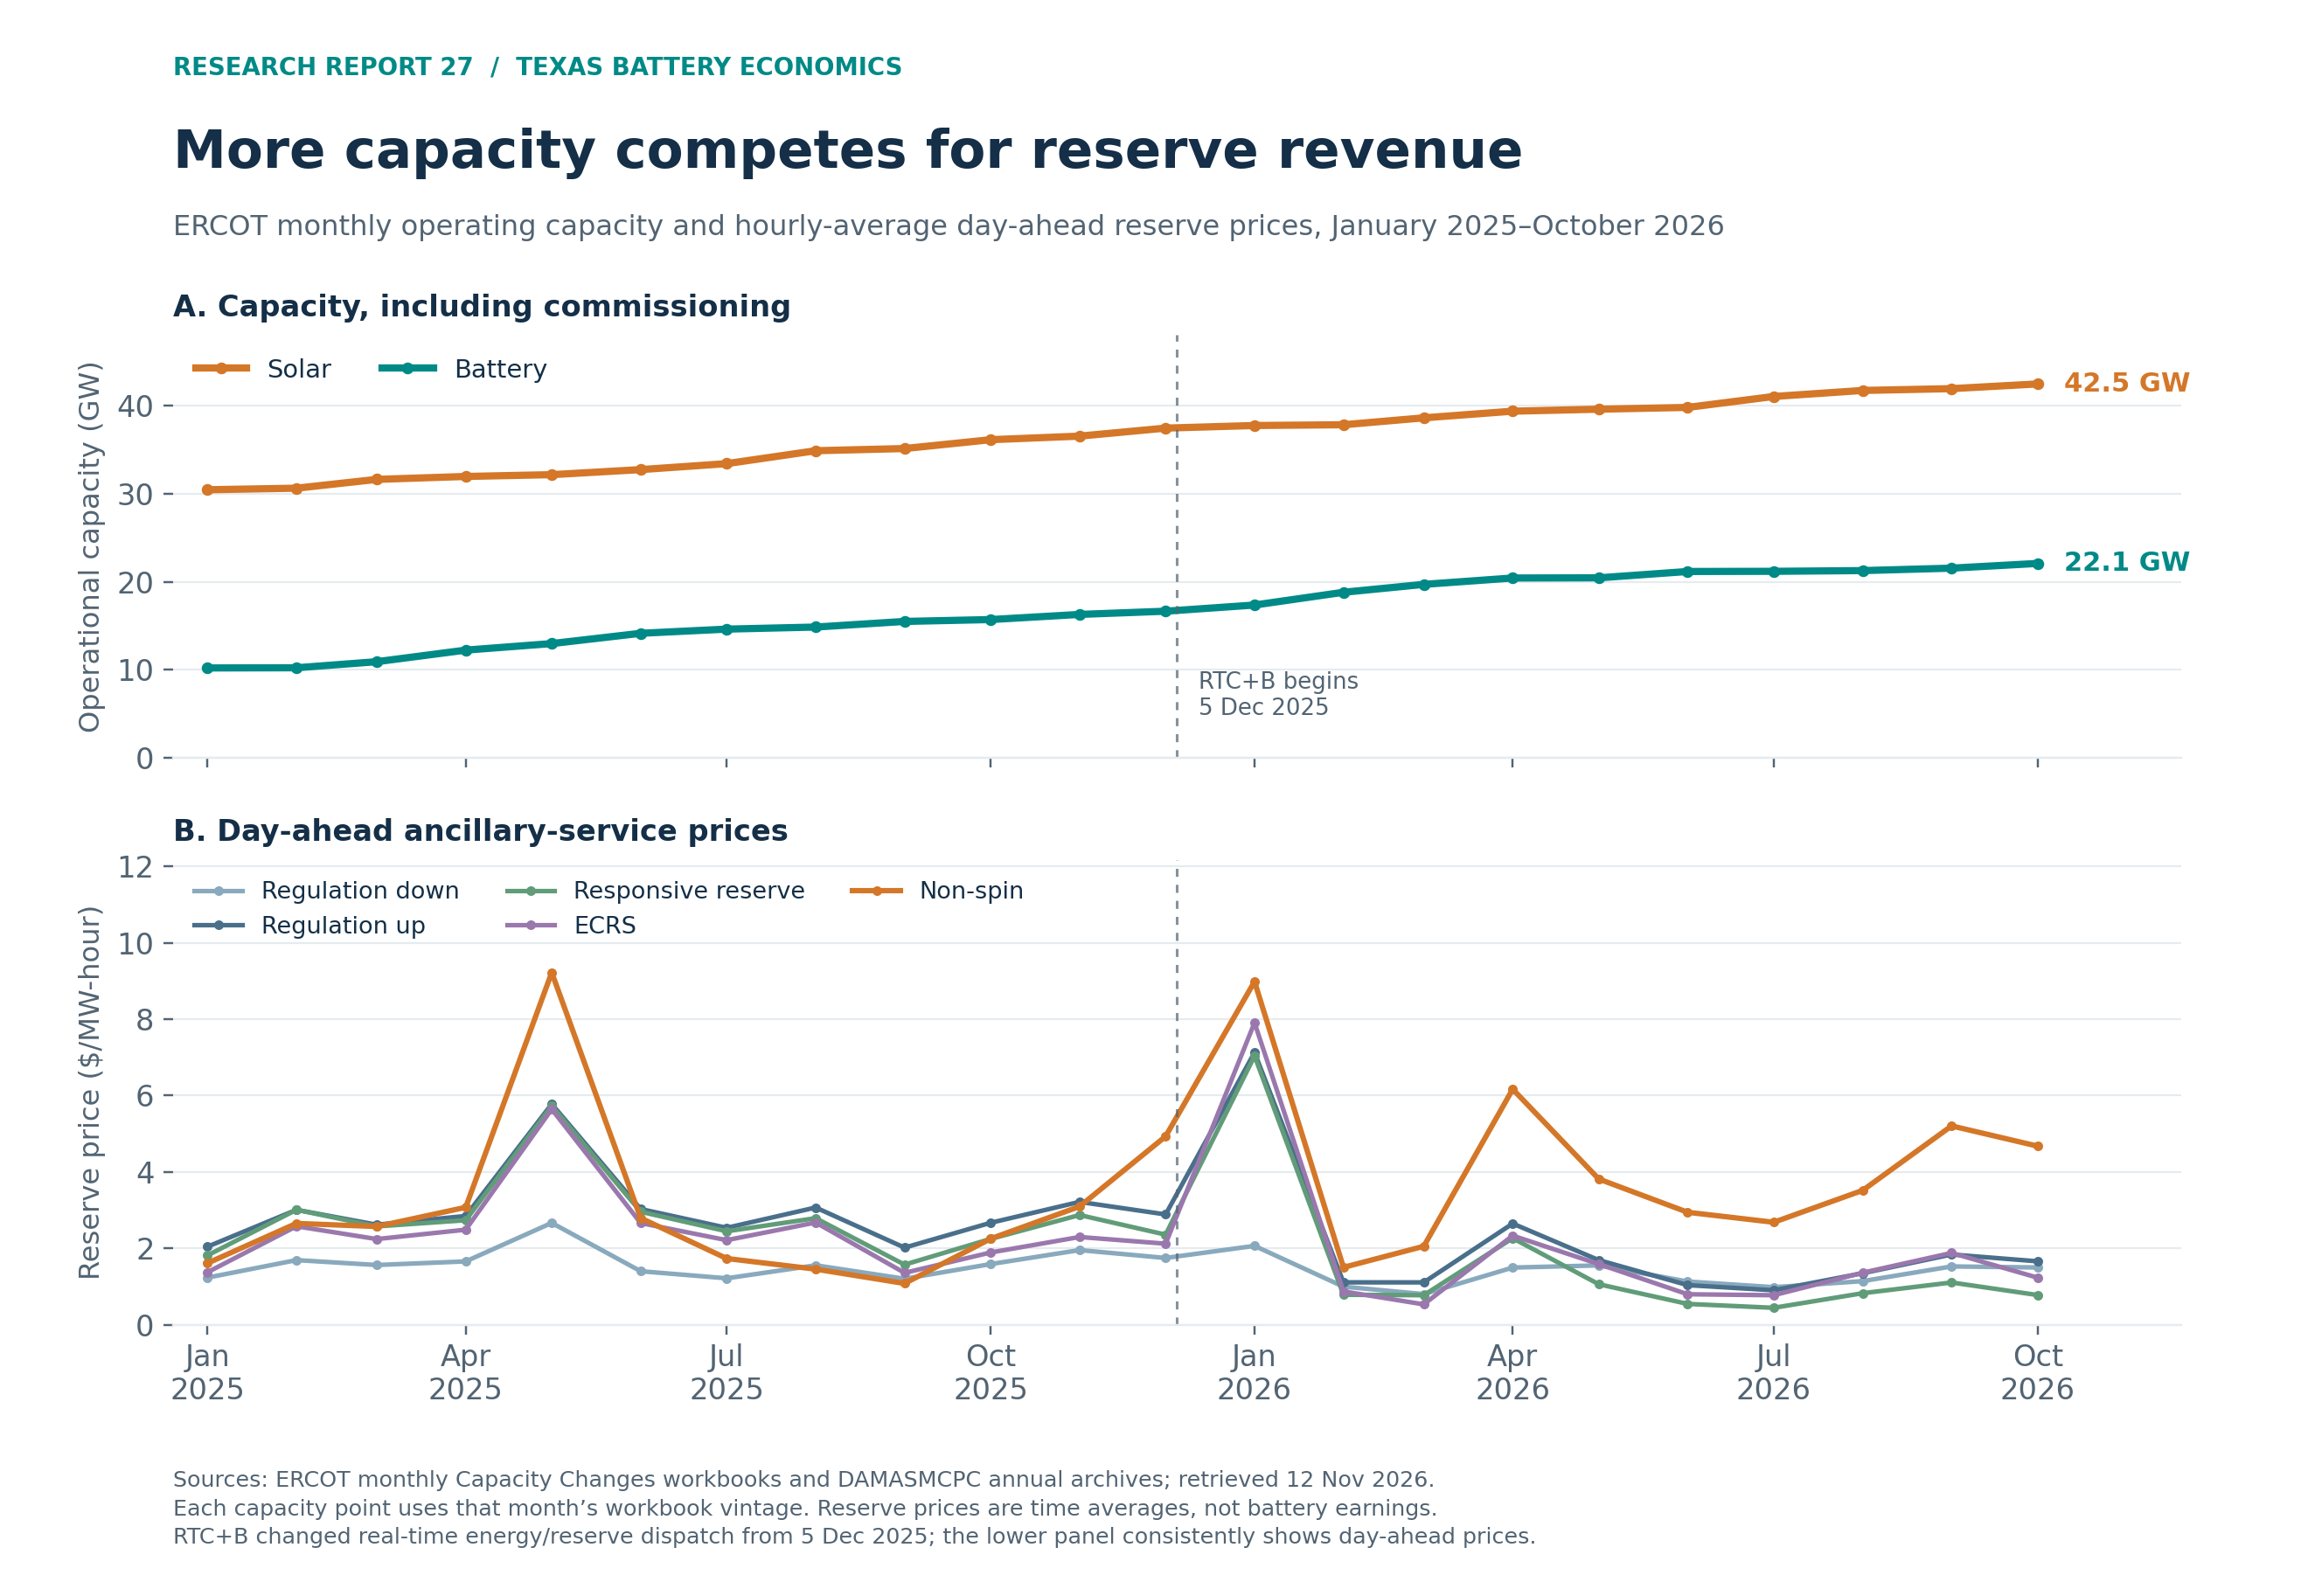
Solar can make charging cheaper and deepen the evening price ramp. Battery entry competes away part of the resulting spread and supplies reserve products that were formerly more scarce. These mechanisms operate together. More solar does not mechanically mean more earnings per battery, and a larger total storage-revenue pool does not imply a better return on each newly invested dollar.
2. The pipeline and its evidentiary boundaries
The research pipeline was specified before the bulk download: preserve source identifiers and hashes; normalize market time; distinguish the old and new settlement regimes; calculate resource components; run a constrained price backtest; then pass explicit revenue assumptions into the financing model. The workbook and CSVs provide the model inputs and calculated outputs.
| Dataset | Period and coverage | What it measures |
|---|---|---|
| Hub DAM and RT prices | January 2024–October 2026; four hubs; 99,356 joined hub-hours | Reproducible price-taking energy backtest |
| DAM reserve prices | Matched January–October windows, 2024–2026; full monthly extracts also supplied | Product-specific price changes |
| 60-day DAM battery disclosures | January–August 2026; 243 days, 1,858,396 resource-hours, 339 resource names | Disclosed nodal DA energy awards and five reserve cash-flow components |
| 60-day SCED battery disclosures | Complete second quarter of 2026, with prior-day midnight carry | Dispatch/telemetry, operating limits, state of charge and RT reserve awards |
| Owner and public-contract disclosures | Financial year ended March 2026; subsequent 2026 announcements | Independent operating and contracting checks |
| Financial model | Hypothetical 100 MW / 200 MWh project; 15 operating years | Conditional debt capacity and owner returns |
The annual price archives available on the research date extended through November 7. The backtest stops at October 31 to avoid presenting a partial month as complete. Sixty-day disclosure creates a different endpoint: the latest disclosed operating day was September 12. January–August is used for complete DAM months; April–June provides a complete quarter for the more computationally intensive SCED reconstruction.disclosures
Every raw disclosure has its operating date checked against its filename and contents. The manifests record the download URL, document ID, publication date, archive hash and original CSV-member hash. The download manifests point to the original ERCOT disclosure archives. The analysis used the DAM battery reports and 34 fields from the SCED battery reports. Offers describe submitted prices and limits. Awards and settlement rules determine the revenue calculation. No claim of a reconstructed optimal bidding strategy is made.
The hub backtest has no missing or duplicate price joins. It handles the 23-hour spring day and 25-hour autumn day explicitly. Its 16,560 daily strategy cases pass power, state-of-charge, cycle and non-simultaneity checks. The forecasting rule uses archived day-ahead prices to schedule dispatch. The timing of original publications and later corrections remains unverified.
What cannot be called observed earnings
ERCOT’s anonymous resource-node RT price listing covered seven days when checked, which does not overlap the 60-day disclosures. The historical Data Access Portal documents registration, subscription-key and identity-token requirements. No account was opened or access requested. The missing series is each resource’s 15-minute nodal RT settlement-point price for April–June 2026; hub and zone history is available.access
The post-reform metered-energy files also did not match the battery resource names directly. Across 92 SCED archives, there were zero exact matches between battery resource names and the metered resource codes. The energy calculation therefore uses forward-held SCED net-output telemetry and a common North hub price:
Energy proxy=disclosed DA energy cash flow +Σ_q(telemetered MWh_q-DA-awarded MWh_q)P^(RT)_(North, q).
Charging is negative net output and is included in this proxy. The day-ahead leg uses its disclosed node price. The real-time leg uses the North hub price. Exact physical battery settlement also uses settlement-meter prices derived from base-point-weighted SCED bus prices under Protocol §6.6.3.1; the DA closeout uses RT settlement-point prices. Thus obtaining nodal prices alone would not repair the missing meter/bus mapping and settlement allocation. Congestion, meter corrections, bilateral trades and fees can all change owner cash. The proxy can identify resources for further review.protocols
3. What the battery disclosures show
The final reconstruction covers 91 Q2 operating days, 331 resource names and 980 resource-months. Its matched-quarter comparison covers 237 resources with 15,372 MW of maximum-HSL capacity, complete records and reported positive capability at the quarter’s start. Eight resource-days with source gaps are flagged and excluded from complete-period comparisons. Source timestamp counts reconcile to the independent SCED price archive.disclosures
| Eligible disclosed-data cohort | Resources | HSL capacity, MW | Reserve benchmark, annualized $/kW | Energy proxy, annualized $/kW | Combined proxy, annualized $/kW |
|---|---|---|---|---|---|
| April, all durations | 270 | 16,598 | 5.99 | 24.95 | 30.94 |
| May, all durations | 283 | 17,943 | 4.55 | 9.83 | 14.39 |
| June, all durations | 245 | 16,344 | 2.67 | 6.85 | 9.52 |
| Q2 matched cohort, all durations | 237 | 15,372 | 4.40 | 14.04 | 18.44 |
| Q2 one-hour proxy | 71 | 2,132 | 4.78 | 7.65 | 12.43 |
| Q2 two-hour proxy | 128 | 11,381 | 4.35 | 14.87 | 19.21 |
The quarter cohort’s calculated cash is $16.85 million from the reserve benchmark and $53.81 million from the energy proxy. Monthly cohorts change, so the quarter row is calculated directly from its own eligible resources; it is not an average of the three monthly rows. The decline in the monthly proxies is material before operating expense, although changing cohorts prevent attributing all of it to seasonality. It also makes the financial model’s $50 merchant base a more favorable underwriting assumption than these recent public benchmarks, rather than an estimated fleet mean.
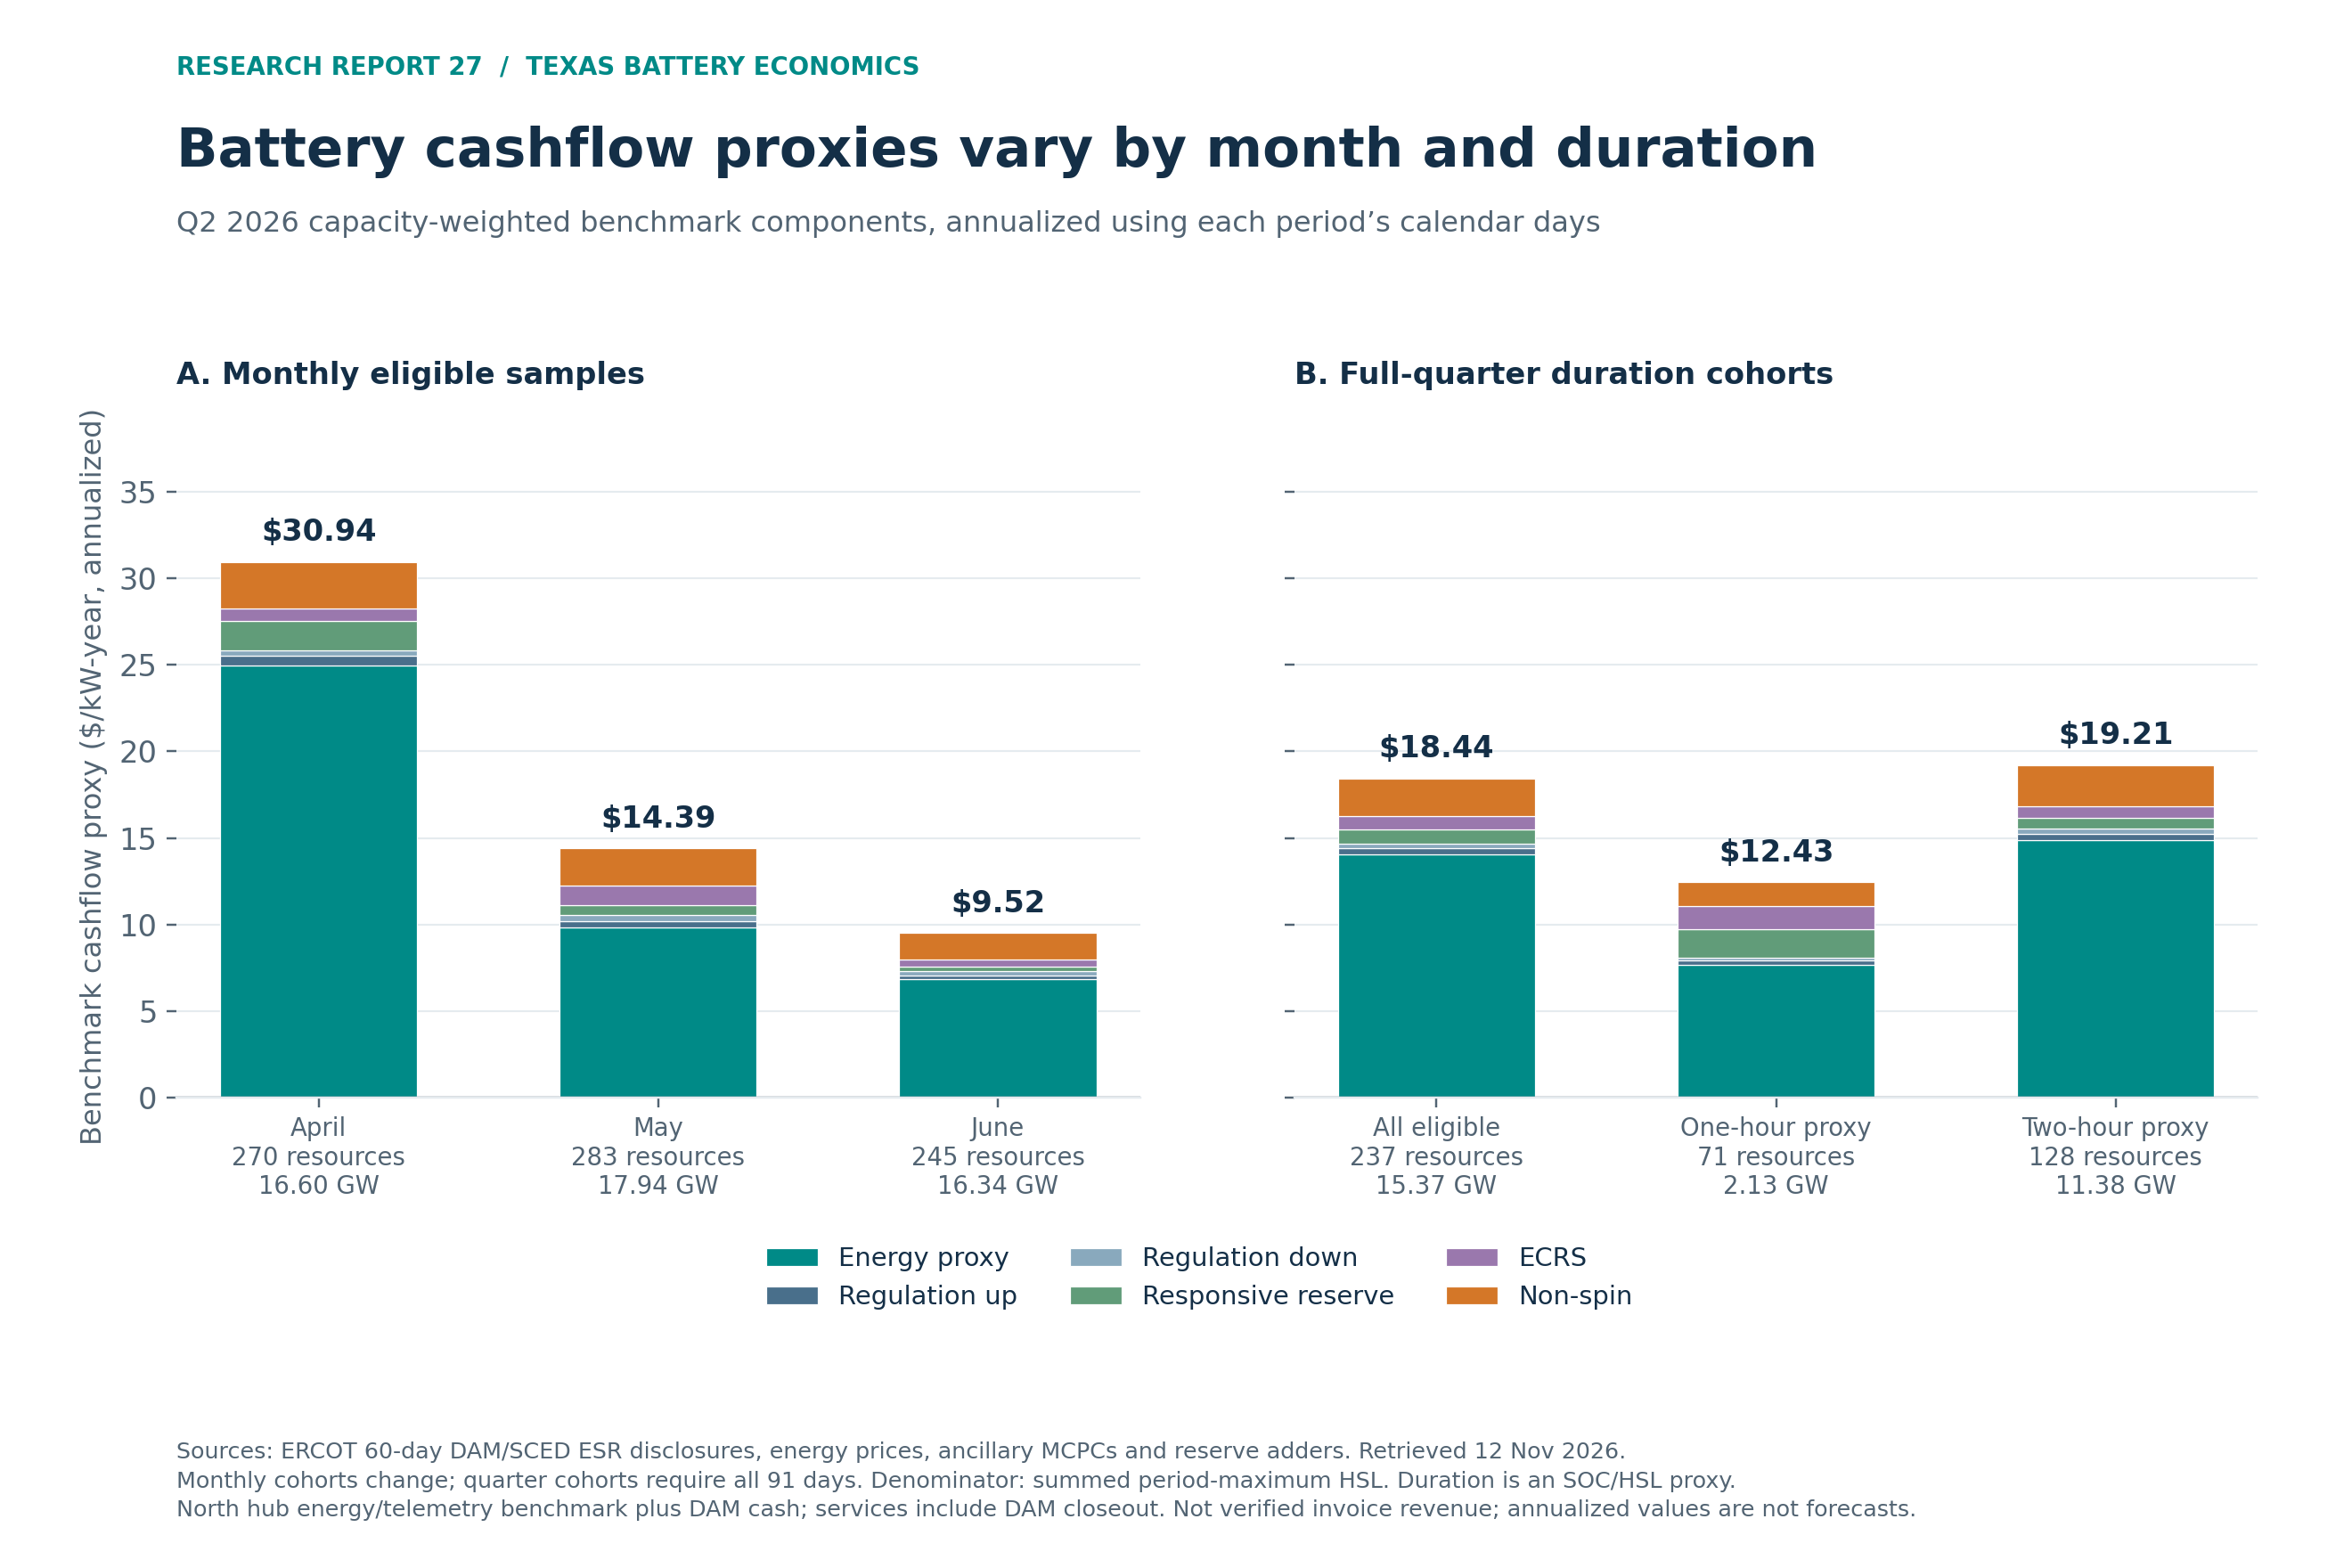
The raw files provide each resource’s monthly DA energy cash, regulation-up, regulation-down, responsive-reserve, ECRS and non-spin components. For Q2 they also provide RT reserve gross value, DA closeout and the energy proxy. The CSVs label award components and the modeled net benchmark.
The offer curves show the prices at which resources offered to sell. Across 338,301 qualifying Q2 resource-hours, at least 84.42% of the represented positive-output offer range, weighted by incremental MW and submission hour, lay between price points above $100/MWh. Another 7.98% crossed that analyst-selected threshold and was left unallocated. Charging ranges and zero-width steps were excluded; quantities were capped at reported HSL. The denominator covers the positive-output range represented in submitted offers. These curves also include reserve offers. The calculation describes the price points in submitted offers.offers
Within the 128-resource two-hour proxy cohort, the largest Q2 combined run rates are AVIL_ESS_ESR1, $34.79/kW-year; CNLY_ESS_ESR1, $33.18; and TV_ESR1, $31.14. The smallest are VERT_ESS_ESR1, −$1.26; SOLC_SLR_ESR1, −$0.92; and SOLC_SLR_ESR2, −$0.86. These names identify rows for investigation. Negative hub/telemetry proxies do not demonstrate owner losses, and the ranking cannot distinguish site basis, commissioning, missing commercial positions or operating quality.
A historical best/worst-quarter ranking of total realized fleet earnings remains unavailable. The exact gaps are physical settlement-meter inputs, QSE allocations and comparable resource histories outside Q2. A narrower comparison is available: among 198 resources matched across Q1 and Q2, DA reserve-award cash alone annualizes to $7.20/kW in Q1 versus $4.43 in Q2. Q1 is the larger of these two disclosed-position quarters; the comparison omits RT rebalancing and energy and is not a total-earnings ranking. The longer hub benchmark’s best and worst quarters are reported below.
Resource-month outputs report both calculated benchmark cash flows during the month and an annualized rate. Q2 proxy annualization multiplies period cash per kW by 365/calendar days. The DAM-award files use 8,760/market hours, preserving daylight-saving differences. Neither forecasts the rest of the year. Fleet rates are weighted by capacity.
The denominator is maximum observed high sustained limit, or HSL, which approximates installed AC nameplate capacity. Duration is estimated from the observed maximum-minus-minimum state-of-charge limits divided by that HSL. The one-hour cohort uses 0.75–1.25 hours; the two-hour cohort uses 1.5–2.5 hours. The data labels other durations individually. Comparisons require complete records, positive finite HSL and evidence of capability at the period’s start. COD is unverified; this screen also excludes some first-day outages. A registration with zero operating capacity is not assigned an infinite return.
The CSV columns give these definitions. Augmentation, commissioning, outages, changing submitted limits and differences between usable and nameplate energy can alter cohort membership. A verified asset registry would improve the denominator; the present classifications are estimates.
Gore Street’s reported Texas revenue
Gore Street’s FY2026 annual report shows £2.036 million of Texas revenue on 94.4 MW average operational capacity, approximately £21.6/kW-year. Its Texas revenue mix was roughly 12% ancillary services, 78% wholesale trading and 10% other. Its portfolio and April 2025–March 2026 reporting window differ from this study’s two-hour reference battery.owner
The company reports Texas revenue. Its filing leaves charging costs for Texas unverified. The annual report deducts revenue-related costs elsewhere including energy costs and route-to-market fees; any netting within wholesale revenue and the Texas charging allocation are unresolved. Capacity footnotes weight partial-year operations and ownership. This report neither assumes an exchange rate nor forces the owner number to equal the backtest.
The newer September 15 update reports £391,000 of Texas revenue and £1.71/MW-hour for April–June 2026, versus £2.68/MW-hour a year earlier. That is a period-matched independent check on weak operating conditions, with the same unresolved cost boundary.ownerq2
4. What a transparent energy strategy would have earned
Both backtests use one MW of AC power and either one or two MWh of usable discharge energy. Round-trip efficiency is 85%; there is at most one discharge-equivalent cycle per day; opening and closing daily state of charge are zero. The battery cannot charge and discharge simultaneously. The model chooses hourly power and settles it against the arithmetic average of that hour’s four RT prices.prices, atb
Perfect foresight chooses dispatch knowing that day’s eventual RT prices. It is an upper bound within this hourly, daily-reset, cycle-limited model. It is not an upper bound on every possible five-minute, overnight or ancillary-service strategy.
The day-ahead rule solves the same dispatch problem using DAM prices as the forecast, then executes that schedule at RT prices. It places no modeled financial position in DAM. This isolates a plausible information restriction and makes forecasting error visible. Ties in day-ahead prices can produce schedules with the same forecast margin and slightly different real-time margins.
| Two-hour battery, $/kW | 2024 full modeled year | 2025 full modeled year | 2026 Jan–Oct rule, annualized | 2026 Jan–Oct perfect foresight, annualized |
|---|---|---|---|---|
| Houston | 45.32 | 30.82 | 23.28 | 36.76 |
| North | 47.43 | 34.89 | 29.76 | 45.48 |
| South | 46.54 | 31.82 | 24.21 | 36.91 |
| West | 53.92 | 38.22 | 31.22 | 47.11 |
First two columns use the day-ahead rule. All values are energy margin after charging, before O&M, degradation/augmentation, fees and tax. January–October 2026 contains 304 days; its run rate is modeled margin × 365/304.
The North hub forecast gap is approximately $15.72/kW-year, or $1.57 million when scaled to 100 MW. That gap measures the benefit of perfect foresight in this model. Linear scaling also assumes the project does not move prices or encounter a different node basis.
The monthly path matters as much as the annualized figure:
| North hub, two hours, 2026 | Rule: $/kW during month | Perfect foresight: $/kW during month |
|---|---|---|
| January | 2.06 | 7.00 |
| February | 1.77 | 2.36 |
| March | 2.13 | 3.47 |
| April | 4.03 | 5.59 |
| May | 1.73 | 2.23 |
| June | 1.18 | 1.85 |
| July | 1.73 | 2.18 |
| August | 3.84 | 4.91 |
| September | 3.73 | 4.76 |
| October | 2.58 | 3.53 |
| January–October total | 24.79 | 37.88 |
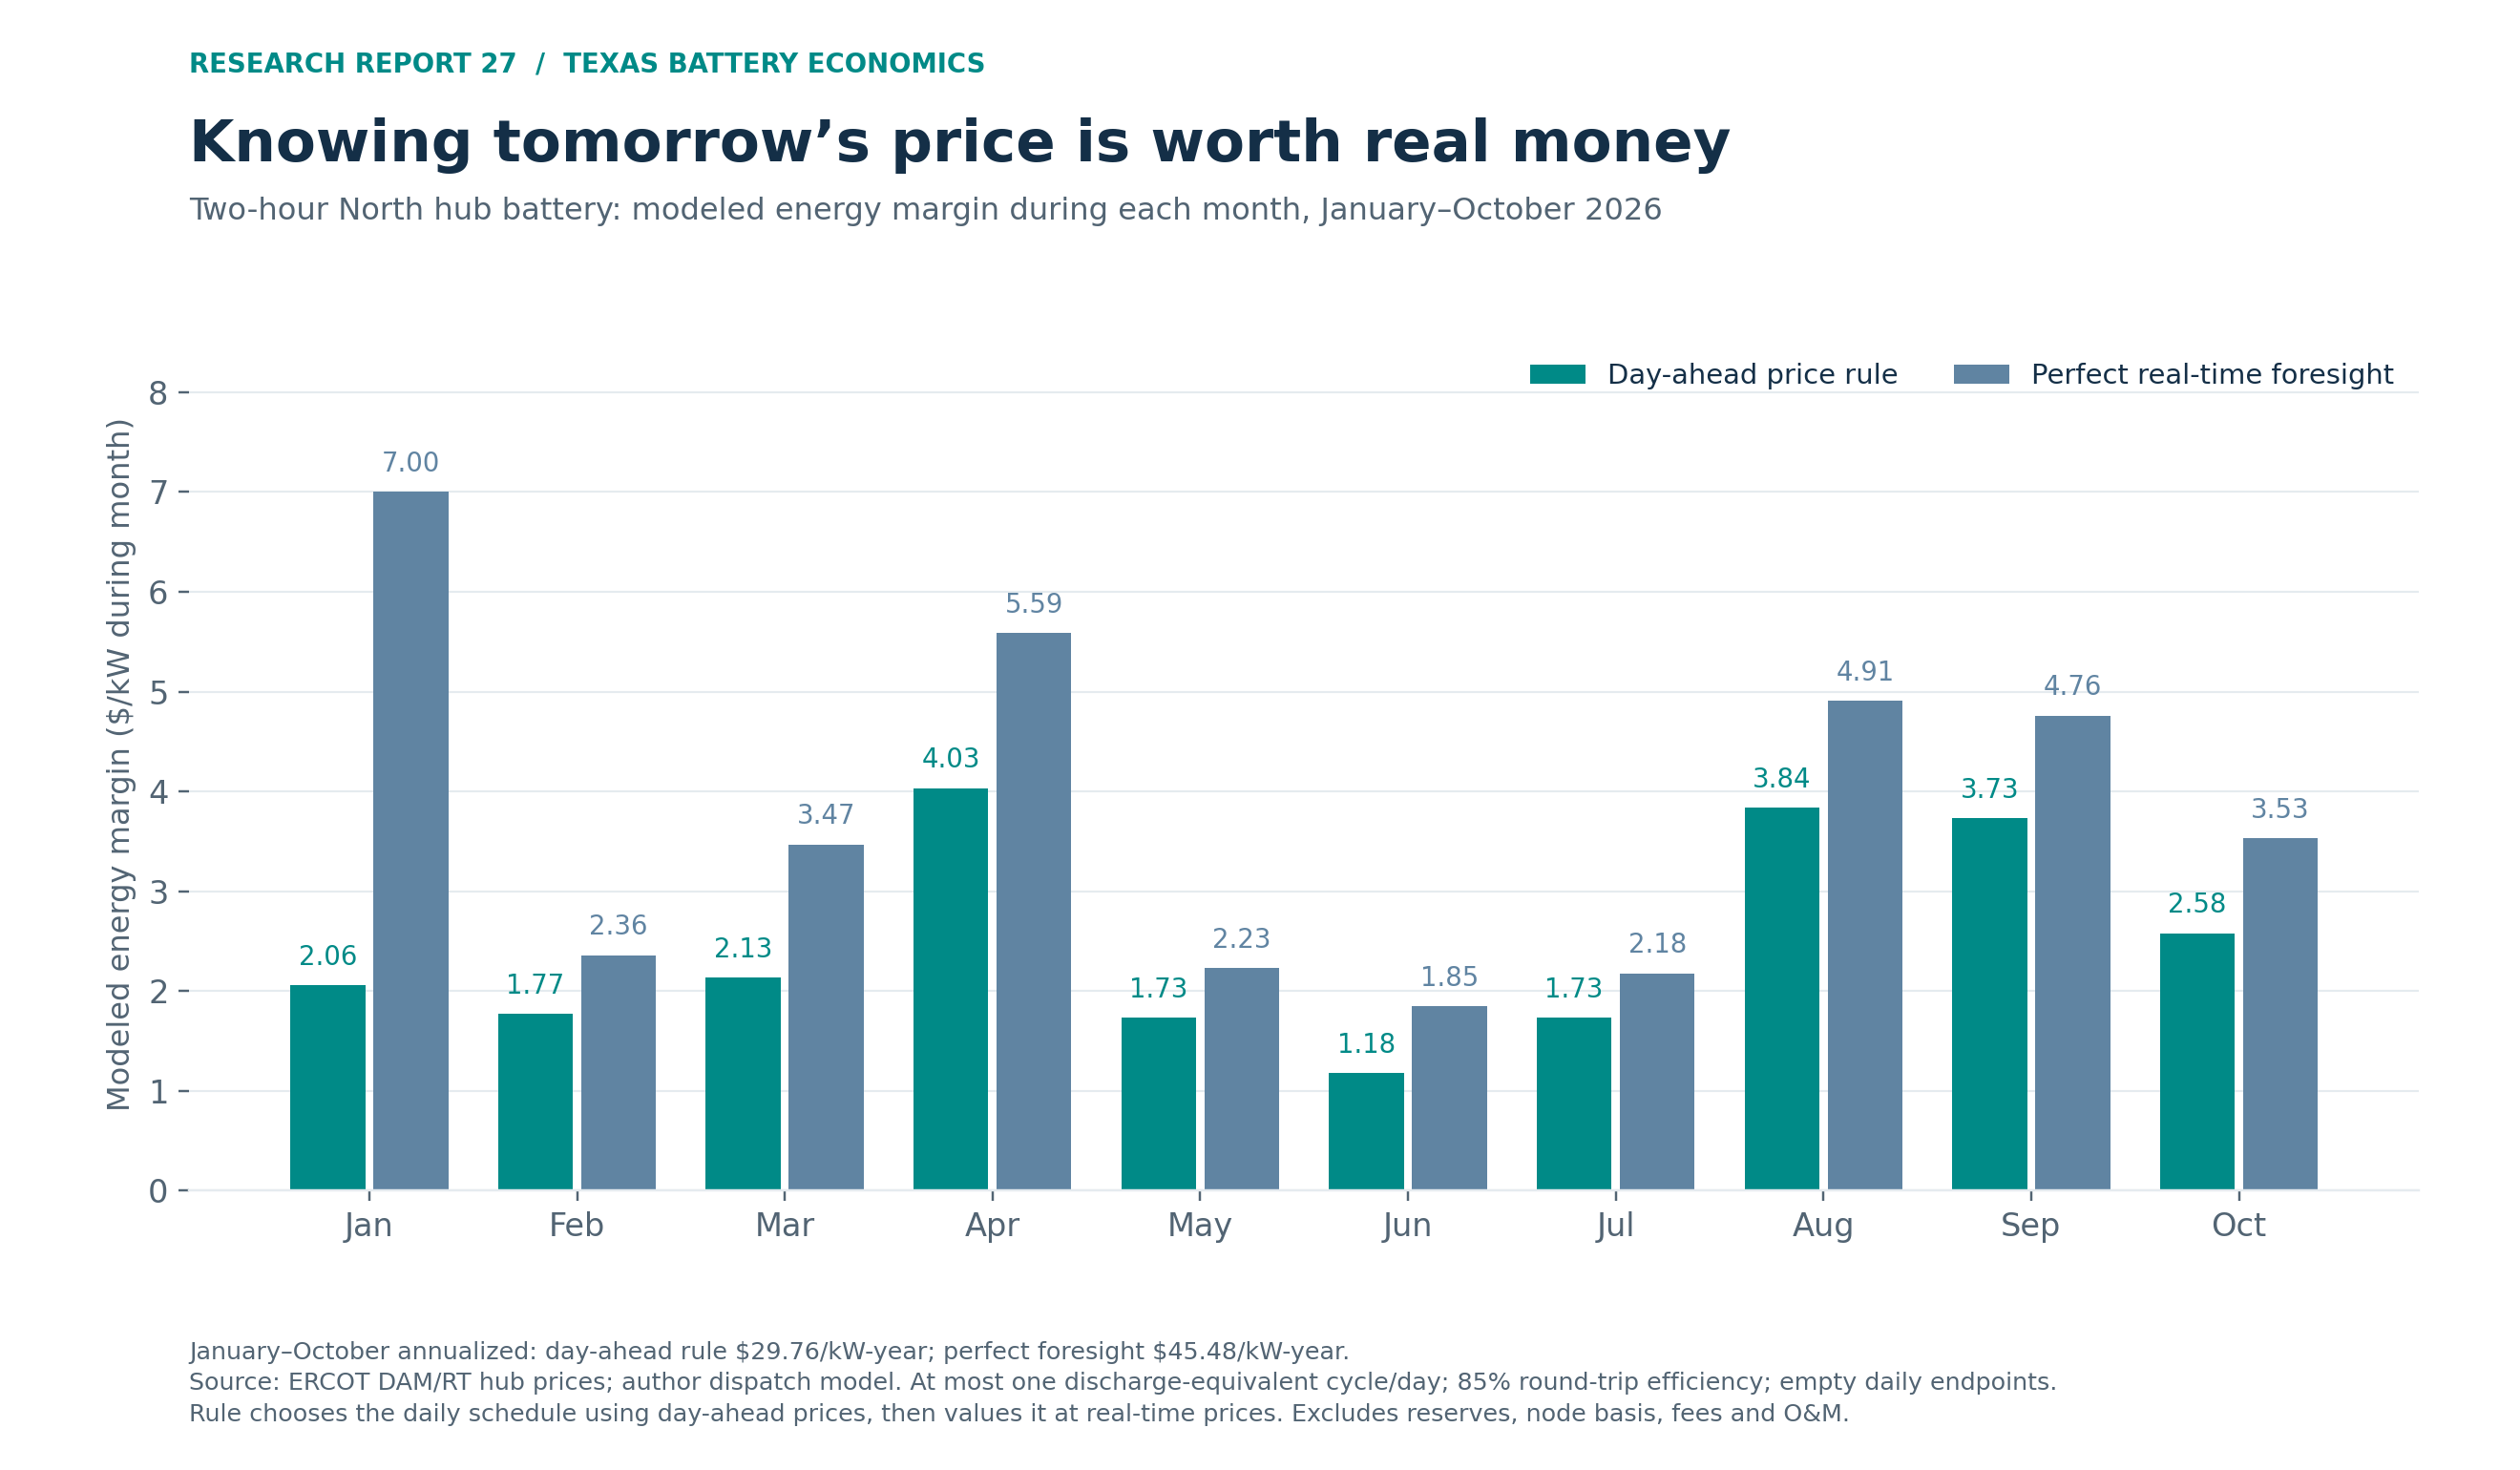
Across complete quarters in 2024–2026, this North hub benchmark has its best rule-based quarter in Q2 2024, $17.24/kW, and its worst in Q1 2026, $5.96/kW. These figures use North hub prices. Fourth-quarter 2026 is incomplete and excluded. Multiplying the best quarter by four would materially overstate the representative annual result.
On September 2, 2026, ERCOT identified errors in real-time prices for affected resource meters from midnight to 1:22 p.m. ERCOT could not determine the broader market impact. The backtest uses the published hub prices, whose exposure to the incident remains unverified.operations
One hour versus two hours
Under the same 2026 day-ahead rule, one-hour annualized energy margin ranges from $11.53 to $15.57/kW, versus $23.28 to $31.22/kW for two hours. In North, the comparison is $14.82 versus $29.76. The extra hour therefore adds about $14.94/kW-year, or $1.49 million at 100 MW, in this particular year-to-date replay.
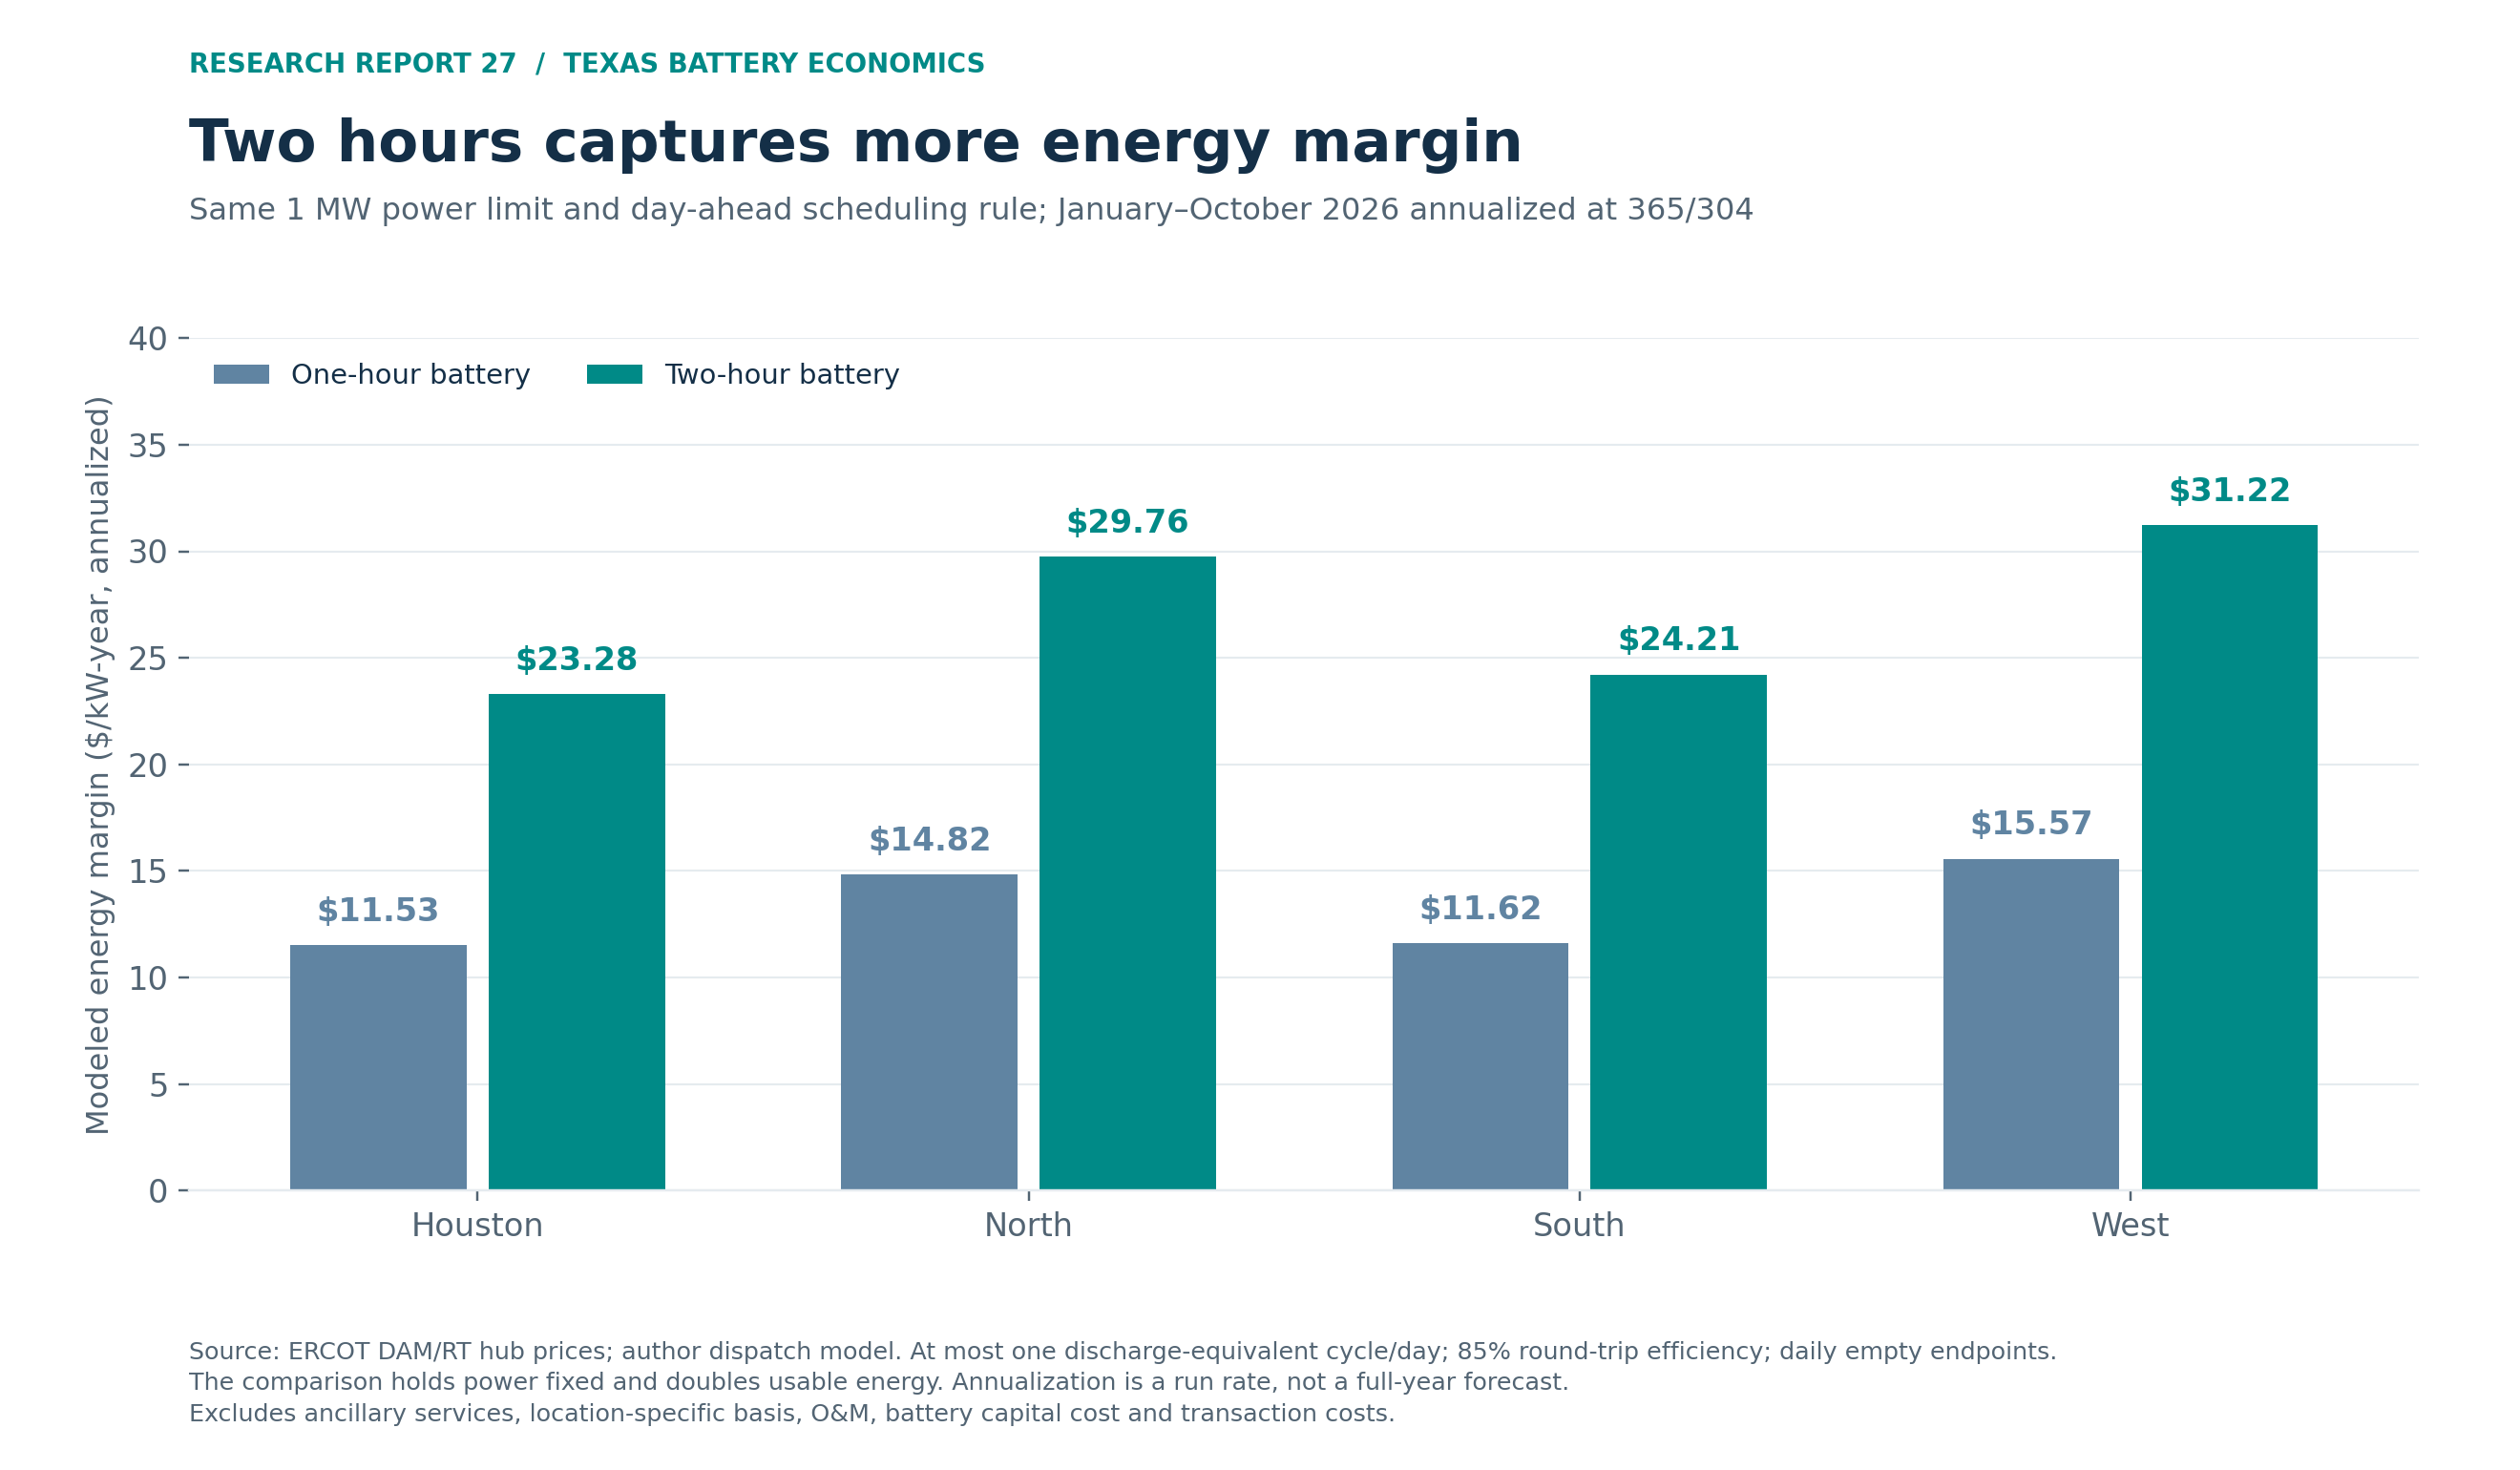
That does not make the second hour free. It needs additional cells, space, maintenance and eventual augmentation. The extra MWh has its own costs and earnings. Some power-related costs are shared. One should not halve the two-hour cost assumptions as if power-related costs scaled perfectly with duration. Nor should a one-hour asset’s reserve-heavy historical return be extrapolated into a market in which reserve prices have already changed.
5. December 2025 changed the settlement calculation
ERCOT introduced real-time energy and ancillary-service co-optimization with the battery reform on December 5, 2025. The system now considers energy, reserve awards and battery state of charge together in real time. This changes both the operating opportunity and how a revenue analyst should combine the DA and RT legs.rtc
For a reserve product, the disclosed-awards benchmark is:
AS benchmark=DA award cash +RT gross award value -DA position’s RT closeout.
The DA cash is awarded MW multiplied by the hourly DA market-clearing price. The closeout uses that DA quantity and the published 15-minute RT price. RT gross value uses time-weighted awarded MW and the resource’s award-weighted SCED price, including the reliability deployment price adder. The protocol weights use a 0.001 MW floor. This matters when awards and prices move within the same settlement interval.protocols
Two tempting shortcuts fail. Adding full DA revenue to full RT revenue counts the DA position twice. Multiplying average awards by average SCED prices loses their covariance. The calculation implements the relevant April and June 2026 protocol equations, including prior-day carry at midnight. An independent reconstruction of 3,840 service-quarterhours agrees with published 15-minute prices to within $0.005/MW/hour, consistent with cent rounding.
Published 15-minute RT reserve prices include the deployment adder. Calculate it from the SCED price and adders archives when starting from SCED observations. Adding it twice would create fictitious income. Similarly, scarcity already reflected in the post-reform energy price is not a second revenue stream to stack on top of settlement-point prices.
The reform also does not justify adding this report’s full-use arbitrage backtest to full-use reserve income. An upward reserve award consumes discharge capability and stored energy availability; charging, state of charge and qualification constrain simultaneous participation. The financial cases use one total after-charging margin. They do not manufacture a revenue stack by summing mutually incompatible maxima.
A current policy signal deserves monitoring. ERCOT’s biennial report posted November 11 says a model error identified in July had understated 2026 ECRS and non-spin requirements; corrected modeling informs proposed 2027 procurement. From the December 5 cutover through September 30, 2026, 2.03% of SCED intervals cleared below the applicable ancillary-service plan for non-spin, 0.12% for ECRS and 0.03% for responsive reserve. Revised procurement could change the result, but it is not a contracted cash flow.ordc
6. Capital cost, aging and the tax credit
National cost benchmarks and a Texas project
EIA’s latest installed-cost table covers generators placed in service in 2024, released in July 2026. It reports a national battery average of approximately $1,469/kW. Its source workbook aggregates 170 plants and 11,099 MW. Duration is mixed; dividing that figure by two and calling the result a current Texas two-hour installed cost would be unjustified.eia
NREL’s 2025 cost update provides a duration relationship in 2024 dollars:
Installed $/kW=240.8 × duration in hours+379.16.
At two hours that implies $860.76/kW, or $430.38/kWh—approximately $86.1 million for the hypothetical battery. This is a modeled national benchmark. The study was prepared before later 2025 tariff changes, and its four-hour projection table cannot simply be relabeled as two-hour pricing.nrel
A Texas project gives a mixed-duration comparison. Eolian’s October 2025 Padua announcement specifies more than $700 million of total private investment for the full 400 MW / 1.8 GWh complex. That implies more than $389/kWh, but combines one approximately two-hour phase with two approximately five-hour phases. It is neither an audited final installed cost nor a clean two-hour comparator. The $463 million financing is not the project-cost numerator.eolian
The financial model therefore uses rounded $300–500/kWh scenarios, with $400 central. That range is an analyst stress test around the available cost evidence. An executable Texas EPC quote, cell warranty, network-upgrade obligation, land terms, insurance quotation and construction schedule remain missing. The model treats its cost input as an all-in allowance; it does not claim an independently sourced interconnection bill of zero.
The project’s upgrade obligations and energization schedule require site-specific interconnection records. A sponsor financing announcement also does not solve this gap: total facilities can combine construction debt, tax-credit bridges and multiple assets. Dividing that headline financing amount by MWh can create a false installed-cost estimate.
Degradation must be paid for once
The baseline uses the 2025 Annual Technology Baseline’s 4% of initial capital cost per year fixed O&M convention, including augmentation that maintains rated capacity over 15 years, with approximately one cycle per day and 85% efficiency.atb At $80 million, first-year O&M and augmentation are $3.2 million, or $32/kW-year; the model escalates that amount by an assumed 2% annually.
This is a life-cycle cost convention. It is substantially broader than a narrow service-contract fee. Because it maintains capacity through augmentation, the model does not also impose a second annual capacity-fade haircut or a full battery replacement in year ten. Doing both without changing the maintenance assumption would double count aging.
Conversely, replacing 4% with a cheap operating-contract quote does not prove the project can maintain 200 MWh. A lower-cost case requires an auditable augmentation schedule: warranted usable energy at the meter, temperature and cycling limits, expected cell additions, inverter work, downtime and the allocation of performance penalties. No project-specific replacement quotation or degradation curve was available, so none is invented.
Current credit law is conditional
Current Section 48E provides a 6% base storage investment credit and a 30% rate when the prevailing-wage and apprenticeship requirements are met. Energy-community and domestic-content bonuses each have their own eligibility rules; none is assumed. Storage is expressly excepted from the accelerated wind/solar termination provision. Restrictions on prohibited foreign entities and material assistance can nevertheless affect eligibility for projects beginning construction after 2025.tax
IRS Notice 2026-15 addresses the material-assistance framework. Passing that test and earning the domestic-content bonus are different questions. Eligibility depends on the project’s qualifying evidence.irs
The modeled 30% face credit is applied to an assumed 95% eligible basis, then realized at an assumed 95% of face value, at the end of operating year one. Effective cash is therefore 27.075% of total capital cost, or $21.66 million in the base case. The eligible share and credit-sale price are model assumptions.
7. Merchant debt, contracted debt and owner return
The model calculates operating cash and debt service. Merchant margin means energy plus services after charging costs. A full toll means the owner receives the specified fee, while the offtaker receives market proceeds and pays charging energy. That charging allocation is a model assumption; the public Austin documents do not disclose the complete executed contract.
Austin Energy announced a signed 200 MW / 400 MWh Jupiter Power agreement in October 2026, targeting 2030 operation. Austin City Council approved authorization on July 23, 2026, for up to $16 million annually for up to 20 years, subject to future budget funding. At the full 200 MW that is an authorized ceiling of $80/kW-year. The signed deal’s price remains undisclosed.austin
The earlier 100 MW deal received authorization for up to $14.4 million per year. City staff later identified it as a four-hour battery. The newer authorization covers a two-hour battery, and the executed fees for both deals remain undisclosed.austin2025
Energy Vault’s Cross Trails loan shows how lenders handled coverage shortfalls. Energy Vault’s June 2026 10-Q records a $17.8 million originally funded Cross Trails term facility, at SOFR plus 6%, or 9.6% at June 30, maturing in July 2032. Lenders waived March and June coverage-ratio noncompliance using $1.2 million of sponsor equity and a credit for anticipated insurance proceeds. The amendment prevented default or acceleration. The filing describes how the sponsor supported the cure. The cause of the coverage shortfall remains unverified.cross
Decisive assumptions
| Input | Merchant | Full fixed-fee toll |
|---|---|---|
| Base annual margin/owner fee | $50/kW | $80/kW |
| Base initial capital cost | $80m | $80m |
| Operating life / terminal value | 15 years / zero | 15 years / zero |
| First-year O&M, including augmentation | $3.2m | $3.2m |
| O&M escalation / revenue escalation | 2% / zero | 2% / zero |
| Cash ITC at year-one end | $21.66m | $21.66m |
| Loan tenor / interest | 10 years / 9% | 15 years / 7% |
| Underwritten coverage ratio | 1.75× | 1.30× |
| Revenue haircut for debt sizing | 25% | zero |
| Debt cap / cost after cash credit | 50% | 65% |
Loan terms, haircuts, credit realization, escalation and the return hurdle are analyst assumptions. They are not quoted lender terms. The model also funds a 2% debt fee and six months of first-year debt service from equity.
For each operating year, cash available for debt service, or CFADS, equals revenue less O&M. Underwriting applies its revenue haircut before subtracting the same costs. Permitted annual debt service equals positive underwritten CFADS divided by the required coverage ratio. Debt is the discounted value of those payments, capped by the stipulated leverage limit.
There is one explicit conservative condition: if any year within the debt tenor has nonpositive underwritten CFADS, the loan is zero. The loan test uses this assumption in every scenario. Debt service follows the modeled cash flow. A binding leverage cap reduces payments proportionately. Tax-credit cash does not support recurring debt coverage. The owner funds any operating deficits in these scenarios.
Low, base and high results
| Case | Cost, $/kWh | Annual margin or fee, $/kW | Debt, $m | Project IRR | Owner equity IRR |
|---|---|---|---|---|---|
| Downside merchant | 500 | 25 | 0.00 | n.a. | n.a. |
| Base merchant | 400 | 50 | 0.00 | −12.0% | −12.0% |
| Upside merchant | 300 | 90 | 15.25 | 11.1% | 11.2% |
| Downside toll | 500 | 60 | 10.52 | −13.7% | −20.1% |
| Base toll | 400 | 80 | 30.83 | 1.3% | −5.7% |
| Upside toll | 300 | 100 | 28.44 | 13.8% | 19.7% |
Author calculations; nominal, before income tax, after cash credit. Downside merchant has sustained operating deficits and no economically admissible IRR; “n.a.” is not zero. The table shows negative IRRs for the other applicable cases. The cases change margin and cost together.
Three details explain apparently surprising results. First, base merchant underwriting begins with $3.75 million of haircut revenue and $3.2 million of costs. Escalating costs make underwritten CFADS slightly negative in loan year ten, so the stated gate eliminates debt. A seven-year tenor supports only $1.08 million. Passing a coverage test does not create a large financing facility when little cash remains.
Second, debt can reduce equity returns. A base toll project earning about 1.3% before financing cannot transform 7% borrowing into inexpensive capital merely because the loan amortizes. The owner funds approximately $51.63 million at COD, including fees and reserve, and bears the gap. The loan leaves equity holders with a negative modeled return.
Third, upside toll debt is lower than base toll debt because its leverage cap applies to a cheaper project. The upside loan is capped at $28.44 million; it still needs much less owner equity and delivers the stronger return. A falling absolute loan amount is not evidence of deteriorating economics.
Cost and maintenance dominate the sensitivity
| Baseline economics changed one way | Debt, $m | Project IRR | Owner IRR |
|---|---|---|---|
| Merchant: O&M reduced to 2% of capex | 7.42 | −2.5% | −3.6% |
| Toll: O&M reduced to 2% | 37.92 | 6.1% | 3.8% |
| Merchant: seven-year debt, 4% O&M | 1.08 | −12.0% | −12.1% |
| Toll: 20 operating years, 15-year debt | 30.83 | 3.6% | 1.0% |
The 2% cases have unverified augmentation coverage. The 20-year case adds five fee years but extends beyond the baseline 15-year rated-capacity convention. Both cases depend on unverified augmentation or service-life assumptions. The public Austin contract’s potential 20-year term is therefore considered without silently assuming a 20-year battery life at a 15-year maintenance budget.
At the baseline 12% project hurdle, required annual margin is $155.62/$124.50/$93.37 per kW at $500/$400/$300 per kWh respectively. These are unlevered project thresholds. They must not be called the fee required for a 12% equity return, which also depends on debt terms, fees and reserves.
8. COD changes the tax question; it does not forecast the market
The statutory phaseout for storage follows the date construction begins. Under the current cross-reference to Section 45Y, the full factor continues through a 2033 construction start, then falls to 75% in 2034, 50% in 2035 and zero thereafter, subject to qualification and applicable rules.phaseout
| COD / assumed construction start | Assumed face credit | Base merchant owner IRR | Base toll owner IRR |
|---|---|---|---|
| 2027 / 2026 | 30.0% | −12.0% | −5.7% |
| 2030 / 2029 | 30.0% | −12.0% | −5.7% |
| 2035 / 2034 | 22.5% | −13.0% | −7.3% |
| Any modeled COD, credit denied | zero | −15.3% | −10.9% |
This is a credit-only timing comparison. All other inputs are held constant in nominal COD dollars, and IRR begins at COD. Equal 2027 and 2030 results do not imply that waiting three years is free. The model does not price development expenditure during the wait, construction draws, interest during construction, a changing revenue curve or the opportunity cost of committed capital.
The complete after-tax owner result also remains unknown. It requires the owner’s tax capacity, depreciation and basis schedule, loss absorption, state taxes, credit-transfer or tax-equity terms, and any recapture allocation. The delivered model deliberately labels the return it does compute. Assigning a hypothetical depreciation benefit without identifying the taxpayer would add precision without evidence.
9. Data centers, solar and Texas law: what could change earnings
Requests are not realized demand
ERCOT’s July 2026 Senate presentation reported roughly 474 GW of large-load requests as of June, around 90% associated with data centers. The September operational report showed 9,456 MW approved to energize and 4,132 MW as the sum of individual large-load monthly peaks. That latter measure is non-simultaneous; it is neither system coincident demand nor a pure data-center total.loads
The November community-impact information request describes 177.4 GW across 429 loads in its detailed population. It is a different survey population from the earlier queue headline. Subtracting it from 474 GW and claiming the queue collapsed would be invalid. ERCOT’s parallel verification work identifies weaknesses in site control, security and equipment evidence; further reporting was expected in December.rfi
The relevant revenue mechanism is load that energizes, when and where it runs, and how it behaves during scarcity. Firm evening demand can support discharge spreads. Interruptible demand, behind-the-meter supply or emergency curtailment can soften the same scarcity intervals. A 2030 battery financed against unverified energization milestones is taking a substantial development bet.
Solar’s expansion provides another two-sided effect. Cheap midday energy increases the opportunity to charge, while storage additions compete for the evening opportunity. Transmission changes can move the profitable location. The four-hub backtest already shows a geographic spread, but a financing decision still needs the project’s interconnection node and its congestion history.
State law changes cost and contracting possibilities
SB 6 sets large-load requirements including a 75 MW threshold, duplicate-request disclosure, site control, financial security, a minimum $100,000 study fee and emergency-related provisions. Its backup-generation language includes a disclosure threshold tied to 50% of on-site demand; it does not require every data center to install backup equal to half its load. The underwriting implication is better evidence of which requests are executable and how loads may respond under stress.sb6
HB 3824 applies battery safety requirements to covered facilities of at least 1 MWh beginning commercial operations from January 2027. The statutory framework addresses fire standards, review, inspection, emergency planning and training. A new 200 MWh project must budget for the applicable implementation. The Texas Department of Insurance published an informal working draft in April 2026. A final adopted rule and project-specific compliance costs remain unverified.hb3824
HB 3809 addresses decommissioning obligations and financial assurance in covered new battery leases. The statute’s engineering-estimate and assurance milestones matter to the cash-flow schedule; they should not automatically be modeled as an immediate cash deposit of the entire removal cost. A specific lease and assurance instrument remain necessary. Removal liabilities and assurance premiums or collateral remain unpriced in the model. A project would need to budget for decommissioning and assurance.hb3809
Finally, PURA §35.153, originating in SB 415, permits qualifying utility contracts for storage serving distribution reliability under stated conditions. The 100 MW statewide limit applies to capacity reserved under those utility contracts. The hypothetical merchant project would need to qualify for that route. The implementing rule, 16 TAC §25.58, took effect November 4, 2026. It requires prior commission approval and allocates the statewide cap among transmission and distribution utilities by ERCOT load-ratio share when they apply.storage-rule, sb415
10. The three findings, their independent checks, and the evidence that would change them
Finding 1: reserve-market compression is real, but product-specific. The raw ERCOT price calculation independently supports the market monitor’s reported deterioration, while the non-spin exception prevents an overly broad claim. Owner disclosure independently shows a small ancillary contribution. None of those checks proves that the next quarter’s prices must fall.
Finding 2: a simple two-hour energy strategy currently earns tens of dollars per kW, and forecasting matters. The reproducible DAM-to-RT replay is checked against a constrained perfect-foresight solve, physical dispatch identities and resource-level telemetry/award calculations. The owner filing provides reported revenue under its own accounting definitions. Exact agreement is neither expected nor manufactured. Nodal and metered reconciliation is the remaining material test.
Finding 3: a contract can support debt without meeting an owner’s return hurdle. The cash-flow schedules, debt balances, funding identities and IRRs are independently recomputed; an independent annuity calculation reproduces the $124.50 margin and $257/kWh cost thresholds. Public contracting documents confirm that toll structures exist, while their missing executed tariff prevents treating the scenario as a market quote.
The most consequential new evidence would be:
- A binding all-in cost and warranty package. A credible reduction toward the modeled $257/kWh threshold at an $80 fee changes the investment conclusion more directly than a general prediction of load growth. The scope must include site work, interconnection, usable energy and augmentation.
- An executed revenue floor with full obligations. Fee escalation, tenor, charging allocation, availability penalties, cycling limits, collateral and termination rights determine whether a headline toll is dependable owner cash.
- Matched nodal, settlement-meter and battery energy data. Prices, metered MWh, bus mappings and QSE allocations would replace the common-hub telemetry proxy, validate monthly rankings and reveal whether a particular site has a repeatable advantage.
- A verified tax and sourcing package. Credit eligibility, eligible basis, realization price and the owner’s depreciation treatment could materially improve or weaken the modeled equity result.
- Realized load and procurement changes. Energized demand, executed connection milestones and adopted reserve requirements carry more underwriting weight than request totals or proposed rules.
For a working analyst, the immediate next step is to replace the three most influential assumptions—installed cost, sustainable after-charging margin or enforceable toll, and augmentation obligation—with project-specific evidence. The workbook then shows whether the asset has adequate cash to service debt and whether the residual is worth the owner’s capital.
Sources
Sources were accessed November 12, 2026. The accompanying source register contains document URLs, page or table locators, periods, limitations and archive identifiers; raw-data manifests add hashes. Analytical figures are author calculations from those inputs. No paid data, account creation, contact or records request was used.
- Public Utility Commission of Texas, Project 59523. Order adopting 16 TAC §25.58. Texas Register, October 30, 2026. Effective November 4, 2026. ↩
- ERCOT, Historical DAM Load Zone and Hub Prices, annual hub/zone archive report 13060, and Historical RTM Load Zone and Hub Prices, annual hub/zone report 13061. DAM archive metadata; RT archive metadata. Tags: HB_HOUSTON, HB_NORTH, HB_SOUTH, HB_WEST; delivery date, hour/interval, repeated-hour flag. Period: January 2024–October 2026. The source download manifest lists the original ZIPs and hashes. Daily and monthly modeled results are included in the CSV collection. ↩
- ERCOT, Historical DAM Clearing Prices for Capacity, annual archive report 13091. Metadata and source downloads. Tags: REGUP, REGDN, RRS, ECRS, NSPIN; hourly prices. Period: 2024–2026, with January–October comparison. Source: ancillary comparison and monthly CSVs. Simple hourly averages. ↩
- Potomac Economics, 2025 State of the Market Report for ERCOT, May 2026, printed pp. 22–23, Figure 17 and accompanying text. Report. Period: 2025 and restated earlier years. Exact normalized dollar chart levels are not transcribed as reported data; the earlier report uses a different vintage. ↩
- ERCOT, Capacity Changes by Fuel Type Charts, October 2026, posted November 5. Workbook. Tags: Battery Chart C75; Solar Chart C76; historical operational rows. Period: end-2024/end-2025 and October 2026. Monthly chart uses each corresponding workbook vintage, identified in the CSV. ↩
- ERCOT, 60-Day DAM Disclosure Reports, report 13051, DAM_ESR member; 60-Day SCED Disclosure Reports, report 13052, SCED_ESR member. DAM metadata; SCED metadata. Column Definitions Guide v2.4. Periods: January–August 2026 DAM; April–June SCED plus March 31 carry. Per-day original member names, URLs and hashes accompany the raw CSVs. ↩
- ERCOT, NP6-905-CD product description, anonymous report 12301 listing, observed November 5–12 retention; Public API registration and authentication guide. The absent resource-node historical series and missing meter crosswalk are documented in the settlement evidence notes. ↩
- ERCOT, Nodal Protocols, Section 4, §§4.4.9.7(2)–(3), 4.4.9.7.1(1)(c) and (3), member
04-120525_Nodal.docxin the April 1, 2026 archive; identical text checked in the June archive. Period: Q2 2026. DAM_ESR fields: submitted Curve-MW1–10, paired prices and HSL. Source spans total 18,007,645 MW-hours, covering 93.92% of eligible HSL-hours. Daily URLs, exclusions, calculation and QA accompany the offer CSVs. ↩ - Gore Street Energy Storage Fund, Annual Report 2026, pp. 19 and 21, revenue/cost definitions; p. 23, Texas table; p. 34, assets; p. 108, Alternative Performance Measures footnotes. Annual filing. Period: April 1, 2025–March 31, 2026. Sterling; ownership/operating-period-weighted capacity; Texas charging expense not itemized. ↩
- Gore Street Energy Storage Fund, June-end 2026 Quarterly NAV and Portfolio Update, September 15, 2026, “Q1 FY26/27 Revenue Updates,” Texas row. Issuer release. Period: April–June 2026, with prior-year comparison. The reported figure measures revenue. ↩
- NREL/NLR, 2025 Annual Technology Baseline: Utility-Scale Battery Storage, tags “Operation and Maintenance” and “Roundtrip Efficiency.” Technology assumptions. Period: 2025 edition. Benchmark includes augmentation, rated capacity over 15 years and approximately daily cycling; model’s 2% nominal escalation is an author assumption. ↩
- ERCOT, Monthly Operational Overview, September 2026, p. 9 large loads, p. 23 ancillary prices, p. 28 pricing event. Report. September 2 pricing notice. Period: September 2026; posted October 16. ↩
- ERCOT, ERCOT Goes Live with Real-Time Co-optimization Plus Batteries, December 5, 2025. Announcement. Also market notice M-C110525-01. Cutover date: December 5, 2025. Disclosure corrections are identified in the accompanying evidence notes. ↩
- ERCOT, Nodal Protocols, Section 6, §6.6.3.1 for physical battery settlement and §§6.7.2.1–6.7.2.6 for reserves. April 1, 2026 archive, member
06-040126_Nodal.docx; June 1 archive, member06-060126_Nodal.docx. Prices: reports 25569, 25570 and 13231, SCED MCPC, 15-minute MCPC and SCED adders. Period: Q2 2026; applicable historical equations checked against current November 6 text. ↩ - ERCOT, 2026 Biennial Report on the Operating Reserve Demand Curve and Ancillary Service Demand Curves, November 4, posted November 11, pp. 2, 4–5 and 8; especially p. 2 footnote 1. Report. ASDC observation period: December 5, 2025–September 30, 2026. ↩
- EIA, Construction Cost Data for Electric Generators Installed in 2024, released July 6, 2026. Tables and downloadable source workbook. Tag: batteries; workbook
Sheet1!A6:O6. Period: installed 2024. National mixed-duration costs; source CSV supplied. ↩ - NREL, Cost Projections for Utility-Scale Battery Storage: 2025 Update, June 2025, Figure 2 printed p. 7; cost scope pp. 4 and 11–12; Table 2 pp. 16–17. Report. Baseline: 2024 dollars. Two-hour value is calculated from the displayed duration fit; the four-hour projections use a different duration. ↩
- Eolian, Eolian and Natixis Corporate & Investment Banking Close $463 Million Financing…, issuer release, October 9, 2025. Release. Tags: full-complex capacity, phase durations, and “more than $700 million” total investment paragraph. Period: 2025 announcement for 2026 completion; Expected total investment for a mixed-duration complex. ↩
- 26 USC §48E, especially (a)(2)(B), (a)(3), (c)(3), (d) and (e)(4)(C). Current codified text, laws through Public Law 119-134, October 20, 2026. Period: law at research cutoff; The model assumes qualification. ↩
- IRS, Notice 2026-15, material-assistance guidance, including interim safe-harbor framework. Notice. Period: current 2026 guidance; applicable property, sourcing and begin-construction evidence must be checked for the project. ↩
- City of Austin, Council file 26-2096, title and additional backup information. Public file. July 23 action notes, item 6. Austin Energy, Austin Energy inks deal with Jupiter Power for 200 MW of battery storage, October 28, 2026, background/final paragraph. Signed-deal announcement. Period: 2026 agreement; expected 2030 COD. The authorized ceiling applies at full capacity. The executed tariff remains undisclosed. ↩
- Austin Electric Utility Commission, Item 5: Balcones Ridge Resiliency battery tolling agreement, p. 1, posting language and additional backup. Document. The July 2025 Council action notes, item 16 document the $14.4 million ceiling. The City staff report identifies the approved 100 MW project as four-hour storage. ↩
- Energy Vault Holdings, Form 10-Q for the quarter ended June 30, 2026, notes to condensed consolidated financial statements, “Cross Trails Credit Agreement,” printed p. 19; debt table p. 18. SEC filing. Period: June 2026 historical covenant waiver and loan terms; original facility differs from June outstanding principal. No causal attribution to reserve prices or project gross-cost inference is made. ↩
- 26 USC §48E(e) and §45Y(d)(2)–(3). Section 45Y. Period: current law, applicable year 2032. Phaseout uses construction timing; the COD scenarios hold other inputs constant. ↩
- ERCOT, Senate Business and Commerce Committee presentation, July 29, 2026, Panel 1, p. 6. Presentation. Queue period: June 2026. Energization and non-simultaneous peak figures: September Operational Overview, p. 9, cited above. ↩
- ERCOT, Community Impact RFI PUC Update, November 5, 2026, pp. 7–8. Presentation. Also Verification RFI Update, November 5, p. 2. Verification presentation. Different survey populations; further reporting expected December 10. ↩
- Texas Legislature, SB 6, 89th Regular Session, enrolled text, PURA §37.0561(c)–(h), (m), and emergency provisions. Enrolled law. Period: 2025 enactment/current statutory framework; implementing details must be checked for each application. ↩
- Texas Department of Insurance April 2026 informal working draft. Texas Legislature, HB 3824, 89th Regular Session, enrolled text, battery safety provisions and applicability. Law. Period: facilities beginning commercial operations from January 1, 2027; final implementing-rule text not independently verified. ↩
- Texas Legislature, HB 3809, 89th Regular Session, enrolled text, Utilities Code Chapter 303, especially decommissioning/financial assurance and applicability. Law. Period: covered agreements from September 1, 2025; estimate/assurance milestones do not imply an immediate full cash reserve. ↩
- Texas Legislature, SB 415, 87th Regular Session, enrolled text, PURA §35.153. Law. Period: current statutory authority. The unverified implementation item is PUCT Project 59523, item 36, October 15, 2026; no claim about its final text or effective date is made. ↩
Supporting material
- Excel model ↗Sourced inputs, live calculations and reported outputs.
- Source and model data (CSV collection) ↗Data tables, source references and calculation exports.
- Source register ↗Download as CSV.