Financial systems
How much buyback spending offsets stock pay?
Reported stock compensation equaled 23% of repurchase cash in the matched sample. Share counts show how much ownership changed.
Across 3,373 company-years with both measures, this study finds $1.327 trillion of selected SBC costs against $5.793 trillion of reported repurchase cash: 22.91%. The noncash compensation total uses a standard mapping of filing tags. Selections without a filing review remain provisional. The cash denominator can include withholding, while the share-count gap can include acquisitions, capital issuance and noncash exchanges. data
Three filings show what those aggregate figures cannot measure. Apple’s fiscal-2025 net issuance absorbed 14.48% of purchased shares. Nvidia’s net employee-plan issuance absorbed 46.45%. Microsoft’s fiscal-2025 free cash flow falls from $71.611 billion to $59.637 billion when its noncash stock-pay addback is treated as a cash compensation cost. Each figure uses its own denominator and reconciliation to the filing. aapl nvda msft
Across 3,020 matched company-years outside Financials and Real Estate, the base substitution reduces conventional free cash flow by $1.219 trillion, or 14.09%. The liquidity calculation tracks cash paid for employee tax withholding. Subtracting both full SBC and full withholding without measuring their overlap would combine different award valuations and potentially count the same compensation economics twice. data asu
The searchable table covers 500 issuers and 5,000 company-year slots, but only 1,760 observations support the actual-share residual. Missing measurements remain unknown. The aggregate ratios describe the measured rows. The filing cases below show what the available share reconciliations can attribute to stock pay.
The practical test has three parts: how much cash left, how much the outstanding share count shrank, and how much cash generation remains after recognizing equity compensation as a cost. A cash-flow repurchase line concerns the first question and can include more than discretionary purchases. Executed purchases determine how much of an authorization was spent.
Scope and constituent policy
The universe is the 500 issuers represented by 503 ordinary share-class holdings in SPY’s November 10, 2026 holdings file. Duplicate issuer listings are consolidated by SEC CIK. Cash and the nonordinary Hologic contra position are excluded. Same-date IVV holdings supply sector classifications, standardized where needed and applied consistently across the decade. Whole-company amounts are not multiplied by index weights or free-float percentages. universe
The main table has one slot per issuer for each fiscal year ending in calendar 2016 through 2025. The table shows each period’s start and end dates. A January 2025 year-end is grouped in 2025 even though most operations occurred in 2024. Fiscal 2015 supplies opening balances where available. 93 observed completed annual periods ending in 2026 appear in the 2026 update. Missing historical records are marked unknown. data
This is a current-constituent survivor cohort. Companies removed from the index are absent, while current constituents can contribute pre-index history. Explicit predecessor mappings connect ExxonMobil, BlackRock, Broadcom and Linde where the disclosed history supports continuity. The panel flags major scope transitions. These choices make the panel reproducible, but do not recreate the S&P 500 portfolio at every past date.
Observed repurchase cash totals $7.023 trillion across 4,014 rows. No missing amount is extrapolated to produce that figure. S&P’s published calendar-year observations sum to $6.652797 trillion for 2016–2024. Its published $7.224956 trillion for 2015–2024 matches the corresponding ten annual benchmark rows. The index benchmark uses contemporaneous membership and calendar years. This panel uses November 2026 membership and company fiscal years. A verified full-calendar-2025 primary benchmark was not recovered; no trailing-year figure was substituted. data sp
Finding 1: stock pay is large relative to repurchase spending
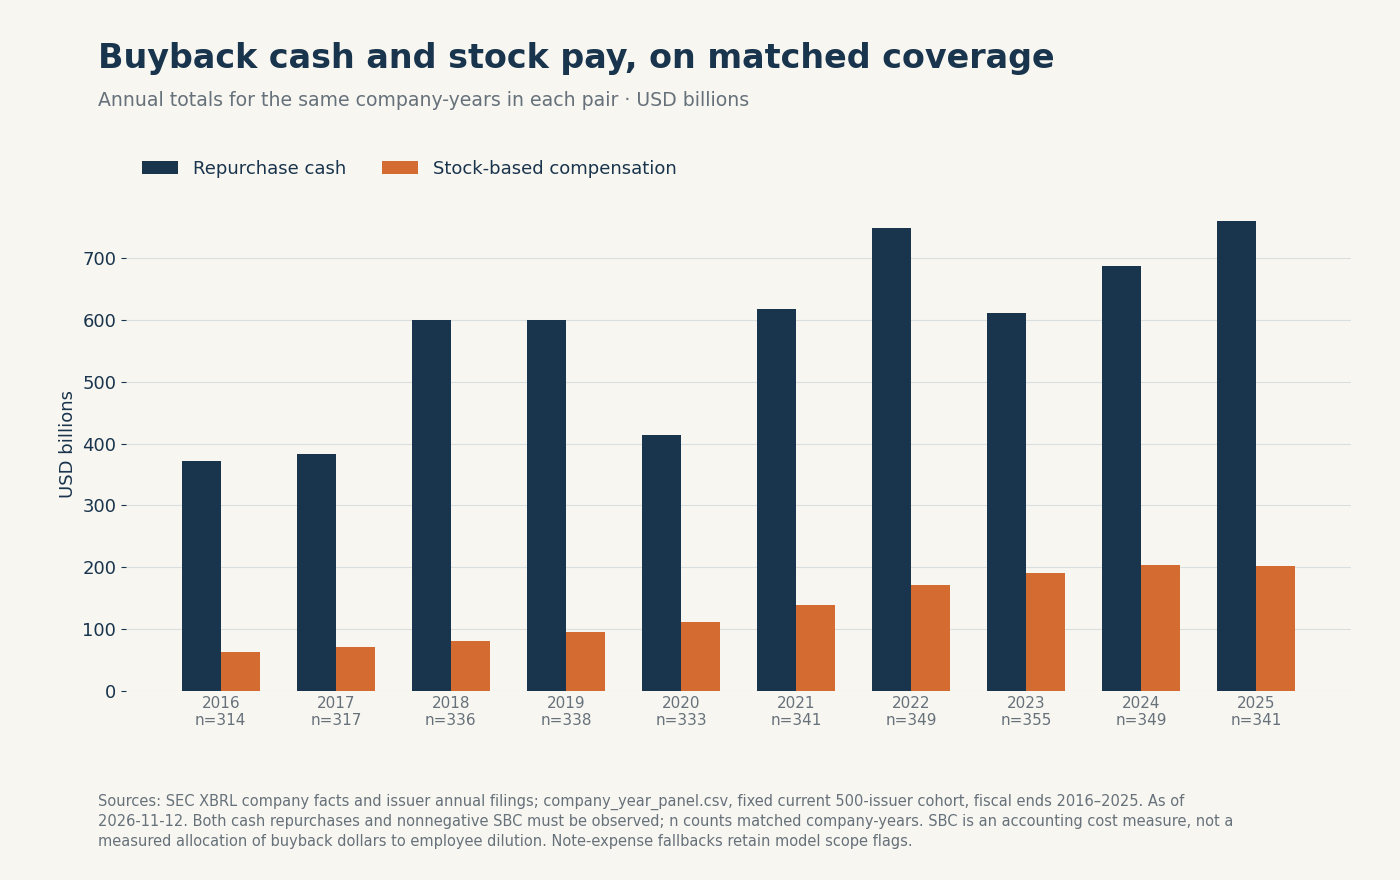
Figure 1. Identical company-years with both nonnegative inputs. Sources: chart input CSV, selected SEC facts and reviewed overrides. Sample counts vary by year.
The paired ratio is 17.05% in 2016, 26.61% in 2025, and 31.27% in 2023. The corresponding sample counts are 314, 341 and 355 company-years. These comparisons do not isolate a compensation trend in an unchanging balanced panel. data
The decade result divides summed SBC dollars by summed repurchase dollars. It is not an average of company percentages. A company spending little on repurchases can have a huge individual ratio, including one exceeding 100%. An unweighted average gives each company equal influence and magnifies small-denominator effects.
Accounting compensation expense is not automatically the cash needed to purchase the shares issued in that year. Expense recognition, vesting, exercise and withholding follow different schedules. Options and employee purchase plans can bring cash into the company. A repurchase program may absorb current employee issuance, older issuance, acquisition shares or other changes. The model records expense, cash payments and share counts in their own columns.
Cash scope also matters. Microsoft’s repurchase cash line includes withholding, while IBM’s reviewed 2025 amount is entirely withholding. Treating every dollar in those lines as discretionary program spending would mix transactions in the denominator. The 22.91% result is useful as a scale comparison when the cash line’s scope is clear. msft ibm
Finding 2: sector rankings depend on the metric and coverage
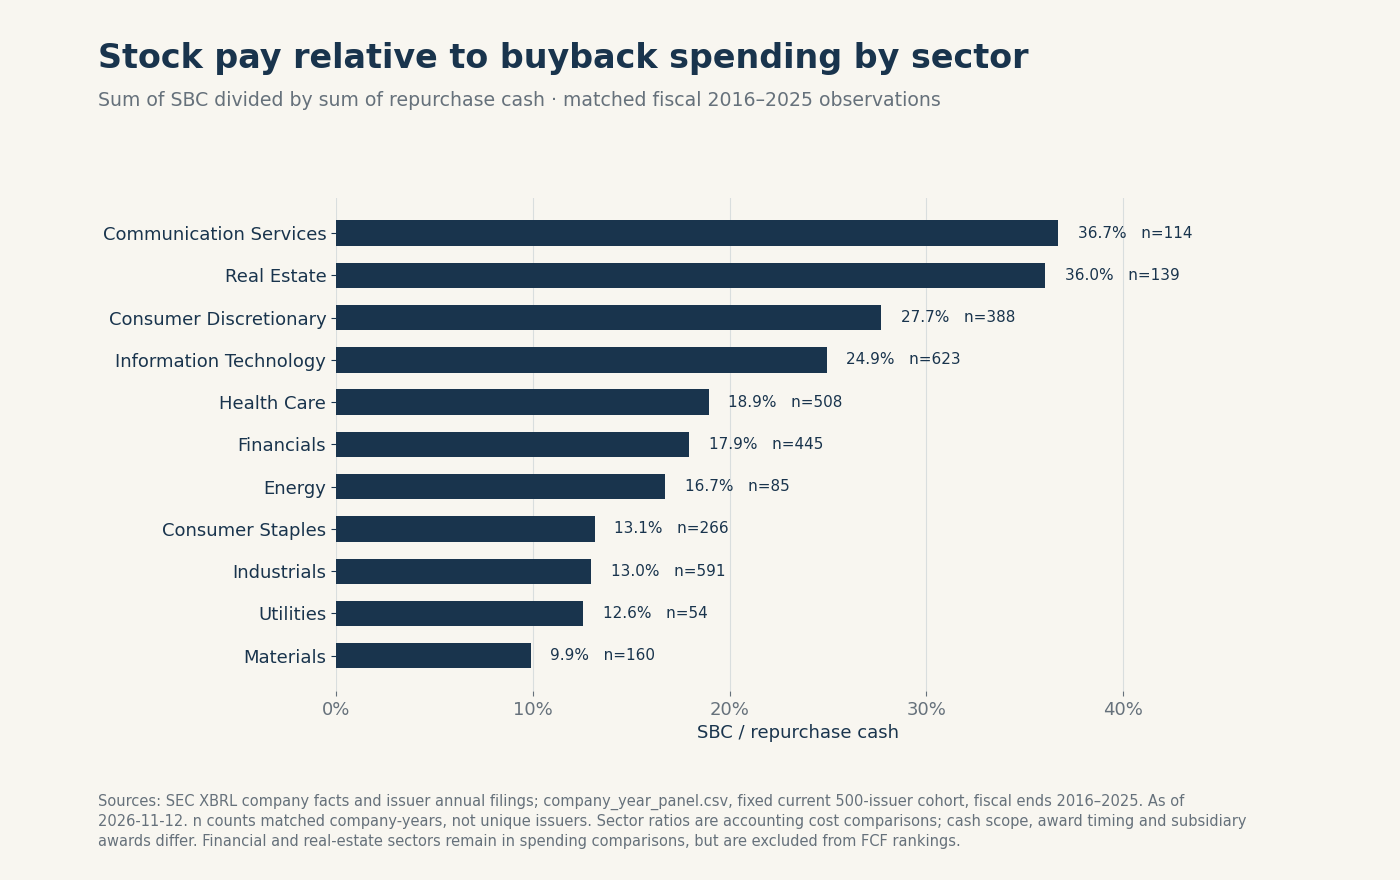
Figure 2. Ratios of summed dollars on matched company-years. Current sector labels; no extrapolation to missing observations. Sources: sector summary, chart inputs and the SEC ledger.
| Sector | Matched years | Repurchase cash ($bn) | SBC ($bn) | SBC / cash |
|---|---|---|---|---|
| Communication Services | 114 | 772.7 | 283.5 | 36.69% |
| Real Estate | 139 | 21.0 | 7.6 | 36.03% |
| Consumer Discretionary | 388 | 538.4 | 149.2 | 27.72% |
| Information Technology | 623 | 1,819.3 | 453.6 | 24.93% |
| Health Care | 508 | 680.4 | 128.9 | 18.94% |
| Financials | 445 | 1,018.5 | 182.8 | 17.94% |
| Energy | 85 | 55.7 | 9.3 | 16.73% |
| Consumer Staples | 266 | 278.7 | 36.6 | 13.14% |
| Industrials | 591 | 490.4 | 63.6 | 12.97% |
| Utilities | 54 | 19.8 | 2.5 | 12.57% |
| Materials | 160 | 97.9 | 9.7 | 9.89% |
Communication Services has the largest observed paired ratio, followed by Real Estate and Consumer Discretionary. This is not a ranking of employee dilution. In Energy, several large spenders are absent from the matched calculation because the required noncash cash-flow addback could not be isolated from broader compensation disclosures. Their missing values cannot be interpreted as no stock pay. data
Current sector labels keep a classification change from masquerading as operating growth, but do not recreate historical sector portfolios. The downloadable sector table provides both independent field totals and matched totals. Readers can see when the totals cover different companies.
A useful company comparison needs the same fiscal span, comparable economic scope and visible observation counts. Ten reported years and four available years are not equivalent coverage. Dollar gaps remain available when a percentage based on negative or near-zero FCF would be uninformative. Readers should examine the amount and its denominator together before treating a ranking as an economic conclusion.
Finding 3: purchased shares can produce little net ownership reduction
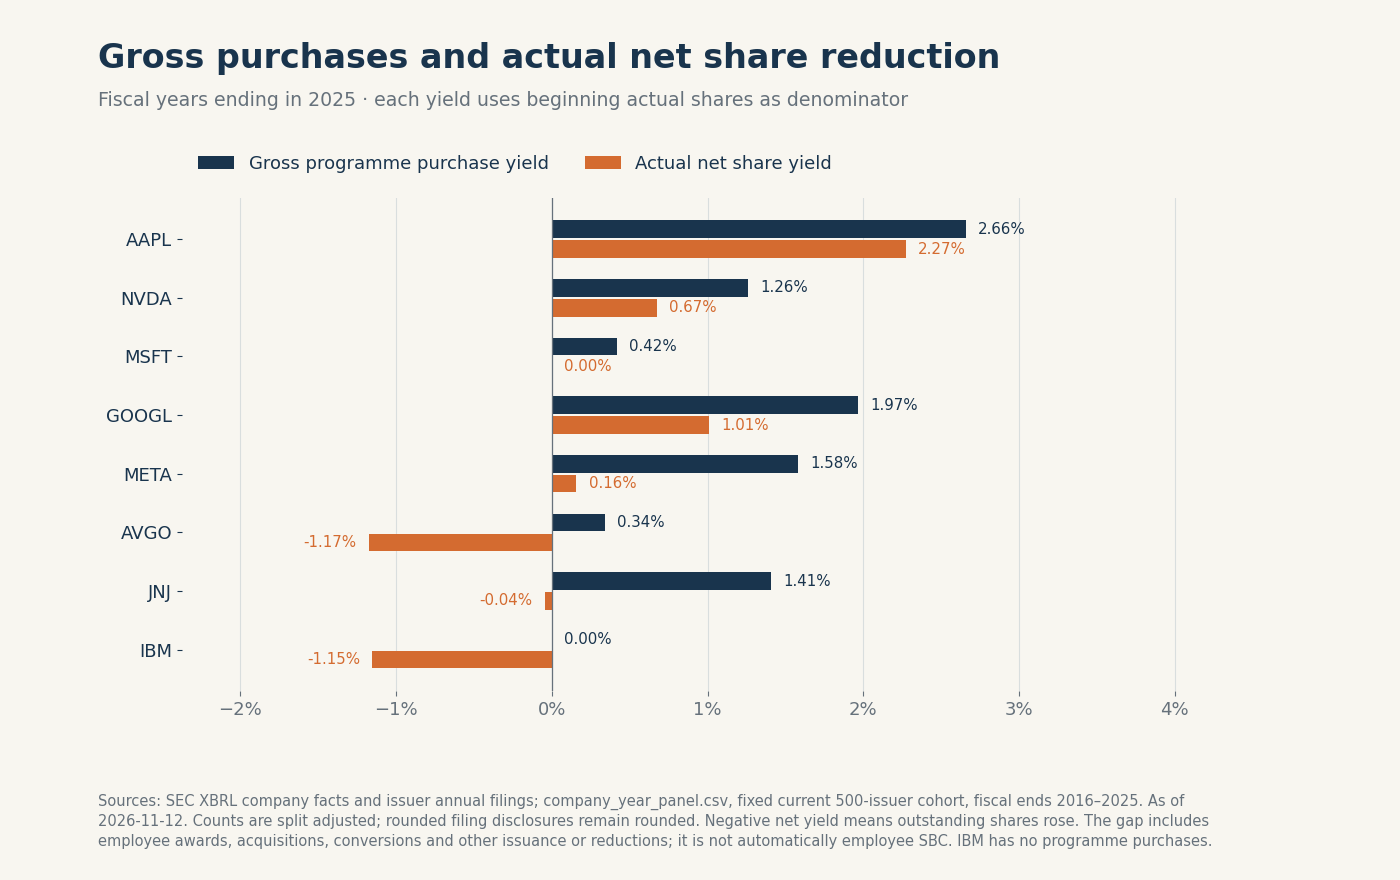
Figure 3. Selected fiscal years ending in 2025. Gross share yield uses program purchases; net share yield uses the opening-to-closing change in shares outstanding. Negative net yield means shares increased. Sources: reviewed filings and chart inputs.
Let N0 be opening shares outstanding, N1 closing shares outstanding and R program repurchases, all on a common split and class basis:
- Net share reduction: D = N0 − N1.
- Gross share yield: R / N0.
- Net share yield: D / N0.
- Net non-buyback issuance residual: G = R − D.
The residual is what prevented purchased shares from becoming an equal net reduction. It includes net employee issuance, acquisition and other issuance, less other reductions in outstanding shares. It does not identify an employee-only cost. Subsequent legal retirement of treasury stock also does not reduce outstanding shares a second time: those shares had already left the ownership denominator.
| Company | Program shares (m) | Net reduction (m) | Gross share yield | Net share yield |
|---|---|---|---|---|
| AAPL | 401.672 | 343.526 | 2.66% | 2.27% |
| NVDA | 310.000 | 166.000 | 1.26% | 0.67% |
| MSFT | 31.000 | 0.000 | 0.42% | 0.00% |
| GOOGL | 240.000 | 123.000 | 1.97% | 1.01% |
| META | 40.000 | 4.000 | 1.58% | 0.16% |
| AVGO | 16.000 | -55.000 | 0.34% | -1.17% |
| JNJ | 33.903 | -1.017 | 1.41% | -0.04% |
| CVX | 79.900 | -225.404 | 4.52% | -12.74% |
| IBM | 0.000 | -10.662 | 0.00% | -1.15% |
| RTX | 0.396 | -10.165 | 0.03% | -0.76% |
Quantities inherit filing precision. Chevron’s program count is rounded and differs from all treasury purchases. IBM has zero discretionary program purchases. Exact filing locators accompany the ten cases below.
The model also calculates shares that reported cash could fund at the observed or implied purchase price: cash divided by price. For Apple, Microsoft and Nvidia, the equivalents are 408.019 million, 43.925 million and 307.319 million, compared with completed program purchases of 401.672 million, 31 million and 310 million. These use rounded program cost/count proxies. They are not precisely observed tax-exclusive execution prices or counts of shares retired. Payment scope and settlement timing can make the arithmetic differ from shares delivered. aapl msft nvda
Dollar yields are also supplied. Estimated average capitalization equals the fiscal period’s average daily close multiplied by the mean of opening and closing shares. Gross cash yield divides reported repurchase cash by that estimate. Net dollar yield values the net share reduction at the same close and divides by the same capitalization. This converts the share-count change to an equivalent value at the selected price. Net cash payout would require the cash proceeds from issuance.
Net income and the EPS weighted-share denominator enter the model as individual inputs. Weighted diluted shares are preferred, with a clearly flagged basic-share fallback where necessary. Neither is substituted for year-end shares outstanding. Weighted averages respond to timing and dilution conventions, so their change cannot simply be called the count of shares retired.
Ten standout filing cases
These cases explain why the aggregate dollar ratio cannot answer every company’s share-count question. Unless stated otherwise, figures refer to fiscal years ending in 2025. “Net issuance” means the bridge residual after purchases; it is called employee issuance only where the filing supports that attribution.
1. Apple: most purchased shares became a net reduction
Apple began with 15,116.786 million shares outstanding, purchased 401.672 million, and issued a net 58.146 million, leaving 14,773.260 million. The resulting 343.526 million reduction means 14.48% of purchased shares was absorbed by issuance and the rest reduced the denominator. This is a much more informative ownership calculation than comparing SBC expense with buyback cash. aapl
Reported repurchase cash was $90.711 billion, while the program disclosure rounded purchase cost to $89.3 billion. Each amount appears in its own model column. Noncash stock compensation was $12.863 billion, and cash paid for net-share-settlement withholding was $5.960 billion. Conventional FCF was $98.767 billion; the base cash-substitution figure is $85.904 billion. FCF after withholding, without substituting SBC, is $92.807 billion. Those last two figures answer different questions and must not be added together.
Apple also illustrates a historical price trap. Its 2016 and 2017 disclosures contained accelerated repurchase agreements whose cash and final share deliveries crossed fiscal periods. The model preserves purchase quantities and split-normalized share bridges, but leaves the whole-year execution price UNKNOWN for those years. A disclosed open-market subset price is not silently promoted to a price for the entire program. apple-history
2. Nvidia: employee issuance absorbed almost half the program
Nvidia’s fiscal year ended January 26, 2025. Its equity statement reconciles 24,643 million opening shares, 203 million employee-plan issuances, 59 million shares withheld for taxes and 310 million program purchases to 24,477 million closing shares. Net employee issuance was therefore 144 million; the net reduction was 166 million. Dividing 144 by 310 produces the independently checked 46.45% offset. nvda
The filing reports $33.706 billion repurchase cash, approximately $34.0 billion of program purchase cost, $4.737 billion of SBC and $6.930 billion of withholding payments. Withholding exceeding current-year SBC is not proof of an inconsistency: the awards settling this year need not be the awards recognized in this year’s expense.
OCF of $64.089 billion less $3.236 billion cash capex gives $60.853 billion conventional FCF. The SBC-substitution result is $56.116 billion; the withholding-liquidity result is $53.923 billion. The filing’s share quantities already reflect the 2024 ten-for-one split. Applying that split again would destroy the comparison.
3. Microsoft: cash spent, shares unchanged at disclosed precision
Microsoft’s fiscal-2025 equity bridge starts and ends at 7,434 million shares: 31 million issued and 31 million repurchased. That supports a zero net reduction at the filing’s million-share precision. It does not show that absolutely no share changed between the exact unrounded balances. msft
The $18.420 billion cash-flow repurchase line is broader than the $13.000 billion program amount. Disclosed employee withholding is rounded to $5.4 billion. The difference between the two purchase figures, $5.420 billion, must not be presented as a more precise disclosure of withholding.
The independent FCF calculation is straightforward: $136.162 billion OCF − $64.551 billion capex − $11.974 billion noncash SBC = $59.637 billion. Conventional FCF is $71.611 billion. Microsoft’s issuer-hosted annual report and the subsequent SEC comparative provide checks on the original filing inputs; an independent arithmetic check exactly matches the model.
4. Alphabet: distinguish the cash-flow addback from note expense
Alphabet purchased 240 million shares while outstanding shares fell from 12,211 million to 12,088 million. The 123 million net reduction leaves a 117 million residual, equivalent to 48.75% of purchases. The bridge aggregates the relevant share classes in place of the trading price of one class as an interchangeable share count. googl
Reported repurchase cash was $45.709 billion, compared with $45.398 billion in the program-value input. The cash-flow SBC addback was $24.953 billion, whereas the compensation note reports $27.1 billion expense. The substitution model uses the former because it reverses the noncash addback in OCF.
Two tempting withholding figures are rejected as pure withholding inputs: $14.167 billion of net award-related cash and $14.842 billion combining withholding and other equity effects. Their labels and scope do not justify treating either as a clean tax-withholding payment.
5. Meta: a large program and a small net reduction
Meta’s share bridge is 2,534 million + 63 million gross issuances − 27 million withheld − 40 million program purchases = 2,530 million. Purchases therefore produced only a 4 million net reduction. The 36 million issuance residual absorbs 90% of program shares. meta
Repurchase cash was $26.248 billion; the equity/program-value measure was $26.264 billion, including excise-tax effects. SBC was $20.427 billion, and withholding cash was $18.4 billion. The report does not label the entire 36 million residual employee compensation: the filing also reports $450 million of acquisition equity, without an identifiable share count in this bridge. The value appears under other issuance. The acquisition share count remains unknown.
6. Broadcom: net issuance exceeded current-year purchases
Broadcom’s fiscal-2025 bridge is 4,686 million + 88 million issued − 17 million withheld − 16 million program purchases = 4,741 million. Net issuance of 71 million exceeded purchases by 55 million. Its non-buyback issuance offset is 443.75%. The filing labels the 88 million-share row “Common stock issued”; employee-only attribution remains UNKNOWN. A ratio above 100% means purchases did not offset all net issuance. avgo
Repurchase cash was $2.450 billion, noncash SBC $7.568 billion, and withholding cash $3.860 billion. The equity withholding value, $3.722 billion, differs from cash. Changes in settlement arrangements, including sell-to-cover in the second half, matter when interpreting these measures.
The preceding year’s 544 million VMware acquisition shares have their own category. They are not compensation just because they increased shares during a period with substantial buybacks. The historical series also handles Broadcom’s July 2024 ten-for-one split.
7. Johnson & Johnson: a noncash exchange can dominate a decade
Johnson & Johnson’s fiscal-2025 share reconciliation is 2,406.922 million + 34.920 million employee shares − 33.903 million purchased = 2,407.939 million. Shares rose by 1.017 million despite $5.953 billion reported repurchase cash. Noncash SBC was $1.354 billion. jnj
The larger historical warning is the Kenvue exchange. In 2023, 190.955436 million J&J shares, valued at $31.418 billion, were acquired into treasury through the noncash exchange. The exchange reduced shares outstanding without cash repurchases. A decade-long comparison of cash divided by share reduction that ignores the exchange would be misleading.
The model records the exchange as a corporate action. The relevant treasury, compensation and Kenvue notes identify what the exchange contributed to the share count.
8. Chevron: acquisition shares explain the direction
Chevron’s outstanding shares increased from 1,769.012274 million to 1,994.416122 million, a 225.403848 million rise. The filing reports 80.072818 million total treasury purchases and a rounded 79.9 million shares under the repurchase program. The Hess transaction issued approximately 301.25 million shares. The acquisition is the first place to look when interpreting the increase. cvx
Reported repurchase cash was $12.079 billion. A particularly consequential tagging problem appeared in the withholding series: the $146 million value carried by a withholding-related tag was rendered in the filing as repurchase excise tax. The model preserves the raw fact but leaves employee withholding UNKNOWN.
The compensation note’s $472 million expense and $405 million cash settlements are different measures covering potentially different awards. Subtracting one from the other to manufacture $67 million “noncash SBC” would be unsupported. That input remains UNKNOWN.
9. IBM: a repurchase cash line without a discretionary program
IBM reported zero discretionary program purchases while recording $1.018 billion in repurchase-related cash, identified as employee withholding. Calling that entire amount a shareholder-return program would misstate the filing. ibm
The exact share bridge is 926,290,070 opening + 11,454,210 newly issued + 3,023,129 treasury shares reissued − 3,815,280 withheld = 936,952,129 closing. Outstanding shares increased by 10,662,059. Noncash SBC was $1.715 billion.
This case shows why a broad cash-flow extraction cannot supply the economic interpretation by itself. The workbook records cash, program quantity, withheld shares and outstanding shares in individual columns.
10. RTX: retirement-plan shares also matter
RTX’s outstanding shares increased from 1,332,122,758 to 1,342,287,676, despite approximately 396,000 program purchases costing $50 million. The resulting increase was 10,164,918 shares. Its rounded issuance bridge includes 6.556 million net employee shares and 4.004 million retirement-plan shares; a 918-share difference remains because those components are rounded. rtx
The filing also reports $519 million of SBC and $573 million of noncash 401(k) matching contributions. The base SBC scenario uses the identified SBC input; it does not quietly expand the definition to include the retirement-plan amount. An editor or investor may choose a broader equity-compensation measure, but should label it and recompute the scenario.
Earlier Raytheon and Rockwell acquisition shares have their own rows. RTX’s spin-offs are not treated as stock splits merely because a price vendor supplies a split-like adjustment.
Finding 4: treating SBC as cash changes the FCF ranking
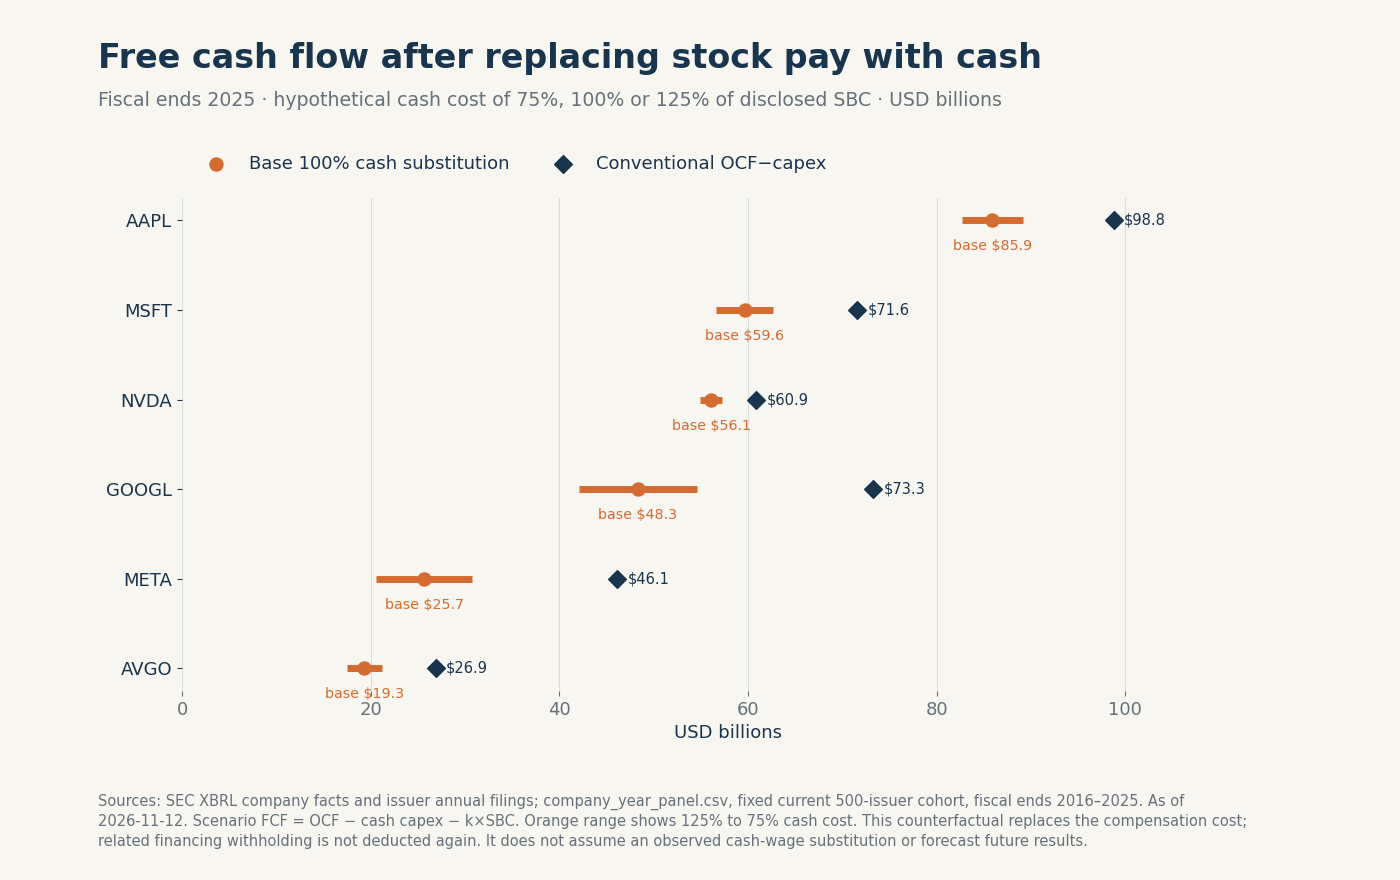
Figure 4. Selected operating companies, fiscal years ending in 2025. Conventional FCF is OCF less cash capex. Scenario deductions are 0.75, 1.00 and 1.25 times the verified noncash SBC input. Source: model inputs traced to company filings.
For the 3,020 observations outside Financials and Real Estate with comparable inputs, conventional FCF totals $8.650 trillion. The low-cost substitution produces $7.736 trillion, the base $7.431 trillion, and the high-cost case $7.127 trillion. These scenarios hold OCF before the compensation substitution and corporate cash taxes fixed.
The model is deliberately mechanical. It does not claim that employers could switch all awards to cash at precisely grant-date expense, that workers would accept unchanged compensation, or that share repurchases are the contractual settlement of compensation expense. The low and high cases expose that uncertainty instead of concealing it in a point estimate.
| Company | Matched years | Conventional FCF | SBC deduction | Base FCF |
|---|---|---|---|---|
| GOOGL | 10 | 488.925 | 152.456 | 336.469 |
| AMZN | 10 | 121.853 | 126.559 | -4.706 |
| META | 10 | 291.786 | 94.765 | 197.021 |
| AAPL | 10 | 813.207 | 79.615 | 733.592 |
| MSFT | 10 | 498.530 | 65.754 | 432.776 |
| AVGO | 10 | 130.872 | 25.705 | 105.167 |
| ORCL | 10 | 101.380 | 23.882 | 77.498 |
| INTC | 10 | 41.731 | 22.144 | 19.587 |
| CSCO | 10 | 137.792 | 20.414 | 117.378 |
| CRM | 10 | 49.400 | 19.697 | 29.703 |
The ranking uses only observations with all required FCF and SBC inputs; years with FCF alone do not enter the paired comparison. Dollar amounts are billions.
The most striking long-period result is Amazon. After correcting its 2016 capex input to gross cash purchases of $7.804 billion, the matched decade yields $121.853 billion conventional FCF against $126.559 billion SBC, leaving $-4.706 billion under the base substitution. The negative result describes the modeled change to historical free cash flow at that assumed compensation cost. amzn
The capex correction matters. The initially selected $6.737 billion was a net presentation; the gross amount differs by $1.067 billion of incentives. For 2025, the standard model uses $131.819 billion cash purchases, lists $3.499 billion of sales and incentives on their own line, and does not add $1.557 billion of financing-lease principal or $2.911 billion of noncash lease additions to that cash-purchase figure. Those may be relevant to a broader investment definition, but combining them without a consistent policy would change the question.
The company and sector rankings therefore publish both the deduction and the denominator. A high percentage against a small positive FCF balance is economically different from a large dollar deduction against robust cash generation. Negative FCF observations remain in dollar aggregates; percentages are left blank where their denominator would be misleading.
Finding 5: withholding measures a cash cost
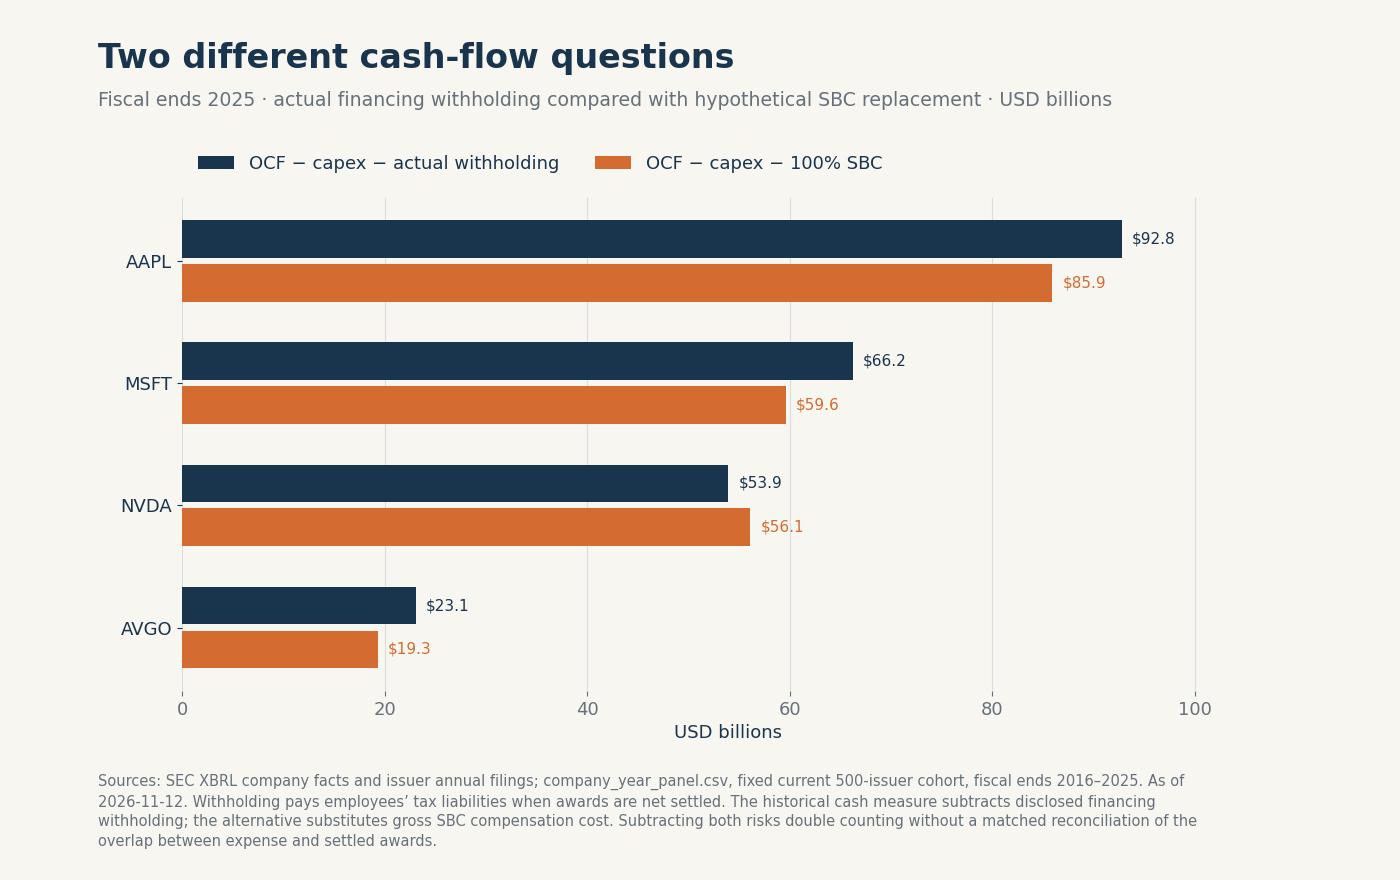
Figure 5. Selected fiscal years ending in 2025. Two FCF measures are plotted: conventional FCF less financing withholding, and conventional FCF less noncash SBC. The first shows cash paid. The second models a cash substitute for equity awards. Sources: company cash-flow statements and award-settlement notes.
A compensation expense is recognized over service periods and can reflect grant-date valuation. Withholding is cash remitted when particular awards settle, using their settlement value and applicable taxes. The timing, award population and valuation need not match. That explains why Nvidia’s withholding exceeds its current SBC while Apple’s is lower; it does not identify the economic cost of either company’s entire award program.
The accounting classification also changes over the sample. FASB’s 2016 update specifies financing classification for cash paid to tax authorities when shares are directly withheld to meet statutory withholding obligations. Earlier years require attention to the applicable presentation. The automated model therefore does not subtract an unverified early-period withholding input from OCF a second time. asu
The model calculates two versions of FCF.
- Compensation-substitution scenario: OCF − capex − k × noncash SBC.
- FCF after withholding: OCF − capex − withholding paid in financing cash flow.
A combined calculation would be OCF − capex − SBC − withholding + overlap already represented in the SBC substitution. The necessary matched-award overlap is not generally disclosed in Company Facts. It remains UNKNOWN, so the report does not publish a falsely precise “fully adjusted” aggregate.
The withholding view records cash paid for employee taxes. The substitution view asks what happens if a noncash compensation addback becomes cash. Adding the full deductions would mix those questions.
Finding 6: later market prices give mixed hindsight results
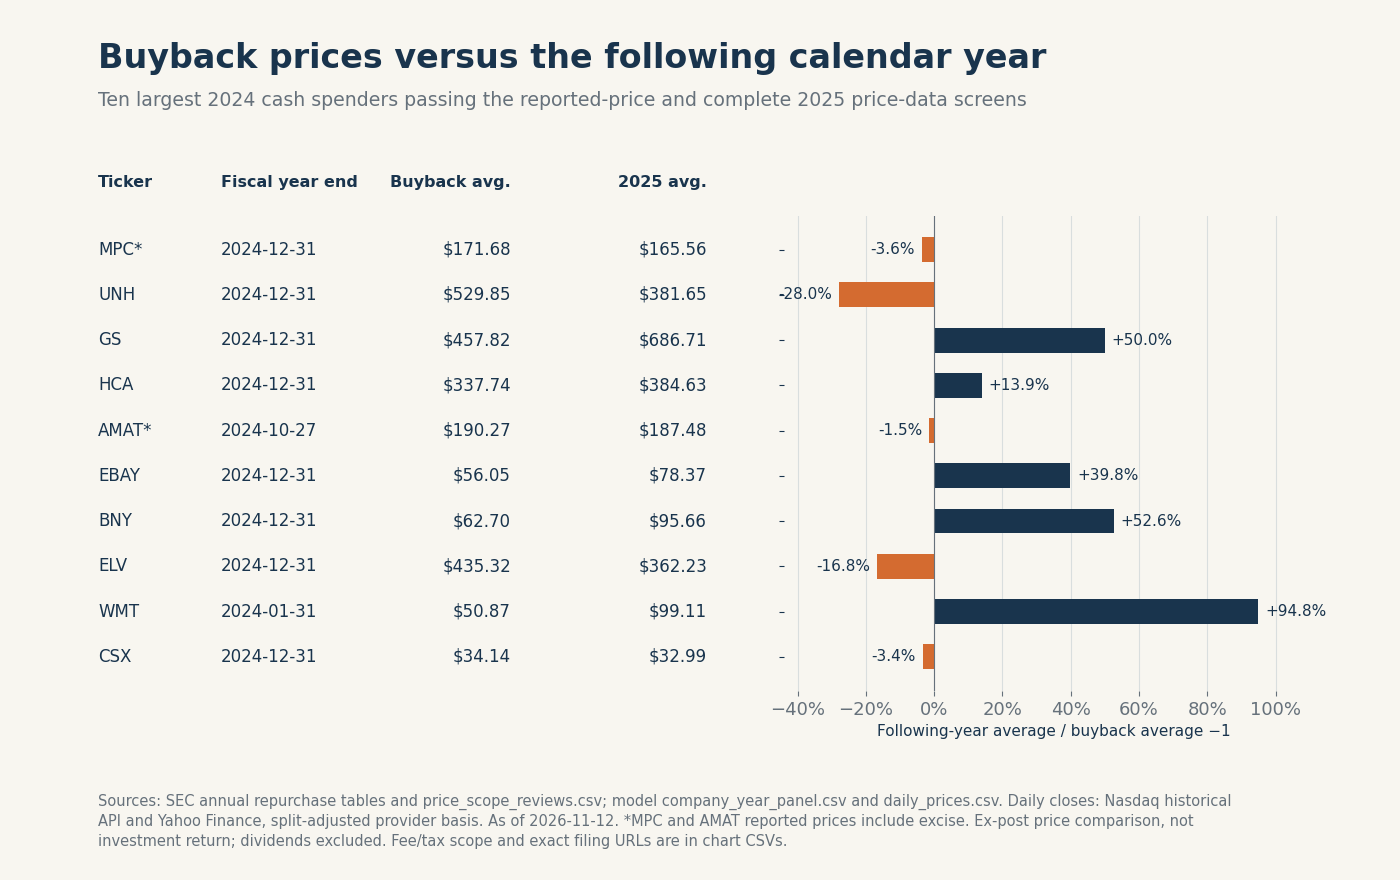
Figure 6. Ten large fiscal-2024 spenders with reviewed annual repurchase-price disclosures and complete 2025 price observations. The comparison is the 2025 average daily close divided by the fiscal-2024 repurchase price, less one. Prices exclude dividends. See the accompanying CSV for all daily observations, source URLs and scope flags.
| Company | Fiscal end | Purchase average | 2025 average close | Later / purchase − 1 | Primary filing |
|---|---|---|---|---|---|
| MPC* | 2024-12-31 | 171.68 | 165.56 | -3.56% | 2025-02-27 |
| UNH | 2024-12-31 | 529.85 | 381.65 | -27.97% | 2025-02-27 |
| GS | 2024-12-31 | 457.82 | 686.71 | 49.99% | 2025-02-27 |
| HCA | 2024-12-31 | 337.74 | 384.63 | 13.88% | 2025-02-14 |
| AMAT* | 2024-10-27 | 190.27 | 187.48 | -1.47% | 2024-12-13 |
| EBAY | 2024-12-31 | 56.05 | 78.37 | 39.83% | 2025-02-27 |
| BNY | 2024-12-31 | 62.70 | 95.66 | 52.57% | 2025-02-27 |
| ELV | 2024-12-31 | 435.32 | 362.23 | -16.79% | 2025-02-20 |
| WMT | 2024-01-31 | 50.87 | 99.11 | 94.84% | 2024-03-15 |
| CSX | 2024-12-31 | 34.14 | 32.99 | -3.37% | 2025-02-27 |
All ten 2025 comparison windows contain 250 daily closes. Prices are dollars per share on the model’s normalized basis. An asterisk identifies a purchase-price measure that includes excise-tax effects. Figures are rounded for display; the CSV shows unrounded values. prices
There is no consistent sign in this selected set. Walmart, BNY, Goldman Sachs and eBay bought below their subsequent calendar-year average prices; UnitedHealth and Elevance bought above them. The sign says where prices subsequently traded. It does not prove whether a board made a good capital-allocation decision with the information then available.
The selection rule is reproducible: start with fiscal years ending in 2024, require at least $500 million of reported repurchase cash, a reviewed annual purchase-price disclosure, an eligible corporate-action history and at least 240 later daily observations, then choose the ten largest qualifying cash spenders. The comparison covers those ten issuers. The full data supplies later one-, two- and three-calendar-year averages wherever eligible.
Timing matters. Walmart’s relevant year ended January 31, 2024. Its reported purchase price already reflects its three-for-one split. Comparing that price with calendar 2025 involves a much longer gap from some executions than a December-ended company’s comparison. Calling both observations “one-year buyback returns” would misdescribe them.
Price scope also matters. Applied Materials disclosed $188.87 excluding excise tax and $190.27 including it; the selected model input uses the inclusive figure and flags that choice. Marathon Petroleum’s reviewed price is inclusive; eBay and CSX explicitly exclude the identified fees or excise effects. The data record these differences so readers can recompute a narrower price comparison using only issuer disclosures that apply the same conventions. prices
The daily market series comes from free Nasdaq historical data, with Yahoo’s public series filling earlier gaps. Nasdaq and Yahoo supply market prices. Issuer filings supply quantities and disclosed purchase averages. Each observation identifies its provider. A corporate filing can verify executed quantities and disclosed averages, but it cannot independently verify every subsequent trading close. The model excludes historical price comparisons affected by ambiguous vendor adjustments.
Finding 7: coverage limits the precision of an index-wide answer
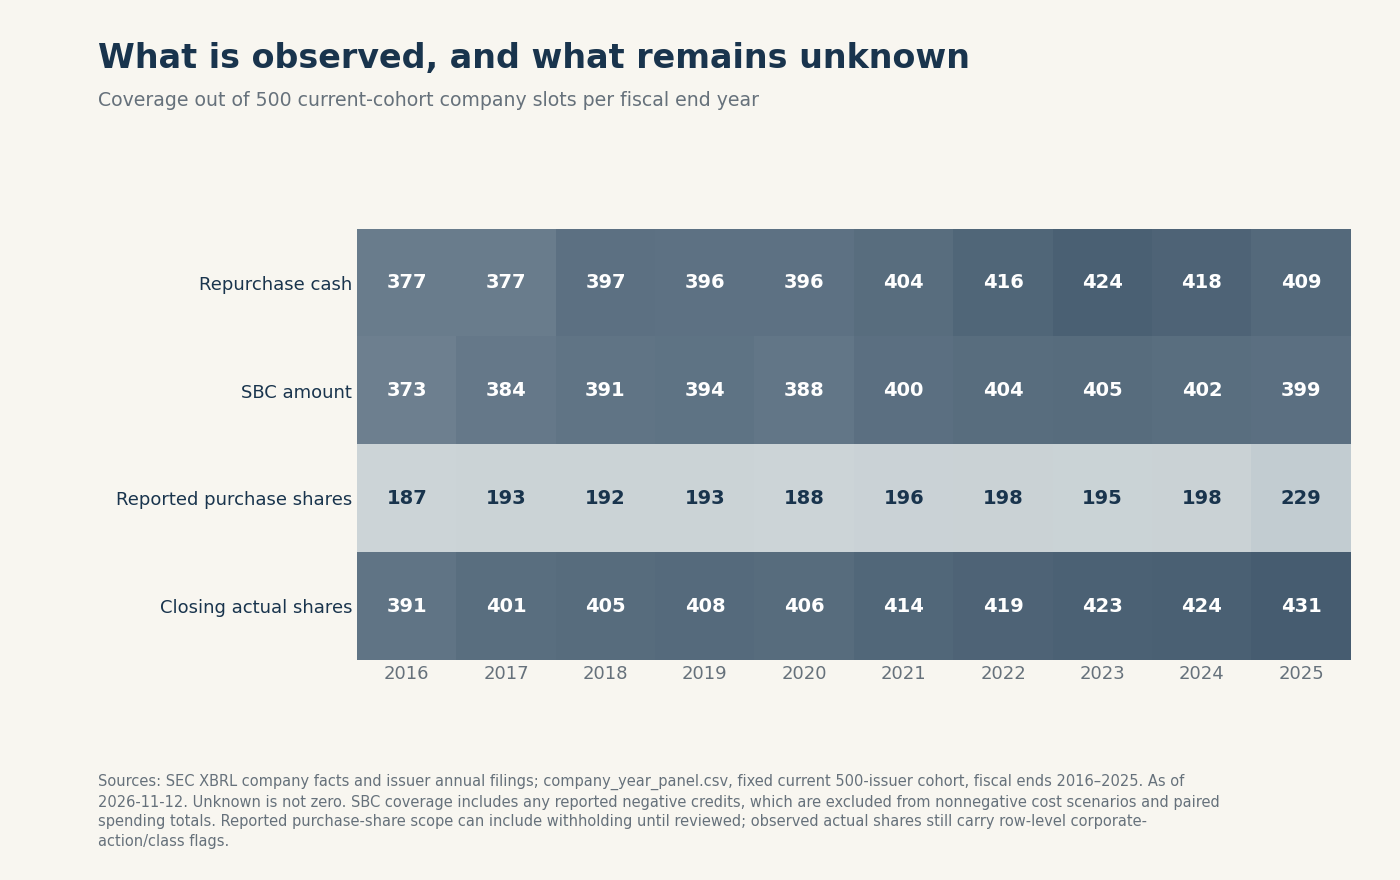
Figure 7. Four input-coverage measures across 500 current issuers and ten fiscal-end years. Missing observations remain UNKNOWN. An observed standard tag is not equivalent to a manual audit. Source: extraction and review ledgers.
The searchable main table contains 5,000 rows: 500 issuers multiplied by ten fiscal-end years. It observes annual periods for 4,825 of them. Repurchase cash is available in 4,014 rows, noncash SBC in 3,940, withholding in 1,840, ending shares outstanding in 4,123, and a usable purchase/share-reduction residual in 1,760. There are 680 annual reported-average-price inputs, fewer than the number of rows with a value/count proxy. data
That is a complete table of requested issuer-year slots, with incomplete measurement. Custom tags, dimensional tables, changed legal entities, multiple share classes and unmatched settlements limit coverage. Automated ShareBasedCompensation selections are provisional noncash-cost proxies until their filing context is checked; unreviewed share bridges and cost/count prices are also provisional. Known unsuitable note amounts are excluded. The aggregate ratio is conditional on that harmonization policy. The report does not fill these gaps with zero to estimate an all-index employee-only dilution percentage.
Manual review covers the 50 largest observed cash spenders, representing 59.19% of observed repurchase cash. The full review ledger contains 84 issuers and 115 source/period records, including additional exception checks. The review is concentrated on annual statements, recent equity bridges and cited historical comparatives; it is not 500 independently audited filings covering every year for the largest 50. Source coverage and the exact fields checked remain visible.
The observed ten-year repurchase-cash total is $7.023 trillion, but it should not be presented as the historical S&P 500's total. This panel uses today’s cohort and fiscal reporting windows. S&P’s published buyback series uses its own contemporaneous index membership and calendar aggregation. Its 2024 total of $942.5 billion provides a comparison under the index’s membership and calendar-year definition. The benchmark ledger lists publication dates and flags differences among the source tables. sp
Negative payment tags and scale anomalies receive targeted treatment. GE’s 2016 −$22.581 billion raw cash tag was corrected to +$22.581 billion only after reviewing the cash-flow statement; other unverified negative payment facts are quarantined. Crown Castle’s 2017 capex sign was similarly checked against its restated comparative. Broadly applying an absolute-value transformation would obscure errors and could manufacture spending. exceptions
Decisive assumptions and sensitivity
The conclusion depends on a handful of choices that readers can change in the workbook.
| Assumption | Base treatment | What changes if it is relaxed |
|---|---|---|
| Constituents | November 10, 2026 cohort, traced backward | A historical-membership panel adds departed firms and removes years before entry; aggregate amounts and ratios can change |
| Compensation cost | One times the identified noncash SBC input | At 0.75 or 1.25 times, the matched nonfinancial FCF deduction changes proportionately |
| Withholding | Cash withholding view | A combined measure requires matched award overlap; assuming it is zero risks double counting |
| Repurchase quantity | Disclosed program count where reviewed; otherwise screened standard fact | Including withholding acquisitions, old treasury cancellations or ASR settlements changes the residual |
| Other issuance | Acquisition, public issue, conversion and other events recorded individually | Treating an unexplained residual as employees overstates attribution |
| Share basis | Fiscal-end shares outstanding, normalized consistently | Weighted EPS shares reflect timing and potential dilution |
| Capex | Positive cash purchases with explicit scope | Adding lease financing, netting incentives or omitting construction changes FCF |
| Later prices | Complete subsequent calendar-year average closes | Fiscal-year windows, execution-date matching and dividends change the result |
The scenario width is material but transparent. A quarter-turn change in the SBC multiplier changes the matched nonfinancial FCF total by $304.684 billion. For Microsoft alone, the low/base/high results are $62.6305 billion, $59.637 billion and $56.6435 billion. The calculations show the result at each of the three cost multipliers.
Some measurement choices are more consequential than the scenario multiplier. A merger share issuance can reverse the sign of a company’s net yield. A noncash exchange for shares of a spun-off company can create a large reduction without cash purchases. An ASR can make current-year cash divided by shares delivered an invalid price. Those are scope decisions to resolve from filings before interpreting the arithmetic.
Evidence that would change the conclusion
A historical constituent file with effective entry and exit dates would permit a true point-in-time index study. That could change the aggregate dollar comparison and sector mix, while leaving the verified individual filing bridges intact.
Complete custom-tag and dimensional extraction could materially improve the missing-observation problem. In particular, consistent employer disclosures of employee shares issued, shares withheld, settlement cash and other issuance would allow an employee-only dilution measure across a much larger share of the universe.
Matched award-cohort data would change the withholding analysis. If the same compensation dollars could be traced from recognized noncash expense to cash withholding and net shares delivered, a combined economic-cost measure could be calculated without an unsupported overlap assumption.
Finally, a verified uniform execution-price series would improve the later-price comparison. A full daily execution schedule, consistent fee and tax treatment, and cash-versus-delivery matching would be stronger evidence than an annual implied average. Until then, the report’s price comparisons remain explicitly qualified hindsight measures.
Input selection, splits and reproducibility
The extraction selects annual 10-K/20-F facts filed by November 12, 2026, using reported start and end dates of 330–380 days. Monetary inputs use the latest qualifying filing. Share quantities and reported per-share purchase prices use the earliest qualifying annual vintage, then apply subsequent splits after that filing date. This reduces double adjustment of comparatives already restated for splits. Short transition periods and absent annual facts remain outside the annual measure.
The tag map prioritizes common-stock repurchase payments over broader equity payments, OCF over its continuing-operations fallback, and diluted EPS shares over a flagged basic-share fallback. The model tracks note expense and selected noncash SBC in different columns. Construction expenditure disclosed outside productive-asset purchases is not silently added or ignored: unreconciled total capex leaves FCF UNKNOWN. Raw and normalized amounts both remain in the source ledger.
Split screening accepts integer or reciprocal-integer stock-split factors provisionally and records ten primary-verified fractional split exceptions. Ambiguous vendor corporate-action factors do not change outstanding share counts; affected historical price comparisons are excluded. Reviewed overrides handle issues including Apple’s historical ASRs, Broadcom and Nvidia split-restated disclosures, Booking’s 25-for-one normalization and predecessor share bases. These controls reduce known errors without representing every automated split or class bridge as independently audited.
Using the files
The workbook labels sourced inputs, formulas and outputs. Blank numeric cells mean UNKNOWN. The source ledger records the selected raw value, transformed value, unit, concept, period dates, filing date, accession and document URL. Reviewed overrides cite their own source and locator; the raw extraction is not overwritten in its ledger.
Seven calculations per main row are live formulas: share reduction, the non-buyback issuance residual, conventional FCF, three SBC-cost scenarios and FCF after eligible financing withholding. Dollar and share units are stated on each sheet. Summary tables and the wider searchable output are saved calculation snapshots; changing an input requires rebuilding those snapshots before publication. The Overview’s highlighted case calculations provide immediate checks on the editable scenarios.
The CSVs include the main panel and the underlying facts, reviewed overrides and filing links. The data also include issuer and sector summaries, annual matched totals and price observations. Split events and other issuance appear in their own tables alongside the ten filing cases. Annual updates for 2026 are kept out of the balanced 2016–2025 headline window. The report is current to November 12, 2026 without comparing an incomplete 2026 fiscal cohort with completed years.
The practical answer is company-specific. Start with the ownership bridge, identify what the cash line includes, and then ask how much cash generation remains when compensation is treated consistently. Apple’s reviewed program mostly reduced outstanding shares. Nvidia absorbed substantial employee issuance. Microsoft ended the year with the same rounded share count. Those are documented outcomes with different mechanisms, and the dataset keeps those mechanisms visible.
Sources and filing notes
- SEC, EDGAR application programming interfaces, accessed 2026-11-12; Apple companyfacts JSON illustrates the entity endpoint. Selected facts include their tag, unit, duration or instant, filing date, accession and source URL. Principal US-GAAP concepts include
PaymentsForRepurchaseOfCommonStock,ShareBasedCompensation,PaymentsRelatedToTaxWithholdingForShareBasedCompensation,CommonStockSharesOutstanding,WeightedAverageNumberOfDilutedSharesOutstanding,NetIncomeLoss,NetCashProvidedByUsedInOperatingActivitiesandPaymentsToAcquirePropertyPlantAndEquipment. Custom tags and dimensional disclosures require the cited filing reviews. Missing facts are not zeros. Unless specified otherwise, page references below are the documents’ printed page numbers. ↩ - State Street, SPDR S&P 500 ETF Trust daily holdings workbook, downloaded 2026-11-12 and explicitly dated 2026-11-10 in the workbook: 503 equity security rows collapse to 500 issuers. Sector classifications come from the same-date iShares IVV holdings file, whose header also states 2026-11-10. See also S&P Dow Jones Indices, S&P U.S. Indices Methodology. The study follows that fixed current cohort backward through fiscal years ending in calendar 2016–2025. It does not reconstruct historical index membership. Holdings weights are not applied to companies’ repurchase dollars; fiscal ends in 2026 appear in the annual update. ↩
- S&P Dow Jones Indices, Q4/full-year 2024 release, 2025-03-19, S&P 500 row in the “20 largest” table: $942.549 billion for 2024, $795.163 billion for 2023, $4.061872 trillion for 2020–2024 and $7.224956 trillion for 2015–2024. The selected five-year figure agrees with the annual sum; a conflicting sector-table total is flagged in the benchmark ledger. The 2016 release, 2017-03-22, sector TOTAL row, gives $572.159 billion for 2015. Subtracting that from the published decade gives $6.652797 trillion for 2016–2024, matching the sum of annual observations. The Q3 2025 release, 2025-12-18, reports quarter and trailing-period figures; none substitutes for a full calendar 2025 benchmark, which was not verified in this study. S&P’s historical constituent universe and calendar periods differ from this report’s fixed-cohort fiscal years. ↩
- FASB, Accounting Standards Update 2016-09, March 2016, printed p. 88 / PDF p. 94, ASC 230-10-45-15(a), and printed p. 115 / PDF p. 121, paragraph BC19. These provisions address financing classification when an employer withholds shares to meet employee tax obligations. Public-company annual effectiveness begins after 2016-12-15, with early adoption permitted. The report’s 75%/100%/125% SBC cash-substitution charges are analytical assumptions. They do not quantify the overlap between recognized compensation and current withholding settlements; the withholding measure follows that cash-flow classification. ↩
- Daily closing-price sources are Nasdaq’s public historical endpoint—for example, AAPL, 2015-01-01 through 2026-11-11—and, where needed, the identified Yahoo Finance chart fallback, retrieved 2026-11-12. Provider and observation dates accompany the raw series. Forward comparisons use each complete subsequent calendar year, through 2025, on a consistent split basis; they exclude dividends and are not realized investment returns. Ambiguous spin-off or other corporate-action price adjustments are excluded from the affected historical comparisons. Price definitions also differ: Applied Materials’ FY2024 equity table, filed 2024-12-13, reports $190.27 including excise and $188.87 excluding it; Marathon Petroleum’s 2024 equity table, filed 2025-02-27, footnotes (a)–(b), includes excise in $171.68. eBay’s 2024 Form 10-K, filed 2025-02-27, Note 13, p. 105, excludes commissions and excise accruals from $56.05; CSX’s 2024 Form 10-K, filed 2025-02-27, Note 3, p. 64, excludes excise from $34.14. The relevant standard concept is
TreasuryStockAcquiredAverageCostPerShare; the rendered tables determine its scope. ↩ - GE, 2016 Form 10-K, filed 2017-02-24, Note 26, p. 206, and common-share disclosures, pp. 177–178: $22.581 billion is program cash paid, despite its negative outflow presentation; other treasury purchases and dispositions are separate. GE’s 2025 Form 10-K, filed 2026-01-29, cash flows p. 38 and Notes 16–17, pp. 64–65, distinguishes $7.551 billion cash purchases from $7.412 billion program cost. Its compensation note gives $325 million after tax. The noncash cash-flow addback remains unknown. Crown Castle, 2019 Form 10-K, filed 2020-03-10, Note 2 historical-adjustment table, p. 60: restated 2017 OCF is $2.032 billion and capex is a $1.217 billion cash outflow, following an $11 million adjustment to the original $1.228 billion. The standardized capex deduction is positive. Separately, its 2025 Form 10-K, filed 2026-02-23, cash flows p. 60 and Note 11, p. 82, identifies the 2023–2025 purchased shares as award withholding: $30 million, $33 million and $23 million. These payments are not added to themselves as program buybacks. ↩
- Amazon, 2018 Form 10-K, filed 2019-02-01, consolidated cash flows, 2016 comparative investing activities,
us-gaap:PaymentsToAcquireProductiveAssets. Gross cash property-and-equipment purchases of $7.804 billion and incentives on their own line of $1.067 billion reconcile to the earlier $6.737 billion net amount. The model uses the gross amount to match later years’ scope. Financing-lease principal and noncash leased-asset additions are excluded from this cash-capex definition. The model preserves the originally selected net fact and the correction’s source. Amazon’s 2025 Form 10-K, filed 2026-02-06, consolidated cash flows and supplemental cash-flow information, reports $131.819 billion purchases, $3.499 billion sales and incentives, $1.557 billion financing-lease principal and $2.911 billion noncash lease additions. The cash-capex model uses the first amount; it does not add the lease measures. ↩ - Apple, 2025 Form 10-K, filed 2025-10-31, fiscal end 2025-09-27: cash flows p. 33; exact actual-share bridge in Note 10, pp. 44–45; awards in Note 11, pp. 45–46. 2026 Form 10-K, filed 2026-11-03, cash flows p. 36, provides subsequent 2025 comparatives. Cash paid and rounded program cost use their reported bases. ↩
- Apple, 2017 Form 10-K, filed 2017-11-03, Note 7, pp. 60–61, including 2016 comparatives; and 2016 Form 10-K, filed 2016-10-26, share-repurchase disclosures. ASR contract payments and final deliveries crossed fiscal years. The model therefore does not divide whole-year cash by deliveries to manufacture an annual execution price. Open-market subsets remain subsets. Original share quantities are adjusted for the subsequent 2020 four-for-one split, documented in Apple’s investor FAQ, accessed 2026-11-12. ↩
- Nvidia, 2025 Form 10-K, filed 2025-02-26, fiscal end 2025-01-26: equity p. 55; cash flows p. 56; split presentation in Note 1, p. 57; SBC in Note 3; repurchases in Note 14, p. 77. 2026 Form 10-K, filed 2026-02-25, cash flows p. 55, supplies subsequent 2025 comparatives. Share quantities already reflect the 2024 split. ↩
- Microsoft, 2025 Form 10-K, filed 2025-07-30: cash flows p. 53; Note 15, p. 79. Cross-checks: issuer annual report and 2026 Form 10-K, filed 2026-07-29, FY2025 comparatives, cash flows p. 53 and Notes 15/17, pp. 79–82. The withholding note and share counts are rounded; the model does not imply greater precision. ↩
- Alphabet, 2025 Form 10-K, filed 2026-02-05: equity p. 51; cash flows p. 52; Note 11, p. 78; Note 13, p. 82. Aggregate A/B/C shares once. The net award-payment and equity-withholding-and-other rows cannot isolate withholding cash. ↩
- Meta, 2025 Form 10-K, filed 2026-01-29: equity p. 91; cash flows p. 92; acquisition Note 8, p. 109; Note 12, pp. 119–120. Acquisition equity has no disclosed share count that this study could isolate; generic issuance is not assigned wholly to employees. ↩
- Broadcom, 2025 Form 10-K, filed 2025-12-18, fiscal end 2025-11-02: capital returns p. 42; cash flows p. 50; equity p. 51; VMware Note 4, p. 60; Note 11, pp. 77–80. The common-stock-issued row is not an employee-only classification. ↩
- Johnson & Johnson, 2025 Form 10-K, filed 2026-02-11, fiscal end 2025-12-28: treasury Note 12, p. 78; compensation Note 16, pp. 80–82; Kenvue Note 21, p. 106. Outstanding shares equal issued less treasury. The Kenvue exchange is a noncash reduction in outstanding shares. ↩
- Chevron, 2025 Form 10-K, filed 2026-02-24: equity p. 69; Note 3, p. 74; compensation Note 22, pp. 95–97; Hess Note 29, p. 105. Inline fact f-727, tagged PaymentsRelatedToTaxWithholdingForShareBasedCompensation, is rendered as repurchase excise tax and excluded from employee withholding. ↩
- IBM, 2025 annual report, Exhibit 13, filed 2026-02-24: printed annual-report pp. 44–47 for balance sheet, cash flows and equity; Note R, p. 94; Note T, pp. 100–102. Page numbers refer to the exhibit. ↩
- RTX, 2025 Form 10-K, filed 2026-02-06: cover p. 2 dates outstanding shares at 2025-12-31; cash flows p. 67; equity p. 69; Notes 18–19, pp. 103–105. The opening balance is explicitly dated 2024-12-31 on p. 2 of the 2024 Form 10-K, filed 2025-02-03. Retirement matching shares differ from incentive SBC. ↩
Supporting material
- Excel model ↗Sourced inputs, live calculations and reported outputs.
- Source and model data (CSV collection) ↗Data tables, source references and calculation exports.
- Source documents ↗Download as CSV.
- Buybacks searchable ↗Download as CSV.