Financial systems
Who owns Austin’s apartments?
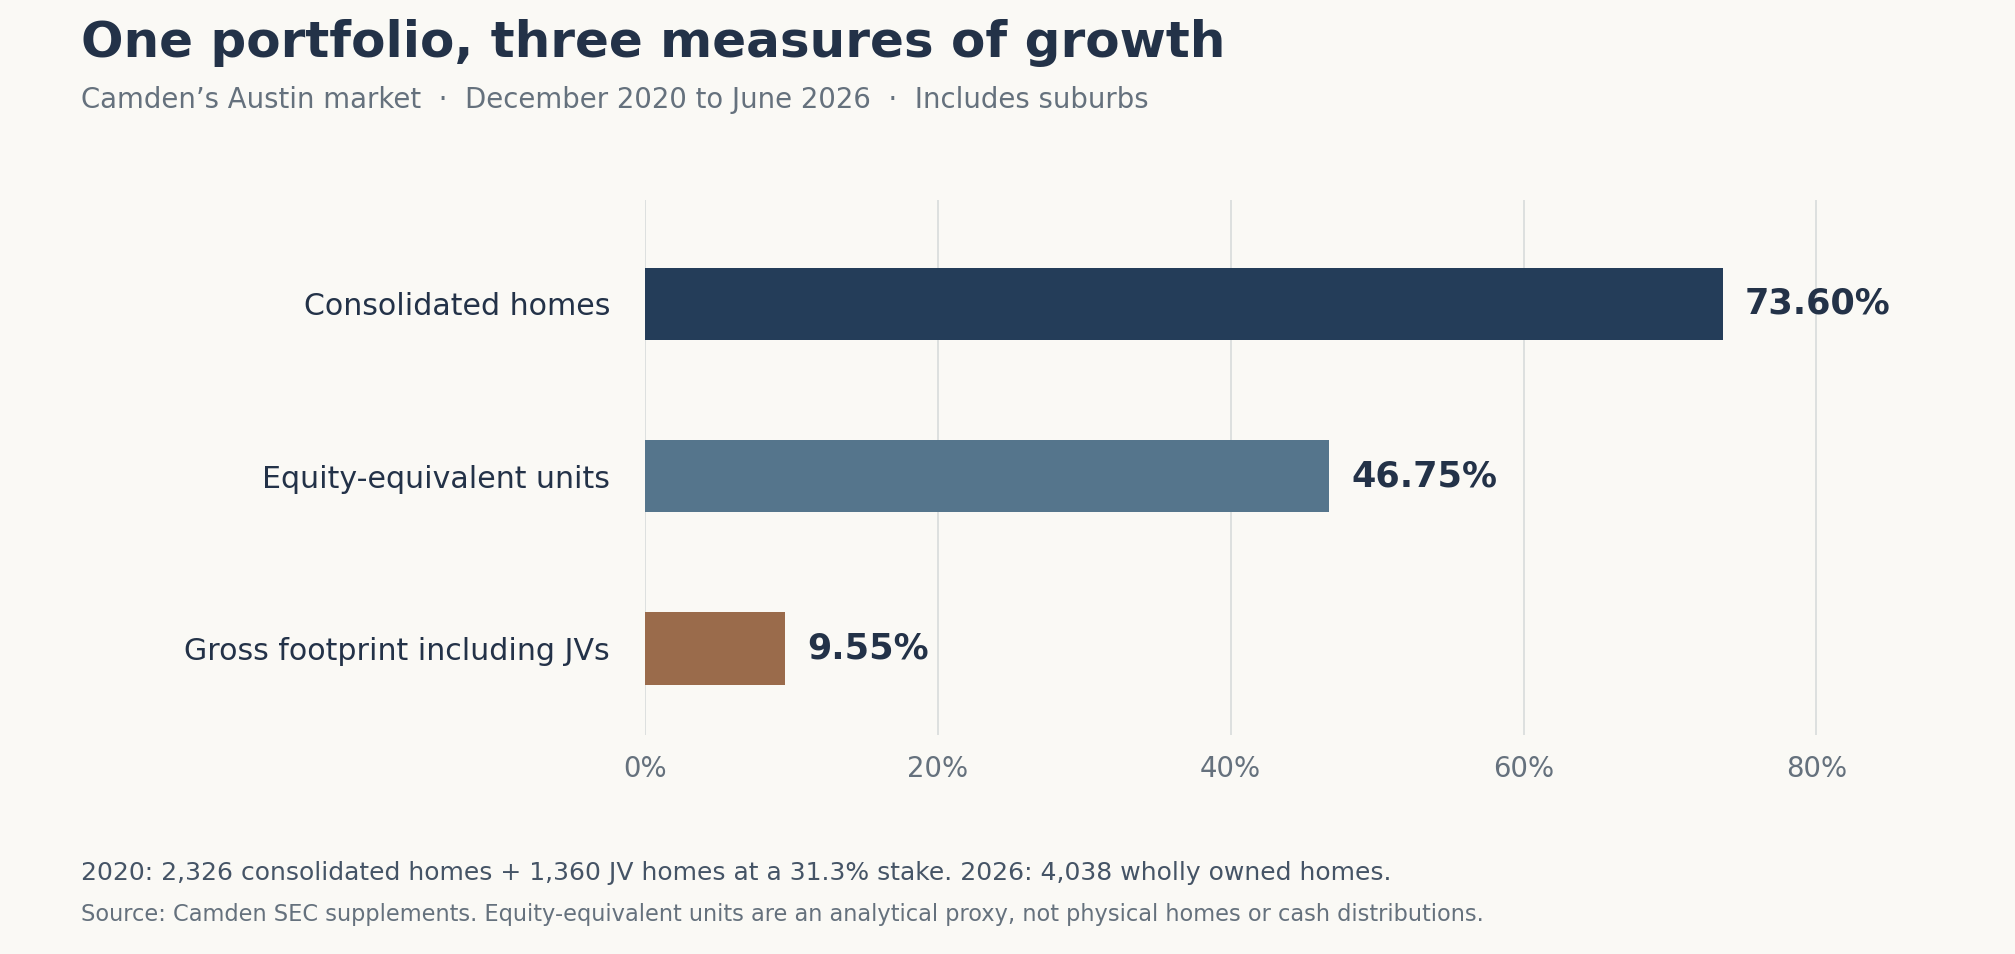
Camden’s Austin holdings grew 73.6% in its consolidated accounts but only 9.6% in physical footprint. Buying a pension partner’s stake explains much of the difference.

Austin’s apartments belong to REITs, private funds, local sponsors and public-private partnerships that often overlap. Camden captures the counting problem: its consolidated Austin homes rose 73.6%, while its physical footprint including co-owned apartments rose only 9.6%.
Method & limits
research through October 30, 2026. The Travis register contains 986 large-apartment appraisal accounts in Austin’s city taxing jurisdiction, with a 51-account Williamson supplement and selected ownership matches. Accounts, complexes, homes and student beds have different units. Citywide owner-type shares and realized exemption-to-rent savings remain unmeasured. Advertised rents describe different available units; statutory illustrations use declared inputs.
Midtown Commons: public title and private investment
At Midtown Commons, near Crestview station, the landlord question has several answers. The 2026 appraisal roll records the Housing Authority of the City of Austin as title holder. The housing authority’s board records identify Belveron, a San Francisco investment firm, as the private partner. Apartment Management Professionals was identified as the manager. The approved financing included a Fannie Mae loan through Bellwether. These are different roles in the same apartment complex.
The transaction is more than a board proposal. Travis Central Appraisal District account 760829 records a February 25, 2025 deed, instrument 2025020097, and an exemption beginning that date. The July 2026 certified roll values the property at approximately $128 million. The board packet describes 562 apartments. The final investor profit split and rent savings received by tenants remain unmeasured. S1, S2
This is the central finding: legal title, investment ownership, operating control and tax status need their own columns. A public-versus-private pie chart would put Midtown in one category and lose much of what matters. A REIT-versus-private-equity-versus-local chart has the same problem: those labels describe different dimensions and can overlap.
The research assembled a register of 986 large-apartment appraisal accounts in Austin’s Travis County taxing jurisdiction; a Williamson County supplement; a 48-property crosswalk to documented owners or operating platforms; and links between dated appraisal snapshots and two major existing public datasets. Citywide beneficial ownership remains incompletely traced. Three findings survive the source checks:
- Camden’s Austin-market growth is 73.60%, 46.75% or 9.55%, depending on the right being counted. A purchase from the Texas teachers’ pension system explains much of the difference.
- Public ownership maps cannot safely be added row by row. The downloaded private-equity map includes an entire apartment campus and several of its component villages, as well as existing and proposed housing at one redevelopment address.
- A statutory affordability calculation is not necessarily money received by residents. Texas’s 2026 HFC audit rules correct one form of subsidy double counting but still allow imputed rent reductions for vacant apartments.
What the existing work answers—and where it stops
There is already substantial work here. The sources measure different parts of the market.
| Source | What it contributes | Boundary on its use |
|---|---|---|
| Apartment directories | Names, addresses and management brands. | A management portfolio is not an ownership portfolio. A company can manage apartments for unrelated investors. |
| Private Equity Stakeholder Project, May 2026 update | Reports 302 properties and 89,907 units associated with private-equity firms in the Austin metro, or 30.9% of apartments. | Metro, not city; its broad firm universe and development pipeline need to remain attached to the estimate. The downloadable map is not a verified current-stock census. |
| UT Housing Policy Clinic, December 2025 report | Finds 152 local-public-entity partnerships with at least 34,800 units in Travis County as of mid-2024; estimates roughly $109 million in annual property-tax exemption value. | A defined county partnership cohort, with exclusions; the tax figure is a static estimate, not an audited total of current government revenue losses. |
| Andrew Messamore’s Austin research | The 2023 working-paper abstract reports that owners with more than 100 rental units did not increase their share after 2010, while single-property landlords became more numerous. | A challenge to the automatic consolidation story. The full paper was not retrieved here, so its underlying geography and methods were not independently replicated. |
Sources: directory; PESP tracker; UT report; Messamore abstract.
PESP’s metro percentage and UT’s county partnership percentage cannot be added. They cover different places, different dates and overlapping ownership structures. A private investment firm can be the economic partner at a publicly titled property.
The methodological problem is broader than Austin. A 2026 NBER working paper traces ownership through deeds, assessments, confidential business records, IRS partnership filings and SEC reports. It finds that the common shortcut of grouping properties by mailing address can both understate and overstate portfolios. That supports a conservative rule here: a shared mailing address starts an inquiry. Common beneficial ownership needs the deeds and company interests. S7
What appears settled is the importance of professional investment platforms and the scale of exemption-backed partnerships. What remains contested or unmeasured is their exact current city share, how much control has consolidated, and how much of each tax benefit reaches residents. Those are the gaps this investigation tests.
The people behind the property names
The ownership crosswalk combines appraisal accounts, corporate property schedules, acquisition announcements and current portfolio pages. It records the strength and date of each link. Its selected cohorts look like this:
| Documented platform | Reviewed inventory | Inventory linked to Austin city-tax accounts | What the link shows |
|---|---|---|---|
| Mid-America Apartment Communities (MAA) | 21 communities; 7,179 homes | 13; 4,461 homes | Public REIT ownership; SEC schedules and current property listings reconcile to September 2026 market totals. |
| Camden Property Trust | 12 SEC properties; 4,038 homes | 7; 2,522 homes | Public REIT ownership; June 2026 market total, prior individual property schedule and current portfolio checks. |
| Bell Partners | 5 communities; 2,495 homes | 5; 2,495 homes | Named Bell property funds and investment-management platform; fund investors’ identities and exact shares remain unresolved. |
| AMLI | 10 operating communities; 3,117 homes | 10; 3,117 homes | Operating-platform inventory. AMLI’s parent fund is known, but this is not a proven sole-beneficial-ownership total for that fund. |
Original reconciliation: see the accompanying property crosswalk for every account, source URL and date. Primary anchors: MAA Q3 2026; Camden Q2 2026; Bell portfolio; AMLI portfolio.
The cohorts are deliberately selected. A ranking of Austin’s largest owners requires citywide unit counts. The 35 city-account-linked communities contain 12,595 homes, but that platform inventory leaves citywide market share and building-by-building municipal coverage unmeasured. AMLI North Park’s property-level investment interest is unresolved. Several individual AMLI unit counts rely on current apartment listings and carry a lower confidence rating.
One leasing brand can contain several funds. Bell Southpark’s 949 apartments span three legal accounts and two investment funds. Bell’s 2021 announcement describes buying 619 homes for Fund VII and combining operations with its existing 330-home community; appraisal names identify Fund VI and Fund VII. One grouping answers who operates the community; another answers whose fund owns each phase. S12
Bell’s platform itself joined BGO under Sun Life in July 2026. That identifies the parent of the investment manager; it does not make Sun Life the sole beneficial owner of every Bell-managed apartment. AMLI likewise identifies its owner as PRIME Property Fund, an open-ended institutional real-estate fund managed by Morgan Stanley. “Morgan Stanley owns it” collapses a fund, its investors, its adviser and its operating subsidiary into one name. S13, S14
Even “REIT versus private equity” is not a clean split. Blackstone’s acquisition of American Campus Communities used Blackstone Real Estate Income Trust and another Blackstone fund. A property can therefore be held through a REIT and a private-equity-managed investment structure. Student-housing beds also must not be mixed with apartment units. S15
“Local” needs its own definition. A sponsor headquartered in Austin, a manager with an Austin office, a Texas pension investor and an LLC receiving mail in Austin are four different things. In the Travis register, 425 of 986 accounts have an out-of-state mailing address. That is a reproducible mailing statistic—not evidence that 43.1% of Austin’s apartments are owned outside Texas. The owner-unit denominator and the residence of the ultimate investors are both missing.
A local nonprofit can also sponsor private equity. Texas Housing Conservancy, based in Austin and formerly called Affordable Central Texas, describes its investment structure as an open-ended social-impact private-equity fund. Its current portfolio includes the 183-unit Melrose Trail at 13005 Heinemann Drive. The 2026 appraisal account, 273228, names the Housing Authority of the City of Austin. Local sponsorship, nonprofit management, private investment and public title coexist at one property. Those four labels cannot be four slices of a pie. S16, S17
How a landlord can grow 74% without adding 74% more homes
Camden provides an unusually clean test of the consolidation story because its filings disclose both wholly consolidated apartments and joint ventures.
At the end of 2020, Camden reported 2,326 consolidated Austin-market homes. It also held a 31.3% interest in ventures containing another 1,360 homes: Amber Oaks, Amber Oaks II, Brushy Creek and Shadow Brook. By June 2026, its wholly owned Austin-market portfolio contained 4,038 homes. S18, S9
| Measure | 2020 | 2026 | Growth |
|---|---|---|---|
| Consolidated homes | 2,326 | 4,038 | 73.60% |
| Units weighted by Camden’s disclosed equity stake | 2,751.68 | 4,038 | 46.75% |
| Entire physical footprint, including co-owned homes | 3,686 | 4,038 | 9.55% |
The middle row is an analytical measure: 2,326 + (1,360 × 31.3%). It expresses proportional investment exposure in unit equivalents. It does not describe fractional physical apartments, rent-setting authority or the contractual partnership distribution waterfall.
In April 2022, Camden bought the remaining 68.7% of its fund partnerships from the Teacher Retirement System of Texas. The same apartments moved from partial pension-fund co-ownership into Camden’s consolidated portfolio. This was a real increase in Camden’s economic interest. It was also a much smaller increase in its physical footprint than the consolidated count suggests. S19
Here the apparent “institutional takeover” was partly a transfer between two kinds of institutional capital, one of them a Texas public pension system. The transaction changes the capital map even where the housing map barely changes.
The opposite hypothesis also deserves a test. MAA’s completed Austin-market inventory increased from 7,117 homes at the end of 2020 to 7,179 in its September 2026 supplement: just 62 homes, or 0.87%. That does not disprove rising concentration elsewhere. It does reject the shortcut of treating two prominent REITs’ visibility as proof that both rapidly accumulated additional Austin apartments. S20, S8
Before counting owners, count the homes correctly
The starting dataset is the 2026 certified appraisal export. Austin’s taxing code locates the city’s apartment accounts more precisely than an “Austin” mailing address. Filtering Travis records for large-apartment improvement classes and the City of Austin taxing code produces 986 accounts. Their aggregate roll market value is $40.54 billion. Accounts are not complexes: one community can span land, improvement, phase and auxiliary parcel accounts.
The Williamson County extraction identifies 51 multifamily accounts with Austin’s city taxing code. It uses a broader classification, includes some cross-county properties and carries a different owner snapshot date. Adding 51 to 986 would not produce a count of Austin apartment complexes. Nor does this exhaust Austin’s Hays County portion.
The PESP map presents another aggregation problem. Riata appears as a 2,047-unit master community and as five named components totaling 1,218 units. A naive sum produces 3,265. Riata’s own website describes one community with eight villages; its village pages and Austin Water’s legal-user records confirm the component relationship. S21, S22, S23
At 500 South Congress, the downloaded map has existing-property entries of 115 and 120 units plus an 800-unit redevelopment entry. Related’s current project page describes a future mixed-use redevelopment with a 2029 completion date and both rental and condominium residences. Existing homes, proposed homes and condominiums need different fields. S24
These checks show why the public map cannot simply be totaled. PESP’s published 30.9% estimate may use a different or deduplicated dataset. The downloaded rows alone cannot test its headline calculation. The release preserves the source rows and warnings instead of silently replacing PESP’s estimate with a speculative correction.
Across the Austin-area source extract, 288 map rows were included, 195 linked to Austin city-tax accounts, and 29 received specific overlap or duplicate warnings. These are research-coverage counts. None is presented as a total of unique occupied complexes.
The tax question is bigger than PFCs
The UT property appendix demonstrates why Chapter 303 alone is too narrow a frame. Its 152 partnership rows classify 19 under Chapter 303, 62 under Chapter 392 and 71 under Chapter 394. Those are respectively public facility corporations, housing authorities and housing finance corporations. The labels look similar; their legal obligations differ.
| Route | What matters for the audit |
|---|---|
| Chapter 303 · PFC | The 2023 reforms add affordability, approval, underwriting and audit requirements for covered deals, with grandfathering and exceptions. The 60% tax-benefit test for specified occupied acquisitions is not a universal rule for every PFC development. |
| Chapter 392 · Housing authority | A different exemption route. The statute does not simply import Chapter 303’s rent-discount and audit regime. Local agreements can add obligations. |
| Chapter 394 · HFC | The 2025 reforms add standards and audits, with LIHTC exceptions and transition rules. The ongoing 50% rent-reduction standard has a shortfall-payment alternative. |
Primary law: Chapter 303; Chapter 392; Chapter 394; HB 2071; HB 21.
For older HFC deals, an audit being due in 2026 does not mean every new rent or income standard already applies. HB 21 sets the deadline for specified requirements at the earlier of the end of the tenth tax year following effectiveness, or the end of the first tax year following the tax year of refinancing, title transfer or a change in majority beneficial ownership. A finding of noncompliance must first identify the right law, approval date and applicable transition rule.
The UT report’s approximately $109 million figure estimates the scale. It applies an average sampled tax rate to appraisal values. A deal-level calculation needs the tax jurisdictions, relevant taxable interests, partial-year treatment, shortfall payments and public receipts. A gross exemption is also different from net school-finance loss: the Legislative Budget Board describes costs shifted through the state funding formula. S30
The economic mechanism is straightforward. Removing property-tax expense can raise the cash available to investors and lenders. Rent concessions and payments to the public partner absorb some of that gain. The rest can support a higher acquisition price, additional borrowing or investor returns. At an existing building, a transfer to exempt title does not itself add an apartment. The public return has to be found in affordability, preservation, access, services or cash received.
What “affordability delivered” should mean
Arboretum Oaks provides a direct comparison of advertised offers. Its July 2026 appraisal record names Texas Essential Housing Public Facility Corporation and carries an exemption flag. On October 30, its official availability page advertised a 600-square-foot A1 market unit from $1,120, while A1 “Affordable” quotes were $1,170–1,185. Other advertised ranges also overlapped. S31
These are different apartments, amenities and availability dates. Fees and concessions were not fully observed. The quotes therefore do not prove that restricted tenants pay more for identical housing, or that this deal produces no benefit. An affordable designation still needs a measured discount against a credible comparable rent.
A 2026 correction reveals a subsidy-attribution problem
Texas’s HFC audit rule initially counted only a voucher household’s own payment when measuring rent reductions. That could credit the property with a discount financed by the housing authority’s voucher contribution. The final amendment effective June 24, 2026 removes that treatment: the voucher payment also counts as rent revenue. S32
Austin objected. Its comments argued that some non-LIHTC supportive housing depends on the combination of vouchers and property-tax exemption. TDHCA acknowledged the concern but said resolving it would require a statutory change. This is not evidence that properties have closed. It is evidence of a real measurement tradeoff: correct attribution of rent subsidies can still omit the value and financing needs of supportive housing.
A vacant apartment can contribute to the statutory benefit calculation
The adopted HFC rules assign the maximum permitted restricted rent to vacant restricted units for vacant months. A discount against the market comparator can therefore enter the calculation even when no resident receives it. The rules define comparable unit type by bedroom count, while comparability also depends on size, condition and concessions. The official market measure is based on average annual rent charged for unrestricted comparable unit types—not simply the highest advertised asking rent. S33
There should be two visible measures: the statutory compliance calculation and the discount delivered to occupied households. The second requires occupied-unit rents and months in addition to the compliance calculation.
Half the tax break need not all become rent reductions
Chapter 394 allows an HFC user to pay taxing jurisdictions the shortfall when measured rent reductions fall below half of estimated otherwise-due property taxes. Consider a hypothetical transaction:
| Annual amount | Illustration |
|---|---|
| Otherwise-due property tax | $1,000,000 |
| Measured rent reductions | $200,000 |
| Required shortfall payment | $300,000 |
| Net tax cost before other public receipts | $700,000 |
| Rent reductions / net tax cost | 28.6% |
The payment can satisfy this limb of the ongoing requirement; all other applicable rules, initial underwriting and stronger local conditions still matter. The example shows why rent benefit, gross exemption and payments back to government need their own entries. It is not evidence that an Austin property uses this option.
The public partner can receive more than a nominal fee
Austin’s October 2026 partnership terms also test the opposite of the “public gets almost nothing” story. For prospective AHFC deals, the stated terms include a share of development fees, annual payments tied to the exemption, and 50% of net operating and capital-event cash flow. They require minimum rent reductions for non-LIHTC partnerships and additional affordability conditions. These are published terms for prospective partnerships, subject to deal-specific revision and executed agreements; payments received at legacy properties require their executed agreements and accounts. S34
A public share of “net cash flow” is meaningful only after reading the deductions and waterfall. Fees earned by a housing agency also are not the same as taxes restored to every school district, county or other affected jurisdiction. Both can be public benefits, but their recipient and use must be shown.
The public partner can also need to put in more money. In April 2026, Austin authorized up to $2.5 million of additional public equity for the 108-unit Preserve at Central Park. Staff said lower rents and demand prevented refinancing the full balance of a maturing seller loan; the Texas Housing Conservancy partner was expected to contribute an equal amount. The public money was to come from Project Connect anti-displacement funds. The authorization leaves disbursement and the eventual investment result to be checked. It shows why a deal’s public balance sheet must include capital contributions and risk as well as fees and rent restrictions. S35, S36
A similar accounting problem appears in Austin’s hospital exemptions: a reported benefit can include activity paid for by another public program. For housing, the corresponding test asks which rent reduction the exemption itself delivered after other subsidies and the property’s existing rents are accounted for. Each program needs its own contract and measured result.
A ledger that would answer the public’s question
The unit that connects the housing and tax questions is a property-month linked to a dated ownership chain and a subsidy ledger. That supports two different sets of measures.
For ownership, count completed homes once; record who controls pricing and major decisions; document the disclosed fund or equity interests; identify the public title holder, manager and lender in their own fields. An acquisition of another partner’s stake should change the investment measure even where the operational footprint stays constant.
For public return, first calculate the gross otherwise-due tax for each property and taxing jurisdiction. Then record shortfall payments, payments in lieu of tax and public-partner receipts. Also measure the occupied households receiving a discount, its duration, tenant access, preserved or newly built homes and supportive services. Other subsidies belong in the denominator when evaluating a combined subsidy package.
A transparent research measure of annual direct rent benefit would sum occupied months multiplied by the positive difference between a credible comparable effective rent and the rent the tenant pays. Both rents should include mandatory fees and utility treatment, deduct concessions and identify voucher contributions. Negative differences should appear as a warning alongside positive discounts. This proposed research measure goes beyond the statutory formula.
The harder term is the counterfactual: what would the property have charged or built without the exemption? Same-property unrestricted units provide a comparison, but they do not automatically identify that counterfactual. Nearby matched properties, pre-conversion trends and sensitivity ranges would make the assumption inspectable. For new construction, the claim that the subsidy enabled construction needs a project feasibility test.
Eviction filings deserve the same discipline. A filing is not necessarily an eviction, and several filings can concern one household. An owner comparison needs stable property IDs, exact ownership dates and a denominator such as occupied unit-months, with controls for property type, location and tenant mix. BASTA already makes Travis filings searchable; the missing analysis is the dated ownership join and credible comparison design. S37
This research did not obtain full per-property financial audit calculations or tenant-level rent rolls and does not calculate an exemption-to-rent-saving ratio. The retrieved monitoring letters were not substitutes. At Citizen House Bergstrom, for example, the adverse July 2025 findings were followed by a corrective-action letter closing the review. Reporting only the earlier notice would turn an old problem into an unsupported current allegation. S38
The statutes make the audits disclosable with tenant information redactable. Whether every underlying private working paper can be obtained depends on disclosure rights. The data release identifies the exact missing records: completed audits and supporting calculations, monthly rent and occupancy data, charges and concessions, executed ownership and ground-lease agreements, and public fee and distribution receipts.
What would change these conclusions
| Conclusion | Confidence and reason | What would change it |
|---|---|---|
| Camden’s reported growth differs sharply from footprint growth. | High. Independent dates, property lists, JV percentage and transaction announcement reconcile. | A corrected filing or evidence that apparently persistent properties conceal unreported changes in unit counts or ownership. |
| The downloaded map contains overlapping physical stock. | High for identified cases. Campus/village descriptions and independent municipal records corroborate the relationship. | Evidence that the rows represent nonoverlapping homes. PESP’s own aggregation code could show its headline already corrects these overlaps. |
| HFC statutory rent reduction differs from realized household benefit. | High as a reading of the adopted rule. Vacancy imputation is explicit; the extent in Austin is unmeasured. | Property audits showing no material imputed vacancy benefit; a changed rule; or tenant-level calculations showing the two measures coincide. |
| Public-private deals can have meaningful public economic rights. | High for current published terms; dollars received remain unknown. | Executed agreements, audited receipts or waterfall deductions showing substantially different realized returns. |
| Exact citywide owner-type shares remain unresolved. | No defensible point estimate from this work. Units, overlapping categories, missing investors and geography prevent one. | A deduplicated completed-property universe with current unit counts and evidence-backed control and investment links across the city’s counties. |
Austin’s apartment market is partly a market in homes and partly a market in claims on those homes: rights to operate, collect income, hold title, borrow and receive tax treatment. The public gets a clear answer only when those rights are followed through to the people making decisions and the residents or public bodies receiving the money.
Data release and reproducibility
Research cutoff: October 30, 2026. Appraisal snapshots: Travis certified roll July 18, 2026; Williamson current-owner extract October 29, 2026, alongside dated certified 2026 values. Williamson’s current-owner export carries a 2027 tax-cycle label; the release does not mislabel it as the certified 2026 owner snapshot.
Included: the 986-account Travis register with documented and externally reported links in different fields; 51-account Williamson supplement; 48-property platform crosswalk; 152-property UT source crosswalk; 288-row PESP review crosswalk; 15 advertised rent observations; selected deal evidence; historical reconciliation; source audit examples; field dictionary; source manifest and validation results.
Matching: normalized address joins, then explicitly reviewed address/DBA variants. Fuzzy candidates remain unverified suggestions. UT matches comprise 123 normalized-address matches and 11 manual matches. No mailing street addresses or tenant identities are included in the public files.
Important exclusions: no inferred local-owner residual; no citywide unit denominator, market share or concentration index; no completed Hays County census; no assumption that an exemption code identifies a PFC; no sum of phased properties, campus/components, pipeline projects or student beds as apartment units. Unit counts were not manufactured from appraisal fixture counts or empty improvement-unit fields.
Source conflicts: UT’s appendix and prose contain differing non-LIHTC counts, and its land-only exemptions require special treatment. PESP’s map dates and row universe are not assumed identical to its published headline. Official approval terms are distinguished from executed agreements and realized public receipts.
The housing count and the capital map need different measures
Completed homes need counting once; control, investment exposure and public benefit need their own measures. A transfer can change who receives the rent without adding a home. A tax exemption earns its public value through the housing and other benefits it delivers.
Sources
- HACA February 20, 2025 board packet: Midtown CommonsVerified Oct 30, 2026
- TCAD 2026 certified appraisal rollVerified Oct 30, 2026
- directoryVerified Oct 30, 2026
- PESP trackerVerified Oct 30, 2026
- UT reportVerified Oct 30, 2026
- Messamore abstractVerified Oct 30, 2026
- NBER working paper on tracing ownership through property and company recordsVerified Oct 30, 2026
- MAA Q3 2026Verified Oct 30, 2026
- Camden Q2 2026Verified Oct 30, 2026
- Bell portfolioVerified Oct 30, 2026
- AMLI portfolioVerified Oct 30, 2026
- Bell Southpark acquisition and fund interestsVerified Oct 30, 2026
- BGO and Bell Partners platform transactionVerified Oct 30, 2026
- AMLI: PRIME Property Fund ownershipVerified Oct 30, 2026
- Blackstone acquisition of American Campus CommunitiesVerified Oct 30, 2026
- Texas Housing Conservancy fund structureVerified Oct 30, 2026
- Texas Housing Conservancy property portfolioVerified Oct 30, 2026
- Camden fourth-quarter 2020 portfolio supplementVerified Oct 30, 2026
- Camden acquisition of TRS partnership interestsVerified Oct 30, 2026
- MAA fourth-quarter 2020 portfolio supplementVerified Oct 30, 2026
- Riata master community descriptionVerified Oct 30, 2026
- Riata village descriptionVerified Oct 30, 2026
- Austin Water legal-user recordsVerified Oct 30, 2026
- Related: 500 South Congress redevelopmentVerified Oct 30, 2026
- Chapter 303Verified Oct 30, 2026
- Chapter 392Verified Oct 30, 2026
- Chapter 394Verified Oct 30, 2026
- HB 2071Verified Oct 30, 2026
- HB 21Verified Oct 30, 2026
- Legislative Budget Board: PFC tax and school-finance effectsVerified Oct 30, 2026
- Arboretum Oaks official available-unit offersVerified Oct 30, 2026
- June 2026 adopted HFC audit-rule correctionVerified Oct 30, 2026
- March 2026 adopted HFC audit rulesVerified Oct 30, 2026
- Austin AHFC partnership termsVerified Oct 30, 2026
- Preserve at Central Park public-equity authorizationVerified Oct 30, 2026
- Preserve at Central Park financing memorandumVerified Oct 30, 2026
- BASTA eviction dashboardVerified Oct 30, 2026
- Citizen House Bergstrom corrective-action closureVerified Oct 30, 2026
Supporting material
- What the existing work answers—and where it stops — table 1 ↗
- The people behind the property names — table 1 ↗
- How a landlord can grow 74% without adding 74% more homes — table 1 ↗
- The tax question is bigger than PFCs — table 1 ↗
- What “affordability delivered” should mean — table 1 ↗
- What would change these conclusions — table 1 ↗
- Original investigation ↗
- Apartment ownership research sourcebook ↗
- Verified owner property crosswalk ↗
- Pfc case evidence ↗
- Austin travis ownership research register ↗
- Riata pesp overlap ↗
- Combined deal evidence ↗
- Ut tepp 152 property crosswalk ↗
- Austin williamson multifamily supplement ↗
- Article source index ↗
- Source audit examples ↗
- Austin travis large apartment accounts 2026 ↗
- Historical portfolio reconciliation ↗
- Source manifest ↗
- Arboretum oaks quote snapshot ↗
- Reit history reconciliation ↗
- Local central park case ↗
- Local case ↗
- Pesp austin area appraisal crosswalk REVIEW REQUIRED ↗
- Tepp baseline 152 ↗
- Data dictionary (CSV) ↗
- Source register ↗
- Data definitions and methods ↗