Texas public finance
Where Austin’s property-tax dollar goes
Most districts charged recapture still receive net operating formula aid. In Austin, a school-tax saving can disappear into the other four property-tax bills.
An Austin property-tax bill funds the school district, city, county, community college and hospital district. The surprise is in school finance: 126 of the 226 districts charged recapture still receive net operating formula aid, because different parts of the formula can pay in opposite directions.
Method & limits
research through October 30, 2026. The statewide analysis joins 1,019 traditional districts using finalized 2024–25 formula and financial data. The household model holds assessed value at $600,000 with stated exemptions and adopted rates. October 2026 budget projections and near-final state figures keep their provisional status. Formula positions, fiscal accounts and individual tax payments use different accounting bases.
Five governments, then a school-funding formula
An Austin property-tax bill finances five governments with different exemptions, operating budgets and debt obligations. The school portion then passes through a second calculation: Texas decides the district’s funding entitlement and how much local revenue must help finance schools statewide.
Three results change the usual account. More than half of districts with a recapture charge are still net recipients of operating formula aid. For a fixed $600,000 Austin homestead, the 2025 school-tax saving was mostly absorbed by increases from other taxing entities. And Austin ISD’s October 29, 2026 budget update projects both more recapture and more usable state/local funding.
These are different questions: what a homeowner pays, what a district sends to the state, and what the district can spend. The money trail has to follow all three. This report uses finalized 2024–25 state formula data and financial actuals for comparisons, adopted 2024–26 tax rates for the homeowner model, and October 2026 budget projections labeled as such.
The homeowner’s five bills
Consider a modeled owner-occupied home with $600,000 of assessed value before exemptions, inside Austin ISD, the City of Austin, Travis County, Austin Community College and Central Health. It has a general residence-homestead exemption, no senior or disability exemption or tax ceiling, and no additional special-district levy. These are hypothetical property characteristics.
Each entity calculates its tax: taxable value × tax rate ÷ 100. The rate is quoted in dollars per $100 of taxable value. In 2026, the school exemption is $140,000, leaving $460,000 taxable to Austin ISD. The city, county and Central Health each exempt 20%, leaving $480,000. ACC exempts the greater of $5,000 or 1%; here that is $6,000, leaving $594,000.
At the adopted 2026 rates, the bill is $10,115.58: Austin ISD $4,224.64; city $2,783.75; county $1,853.81; ACC $615.64; and Central Health $637.74. There is no state-property-tax line. The absence of that line says little about the state budget’s financial interest in local collections.
The money supports different services. School operating taxes support education and the recapture obligation; school debt taxes service capital debt. City revenue supports municipal services and transfers, including dedicated transit financing. County taxes support county operations such as courts, public safety, roads and human services. ACC supports college operations and capital debt. Central Health supports the public health-care system for low-income Travis County residents and its debt obligations. Within these governments, property-tax revenue generally joins other revenue before budget appropriations determine spending. A household receipt cannot identify which employee, patient or contractor received its particular dollars.
Travis County tax-rate workbook; TCAD exemption schedule; Austin ISD September 24 adoption, minutes page 5.
| 2026 taxing entity | Taxable value | Rate per $100 | Operating levy | Debt levy | Total bill |
|---|---|---|---|---|---|
| Austin ISD | $460,000 | $0.918400 | $3,658.84 | $565.80 | $4,224.64 |
| City of Austin | $480,000 | $0.579948 | $2,134.25 | $649.50 | $2,783.75 |
| Travis County | $480,000 | $0.386210 | $1,630.74 | $223.07 | $1,853.81 |
| ACC | $594,000 | $0.103643 | $534.60 | $81.04 | $615.64 |
| Central Health | $480,000 | $0.132863 | $593.29 | $44.45 | $637.74 |
| Total | $8,551.72 | $1,563.86 | $10,115.58 |
School operating levy includes the amount ultimately allocated to recapture. Its finalized 2026 share remains unknown. Rate and exemption sources are linked above; calculations and corrections to the county workbook appear in the tax metadata.
The Central Health payment has a further financing path. The Austin hospital investigation follows the district’s property-tax revenue, hospital assessments, intergovernmental transfers and purchases of care. Those flows explain how a hospital-district tax reaches services without treating every stage as new public money.
About 21.5 cents of this matched-year tax dollar financed recapture
A defensible recapture allocation needs a matching period. Tax year 2024 supplies the local levy associated with school year 2024–25, the latest year with statewide financial actuals used here. The modeled home’s 2024 bill is $9,818.29. Its Austin ISD portion is $4,752.50, consisting of $4,137.50 in maintenance-and-operations tax and $615 in debt-service tax.
Austin’s FY2025 books record $1,510,834,161 of gross M&O property-tax revenue, $771,603,135 of recapture, and $739,231,026 of M&O revenue Austin ISD kept. Recapture therefore equals 51.0713% of gross M&O receipts. Applying that average to this home’s M&O payment attributes $2,113.08 to recapture and $2,024.42 to school operations Austin kept. The $615 debt-service payment funds school bonds.
Across the full bill, that is approximately 21.52 cents to recapture, 20.62 cents to school M&O Austin kept, 6.26 cents to school debt, 23.35 cents to the city, 16.84 cents to the county, 6.13 cents to ACC and 5.28 cents to Central Health. Rounded cents sum to one dollar.
This is an average allocation using audited annual accounts. It is not a trace of individual banknotes or a claim that 51% of every additional tax dollar is recaptured. Collection timing, prior-year receipts and refunds also prevent treating an individual levy as an exact slice of annual receipts. The FY2025 ratio is not applied to the 2026 bill.
The underlying school-tax bridge was already reconciled in the earlier Austin usable-budget investigation. This report extends it to the whole homeowner bill. Austin FY2025 ACFR; TEA FY2025 financial actuals.
| Destination | 2024 modeled amount | Cents of the whole tax dollar |
|---|---|---|
| State school-finance pool through recapture | $2,113.08 | 21.52¢ |
| Austin ISD M&O kept | $2,024.42 | 20.62¢ |
| Austin ISD debt service | $615.00 | 6.26¢ |
| City of Austin | $2,292.48 | 23.35¢ |
| Travis County | $1,653.34 | 16.84¢ |
| ACC | $601.72 | 6.13¢ |
| Central Health | $518.25 | 5.28¢ |
| Total | $9,818.29 | 100.00¢ |
Texas sets an entitlement, then divides the financing bill
The premise that Texas moves school money according to property wealth instead of student need needs a correction. Student counts and needs help determine the entitlement; property wealth helps determine who finances it. Whether the entitlement adequately pays for those needs requires a cost-and-service test.
Tier One starts with a basic allotment and applies attendance, student-program weights and other adjustments. Compensatory education, special education and bilingual education enter the formula. Weighted average daily attendance applies attendance and program weights to the funding calculation. A count of children uses membership instead. The basic allotment is also not the district’s entire revenue per pupil.
For a simplified Tier One example, suppose entitlement is $100 million after holding the relevant adjustments fixed. If the applicable local contribution is $70 million, state financing fills the gap. If local resources exceed the entitlement, excess revenue becomes a recapture obligation, subject to statutory adjustments and collection rules. Rising property value can therefore reduce the state’s required contribution or increase recapture without increasing the school district’s Tier One entitlement. Falling property values can move the calculation the other way. This simplified financing example holds other statutory adjustments fixed.
There are important additional layers. Tier Two permits enrichment above the compressed Tier One rate. The first eight enrichment pennies are commonly called golden pennies: the state guarantees a yield, while districts with greater local yield keep the excess. The following nine copper pennies have a lower guaranteed yield and are subject to recapture above that level. Each penny means one cent per $100 of taxable value. Those rules make the effect of an extra dollar depend on which part of the rate generated it. Debt-service taxes sit outside M&O recapture.
This also limits the claim that property values never change a district’s usable resources. They can affect golden-penny yield the district keeps and interact with collection and hold-harmless rules. A simplified Tier One equation cannot describe every dollar in a district’s budget.
The 2019 reform changed the legal basis from equalized-wealth thresholds to local revenue in excess of entitlement. Explanations that still present the old property-wealth threshold as the entire current formula miss that change. TEA recapture explanation; TTARA School Finance 101, January 2025; TEA 2026 rate guidance.
The property-value numbers also do different jobs. Local appraisal rolls determine household taxable values. The Comptroller’s Property Value Study independently checks district taxable values for school-finance purposes; it does not directly change the value on an individual owner’s bill. Austin’s 2024 taxable value in TEA’s wealth table is $187.45 billion, or approximately $2.00 million per weighted attendance unit. Eanes is $2.45 million per weighted unit; Del Valle is $870,129. These figures help describe tax capacity, but they are not a complete recapture calculation. Comptroller PVS overview; PVS procedures; TEA 2025 wealth-per-WADA table.
Most recapture districts are still net recipients of operating formula aid
The familiar division into districts that pay recapture and districts that receive state money does not describe the data. A district can qualify for aid in one part of the formula and owe recapture in another. Some districts offset recapture against their state aid by netting aid and the amount due.
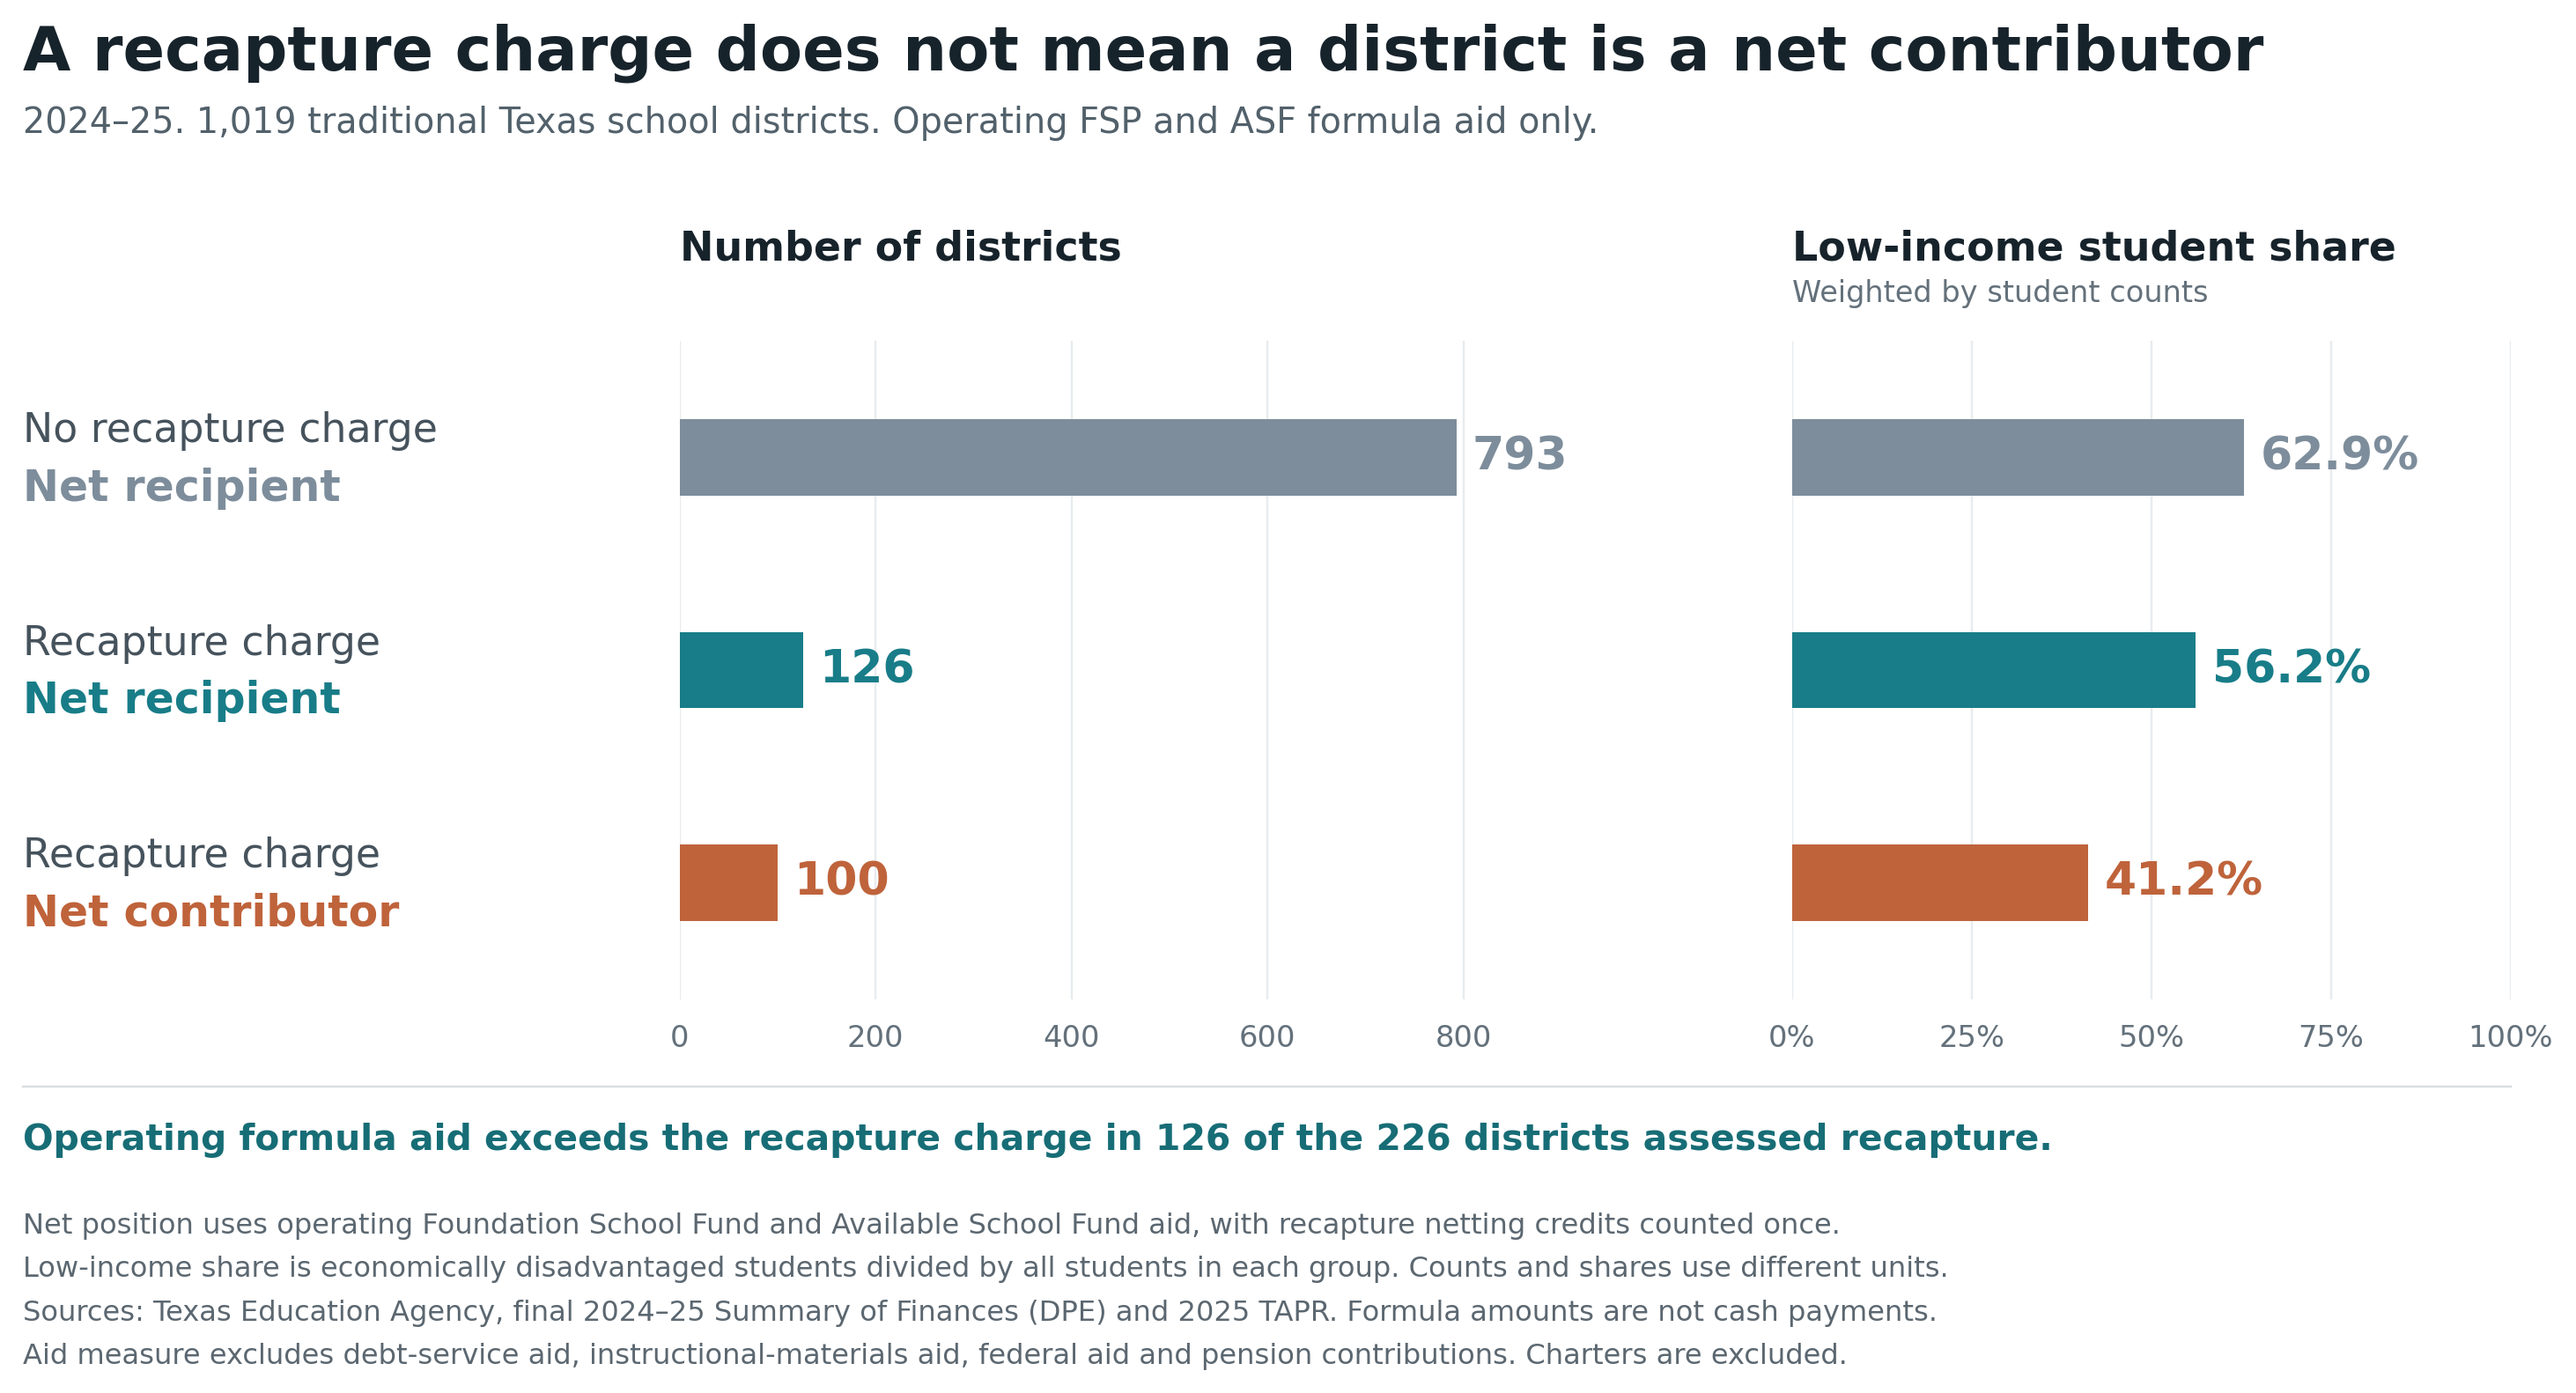
Joining the finalized 2024–25 Summary of Finances to the traditional-district universe produces three groups: 793 districts without recapture and with net operating formula aid; 126 districts with recapture and net operating formula aid; and 100 districts with recapture and a net operating contribution to the state. Thus 55.8% of the 226 districts with a positive recapture amount remain net recipients on this operating-formula measure.
Austin’s neighbors show the mechanism. Pflugerville’s recapture charge is $8.64 million, but its operating FSP/ASF aid is $57.80 million, leaving a $49.16 million net inflow. Leander has $11.16 million of recapture and a $58.43 million net inflow. Round Rock has $12.88 million of recapture and a $28.64 million net inflow. Austin’s net operating position is negative $727.70 million; Eanes’s is negative $87.81 million. Those finalized formula positions differ from cash transactions within a district’s fiscal year.
The calculation includes Foundation School Fund operating aid and Available School Fund aid, excludes facilities aid, federal grants, state pension contributions, the instructional-materials allotment reported elsewhere and programs outside the selected SOF fields, and corrects aid already reduced through recapture netting. Including the SOF’s facilities aid changes the net-recipient count from 126 to 129. Adding the instructional-materials allotment reported elsewhere changes none of the 126/100 classifications. The operating-only result is used throughout the main comparison.
This finding changes how the poverty question should be asked. The “recapture district” label therefore leaves its net contribution unanswered. Final FY2025 SOF workbook, DPE outputs; SOF data dictionary; TEA recapture procedures.
| District | Final SOF recapture | Net operating formula position |
|---|---|---|
| Austin ISD | $769.46m | −$727.70m |
| Eanes ISD | $93.21m | −$87.81m |
| Pflugerville ISD | $8.64m | +$49.16m |
| Round Rock ISD | $12.88m | +$28.64m |
| Leander ISD | $11.16m | +$58.43m |
| Del Valle ISD | $0.00m | +$20.90m |
Positive net positions are aid to the district; negative positions are net contributions. Final formula positions include offset corrections and exclude the funding categories specified above.
Property wealth and student poverty overlap
The joined dataset covers 1,019 independent and common school districts, excluding charter operators, whose taxation and financing differ. All have matched demographic records. The low-income proxy is TEA’s economically disadvantaged student membership, a program-eligibility classification. It is not the Census poverty rate or a measure of household wealth.
Of the 226 districts with positive finalized recapture, 126 serve a majority of economically disadvantaged students. Those 226 districts serve 903,996 economically disadvantaged children. 77 have a higher low-income share than the median district without recapture, whose share is 61.69%. Comparing shares is more informative than comparing raw counts across districts of very different sizes.
The opposite story also survives testing: 53.3% of students in recapture districts are economically disadvantaged, versus 62.9% in districts without recapture. At this aggregate level, districts without recapture serve a higher share of economically disadvantaged students. That pattern is consistent with the system’s redistributive purpose, but it does not measure how each dollar is distributed or measure funding adequacy.
The net-contributor group sharpens the comparison. In the 100 districts that contribute on net, 41.2% of students are economically disadvantaged; 52 of those districts nevertheless have a majority of low-income students. Austin has 36,886 economically disadvantaged members out of 72,175, or 51.1%. Eanes’s share is 2.6%, and Del Valle’s is 89.1%. Oil and industrial property can likewise produce a rich tax base without a uniformly affluent student body.
Two different sets happen to contain 126 districts: majority-low-income recapture districts and recapture districts receiving net operating aid. They are not the same set; 74 districts are in both. No adequacy conclusion follows from the overlap alone. TEA TAPR 2024–25 student data; TEA recapture history.
Recaptured money funds schools and replaces state financing
Texas Education Code §49.154(b) requires the state to deposit attendance-credit receipts in the treasury and use them for Foundation School Program purposes. TEA explains that recapture is appropriated as a method of financing that program. The direct destination is school finance.
The economic effect goes further. Holding entitlements and other funding sources fixed, more recapture reduces the amount the state must supply from its other resources. Imagine a program with a fixed $100 obligation. Increasing one funding source from $20 to $30 reduces the remaining financing requirement from $80 to $70; it does not automatically turn the obligation into $110.
That is why “the money funds other schools” and “the money helps the state budget” can both be accurate. A claim that the same dollars were directly spent on an unrelated program would require evidence of that diversion and would conflict with the statutory earmark. The supported claim concerns financing capacity freed up elsewhere in the state budget.
The records also do not identify which named recipient district received one particular Austin homeowner’s payment. Entitlements, payments and offsets run through a pooled funding system. Proportionally assigning Austin dollars across recipient districts would require an allocation model. Transaction tracing cannot follow a particular household’s dollars through the pool.
Even an official local explainer can blur that financing effect: TCAD says local property taxes are used locally and that the state receives no benefit. The first part needs qualification for recapture; the second overlooks substitution in the state budget. Texas’s lack of a state property tax describes the taxing authority. Local property wealth still affects the state’s financing responsibility. Texas Education Code Chapter 49; TEA explanation; TCAD explainer; LBB SB4 fiscal note.
A school-tax cut can leave the total bill higher
Three rounds of law changed the financing arrangement. In 2019, House Bill 3 increased the basic allotment, began ongoing rate compression and revised recapture. In 2023, additional compression and a school homestead exemption increase from $40,000 to $100,000 reduced local school taxation. In 2025, the general school exemption rose to $140,000 and rates compressed further; House Bill 2’s funding package changed allotments and compensation funding.
These policies have different effects. Rate compression reduces the tax rate. A homestead exemption reduces the home’s taxable base. An entitlement increase changes the resources schools are allowed to keep. TEA’s June 2026 guidance explicitly states that Tier One compression changes the state/local financing balance without changing the Tier One entitlement. Homestead exemptions apply to qualifying homes; compression reaches other taxable property too.
The $600,000 example shows how the tax cuts interact. Its school tax falls from $4,752.50 in 2024 to $4,255.92 in 2025, a $496.58 reduction. The other four bills rise by $434.26, absorbing 87.45% of the school saving. The combined bill falls only $62.32. By 2026, school tax is $527.86 below 2024, yet the total bill is $297.29 higher. All three years hold assessed value constant; a household’s experience also depends on its valuation, appraisal cap and exemptions.
A lower recapture bill can likewise mean very different things. In their 2025 fiscal notes, the Legislative Budget Board projected that the $140,000 homestead exemption would reduce recapture by $337.0 million in FY2026 while reducing the local levy and increasing the state’s financing responsibility. The HB2 funding package was projected to reduce recapture by $381.7 million in FY2026, partly because higher school entitlements reduce the excess subject to recapture. These enactment-era estimates precede the measured results. The policies can interact, so their estimates cannot simply be added.
One reduction largely changes who pays; the other expands specified funding. Recapture by itself cannot distinguish them. TEA 2025 rate guidance; TEA 2026 rate guidance; SB4 fiscal note; HB2 fiscal note.
The historical series also rejects a simple story of recapture rising without interruption. In TEA’s October 2026 edition, statewide finalized recapture was $4.528 billion in FY2023, $2.674 billion in FY2024 and $2.963 billion in FY2025. The subsequent entries are $2.491 billion for FY2026 near-final and $2.179 billion for FY2027 preliminary; neither should be presented as audited actuals. These totals combine property values, student measures, rates and formula changes. The series alone cannot identify the causal contribution of any one law. TEA recapture history.
| Taxing entity | 2024 | 2025 | 2026 |
|---|---|---|---|
| Austin ISD | $4,752.50 | $4,255.92 | $4,224.64 |
| City of Austin | $2,292.48 | $2,515.28 | $2,783.75 |
| Travis County | $1,653.34 | $1,804.06 | $1,853.81 |
| ACC | $601.72 | $614.20 | $615.64 |
| Central Health | $518.25 | $566.51 | $637.74 |
| Total | $9,818.29 | $9,755.97 | $10,115.58 |
Usable revenue per student changes the comparison
TEA’s FY2025 all-funds operating revenue already excludes recapture. Subtracting recapture again would invent a second loss. Dividing that operating revenue by TEA membership gives $13,308 per Austin student, compared with $15,293 in Del Valle, $12,677 in Eanes, $11,857 in Pflugerville, $10,521 in Round Rock and $10,446 in Leander. These measures exclude the I&S property-tax and bond-proceeds lines reported elsewhere and are not the same as a basic allotment or a cost-adjusted entitlement.
Del Valle, the non-recapture district in this six-district comparison, has considerably greater student poverty than Austin and receives more operating revenue per member. That is consistent with need-sensitive funding, but adequacy still needs the cost of providing the intended education in each district.
Federal revenue changes one comparison’s direction. Austin exceeds Eanes when federal operating revenue is included; Eanes exceeds Austin when it is excluded. Austin has $11,753 per member in state/local operating revenue, compared with Eanes’s $12,258. Federal revenue contributes approximately $1,555 per Austin member versus $420 in Eanes. A claim that Austin receives more or less per pupil is incomplete unless it names the revenue measure.
Attendance, student needs, district size, local enrichment rates, grant timing, local revenue kept and operating costs all differ. For the six districts, the financial-report membership counts match TAPR membership exactly. The full statewide file contains one documented denominator difference, Texhoma, which does not change the payer classifications or poverty comparisons.
Austin remains the largest recapture contributor by a wide margin. TEA’s October 2026 history records $769.5 million in finalized FY2025 recapture, 26.0% of the statewide $2.963 billion. The next four are Pecos-Barstow-Toyah ($198.1 million), Plano ($136.3 million), Wink-Loving ($122.6 million) and Eanes ($93.2 million). These settlement amounts differ from district-booked fiscal expenses; the source edition and accounting basis remain explicit. TEA financial actuals; TEA recapture history.
Absolute contribution also reflects district size. On the stated SOF operating measure, Eanes’s net contribution is approximately $11,569 per financial-report member, versus Austin’s $10,082. Austin contributes far more in total while enrolling about 9.5 times as many students. Neither comparison measures educational adequacy.
| District | Members | Economically disadvantaged | Operating revenue/member | Operating revenue excluding federal/member |
|---|---|---|---|---|
| Austin ISD | 72,175 | 51.1% | $13,308 | $11,753 |
| Eanes ISD | 7,590 | 2.6% | $12,677 | $12,258 |
| Leander ISD | 42,507 | 16.6% | $10,446 | $9,986 |
| Round Rock ISD | 46,846 | 27.1% | $10,521 | $9,920 |
| Pflugerville ISD | 25,451 | 50.4% | $11,857 | $10,930 |
| Del Valle ISD | 11,681 | 89.1% | $15,293 | $13,046 |
Austin’s newest budget update shows why recapture is an incomplete score
Large recapture and a local shortfall can coexist because a spending plan can exceed the resources left after equalization. The statutory funding system determines recapture. A district can still have an operating deficit after that equalization calculation. Declining attendance can reduce formula revenue while buildings, routes and staffing commitments adjust more slowly.
The newest district update tests that point. Austin’s updated October 29, 2026 presentation projects $23 million more local revenue attributed to property-value adjustments and $5 million more state aid, alongside $12 million more recapture. The district’s own bridge produces $16 million more usable state/local funding despite higher recapture. That projection combines changes in several inputs. Isolating the effect of property appreciation would require holding the others fixed.
The precise projected FY2027 recapture is $641.782 million, compared with $629.782 million in the adopted baseline. The latest update projects a $34.947 million increase in fund balance, but it includes $76.251 million of other financing resources, including planned property monetization. Before those financing sources and uses, projected revenue is $41.166 million below projected expenditure. A projected increase in reserves therefore does not demonstrate a recurring operating balance.
For FY2026, the same presentation reports an unaudited September projection of about $619 million of recapture and a $93 million deficit. These are not audited actuals. The October slides’ roughly $1.587 billion of “revenue” include financing resources; accounting revenue in the detailed projected-amendments table is $1.511 billion. The projected amendments should not be described as fully approved as of October 30.
The direction of recapture alone cannot answer whether a district is healthier. The companion measures are recurring resources the district keeps, the cost of the service plan, one-time financing and reserve use. Updated October 29 presentation, pages 3, 7–8; projected amendments, page 1.
An attractive money trail can still use the wrong line
TTARA’s school-finance material already explains attendance, weighted funding, compression and the golden/copper rules well. District explainers describe local stakes and payment histories, but their adopted-budget figures can persist after settlements change them. The earlier Austin investigation already reconciled the FY2025 51.1% M&O recapture share. Academic work has examined both equalization and remaining funding inequities. This research does not claim that joining finance and demographic data is unprecedented.
The added contribution is a current household-to-district accounting chain, the difference between positive recapture and a net operating contribution, the statewide poverty cross-tab, and explicit tests of competing interpretations. It also exposes a concrete error in a recent public investigation.
An April 2026 public-data article describes $635 million as Austin’s FY2023 cash recapture and explains its gap from approximately $901 million as tax-base assignments. The audit records the full $900,910,768 as General Fund function 0091 recapture. TEA’s FY2023 financial actuals also report $900,910,768 of Austin recapture, matching the audit: both General Fund and All Funds sheets show that amount in columns R and BY on Austin’s row 1091. On that same statement, $635 million is a transfer into the capital-projects fund. Note 6 identifies it as school-building bond proceeds transferred from the debt-service fund. Those are unrelated accounting lines; the proposed $266 million bridge is unsupported. How the other author obtained that number remains unknown.
This is why a visual money trail needs the original fund, function, object and year behind every arrow. The appealing story is not enough. Article being checked; Austin FY2023 ACFR, printed pages 25 and 49; TEA FY2023 actuals; TEA FY2023 actuals; TTARA.
The research literature also cautions against treating equalization only as an outflow. A 2023 University of Houston study already joined finance and student data to examine equity over 2016–22. A 2024 Dallas Fed working paper finds historical evidence that school-finance equalization insulated education spending when local tax bases were hit by trade shocks. These studies inform the mechanism and the competing hypotheses; neither measures the cost of Austin’s present service plan against its current funding. Templeton and colleagues, 2023; Dallas Fed Working Paper 2411.
How the findings were tested, and what remains unresolved
Scope and join. The district universe is the 1,019 independent/common districts in TEA’s FY2025 financial actuals. Records join by six-digit county-district number to the final FY2025 SOF DPE outputs, the October 2026 recapture-history workbook, 2024–25 TAPR student membership, and the 2025 wealth-per-WADA table. Charter operators are excluded. Each join is one-to-one; all 1,019 districts have SOF and demographic matches. Member-based financial ratios use the financial workbook’s denominator; low-income shares use TAPR counts. Texhoma is the only membership mismatch, 142 versus 102, and carries a flag.
Net operating position. The reproducible formula is FSF_ALLOT_ADJ + ASF_ALLOT − RECAPTURE − CREDRECAP. The credit is negative and already reduces reported aid through Other Programs. Equivalently, subtract only recapture not already offset against aid. Seventy-six districts have such credits, totaling $37.443 million; subtracting the gross obligation again would double-count them. The measure is a formula position, excludes I&S aid and other funding outside these fields, and is not an audited statewide cash-flow statement.
Payer sensitivity. The history and SOF files both identify 226 positive-recapture districts. The fiscal financial actuals show 173 with a booked recapture expense: 58 state-positive/book-zero cases and five in the reverse direction. Using booked expenses instead still yields a majority-low-income result: 94 of 173 districts. The history’s FY2025 total differs from the SOF snapshot by $2.022 million; Austin differs by $5 between those two sources. Austin’s FY2025 booked expense exceeds its current finalized history amount by $2.144 million. The differences remain visible. Reconciling them requires a district settlement schedule.
What the data support. Adopted-rate arithmetic, the identified audit entries, and the joined data support the quantified findings. The claim that more recapture reduces other state financing is conditional on fixed entitlements and other sources. The property-tax scenario holds assessed value constant and does not estimate a typical household’s appreciation or tax ceiling.
What would change the conclusions. Revised official settlements or documented field definitions would require recalculating the counts. A district-level ledger could resolve the remaining differences between the state and district books. An adequacy finding would require an explicit service standard, credible costs of meeting different student needs, local labor prices and comparable outcomes. These data alone cannot show that abolishing recapture would finance an adequate statewide system, or that every deficit is caused by underfunding rather than a mixture of costs, enrollment, grants and local choices.
The three measures describe different financial decisions: the tax bill measures a household’s contribution; recapture measures one funding obligation; recurring resources the district keeps measure what can sustain a school service plan. Each answers a different part of the question.
Recapture alone cannot score a school budget
School-finance changes deserve judgment by recurring resources after equalization and by the service those resources can sustain. The homeowner’s total bill, the district’s recapture obligation and its spendable budget can move in different directions. A policy claim needs to say which one improved.
Sources
- Travis County tax-rate workbookVerified Oct 30, 2026
- TCAD exemption scheduleVerified Oct 30, 2026
- Austin ISD September 24 adoption, minutes page 5Verified Oct 30, 2026
- the earlier Austin usable-budget investigationVerified Oct 30, 2026
- Austin FY2025 ACFRVerified Oct 30, 2026
- TEA FY2025 financial actualsVerified Oct 30, 2026
- TEA recapture explanationVerified Oct 30, 2026
- TTARA School Finance 101, January 2025Verified Oct 30, 2026
- TEA 2026 rate guidanceVerified Oct 30, 2026
- Comptroller PVS overviewVerified Oct 30, 2026
- PVS proceduresVerified Oct 30, 2026
- TEA 2025 wealth-per-WADA tableVerified Oct 30, 2026
- Final FY2025 SOF workbook, DPE outputsVerified Oct 30, 2026
- SOF data dictionaryVerified Oct 30, 2026
- TEA recapture proceduresVerified Oct 30, 2026
- TEA TAPR 2024–25 student dataVerified Oct 30, 2026
- TEA recapture historyVerified Oct 30, 2026
- Texas Education Code Chapter 49Verified Oct 30, 2026
- TCAD explainerVerified Oct 30, 2026
- LBB SB4 fiscal noteVerified Oct 30, 2026
- TEA 2025 rate guidanceVerified Oct 30, 2026
- HB2 fiscal noteVerified Oct 30, 2026
- Updated October 29 presentationVerified Oct 30, 2026
- projected amendmentsVerified Oct 30, 2026
- Article being checkedVerified Oct 30, 2026
- Austin FY2023 ACFRVerified Oct 30, 2026
- TEA FY2023 actualsVerified Oct 30, 2026
- Templeton and colleagues, 2023Verified Oct 30, 2026
- Dallas Fed Working Paper 2411Verified Oct 30, 2026
Supporting material
- Start with the homeowner’s five bills — table 1 ↗
- About 21.5 cents of this matched-year tax dollar financed recapture — table 1 ↗
- Most recapture districts are still net recipients of operating formula aid — table 1 ↗
- A school-tax cut can leave the total bill higher — table 1 ↗
- Austin’s retained revenue needs a student denominator and a funding scope — table 1 ↗
- Original investigation ↗
- Data dictionary (CSV) ↗
- Texas district finance need 2025 ↗
- Austin area comparison 2025 ↗
- Largest recapture payers 2025 ↗
- Homeowner model 2024 2026 ↗
- Aisd current budget bridge ↗
- Aisd recapture history ↗
- Source register ↗
- Data definitions and methods ↗