Texas business
Underwriting a West Campus tower
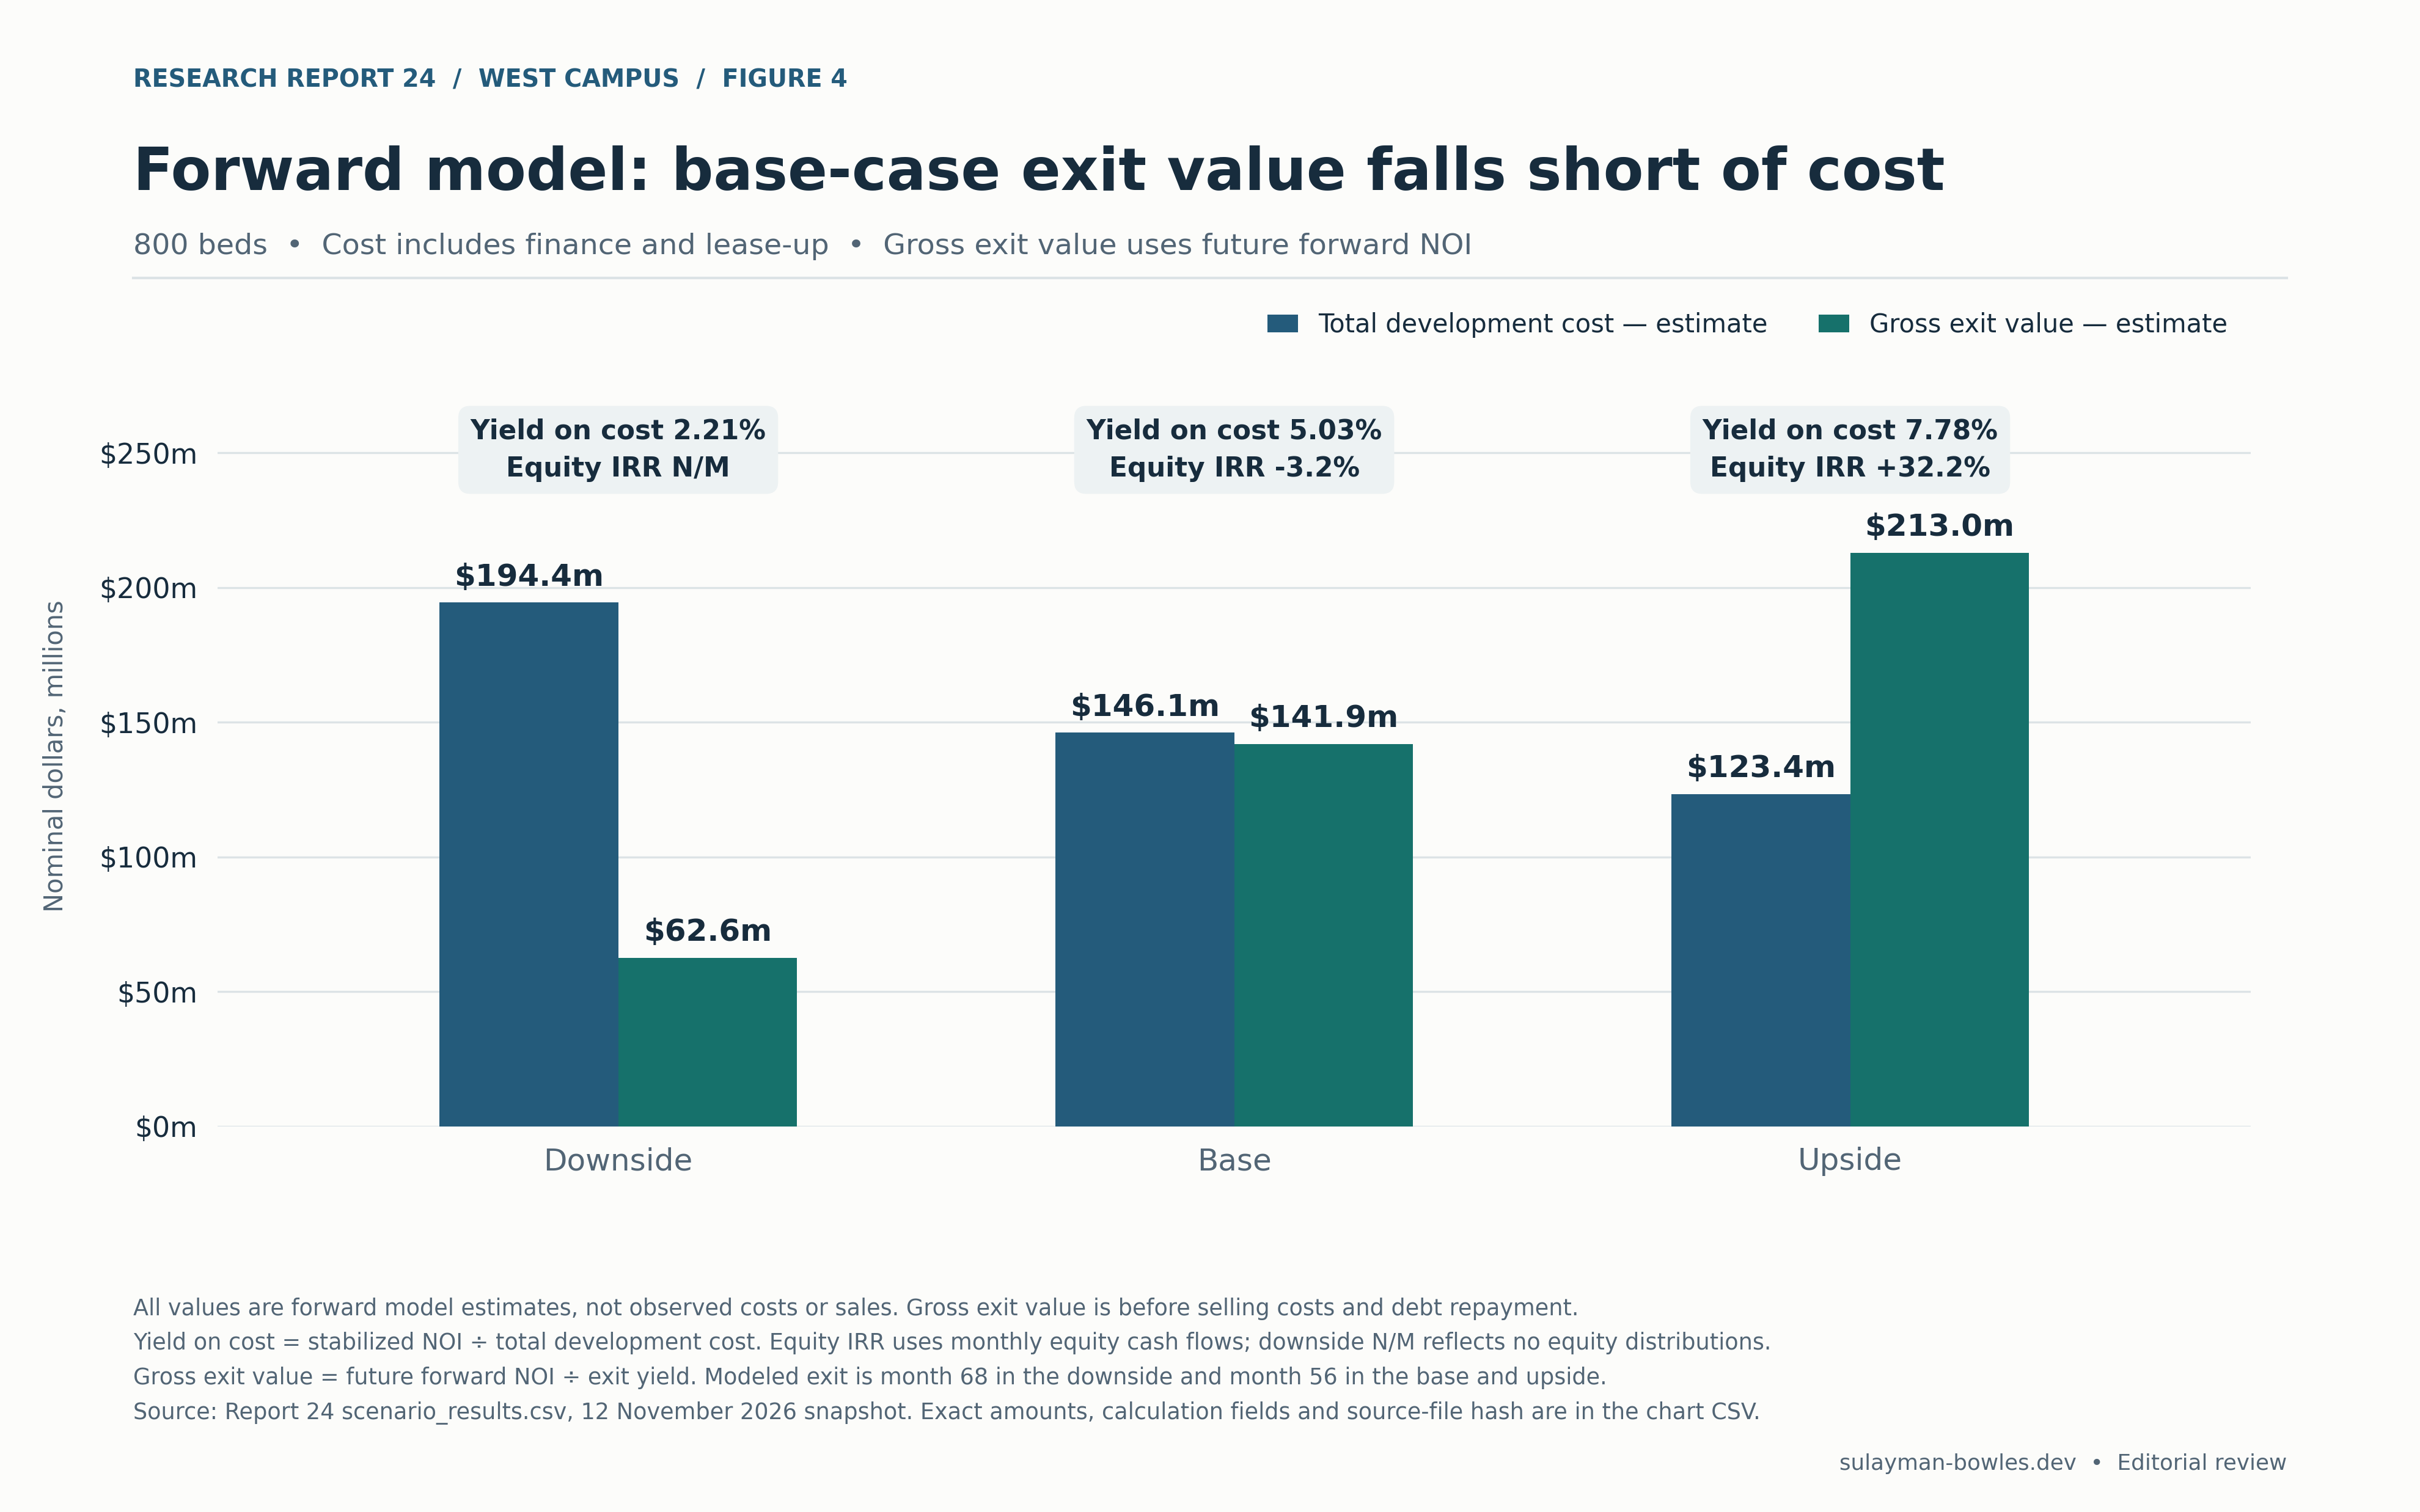
An 800-bed tower in the base case costs $146.1 million and yields 5.03% on cost. Modeled common-equity IRR is −3.2%.
A new West Campus student high-rise does not earn an adequate development return under this report’s base assumptions. An illustrative 800-bed, 250-unit tower costs $146.1 million, produces $7.35 million of stabilized annual net operating income, and yields 5.03% on cost. At a 5.25% exit capitalization rate, two full operating years and the modeled financing, common equity earns −3.2% annually and recovers 0.88 times its contributions. The project includes a $2.90 million developer fee as a cost; that fee does not convert a loss-making property investment into an attractive common-equity investment.
An upside case works: $123.4 million of cost, $9.60 million NOI, 7.78% yield on cost and 32.2% common-equity IRR. It requires $10 million land, $225 per gross square foot hard costs, market rents 10% above the base schedule, 97% occupancy, very limited concessions and a 4.75% exit yield together. The upside requires those conditions together.
The result is conditional because the public record does not document an executable land price, an executed construction contract, a building-specific achieved rent roll, a current parcel tax bill or a financing commitment. Those gaps prevent an unconditional claim that every possible site fails. They also prevent presenting a thinly supported “yes” as an investment conclusion. The working decision is do not release construction capital on the base underwriting; first obtain evidence capable of closing the cost-to-value and refinance gaps.
Three findings drive that decision. First, Union on 24th’s $130.44 million TABS construction estimate and the developer’s reported $262.3 million project budget cover different scopes. Second, operating expense matters as much as advertised rent: SkyLoft’s latest public servicing data report $5.46 million of expenses against $10.25 million of revenue. Third, debt coverage constrains exit options: the base project’s $90.60 million construction principal exceeds modeled early permanent-loan capacity by $20.77 million. These findings are cross-checked below. [S3, S7, S10]
| Modeled result | Downside | Base | Upside |
|---|---|---|---|
| Total development cost through lease-up | $194.4m | $146.1m | $123.4m |
| Cost per bed | $243,062 | $182,660 | $154,221 |
| Stabilized NOI at starting rents | $4.30m | $7.35m | $9.60m |
| Yield on cost | 2.21% | 5.03% | 7.78% |
| Gross sale value from forward NOI | $62.6m | $141.9m | $213.0m |
| Common equity contributed | $91.3m | $55.5m | $46.4m |
| Common-equity multiple | 0.00× | 0.88× | 3.02× |
| Annual common-equity IRR | Undefined | −3.2% | 32.2% |
| Annual unlevered project IRR | −21.2% | 3.0% | 22.8% |
| Early takeout paydown required | $72.5m | $20.8m | $0 |
The model calculates the returns from the stated assumptions. “Undefined” means the downside has no positive equity cash flow. It also leaves $48.25 million of mortgage principal unpaid after sale. The model does not assign that deficiency to the sponsor; the terms of completion, carry and repayment guarantees would determine additional liability.
“Development cost through lease-up” ends after the first lease year. Equity contributions cover all modeled deficits through sale. The downside requires a further $6.46 million of second-year carry outside that cost measure, so its equity plus construction principal totals $200.90 million rather than $194.45 million. The monthly cash flows include that additional funding; it is not omitted from returns.
The decisive scenario inputs are below. Each is an analyst estimate, except the common observed SOFR starting point and current affordable rent limits. Low and high cases change several correlated assumptions together; they are not confidence intervals.
| Driver | Downside | Base | Upside |
|---|---|---|---|
| Land acquisition allowance | $20m | $15m | $10m |
| Hard cost / total GSF | $295 | $255 | $225 |
| Soft costs / hard cost | 14% | 12% | 11% |
| Contingency / hard cost | 7% | 5% | 4% |
| Weighted market base rent / bed / month | $1,379 | $1,533 | $1,686 |
| First-year / stabilized occupancy | 85% / 90% | 92% / 95% | 97% / 97% |
| Market-rent concessions | 6.0% | 2.0% | 0.5% |
| Bad debt / occupied rent | 1.5% | 0.5% | 0.3% |
| Fixed non-tax opex / bed / year | $4,500 | $4,000 | $3,400 |
| Stabilized taxable assessment | $144m | $120m | $110m |
| Construction coupon, held constant | 9.38% | 7.63% | 6.88% |
| Permanent-loan coupon for takeout screen | 7.25% | 6.50% | 5.75% |
| Construction duration after predevelopment | 33 months | 27 months | 27 months |
| Opening intake | August 2030 | August 2029 | August 2029 |
| Post-opening market rent growth | 0% | 2% | 3% |
| Post-opening expense/tax growth | 4% | 3% | 2.5% |
| Exit capitalization rate | 6.00% | 5.25% | 4.75% |
The takeout screen uses a common 70% LTV ceiling, 1.35× debt coverage and 30-year amortization.
1. Advertised rents in West Campus
The UT Field Guide has public property profiles that distinguish room configurations, privacy, fee fields and lease periods. The extraction for this report contains 67 advertised plan groups across nine buildings, representing 236 displayed plan variants. The variants are catalog entries. Available beds, signed leases and transaction counts would require additional records. Eight groups carry restricted-eligibility qualifications. Shared bedrooms, whole-apartment prices and restricted offers remain separately identified in the raw CSV. 1
All nine profiles display 2027–28 offers. Waterloo’s default quote was checked November 4, 2026; the other eight default quotes were checked October 26. The grouped alternatives do not each carry a timestamp. Every observation was retrieved November 12. Calling every group individually “verified October 26” would overstate the evidence.
The table uses representative displayed private-bedroom offers. These payments are not consistently base rent. Several include recurring or annualized fees; Waterloo explicitly quotes before fees. Building age is joined from developer, architect, operator or SEC records, rather than inferred from the rent page.
| Building | Built/opened | Age in 2026, approximately | Representative 2027–28 monthly displayed payment per person |
|---|---|---|---|
| 26 West | 2008 | 18 | 4BR/2BA $1,214–1,224; 4BR/4BA from $1,249–1,279 before fees; 2BR/2BA from $1,504 |
| Ion | 2016 | 10 | 4BR/4BA apartment $1,260; 3BR/3BA $1,310; 2BR/2BA $1,424 |
| SkyLoft | 2018 | 8 | 3BR/3BA from $1,280; 2BR/2BA from $1,599; 1BR from $2,369 |
| Moontower | 2020 | 6 | 3BR/3BA from $1,335; 4BR/4BA from $1,355; 2BR/2BA from $1,800 |
| The Standard | 2021 | 5 | 3BR/3BA from $1,340; 4BR/4BA from $1,490; 5BR/5BA from $1,510 |
| Waterloo | 2022 | 4 | 4BR/4BA Classic $1,309; 3BR/3BA $1,599; 2BR/2BA Classic $1,829, all before fees |
| Rambler | 2023 | 3 | 4BR/4BA from $1,614; 3BR/3BA from $1,674; 2BR/2BA from $1,924 |
| The Mark | 2023 | 3 | 4BR/4BA from $1,387.45; 2BR/2BA from $1,450; 3BR/3BA from $1,720 |
| Union on 24th | 2024 | 2 | 10BR/10BA from $1,461; 4BR/4BA from $1,501; 2BR/2BA from $1,966 |
Sources and opening-year joins are specified in S1–S2 and the rent/age CSV. “Built” for 26 West comes from the SEC schedule’s year-built field. The first move-in date remains unverified.
Several reconciliation examples show why a model cannot simply average those payments. Ion’s selected four-bedroom costs $1,195 in monthly base rent plus a $65 amenity fee, producing the displayed $1,260. SkyLoft’s selected three-bedroom has $1,260 base rent and additional charges in the displayed payment. Moontower’s selected three-bedroom has $1,285 base rent versus $1,335 displayed. The Mark’s $1,387.45 example combines $1,340 base rent with required and optional charges. Union’s displayed monthly amount annualizes an administrative fee. 1
Rambler supplies an operator cross-check: its own floor-plan page shows base rent and total monthly charges, including fees the Field Guide lists elsewhere. Its $3,923 Ironwood listing quotes the entire apartment. Its shared-bedroom offers do not show pricing for private bedrooms. Ion’s Field Guide “504 apartments” description also conflicts with the original developer’s 504 beds. This report uses the latter capacity and does not weight rents by the erroneous apartment count. [S1–S2]
The listings support a rent schedule by configuration. They leave the effect of building age on rent unmeasured. Location, private versus shared bathrooms, unit size, floor, windows, amenities, lease incentives and selection into advertised inventory all vary. A recent tower can advertise below an older one in a particular configuration. The base model therefore uses a transparent synthetic mix: studio $2,200, one-bedroom $2,400, two-bedroom $1,800, three-bedroom $1,550, four-bedroom $1,450, and five-/six-bedroom $1,400 per market bed per month. Its weighted market ask is $1,532.50 before concessions.
I use the offers to inform the assumed rent schedule. Complete plan-level net areas, current counts of each rentable configuration, achieved effective rents and a successful full-catalog export were not obtained. The prototype’s unit areas are assumptions. The 2019 SkyLoft SEC unit-mix table provides a historical 674-bed/212-unit/216,931-net-sf physical cross-check; it is not the new tower’s design. 8
2. Current UNO rules determine which beds earn those rents
The proposed UNO expansion cannot be underwritten as enacted law. Austin’s current amendment dashboard places the UNO update among indefinitely postponed amendments; the February 2026 active-case report independently records the suspension/postponement. A model that assumes the proposed 420-/600-foot regime has skipped a material entitlement risk. 4
For an eligible Inner West project, enacted Ordinance 20191114-067 permits 125 feet above the mapped maximum under its specified conditions. On a parcel mapped for 175 feet, that can produce a 300-foot tier. The zoning map, envelope, setbacks, street-wall treatment and site constraints still control. Deliverable gross area depends on the parcel and design. 4
The modeled bonus branch requires, for at least 40 years, 10% of units or bedrooms at no more than 60% MFI, another 10% at no more than 50% MFI, and either the applicable fee on each square foot of net rentable floor area or an additional 10% at 50% MFI. Thus the relevant alternatives are 20% onsite plus fee and 30% onsite. Adding another baseline 20% would double-count the requirement. The adopted FY2026–27 fee schedule lists UNO residential at $1 per total net rentable square foot; the actual certification must confirm its application to the particular project. [S4–S5]
The June 1, 2026 single-occupant bedroom caps are $1,260 monthly at 60% MFI and $941 at 50% MFI. Mandatory non-utility charges belong within the cap; the guide lists specified utility exceptions. Under the by-unit method, the cap applies to the entire unit. The model uses bedroom pricing and assumes single occupancy throughout. 5
Modeled room allocation
The workbook lists all 250 units individually. The following table summarizes that inventory. Each listed “60%” or “50%” unit has all of its bedrooms designated at that tier, while certification remains by bedroom. Mixed restricted/market apartments are legally possible—the city guide’s Example 3 describes one restricted bedroom in a three-bedroom apartment—but this prototype does not need that complication.
| Plan | Units | Beds | Net sf/unit, assumed | Market rent/bed, assumed | Units at 60% | Units at 50% | Market units |
|---|---|---|---|---|---|---|---|
| Studio | 20 | 20 | 430 | $2,200 | 2 | 2 | 16 |
| 1BR/1BA | 20 | 20 | 550 | $2,400 | 2 | 2 | 16 |
| 2BR/2BA | 40 | 80 | 800 | $1,800 | 4 | 4 | 32 |
| 3BR/3BA | 40 | 120 | 1,100 | $1,550 | 4 | 4 | 32 |
| 4BR/4BA | 100 | 400 | 1,250 | $1,450 | 10 | 10 | 80 |
| 5BR/5BA | 20 | 100 | 1,550 | $1,400 | 2 | 2 | 16 |
| 6BR/6BA | 10 | 60 | 1,850 | $1,400 | 1 | 1 | 8 |
| Total | 250 | 800 | 270,100 total NRA | $1,532.50 weighted | 25 | 25 | 200 |
The model assigns 80 rentable places to each tier, including two studios. Austin’s guidance defines a bedroom by hard-wall construction. The recorded land-use restriction and approved room schedule would determine the final bedroom count and how the studios are treated. Modeled annual scheduled restricted rent is 80 × $1,260 × 12 + 80 × $941 × 12 = $2,112,960. The other 640 rentable places pay market rent. The fee is 270,100 × $1 = $270,100. Proportional allocation across plan types keeps the plan mix comparable across market and restricted rents. The report found no rule requiring proportional allocation.
The alternative prices another 25 units with 80 rentable places at 50% MFI and removes the fee. It reduces annual base NOI by $520,209, after occupancy, concessions and management effects, while avoiding only $270,100 upfront. Its yield on cost falls to 4.67% and equity IRR to −9.4%. The model measures the difference in project economics. The 40-year covenant survives sale, and no future increase in affordable rent caps is assumed.
3. Land: observable appraisals, unobservable purchase prices
Public TCAD searches explicitly requesting tax year 2026 returned the following ready valuations. Travis County GIS independently reproduces the values, although both ultimately originate with TCAD. SkyLoft’s marketing address is 507 West 23rd; its tax situs is 2209 Nueces. Matching the property identifiers avoids treating those as different assets. 6
| Completed property | TCAD PID | Legal acres | Appraised land | Appraised improvements | Appraised total | Total per bed |
|---|---|---|---|---|---|---|
| SkyLoft, 674 beds | 203505 | 0.5784 | $5.670m | $98.810m | $104.480m | $155,015 |
| Waterloo, 796 beds | 206695 | 0.4014 | $3.934m | $139.169m | $143.103m | $179,777 |
| Rambler, 817 beds | 963472 | 1.1771 | $11.537m | $111.091m | $122.628m | $150,095 |
Each land component is approximately $225 per tax-lot square foot. This is an appraisal allocation within an improved parcel. It cannot tell a buyer what it costs to acquire a vacant development site, assemble condominiums, demolish improvements or resolve title restrictions. Waterloo’s record also indicates an appraisal review hearing; these observations can subsequently change.
The TCAD deed histories identify SkyLoft instrument 2026097170, dated August 13, 2026; Waterloo 2022129990, July 28, 2022; and Rambler 2021107303, May 12, 2021. These are deed metadata. Clerk instrument images, consideration and arm’s-length status were not obtained. SkyLoft’s recent ownership entry alone does not prove a market-price sale. Land purchase prices remain UNKNOWN. 6
To make the denominator explicit, the synthetic 0.75-acre site has 32,670 land sf, 270,100 residential net sf, 82% net-to-above-grade-gross efficiency and 49,500 garage sf. That produces 329,390 above-grade GSF and 378,890 total GSF. At 27 above-grade stories, the average floor plate is 12,200 sf, or 37.34% of the lot. The massing model assumes that lot coverage. The buildable envelope remains unverified.
Scaling the same total-gross-to-lot ratio across the three tax parcels produces approximately $19.40 of appraised land per illustrative gross buildable sf in each case. Applying the observed $225/lot-sf appraisal allocation to the hypothetical site produces an illustrative land-value proxy of $7.35 million; the hypothetical site has no appraisal. The base $15 million acquisition allowance instead equals $459/lot-sf, $39.59/total modeled GSF or $45.54/above-grade GSF. The difference follows from the assumed acquisition cost. The market premium remains unmeasured. Approved buildable area and sale consideration are unknown for every candidate site.
4. Construction: a filing estimate is not a completed cost ledger
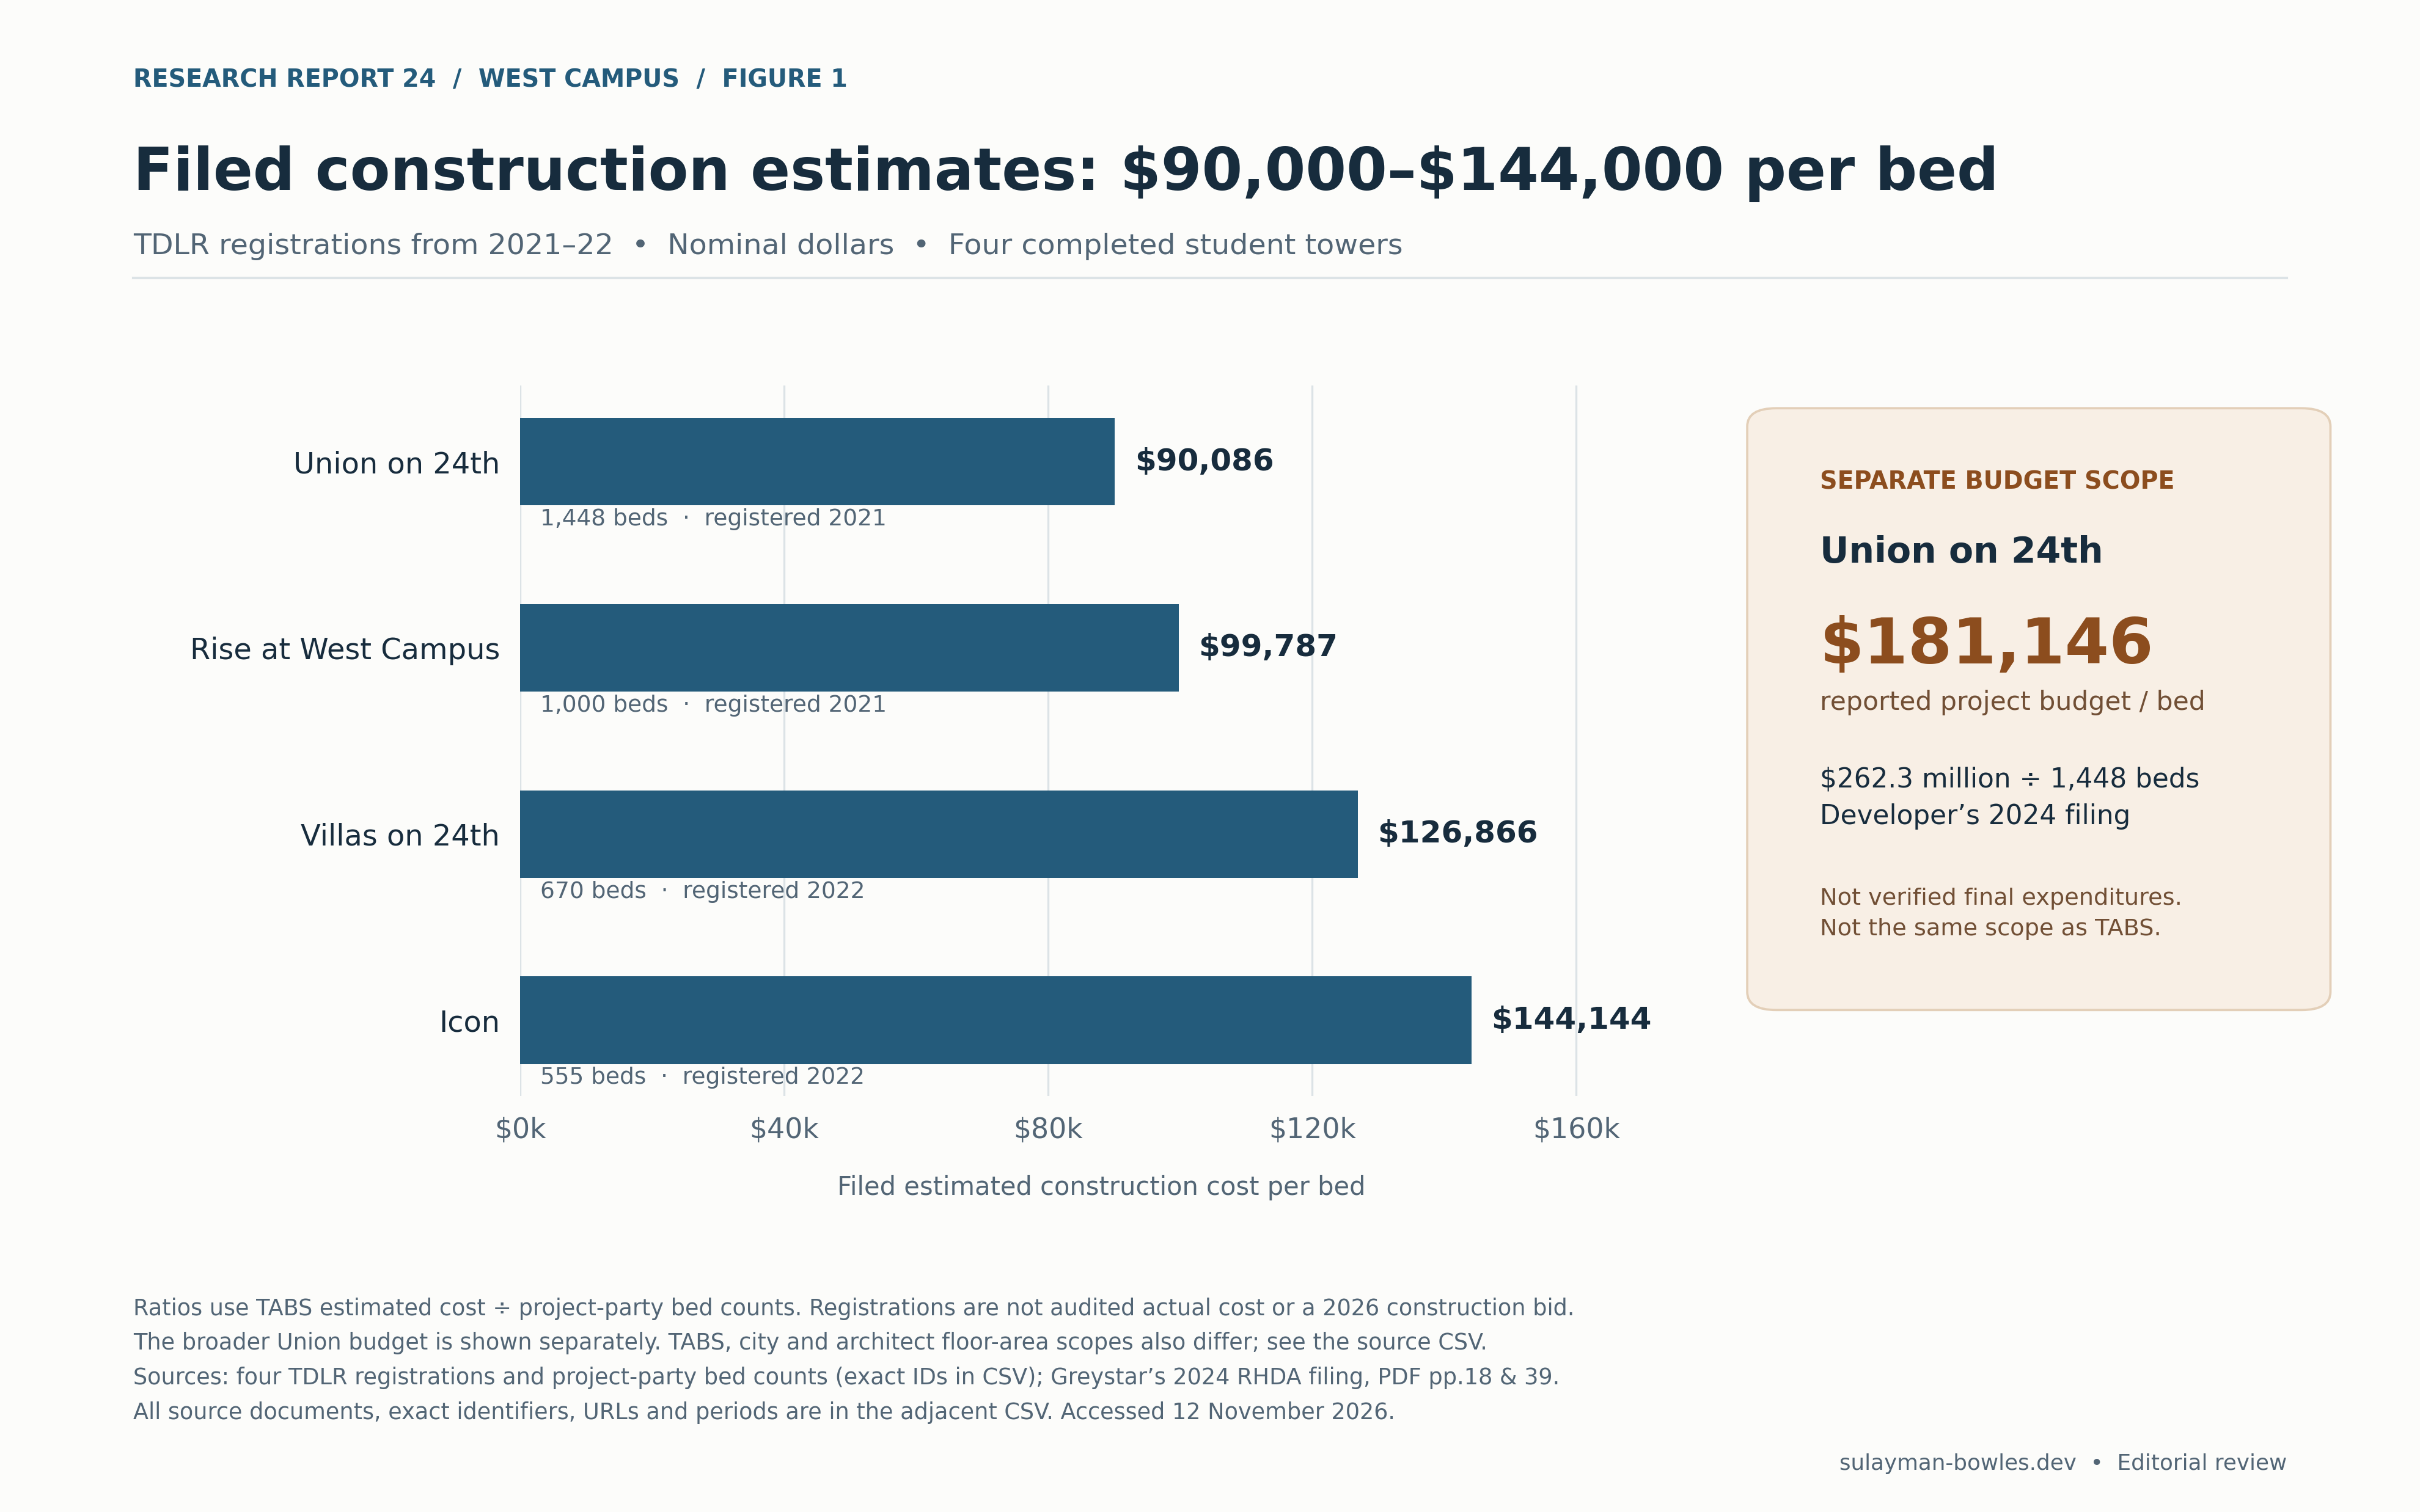
Four public TDLR Architectural Barriers records can be matched to Austin building permits and verified bed counts. Their wide range helps bound a preliminary hard-cost allowance, but scope differences prevent treating them as a clean construction price index. 3
| Tower | TABS project | Filed estimated cost | TABS gross sf | Beds | Estimate/bed | Estimate/sf |
|---|---|---|---|---|---|---|
| Union on 24th | 2021018769 | $130.444m | 702,928 | 1,448 | $90,086 | $185.57 |
| Rise/Nueces Tower | 2021018096 | $99.787m | 484,310 | 1,000 | $99,787 | $206.04 |
| Villas on 24th | 2023007727 | $85.000m | 344,328 | 670 | $126,866 | $246.86 |
| Icon/22nd and San Antonio | 2023001760 | $80.000m | 246,000 | 555 | $144,144 | $325.20 |
Austin’s matched permit valuations are $130 million, $99.787 million, $85 million and $80 million respectively. Rise’s city area is 394,423 sf versus 484,310 in TABS, so those cost-per-sf denominators are incomparable without matching the area definitions. Union’s shell and garage permits each repeat a $130 million total-job value, while the garage’s building valuation is zero. Adding the repeated total-job fields would manufacture a $260 million construction number. 3
Union provides an independent scope check. Greystar announced a $262 million development in November 2021. Its August 2024 city-hosted RHDA experience table reports $262.3 million, or $181,146 per bed and $373.15 per TABS sf. That is roughly twice the TABS estimate. The developer reports that budget. Audited final spending remains unavailable. The RHDA document’s detailed sources-and-uses schedules concern Saint John, a different project, and cannot fill missing Union line items. 3
The base tower’s $255/total-GSF hard allowance produces $96.62 million, or $120,771 per bed. It sits within the filed estimate range, while the all-in $182,660/bed is near Union’s reported development-budget scale. The comparison checks the scale of the modeled budget. Contractor bids would establish the price for this scope. Differences in parking, tower geometry, excavation, finish level, procurement date, density and scope remain material.
| Base development use | Amount | Assumption or evidence treatment |
|---|---|---|
| Land | $15.000m | Acquisition scenario; price unknown |
| Acquisition closing | $0.225m | 1.5% of land |
| Hard construction | $96.617m | $255 × 378,890 total GSF |
| Design/engineering/permits/legal/other soft costs | $11.594m | 12% of hard cost |
| Contingency | $4.831m | 5% of hard cost |
| Developer fee | $2.899m | 3% of hard cost |
| Furniture/equipment | $4.000m | $5,000 per bed |
| Preopening leasing/marketing | $0.800m | $1,000 per bed |
| UNO fee | $0.270m | $1 per residential NRA sf |
| Construction property-tax reserve | $3.152m | Simplified land/completion assessment schedule |
| Loan origination | $1.133m | 1.25% of committed principal |
| Interest through construction completion | $5.444m | Monthly equity-first draw model |
| First-year lease-up cash deficit | $0.164m | Operating cash after reserve versus interest |
| Total | $146.128m | Calculated; no claim of an executed budget |
The construction tax reserve applies the modeled rate to land throughout development and to an average 50% of hard-cost value during construction. It covers the development period. The stabilized tax estimate uses the completed assessment. No property-tax exemption is assumed. Rate-cap premiums and loan extension fees are not priced because no proposed loan documents were obtained; they would add cost if required.
5. Rent must survive vacancy, concessions, expenses and taxes
ACC’s 2021 Form 10-K reports owned-property revenue of $889.052 million, operating expenses of $407.648 million and NOI of $481.404 million. Expenses therefore consumed 45.85% of revenue. The expense definition already includes property taxes; adding another tax estimate to that ratio would double-count them. Ground rent and recurring capital expenditure need their own estimates outside this NOI measure. Its national portfolio, including differing on-campus tax arrangements, is not a direct West Campus expense quote. Same-store annual occupancy of 89.2% also differs from the 95.9% year-end point observation. 9
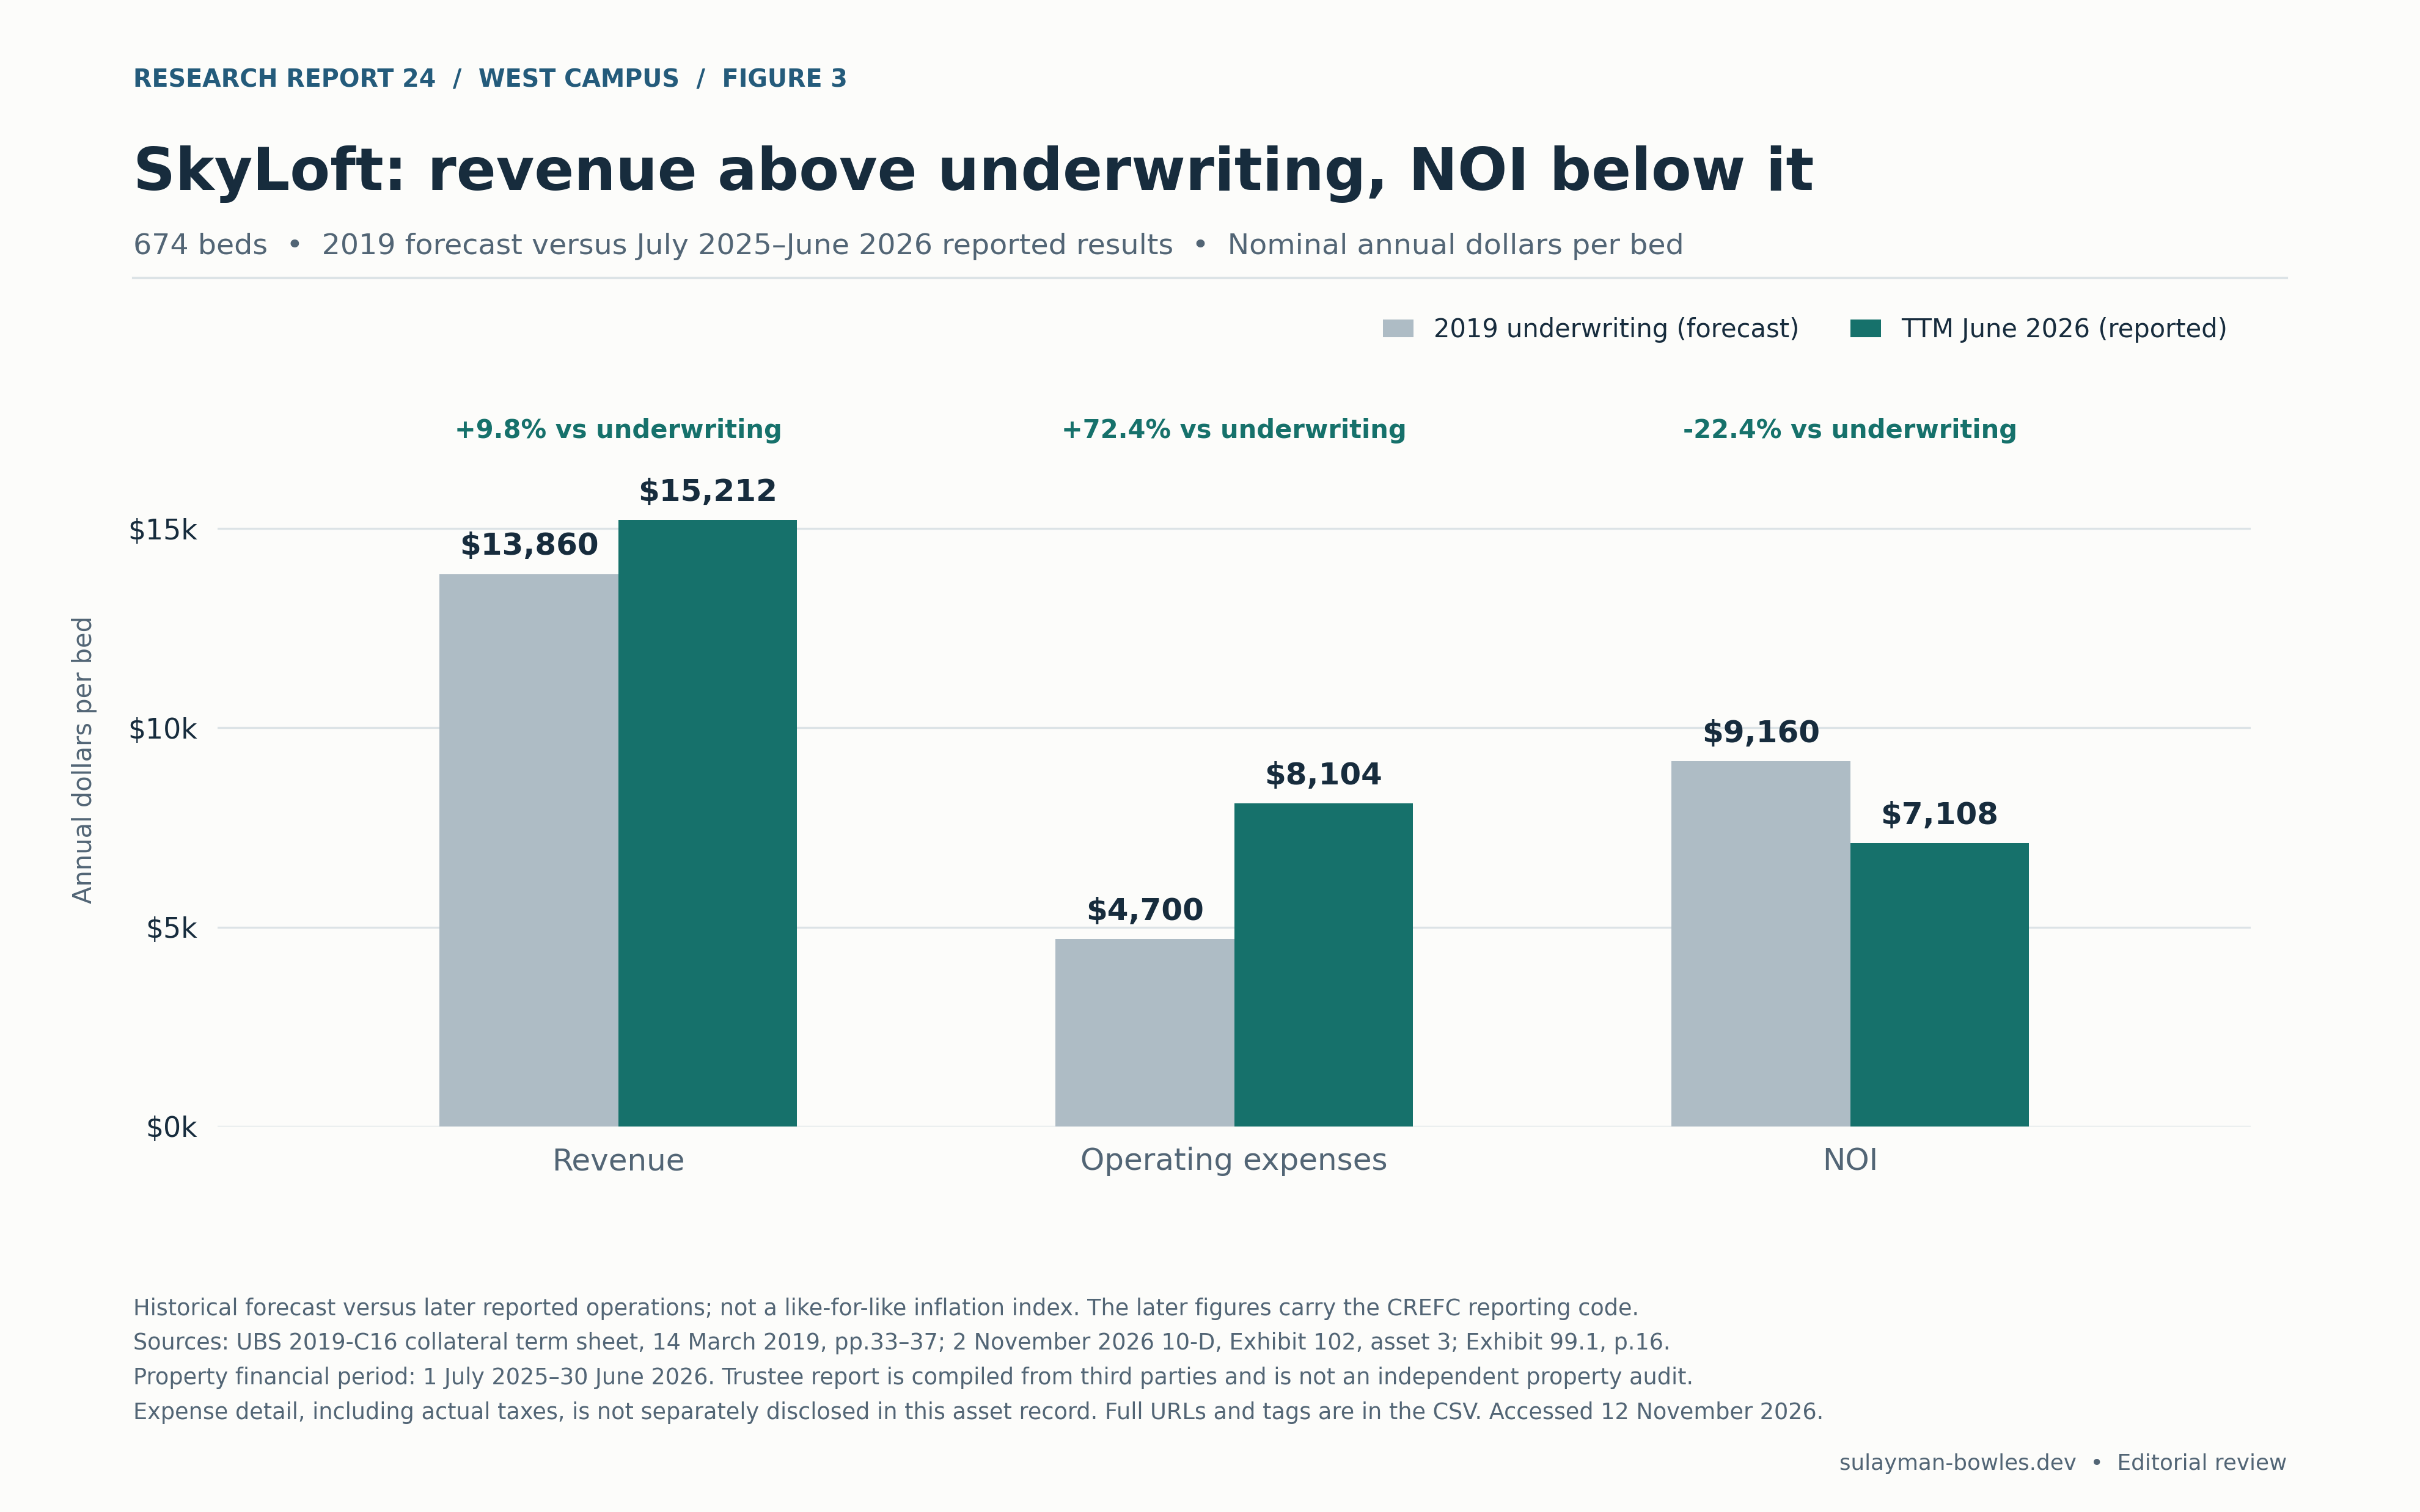
A local contemporary check is less comfortable. SkyLoft’s November 2, 2026 SEC servicing filing reports results for July 1, 2025–June 30, 2026:
| SkyLoft reported metric | Annual amount | Per bed, 674 beds |
|---|---|---|
| Revenue | $10,252,764 | $15,212 |
| Operating expense | $5,462,143 | $8,104 |
| NOI | $4,790,621 | $7,108 |
| NCF after reported deductions | $4,622,121 | $6,858 |
The expense ratio is 53.27%. The latest physical-occupancy field is 86.94%, but the servicer gives no observation date. November occupancy and the period average remain unknown. Revenue less expenses exactly reconciles to NOI, and NOI less NCF equals $250 per bed. The servicer supplies those financial figures. The readable trustee report repeats the property’s NOI across three senior-note rows; summing them would triple-count one asset. 7
The 2019 SkyLoft underwriting assumed $9.342 million revenue, $3.168 million expenses and $6.174 million NOI. Compared with that forecast, the latest reported revenue is 9.8% higher, expenses 72.4% higher and NOI 22.4% lower. The comparison shows how later results differed from the forecast. A matched series would be needed to measure expense inflation. It demonstrates why a rent-growth story alone is insufficient. [S7–S8]
The base new tower nevertheless assumes a better operating outcome: 95% stabilized occupancy, a 2% concession haircut on market rent, 0.5% bad debt, $4,000/bed of fixed non-tax costs and a 3% management fee. Concessions do not reduce the affordable cap mechanically; vacancy and bad debt still affect those beds. Other income of $30 per occupied market bed excludes additional mandatory charges on restricted beds. Parking assumes 150 spaces, 85% utilization and $200/month. A small $75,000 retail contribution before management is an unsupported allowance within the gross-area provision; removing it reduces base IRR by about 0.8 percentage point. The design specifies no retail area or lease. Austin would need to determine the applicable fee area for any retail space with a separate lease.
| Base stabilized annual operation | Amount |
|---|---|
| Market gross potential rent | $11.770m |
| Restricted gross potential rent | $2.113m |
| Collected rent after modeled losses | $12.900m |
| Other income, parking and retail contribution | $0.600m |
| Effective gross income | $13.500m |
| Fixed non-tax expense | ($3.200m) |
| Property-tax estimate | ($2.544m) |
| Management fee | ($0.405m) |
| NOI | $7.351m |
| Replacement reserve below NOI | ($0.200m) |
| Cash income before debt service | $7.151m |
That produces $7,686 of total operating expense per bed and a 45.55% expense ratio. It is close to ACC’s historical ratio and more efficient than SkyLoft’s latest reported result. The base should not be described as an aggressively stressed operating case.
Property tax estimates
The base assessment is $120 million, or $150,000 per bed, approximately the low end of the three retrieved current appraisals per bed. The downside uses $144 million and the upside $110 million. At the modeled 2.12% rate, base taxes are $2.544 million annually. The tax estimate uses appraisals as its starting point. The parcel bills remain unavailable.
The sourced tax-rate components sum to 2.121064%: City 0.579948, County 0.386210, AISD 0.918400, Central Health 0.132863 and Austin Community College 0.103643 dollars per $100. City, Central Health and ACC adopted rates were directly verified. The retrieved county material states its proposed/voter-approval rate; AISD’s official resolution text supplies its rate, but final signed adoption minutes were not retrieved for those two. The workbook therefore retains a rounded modeled rate. 6
The 2026 bills and 2025 tax payments for the three parcels remain UNKNOWN. The county public tax-roll listing was located, but its direct current-year CSV returned an access error. SkyLoft’s 2019 monthly tax escrow of $151,765 comes from the underwriting. The historical tax bill remains unverified. Zero outstanding tax advances in a servicing report is also not evidence of zero property taxes. [S6–S8]
6. Preleasing and the academic calendar create asymmetric risk
Yardi’s freely available primary reports show UT-market preleasing for 2026–27 at 68.0% in January 2026 and 89.4% in May. Reported advertised rent per bed rose from $1,269 to $1,310 across those snapshots. Its covered completed-bed count changed from 25,254 to 24,886, so this is not a matched-property rent index or evidence that 368 physical beds disappeared. The last UT-specific observation used here is from May. 11
Historical developer claims of a fully preleased opening can inform leasing milestones, but cannot justify assuming every new tower reaches that result. Nor is a November “special” a portfolio-wide concession rate. There is no verified market-wide current concession census in this evidence packet. The cases deliberately assume 6%, 2% and 0.5% market-rent concessions and first-year occupancy of 85%, 92% and 97%.
The base acquires in November 2026, spends five months in predevelopment, builds for 27 months and opens in August 2029. Two full operating years precede a July 2031 sale. Market rent and ancillary income grow 2% annually after opening, while non-tax expenses and taxes grow 3%; there is no unsupported pre-opening rent-growth credit. Restricted caps remain fixed at their observed 2026 levels.
The timing rule is intentionally severe: if completion misses the intake, the next full lease cycle begins the following August. Extending base construction from 27 to 28 months therefore raises all-in cost by about $10.47 million, delays opening a year and reduces equity IRR to −6.4%. The empty interval carries full modeled tax, half of fixed non-tax expense and interest. The loss in this case comes from missing the annual intake. A delay at a different time could have a smaller effect. Partial occupancy, temporary accommodation, lease cancellation rights and phased certificates could change the result; no project-specific agreements were available.
7. Financing, refinancing and sale values
The latest New York Fed overnight SOFR observation retrieved was 3.88% for November 9, 2026. It is neither a November 12 intraday quote nor one-month Term SOFR. Base construction pricing is an analyst assumption of SOFR plus 375 basis points, or 7.63%, versus 6.88% upside and 9.38% downside. 10
Public financing disclosures show terms lenders have used on other student housing projects. Northmarq’s October 2024 Avalon Pointe announcement describes a West Campus construction loan up to 75% LTC with a mini-perm option, but omits coupon, fees, term and recourse. ACRES’ September 2026 10-Q reports an existing student-property refinancing at Term SOFR plus 350 basis points, interest-only through June 2029 with two annual extensions; its 7.38% quarter-end coupon is a refinance observation. The filing also describes a 2023 construction loan at SOFR plus 600 basis points, paid off in September 2025. These are different properties and risk stages. 10
The model lends 65% of eligible pre-finance development cost, funds equity first, charges interest on beginning debt plus half each monthly draw, and funds loan fees, carry and lease-up deficits with equity. Base principal is $90.60 million, only 62.00% of all-in cost. Construction debt is held until sale, requiring availability through month 56 from land acquisition. That maturity/extension package is assumed. The takeout calculation tests refinancing capacity. The cash-flow schedule assumes the construction debt remains outstanding until sale.
For early permanent financing, Freddie Mac’s April 2026 student-housing term sheet shows how Freddie Mac sizes loans. A five-year amortizing structure’s standard 75% LTV/1.30× DCR is reduced by five LTV points and increased by 0.05 DCR for properties with fewer than two years of leasing operations. Full interest-only structures have additional limits, and coverage is still sized on amortizing debt service. 10
At a modeled 6.5% coupon and 30-year amortization, the annual mortgage constant is 7.5848%. The early takeout screen is:
minimum of [70% × NOI / 5.25%] and [(NOI − reserve) / 1.35 / 7.5848%]
The LTV branch permits about $98.01 million, but debt coverage permits only $69.84 million. Compared with $90.60 million construction principal, the required paydown is $20.77 million. Coverage on the entire construction balance would be approximately 1.04× under that permanent debt service, below the 1.35× sizing assumption. Lower leverage, more equity or materially greater cash income is required.
What ACC’s sale price tells us about yields
Blackstone’s ACC acquisition closed August 9, 2022, following the announced $65.47/share and approximately $12.8 billion transaction value including assumed debt. Dividing ACC’s $481.404 million FY2021 owned NOI by $12.8 billion gives 3.76%. Using the merger proxy’s projected 2022 consolidated owned NOI of $552 million gives 4.31%; its $528 million at-share figure gives 4.13%. Annualizing Q4 2021 NOI produces another screening ratio, about 4.71%. [S9, S12]
Those ratios compare NOI with corporate transaction value. Ownership shares, ground leases, the operating platform, development interests and the exact enterprise-value bridge prevent equating them with a fee-simple stabilized tower sale. The proxy’s approximately $9.2 billion of holder consideration is not Blackstone’s equity check; its two commitments of up to $2.1 billion are not all acquisition financing. 12
S&P disclosed the terms of the 2022 acquisition debt. S&P’s BX Trust 2022-GPA report describes a $1.525 billion, 51-property, 32,837-bed acquisition mortgage: two-year interest-only, three one-year extension options, and final spread 360.90164 basis points over Term SOFR, with a 3% SOFR cap used in its coverage analysis. At the cited 2.70% Term SOFR, the coupon arithmetic is about 6.31%. The loan financed the acquisition portfolio. 12
Another local sale check exists in SkyLoft’s 2019 securitization: $119.55 million purchase price against $6.174 million underwritten NOI implies 5.16%, while the $5.772 million T-four-month annualized historical NOI implies 4.83%. The underwriting included a $66.125 million whole mortgage and $35 million preferred equity with a 14% return requirement. Using only its $36 million senior securitized piece would conceal substantial capital cost. These historical yields support sensitivity testing; the 2019 transaction gives no direct November 2026 sale yield. The model’s 4.75%–6.00% exit range remains an estimate. 8
8. The sensitivities show what must change
The base has little room for adverse surprises because its 5.03% yield on cost is below its 5.25% exit yield before disposition costs. NOI grows only modestly in the hold as expenses outpace market rents and restricted rent remains fixed. The resulting $141.94 million gross exit value is below the $146.13 million development cost; 2% selling costs and debt service further weaken equity recovery.
| One change to the base | Common-equity IRR |
|---|---|
| Base | −3.2% |
| Weighted market rent $100/bed/month lower | −11.5% |
| Weighted market rent $100/bed/month higher | 3.4% |
| Hard cost $25/GSF lower | 3.0% |
| Hard cost $25/GSF higher | −9.6% |
| Exit yield 4.75%, 50 bp lower | 3.4% |
| Exit yield 5.75%, 50 bp higher | −9.9% |
| Construction coupon 100 bp lower | −2.0% |
| Construction coupon 100 bp higher | −4.4% |
| Stabilized assessment $20m lower | 1.1% |
| Stabilized assessment $20m higher | −8.1% |
| Land price $5m lower | −0.2% |
| Land price $5m higher | −6.1% |
| One-month completion slip with missed annual intake | −6.4% |
Rent changes scale each plan’s rent proportionally to produce the stated change in the weighted average; they do not add the same dollar amount to every plan. Other assumptions remain fixed, while financing and lease-up cash needs recalculate.
At an illustrative 15% common-equity hurdle, changing only one driver requires approximately $1,860 weighted monthly market rent, $181/GSF hard cost, or a 3.88% exit cap. Signed contracts and completed transactions would be needed to support those inputs. Even free land produces only about 6.2% equity IRR with the other base assumptions unchanged. Land negotiation alone therefore cannot solve this particular design and operating model.
At a 6.25% yield-on-cost hurdle, current NOI supports only about $117.61 million of total cost. Alternatively, the live model needs approximately $1,789 weighted monthly market rent, 16.8% above the base, with other drivers held fixed and carry recalculated. I use those hurdles to test the modeled investment. A sponsor’s own return would additionally require its equity contribution, fee recipient, overhead, preferred return, promote waterfall and guarantee obligations; those are unknown. The report supplies project common-equity returns and the gross developer-fee line instead of inventing a GP IRR.
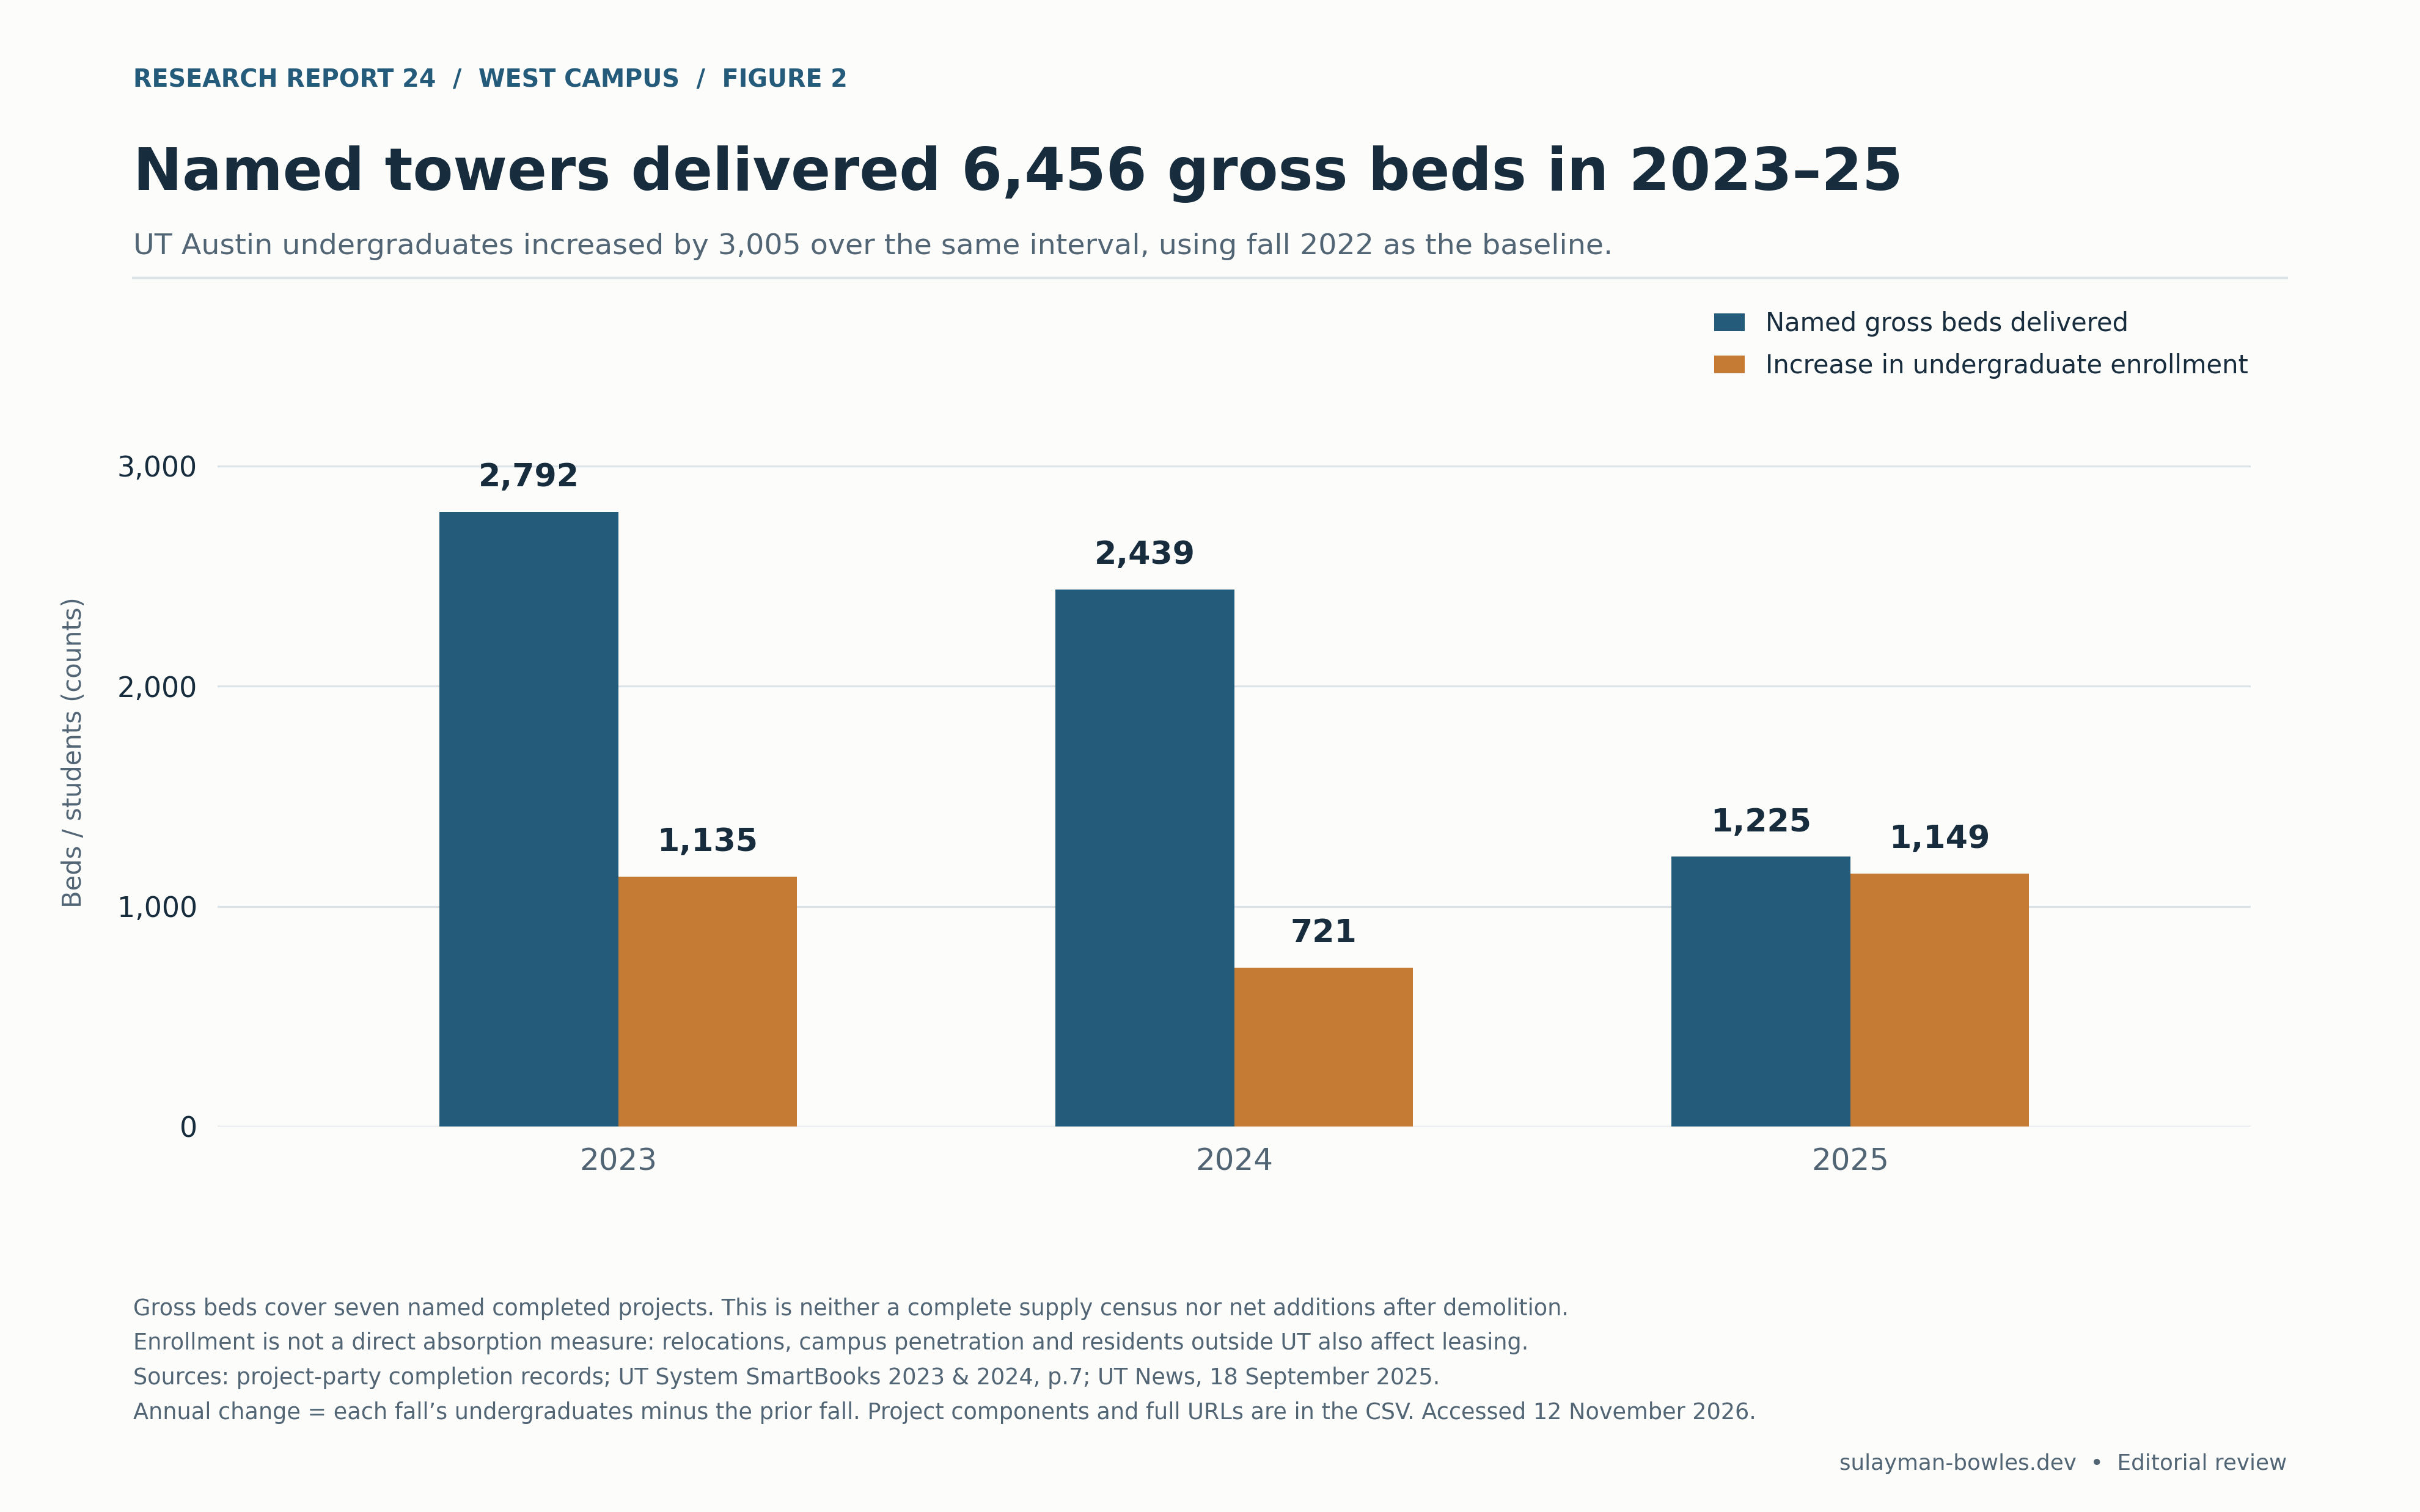
9. Beds have grown faster than enrollment in the observed delivery set
Seven named private projects delivered 6,456 gross beds in 2023–25. Over the matching fall-2022-to-fall-2025 interval, UT undergraduate enrollment grew 3,005, from 41,309 to 44,314. Total enrollment grew 2,616, from 52,384 to 55,000. The university’s 2023 and 2024 System SmartBooks document the starting observations; its 2025 release supplies the later comparisons. 13
| Delivery year | Named private projects | Gross delivered beds | Undergraduate increase that year |
|---|---|---|---|
| 2023 | Mark 975; Rambler 817; Rise 1,000 | 2,792 | 1,135 |
| 2024 | Union on 24th 1,448; Union on San Antonio 991 | 2,439 | 721 |
| 2025 | Icon 555; Villas on 24th 670 | 1,225 | 1,149 |
| Total | Seven projects | 6,456 | 3,005 |
The 6,456 beds are gross deliveries at named projects. They exceed the 3,005 increase in undergraduate enrollment by 3,451. A supply surplus would require a fuller census of net stock and off-campus demand. Demolished apartments, displaced occupants, transfers from other neighborhoods, non-UT residents, double occupancy and on-campus moves are not reconciled. Yardi independently reported roughly 6,605 delivered UT-market beds over the preceding three years in its February 2026 report, supporting the scale while using a different coverage universe. [S11, S13]
Current university demand remains large, but its incremental growth has slowed in the retrieved observations. UT reports 55,172 total students and 44,556 undergraduates for fall 2026, only 242 more undergraduates than the 2025 published figure. The 2026 release uses the 20th class day; 2025 used the 12th. That methodological change belongs beside the comparison. Neither applications nor the freshman class alone equals incremental off-campus bed demand. 14
University supply also matters. UT’s October 2026 construction advisory targets 1,055 gross Whitis beds for June 2027. The old Whitis inventory had already been removed from use, so it should not be subtracted again when measuring a 2026-to-2027 change. East Campus Graduate added 784 beds in 2024, serving a different segment. Law School Village’s May 2026 financial-close announcement specifies 340 beds for 2028–29, specifically for law students. 14
A precise net 2027 university-supply number remains unavailable. Dobie’s reported 2027–28 unavailability could not be confirmed in a public university notice. University sources also describe approximately 750 students in current housing information versus 980 physical beds in the acquisition history. Choosing either denominator silently would give false precision. Similarly, conflicting Sinclair capacity references and unverified future delivery dates prevent a clean 2026–29 private pipeline census. The supply totals leave unobserved projects unknown.
For the prototype, the implication is a capture problem. It needs 736 occupied beds in its first year and 760 at stabilization. Those residents need not all be new students, but any underwriting that assumes they arrive without displacing competing buildings needs a credible explanation based on price, product, location and the competing opening schedule.
10. Cross-checks, decisive missing evidence and the next decision
The top three findings were checked through independent routes:
- All-in cost exceeds filing cost. Union’s TDLR estimate was matched to Austin permits, then compared with Greystar’s original announcement and its later city-hosted experience table. The duplicate garage valuation was removed. Agreement on scale does not turn the budget into audited final cost.
- Operating costs can consume the rent premium. SkyLoft’s SEC asset-level XML reconciles revenue minus expense to NOI. The readable trustee exhibit matches the NOI and financial period. ACC’s audited filing supplies a historical portfolio expense definition and ratio. The XML and HTML agree for the same property and reporting period.
- The base has a financing shortfall as well as weak equity returns. NOI and takeout proceeds were independently rebuilt from rent, expense and amortization arithmetic. An independent annual-discount-rate NPV solution reproduced the monthly cash-flow IRR. The unit ledger independently reconciles both affordable branches.
The evidence that could change the answer is concrete. A parcel-specific feasible design could lower gross area per rentable bed or improve the plan mix. A real land option and an executed, scope-complete GMP could document costs substantially below the base. An achieved rent roll, with incentives and fees reconciled, could support weighted market base rent closer to the $1,860 return threshold before the model’s concessions and bad debt. Actual insurance, utility, payroll and tax records could demonstrate better operating economics. A documented permanent-loan term sheet could improve coverage or a genuine comparable sale could support a lower exit yield. A verified competing-delivery schedule could strengthen or weaken the leasing case.
The highest-value next underwriting package is therefore one real site, one architect-tested room schedule, one scope-complete budget, current parcel tax bills, an achieved comparable rent roll, and written construction/takeout terms. Until those replace the explicit estimates, the model supports selective pursuit of a demonstrably advantaged project and rejection of the base capital commitment.
Source documents and audit map
Access date for every source below: November 12, 2026. The entries give the period covered by each source. The accompanying source register and raw CSVs preserve full URLs, field/tag locations, source identifiers, retrieval limitations and exact values; model figures are labeled estimates throughout.
S1 — Current rent observations. UT Field Guide West Campus directory and the nine property-profile URLs linked in the rent table; tags “Rooms for 2027–28,” “What it costs,” fee fields and default quote checked date. Default observation periods October 26/November 4, 2026; lease period 2027–28. Independent operator check: Rambler floor plans, base/total monthly charges and bedroom privacy. The raw extraction is 67 grouped records; full catalog, plan quantities and complete areas were not retrieved.
S2 — Building age and capacity. ACC 2021 Schedule III, 26 West row, year built/units/beds; Parallel Ion/UH Austin, completed August 2016/504 beds; Moontower operator FAQ, 2020/166 units/567 beds; Landmark Standard recapitalization, December 27, 2023, completed 2021/934 beds; Waterloo developer delivery, August 8, 2022, 796 beds; LV partnership deck, PDF p11 portfolio/Rambler 2023/817 beds; Landmark 2023 deliveries, Mark July 31, 2023/975 beds; Union architect, 2024 completion. SkyLoft: S8.
S3 — Construction. TDLR Union TABS2021018769, registered June 29, 2021; Rise TABS2021018096, June 18, 2021; Villas TABS2023007727, December 16, 2022; Icon TABS2023001760, September 26, 2022. Tags: Estimated Cost, Square Footage, Scope. Austin issued-permit dataset, permits 2022-055090/055091, 2022-041295, 2023-051209, 2023-023093; fields total_job_valuation, building_valuation, total_new_add_sqft. Greystar November 3, 2021 announcement, Union paragraphs. Saint John RHDA application, August 2, 2024, physical PDF p18/footer20 and p39/footer29, experience tables only.
S4 — Current law and status. Austin amendment dashboard, “Indefinitely Postponed Amendments”; February 2026 active cases, C20-2024-010/C20-2024-005 rows. Executed Ordinance 20191114-067, effective November 25, 2019, PDF pp2–4, §25-2-756(B)(2); official council record, Item67.
S5 — Affordable rent and fees. UNO Rent Rates 2026, p1 post-2014 tables, effective June 1, 2026. UNO Compliance Guidelines 2026, pp2–3 and 9–10, especially Example3. FY2026–27 fee ordinance 20260812-006, PDF p147, UNO residential row, effective October 1, 2026. Canonical city rent-limit page links the current guides.
S6 — Parcels, deeds and taxes. TCAD 2026 records: SkyLoft PID203505, Waterloo PID206695, Rambler PID963472; public search pYear=2026, valueReady=1, landValue/improvementValue/appraisedValue. Public deed metadata example; corresponding PID endpoints in the raw register. County GIS, layer0/PID matches. Tax Office public listing, current/prior-delinquent roll access gap. Rate documents: City adopted rates; County FY2027 taxpayer impact statement, p1; AISD 2026 resolution, Motion1; Central Health FY2027 budget, adopted table; ACC September 16, 2026 announcement. Final county/AISD signed adoption and parcel bills remain unverified.
S7 — SkyLoft current reported operations. UBS Commercial Mortgage Trust 2019-C16, filed November 2, 2026, Exhibit102 XML, assetNumber3/propertyName SkyLoft Austin; tags mostRecentFinancialsStartDate, mostRecentFinancialsEndDate, mostRecentRevenueAmount, operatingExpensesAmount, mostRecentNetOperatingIncomeAmount and mostRecentNetCashFlowAmount; July 1, 2025–June 30, 2026. Exhibit99.1, p16 rows3A1–3A3 and p1 third-party-information qualification. The CSVs identify the XML tags.
S8 — SkyLoft historical transaction and underwriting. UBS2019-C16 collateral term sheet, March 14, 2019 FWP, pp33–38: property, unit mix, sources/uses, whole-loan footnotes, operating history and cash-flow table; printed p38 “Escrows and Reserves” supplies the monthly tax escrow. “2018” historical column is T-four-month annualized; 2019 figures are underwriting. Tax escrow is estimated.
S9 — ACC historical operations. ACC2021 Form10-K, filed February 28, 2022, MD&A p33 NOI table/footnotes and F-5 income statement. FY2021 earnings release, February 22, 2022, Table4 and operating metrics. Reporting period FY2021 and Q4 2021.
S10 — Financing. NY Fed SOFR API, effectiveDate/percentRate, November 9, 2026 observation; FRED SOFR cross-check of the same underlying series. Northmarq Avalon Pointe, October 2, 2024 transaction narrative. ACRES Q32026 Form10-Q, pp33/36 financing table and mortgage note; quarter ended September 30, 2026. Freddie Mac Student Housing term sheet, April 2026 pp2–3, DCR/LTV and early-operation footnote.
S11 — Prelease pace and independent supply-scale check. Yardi Matrix February 2026 report, pp3/5, January 2026 UT row and three-year deliveries; June 2026 report, p5, May 2026 UT row. AY 2026–27 survey snapshots.
S12 — Blackstone/ACC. April 19, 2022 signing release, transaction terms; August 9, 2022 closing release. June 16, 2022 definitive merger proxy, printed p47 prospective NOI and footnotes, p56 Financing. S&P BX Trust2022-GPA Assigned Ratings, September 29, 2022 overview/final spread. All historical acquisition evidence.
S13 — Delivered beds and enrollment history. Opening sources in S2 plus Brodeur project list, Rise completed2023/1,000 beds; Hensel Phelps Saint Austin redevelopment, completed August 2024/991 student beds; Villas portfolio, 2025/670 beds; Icon architect, 555 beds, and issuer completion release in raw register. UT System SmartBook2023, January 2024 update, p7 UTAUS row, fall2022; SmartBook2024, p7, fall2023. UT September 18, 2025 release, fall2024/2025 table, 12th-class-day basis.
S14 — Current enrollment and university supply. UT September 22, 2026 release, enrollment paragraph, 20th-class-day basis; UT Facts & Figures, matching current totals. Whitis construction advisory, October 21, 2026, project dates/summary, June 2027 target. UT campus-plan retrospective, February 24, 2026 housing paragraph, East Campus784 beds in2024/Dobie980 acquisition capacity. UT housing catalog, current Dobie approximately750 students. Greystar Law School Village financial close, May 6, 2026, 340 beds/2028–29 target.
Deliverable and model conventions
The workbook includes editable Inputs, formula-based Calculations, Output, individual Units, monthly Cash_Flows, live Sensitivity, dated Rent_Observations and Evidence. Low/base/high cases and the extra-onsite alternative appear as individual cases. The rent/exit sensitivity uses exact incremental monthly cash flows, with changed rents, sale proceeds and repayment, while construction draws remain unchanged. Raw CSVs preserve observations, sources, unit allocations, scenario outputs and sensitivities. The CSV collection includes the figure data. The model uses monthly cash flows, annualizes monthly IRR, and labels historical transactions and forward assumptions.
- S1 — Current rent observations. UT Field Guide West Campus directory and the nine property-profile URLs linked in the rent table; tags “Rooms for 2027–28,” “What it costs,” fee fields and default quote checked date. Default observation periods October 26/November 4, 2026; lease period 2027–28. Independent operator check: Rambler floor plans, base/total monthly charges and bedroom privacy. The raw extraction is 67 grouped records; full catalog, plan quantities and complete areas were not retrieved. ↩
- S8 — SkyLoft historical transaction and underwriting. UBS2019-C16 collateral term sheet, March 14, 2019 FWP, pp33–38: property, unit mix, sources/uses, whole-loan footnotes, operating history and cash-flow table; printed p38 “Escrows and Reserves” supplies the monthly tax escrow. “2018” historical column is T-four-month annualized; 2019 figures are underwriting. Tax escrow is estimated. ↩
- S4 — Current law and status. Austin amendment dashboard, “Indefinitely Postponed Amendments”; February 2026 active cases, C20-2024-010/C20-2024-005 rows. Executed Ordinance 20191114-067, effective November 25, 2019, PDF pp2–4, §25-2-756(B)(2); official council record, Item67. ↩
- S5 — Affordable rent and fees. UNO Rent Rates 2026, p1 post-2014 tables, effective June 1, 2026. UNO Compliance Guidelines 2026, pp2–3 and 9–10, especially Example3. FY2026–27 fee ordinance 20260812-006, PDF p147, UNO residential row, effective October 1, 2026. Canonical city rent-limit page links the current guides. ↩
- S6 — Parcels, deeds and taxes. TCAD 2026 records: SkyLoft PID203505, Waterloo PID206695, Rambler PID963472; public search pYear=2026, valueReady=1, landValue/improvementValue/appraisedValue. Public deed metadata example; corresponding PID endpoints in the raw register. County GIS, layer0/PID matches. Tax Office public listing, current/prior-delinquent roll access gap. Rate documents: City adopted rates; County FY2027 taxpayer impact statement, p1; AISD 2026 resolution, Motion1; Central Health FY2027 budget, adopted table; ACC September 16, 2026 announcement. Final county/AISD signed adoption and parcel bills remain unverified. ↩
- S3 — Construction. TDLR Union TABS2021018769, registered June 29, 2021; Rise TABS2021018096, June 18, 2021; Villas TABS2023007727, December 16, 2022; Icon TABS2023001760, September 26, 2022. Tags: Estimated Cost, Square Footage, Scope. Austin issued-permit dataset, permits 2022-055090/055091, 2022-041295, 2023-051209, 2023-023093; fields total_job_valuation, building_valuation, total_new_add_sqft. Greystar November 3, 2021 announcement, Union paragraphs. Saint John RHDA application, August 2, 2024, physical PDF p18/footer20 and p39/footer29, experience tables only. ↩
- S9 — ACC historical operations. ACC2021 Form10-K, filed February 28, 2022, MD&A p33 NOI table/footnotes and F-5 income statement. FY2021 earnings release, February 22, 2022, Table4 and operating metrics. Reporting period FY2021 and Q4 2021. ↩
- S7 — SkyLoft current reported operations. UBS Commercial Mortgage Trust 2019-C16, filed November 2, 2026, Exhibit102 XML, assetNumber3/propertyName SkyLoft Austin; tags mostRecentFinancialsStartDate, mostRecentFinancialsEndDate, mostRecentRevenueAmount, operatingExpensesAmount, mostRecentNetOperatingIncomeAmount and mostRecentNetCashFlowAmount; July 1, 2025–June 30, 2026. Exhibit99.1, p16 rows3A1–3A3 and p1 third-party-information qualification. The CSVs identify the XML tags. ↩
- S11 — Prelease pace and independent supply-scale check. Yardi Matrix February 2026 report, pp3/5, January 2026 UT row and three-year deliveries; June 2026 report, p5, May 2026 UT row. AY 2026–27 survey snapshots. ↩
- S10 — Financing. NY Fed SOFR API, effectiveDate/percentRate, November 9, 2026 observation; FRED SOFR cross-check of the same underlying series. Northmarq Avalon Pointe, October 2, 2024 transaction narrative. ACRES Q32026 Form10-Q, pp33/36 financing table and mortgage note; quarter ended September 30, 2026. Freddie Mac Student Housing term sheet, April 2026 pp2–3, DCR/LTV and early-operation footnote. ↩
- S12 — Blackstone/ACC. April 19, 2022 signing release, transaction terms; August 9, 2022 closing release. June 16, 2022 definitive merger proxy, printed p47 prospective NOI and footnotes, p56 Financing. S&P BX Trust2022-GPA Assigned Ratings, September 29, 2022 overview/final spread. All historical acquisition evidence. ↩
- S13 — Delivered beds and enrollment history. Opening sources in S2 plus Brodeur project list, Rise completed2023/1,000 beds; Hensel Phelps Saint Austin redevelopment, completed August 2024/991 student beds; Villas portfolio, 2025/670 beds; Icon architect, 555 beds, and issuer completion release in raw register. UT System SmartBook2023, January 2024 update, p7 UTAUS row, fall2022; SmartBook2024, p7, fall2023. UT September 18, 2025 release, fall2024/2025 table, 12th-class-day basis. ↩
- S14 — Current enrollment and university supply. UT September 22, 2026 release, enrollment paragraph, 20th-class-day basis; UT Facts & Figures, matching current totals. Whitis construction advisory, October 21, 2026, project dates/summary, June 2027 target. UT campus-plan retrospective, February 24, 2026 housing paragraph, East Campus784 beds in2024/Dobie980 acquisition capacity. UT housing catalog, current Dobie approximately750 students. Greystar Law School Village financial close, May 6, 2026, 340 beds/2028–29 target. ↩
Supporting material
- Excel model ↗Sourced inputs, live calculations and reported outputs.
- Source and model data (CSV collection) ↗Data tables, source references and calculation exports.
- Scenario results ↗Download as CSV.
- Uno 2026 rent caps ↗Download as CSV.