Texas business
The unit economics of a Buc-ee’s
A new travel center costs about $70 million in the model and earns $14 million in annual store EBITDA once mature.

A new, large Buc-ee’s probably requires about $70 million of funded investment, including land and opening capital. A reasonable planning range is $55–90 million, depending on land, road works, construction scope and location. Buc-ee’s has not disclosed a chain-wide average.
For a mature, roughly 75,000-square-foot travel center with 120 fueling positions, the model produces $14.1 million of annual store EBITDA—earnings before interest, taxes, depreciation and amortization—and $8.9 million of annual cash after a normalized income-tax allowance and replacement spending. That cash figure precedes headquarters costs and interest. On a $70 million investment, simple stabilized cash payback is 7.9 years, rising to 9.1 years after an illustrative headquarters allocation.
For the whole chain, the central valuation indications are $3.5 billion from discounted cash flow and $5.2 billion from a 13× EBITDA multiple. These are enterprise values, before subtracting net debt or other financial claims. Buc-ee’s net debt is unknown, so this research cannot turn them into a defensible equity-market capitalization.
The decisive uncertainty is inside sales. Municipal records independently support substantial taxable activity at individual projects, but they do not disclose Buc-ee’s product margins, labor hours or profit. Holding the other central assumptions fixed, moving annual inside sales from $45 million to $75 million moves the chain’s multiple-based value from $2.7 billion to $7.7 billion. The corresponding cash-flow values move from $0.9 billion to $6.2 billion. A precise valuation would conceal more than it reveals.
| Headline | Central model | What independently checks it |
|---|---|---|
| Funded cost of a modern store | $70m | Texas construction registrations; a county-hosted land-sale comparable; a municipal development-cost study |
| Mature annual store EBITDA | $14.1m | Project-specific tax rebates constrain sales; public peers constrain margins; hiring disclosures constrain labor. None independently discloses Buc-ee’s profit. |
| Chain enterprise value | $3.5–5.2bn | A cash-flow valuation and contemporaneous public-company multiples; both still depend on estimated operating earnings |
The accompanying workbook distinguishes documented facts from assumptions and formulas. The three operating scenarios vary assumptions together. A sensitivity test holds everything except inside sales constant.
1. What costs $70 million?
The cleanest construction evidence is Texas’s Architectural Barriers project-registration system, TDLR TABS. Its cost fields are estimates submitted at registration. Final invoices remain unavailable. Nevertheless, several similarly sized projects give an identifiable range.1
| Project | Registration date | Registered area | Registered estimated cost | Fueling positions: individual current/project source |
|---|---|---|---|---|
| Hillsboro, Texas | June 1, 2022 | 74,707 sq ft | $60.0m | 120 |
| Luling replacement, Texas | July 20, 2022 | 74,800 sq ft | $40.0m | 120 |
| Amarillo, Texas | January 16, 2023 | 74,707 sq ft | $38.0m | 108 at opening |
| San Marcos, Texas | August 7, 2024 | 74,707 sq ft | $47.2m | 128 at opening |
| Boerne, Texas, still in pipeline | June 13, 2023 | 53,471 sq ft | $38.0m | No more than 100 under the 2026 amendment |
The four registrations around 75,000 square feet have a $43.6 million median. Including the smaller Boerne project would change that statistic without improving the comparison. Nor should a registered completion date be treated as an opening date: Boerne’s old form anticipated completion in 2024, while the current company schedule says 2028.2
Scope matters. Hillsboro’s registration expressly includes grading, paving, parking, drives and access to fueling stations. Boerne’s includes site works and fuel canopies. Adding a second complete forecourt or paving budget to these figures would double count spending. The model’s $6 million supplementary allowance therefore covers only equipment, soft costs and contingency outside its assumed construction scope. That boundary is an assumption requiring a real project ledger to resolve.
Area definitions also differ. Luling’s registration has a 74,800-square-foot field and a 74,707-square-foot narrative; the company’s world-record page describes 75,593 square feet. These differences appear in the data files. The model uses 74,707 square feet as a representative design, since the records do not share one exact measurement.1, 2
Land is outside the construction estimate—and appraisal value is not purchase price
County records provide ownership, parcel and valuation evidence, but the sampled Texas records do not disclose whole-site acquisition consideration. The relevant 2026 main-parcel land appraisals are approximately $0.93 million in Hillsboro, $2.52 million in Luling and $3.23 million in Bastrop. Their total real-property appraisals are approximately $15.07 million, $16.65 million and $12.25 million, respectively. Those are tax-roll values with different purposes and scopes from construction budgets.3
Bastrop’s export identifies a principal 59,656-square-foot commercial building. An aggregate area field also includes other improvement records and should not be mistaken for an enormous retail floor. Its sale record identifies an October 20, 2010 deed, book 2026, page 437, but the exported price field is zero. The purchase price remains unknown; zero is not evidence of a free acquisition.
A better acquisition-price observation comes from a Maricopa County-hosted appraisal. Its detailed comparable-sale sheet records Buc-ee’s Goodyear purchase on March 12, 2024: 24.13 acres for approximately $17.25 million, with deed reference 2024-0127130. The public appraisal supplies that price. It has not been verified against the deed. The detailed sheet and summary differ by $141, immaterial to the rounded figure but preserved in the source notes.4
Texas also provides a narrower transaction: the Transportation Commission’s March 27, 2025 minutes authorize a $1.905 million surplus right-of-way sale for the Boerne development. The tract supplements the store site.4
The all-in budget
| Estimated use of funds | Lower-cost site | Central site | Higher-cost site |
|---|---|---|---|
| Construction and site works | $43.00m | $54.00m | $62.75m |
| Incremental equipment, soft costs and reserve | $4.00m | $6.00m | $6.00m |
| Land | $5.00m | $7.00m | $17.25m |
| Opening net working capital and pre-opening cash | $3.00m | $3.00m | $4.00m |
| Total funded investment | $55.00m | $70.00m | $90.00m |
These columns show three modeled budgets. The central construction allowance is above San Marcos’s registered estimate and below Hillsboro’s. The higher land allowance reflects the Goodyear observation; county appraisals do not set the acquisition budget.
An independent scope check is Palmer Lake, Colorado’s April 24, 2025 fiscal-impact analysis. It estimates $63.25 million of development excluding land, plus $7.1 million of land, or $70.35 million before opening capital. Adding this model’s $3 million opening allowance gives $73.35 million, reasonably close to the $70 million central budget. The study’s $10.52 million transportation component is already included in development costs. The town annexation application was withdrawn. Buc-ee’s submitted a site plan to El Paso County on October 12, 2026. The land figure remains a consultant assumption. El Paso County project update5
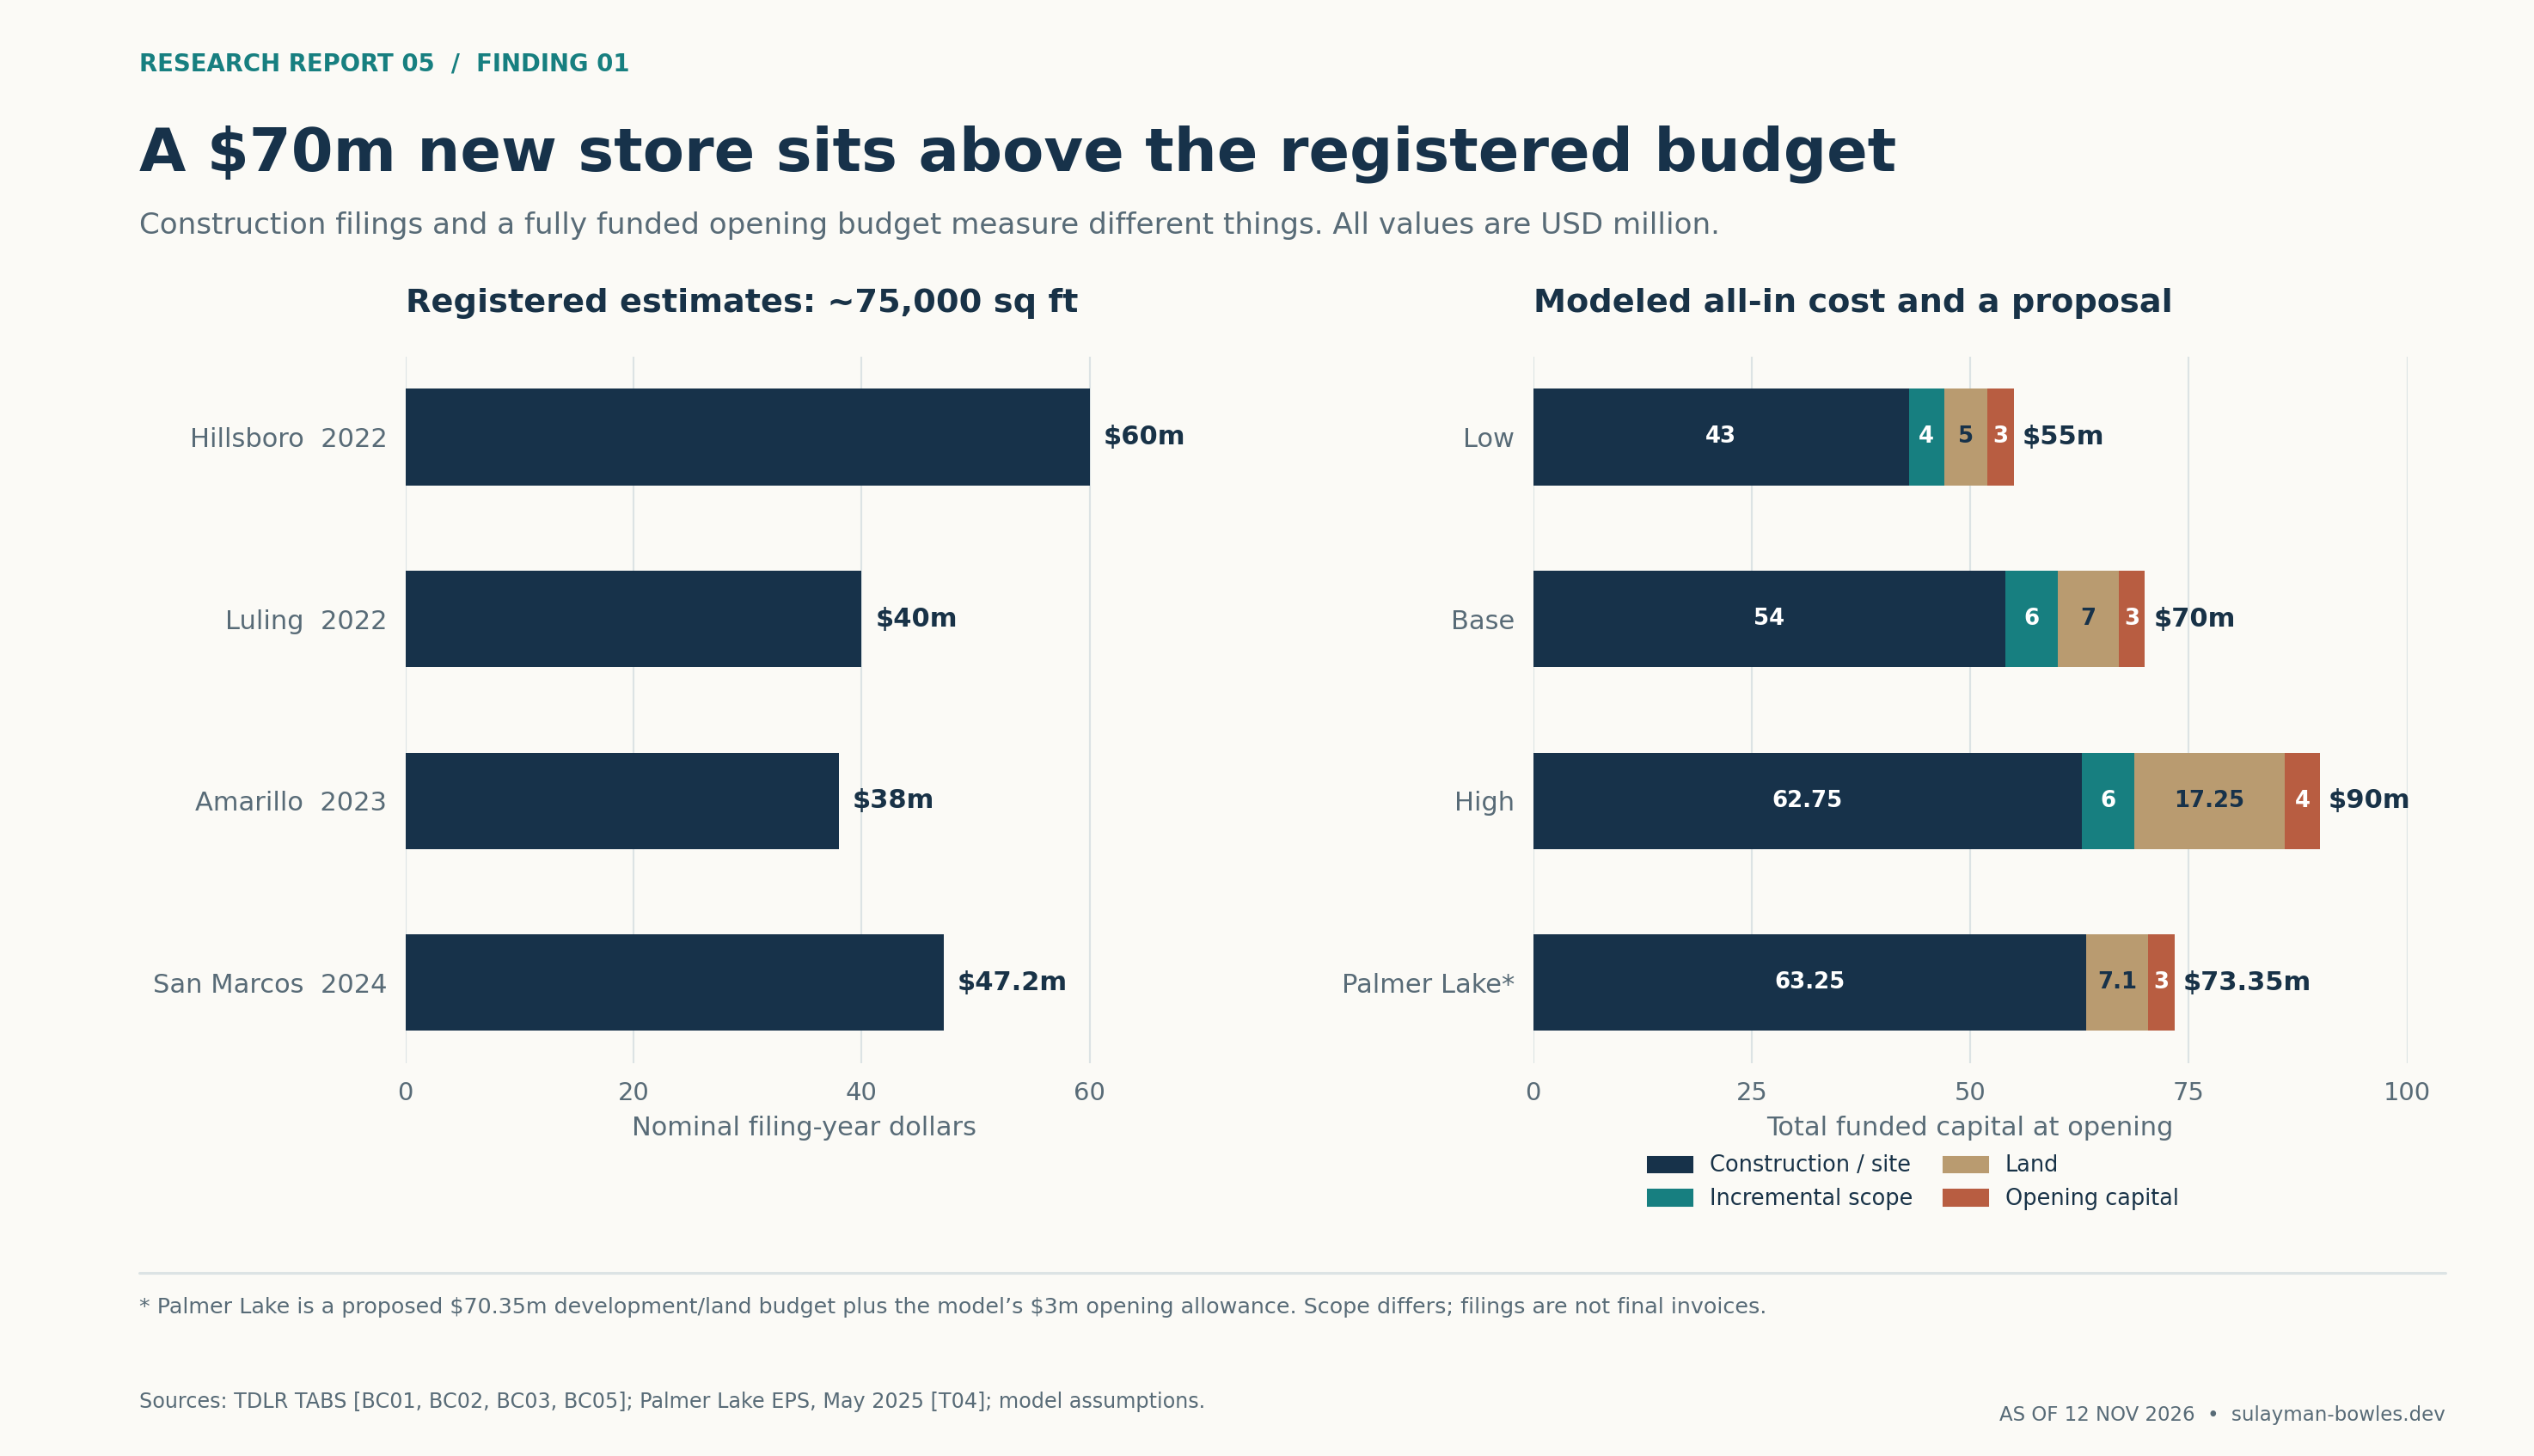
Figure 1. The construction registrations and the all-in budget cover different scopes. Sources: TDLR project records; Maricopa County-hosted appraisal; Palmer Lake fiscal-impact analysis; model assumptions. Chart data and exact source locators accompany the figure.
2. Public tax records put limits on the inside-sales guess
A Buc-ee’s fuel canopy is visible. The contents of its cash registers are not. The most informative public evidence found here is a local government’s actual payment under a project-specific sales-tax agreement.
Waller’s audited accounts report a $380,526 Buc-ee’s rebate expense for the year ended September 30, 2025. The February 20, 2012 agreement returns 75% of an eligible 1% city sales tax after the Comptroller’s 2% collection fee. Its project definition excludes tax from other locations within the city, and its payment schedule calls for recorded taxable sales.6
The resulting calculation is:
$380,526 ÷ (75% × 1% × 98%) = $51.77 million of taxable-sales equivalent.
The same calculation produces $50.41 million for FY2024 and $44.75 million for FY2022. In both earlier years, the audit also discloses eligible receipts and rebate expense, and the two reconcile exactly at 75%. This strengthens the interpretation of the formula.7
“Taxable-sales equivalent” is deliberate. It is an inference from audited municipal expenditure. Buc-ee’s point-of-sale revenue is undisclosed. Timing, refunds and the precise allocation of eligible receipts can affect the conversion. Even so, it is much stronger evidence of project scale than an unsourced estimate of visitors or annual revenue.
A second project points in a similar direction
Hill County’s FY2025 audit names Buc-ee’s Hillsboro, LLC and reports $200,333 rebated. Its agreement returns the county’s entire 0.5% project sales tax, net of state fees, for ten years, beginning January 1 after opening. Hillsboro opened April 21, 2024; the incentive therefore began in January 2025.8
Dividing the rebate by 0.5% × 98% yields $40.88 million for the first partial payment year. If it represented exactly nine sales months, annualizing would produce $54.51 million. The audit does not identify the underlying return months, however. The first figure is a partial-period equivalent; the second is an explicitly conditional annualization. Neither should be presented as a directly observed full year of store sales.
Together, Waller and Hill County support the plausibility of taxable activity around $50 million at individual centers. They do not show the chain average. The sampled stores differ in age, format and traffic.
Why “taxable” is not the same as “inside”
Texas prepared-food and merchandise transactions are often taxable, while some grocery and bakery transactions are exempt. Motor fuel subject to the fuel tax is excluded from this general sales-tax calculation. Thus, municipal allocations cannot be used to infer gasoline gallons.9
If Waller’s $51.77 million represented 80% of inside sales, total inside sales would be $64.72 million. At assumed taxable shares of 70–90%, the implied range is approximately $57.5–74.0 million. The taxable share is unknown. The sensitivity varies the taxable share of sales.
The main model therefore uses $45 million, $60 million and $75 million as annual inside-sales scenarios. The central $60 million is a judgment informed by the project figures.
The before-and-after city comparison is weaker than it first looks
Texas Comptroller allocations to Hillsboro rose from $5.121 million in July 2023–June 2024 to $6.057 million in July 2024–June 2025, an 18.27% increase. The next July–June window was $6.108 million. The city’s 1.5% rate was checked against every quarterly rate file from late 2022 through late 2026.10
The first increase, divided by the city rate and collection-fee adjustment, mechanically corresponds to $63.65 million of additional taxable sales. Allowing the rest of the city 5% counterfactual growth reduces the equivalent to $46.24 million. Neither figure isolates Buc-ee’s.
The detailed allocation dataset explains why. Of the $956,720 increase in gross collections, only $567,189 sits in the “current collections” category. Future collections increased $212,104, audit collections $124,466, prior collections $32,965, and single-local-rate collections $20,087; unidentified collections fell slightly. These categories describe processing across all city taxpayers.
It would be equally unjustified to assign every adjustment to Buc-ee’s or to declare them unrelated. City allocations also reflect other business activity, possible displacement, late returns and refunds. Distributions generally lag sales by at least two months, and the earlier comparison window contains a small opening-period stub. The evidence does not prove that one store dominates the whole city tax base.
Luling supplies a further caution: its 2024 center replaced an existing Buc-ee’s. A change in Luling’s allocations captures the expansion alongside other activity across the city. The store’s total revenue is unknown.11
The data package preserves both official allocation datasets. All 116 overlapping Hillsboro and Luling observations reconcile exactly. Detailed November 2026 rows carry an allocation date of November 10 and were available by November 12, ahead of the scheduled November 16 distribution; the city had published the allocations by the cutoff. Receipt was unconfirmed.
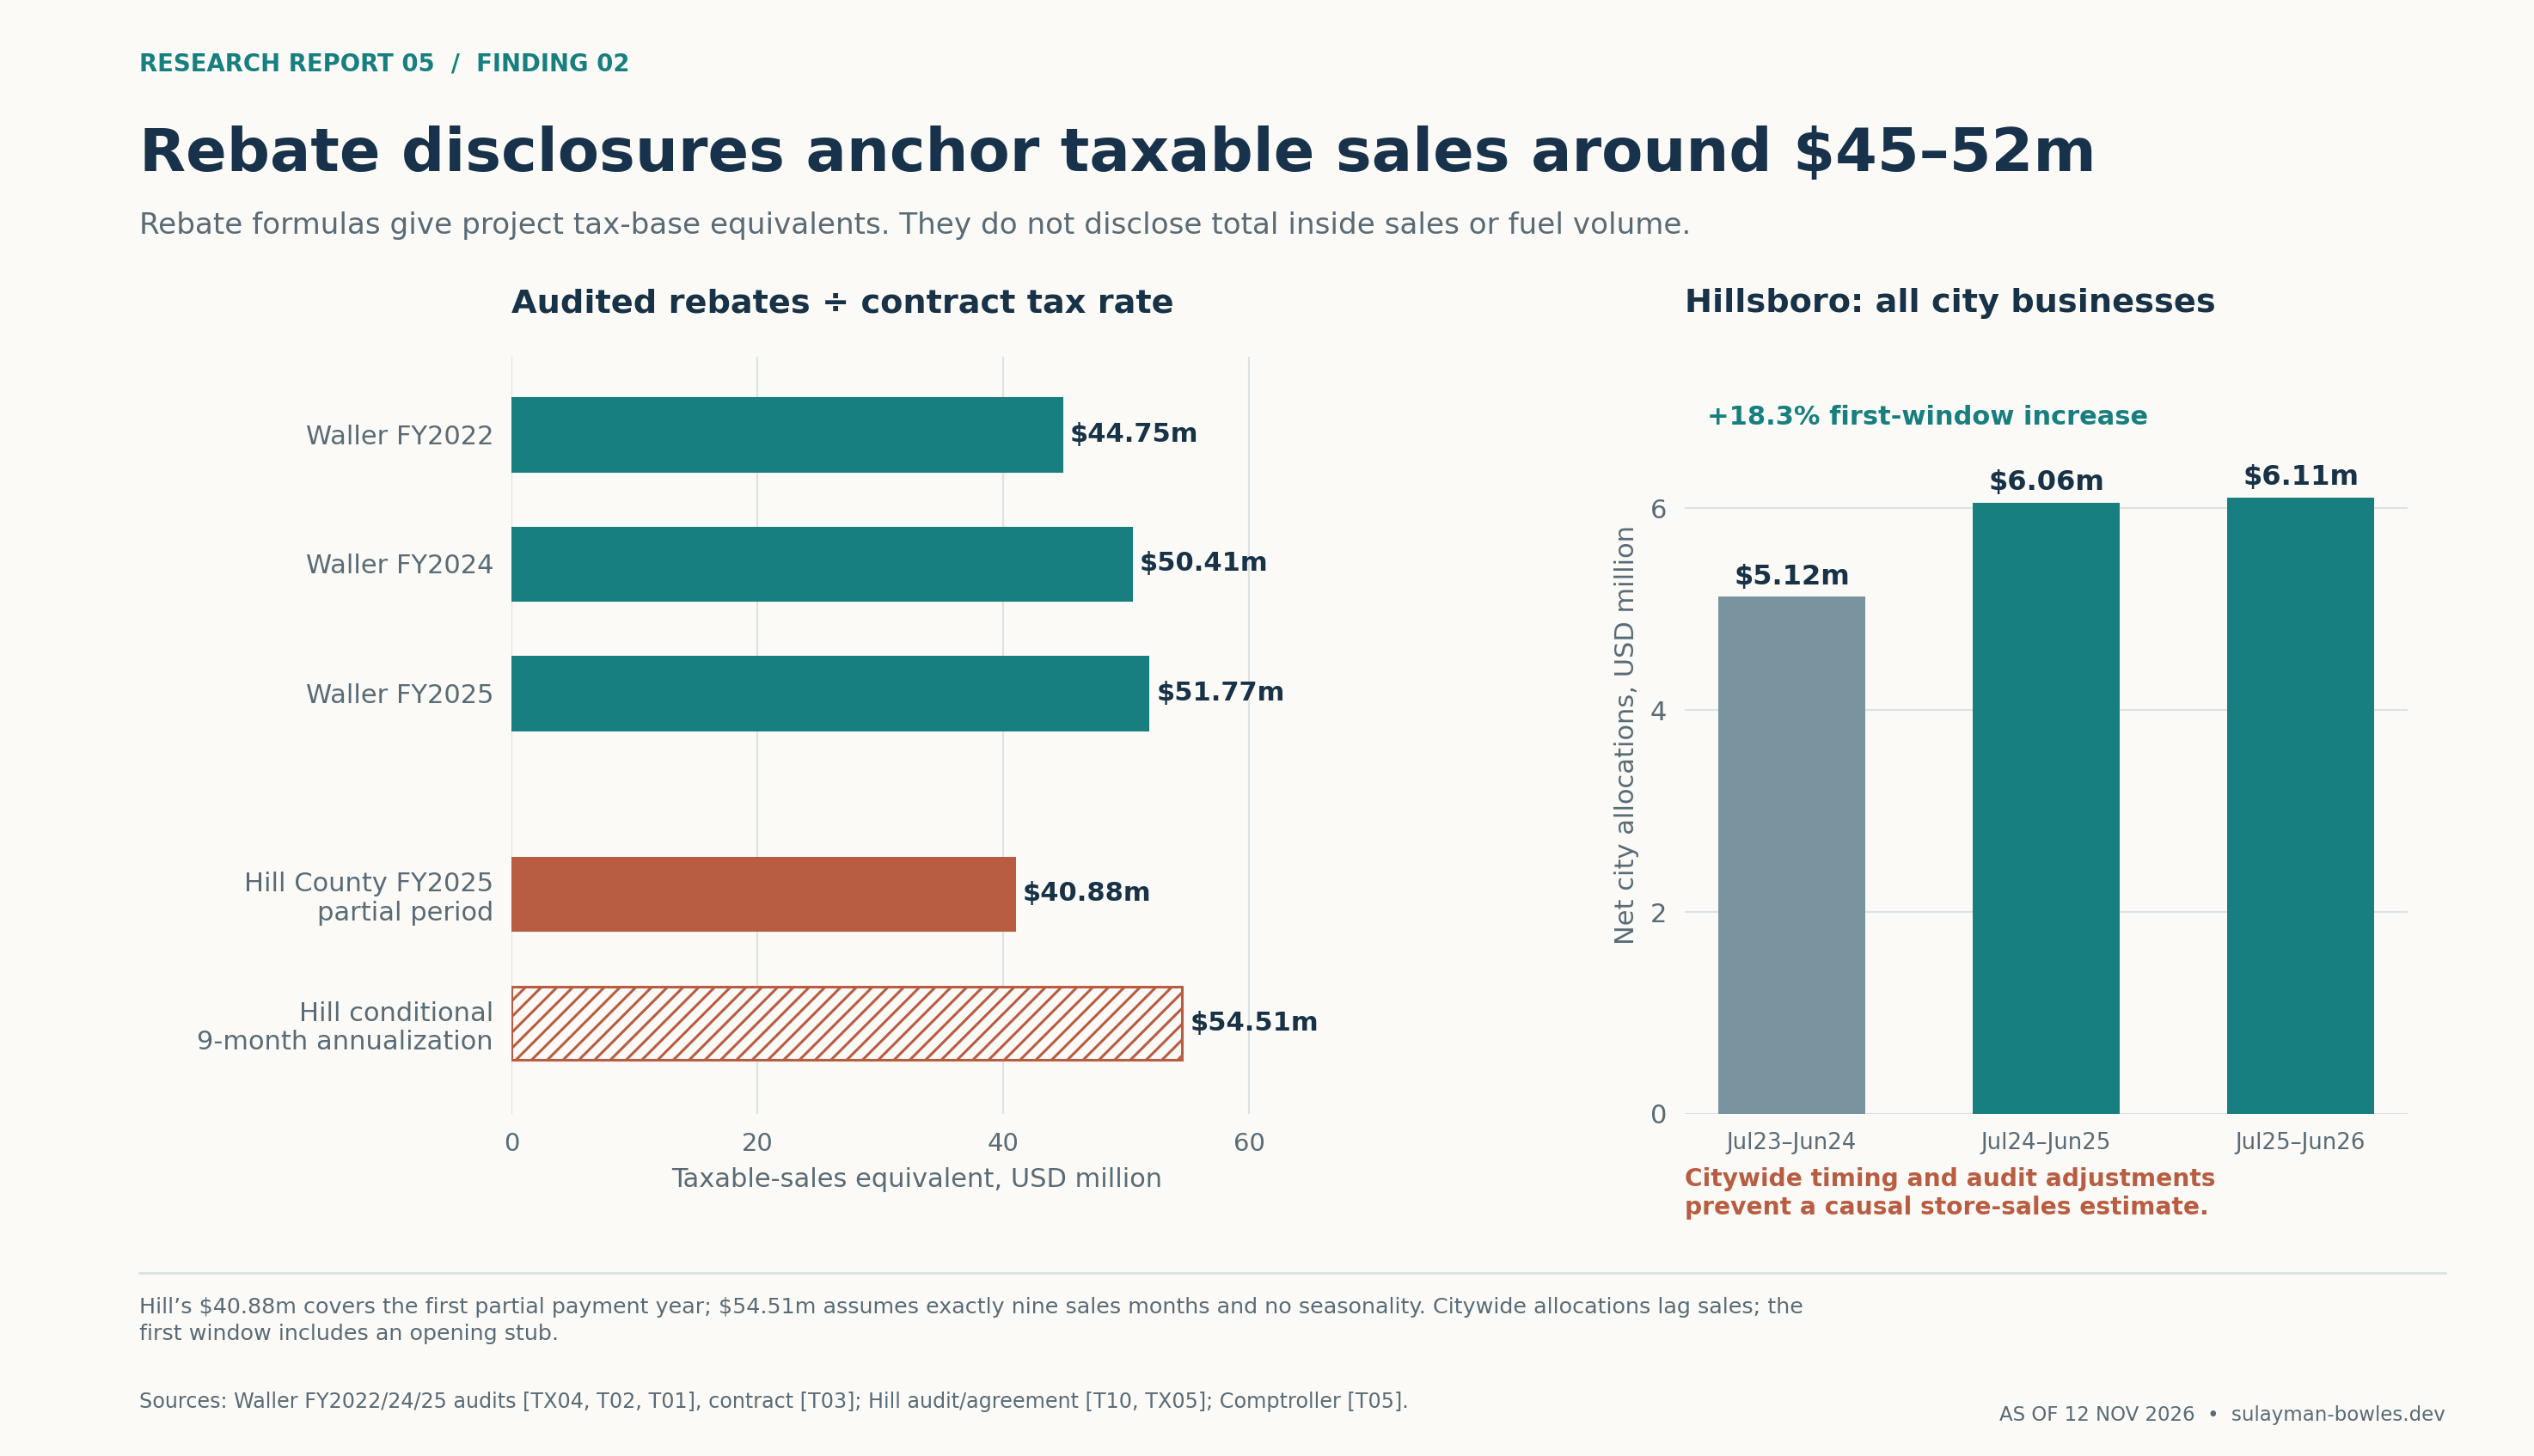
Figure 2. Waller figures invert audited project rebates. Hill County’s $40.88 million covers a partial payment year; $54.51 million assumes nine sales months. Citywide allocations remain a weaker cross-check.
Incentive packets reveal floors, forecasts and finite cash benefits
| Agreement or public packet | Documented terms | Correct economic interpretation |
|---|---|---|
| San Marcos city, February 2024 | At least $50m investment and 175 FTE; 50% of actual city sales tax after fees for 15 years | Capital and job commitments; a conditional rebate |
| Amarillo, 2022 | At least $30m investment, 150 FTE, $6m annual payroll and $10m annual taxable sales; half the eligible city tax for 20 years | Minimums to qualify for the incentive |
| Hill County/Hillsboro, 2022 | More than $40m investment, 150 FTE; full 0.5% county tax after fees for ten years | Project-specific rebate, with a first-year audit figure |
| Caldwell County/Luling | Half the facility-specific county sales tax for 20 years | A facility rebate; the examined clauses do not limit it to growth above the old store |
| Palmer Lake study, April 2025 | $30m annual taxable-sales assumption in 2024 dollars, derived from 12 project agreements | Conservative underwriting inputs for the proposed stores |
The San Marcos database illustrates the need to read the agreement. An earlier header showed $50 million; the corrected record shows $3.2 million. Buc-ee’s committed to invest $50 million in the project. The public incentive was a conditional tax rebate. The city’s development announcement projects $3.2 million of sales tax the city would keep over the full 15-year term. A flat-sales interpretation would imply roughly $29 million of annual taxable sales, but the underlying ramp and growth assumptions are unknown.12
Palmer Lake’s $30 million also should not be mistaken for average store sales. Its sample uses conservative values associated with agreements. The main report accordingly treats such forecasts as lower underwriting anchors and the Waller audit as evidence of realized project activity.5
For scale, a hypothetical Waller-style incentive applied to $60 million inside sales, with 80% taxable, would pay $352,800 annually. Fifteen such payments discounted at 10% are worth $2.68 million before income taxes. That helps a project, but is much smaller than its $70 million capital requirement. This illustration is not a chainwide entitlement, and no incentives are included in the core earnings or valuation.
3. How much fuel a site can sell
Use fueling positions, meaning places where vehicles can fuel simultaneously. Counting a dispenser and then its two sides again would inflate capacity. Recent projects differ: Amarillo opened with 108 positions, San Marcos with 128, while 120 is a documented design at several other centers.2
The model estimates gallons as:
Positions × transactions per position per day × gallons per transaction × 365.
| Fuel assumption | Low | Base | High |
|---|---|---|---|
| Fueling positions | 120 | 120 | 120 |
| Daily transactions per position | 35 | 50 | 65 |
| Gallons per transaction | 15 | 16 | 17 |
| Annual gallons | 23.00m | 35.04m | 48.40m |
| Retail gross profit per gallon | $0.22 | $0.28 | $0.34 |
| Annual fuel gross profit | $5.06m | $9.81m | $16.46m |
The base requires 6,000 fuel transactions each day: 50 transactions per position across 24 hours, or roughly one every 29 minutes on average. That is physically plausible. It cannot tell us how much fuel customers buy, particularly overnight or outside holiday peaks. Annual gallons sold would be one of the most valuable missing disclosures.
The gross-profit assumptions deliberately use public retail benchmarks. Murphy USA reported 28.1 cents per gallon of retail fuel margin for 2025, versus 30.7 cents of total fuel contribution, which also incorporates supply activities and renewable-fuel credits. Casey’s reported 42.6 cents for its fiscal year ended April 30, 2026, before card fees; its accounting includes renewable-fuel-credit effects.13
The latest quarters do not justify treating a temporarily strong margin as permanent. Murphy’s third quarter of 2026 had a 27.4-cent retail margin but 37.0 cents of total contribution, while Casey’s latest quarter reported 47.8 cents. The model uses 28 cents in the base case, with no wholesale or credit windfall added.14
Fuel receipts are modeled at a normalized $3 per gallon, purely to estimate revenue and payment fees. This is not a claim about today’s pump price. Changing that price changes reported receipt-equivalent revenue and processing costs; it does not automatically change the assumed cents-per-gallon gross profit.
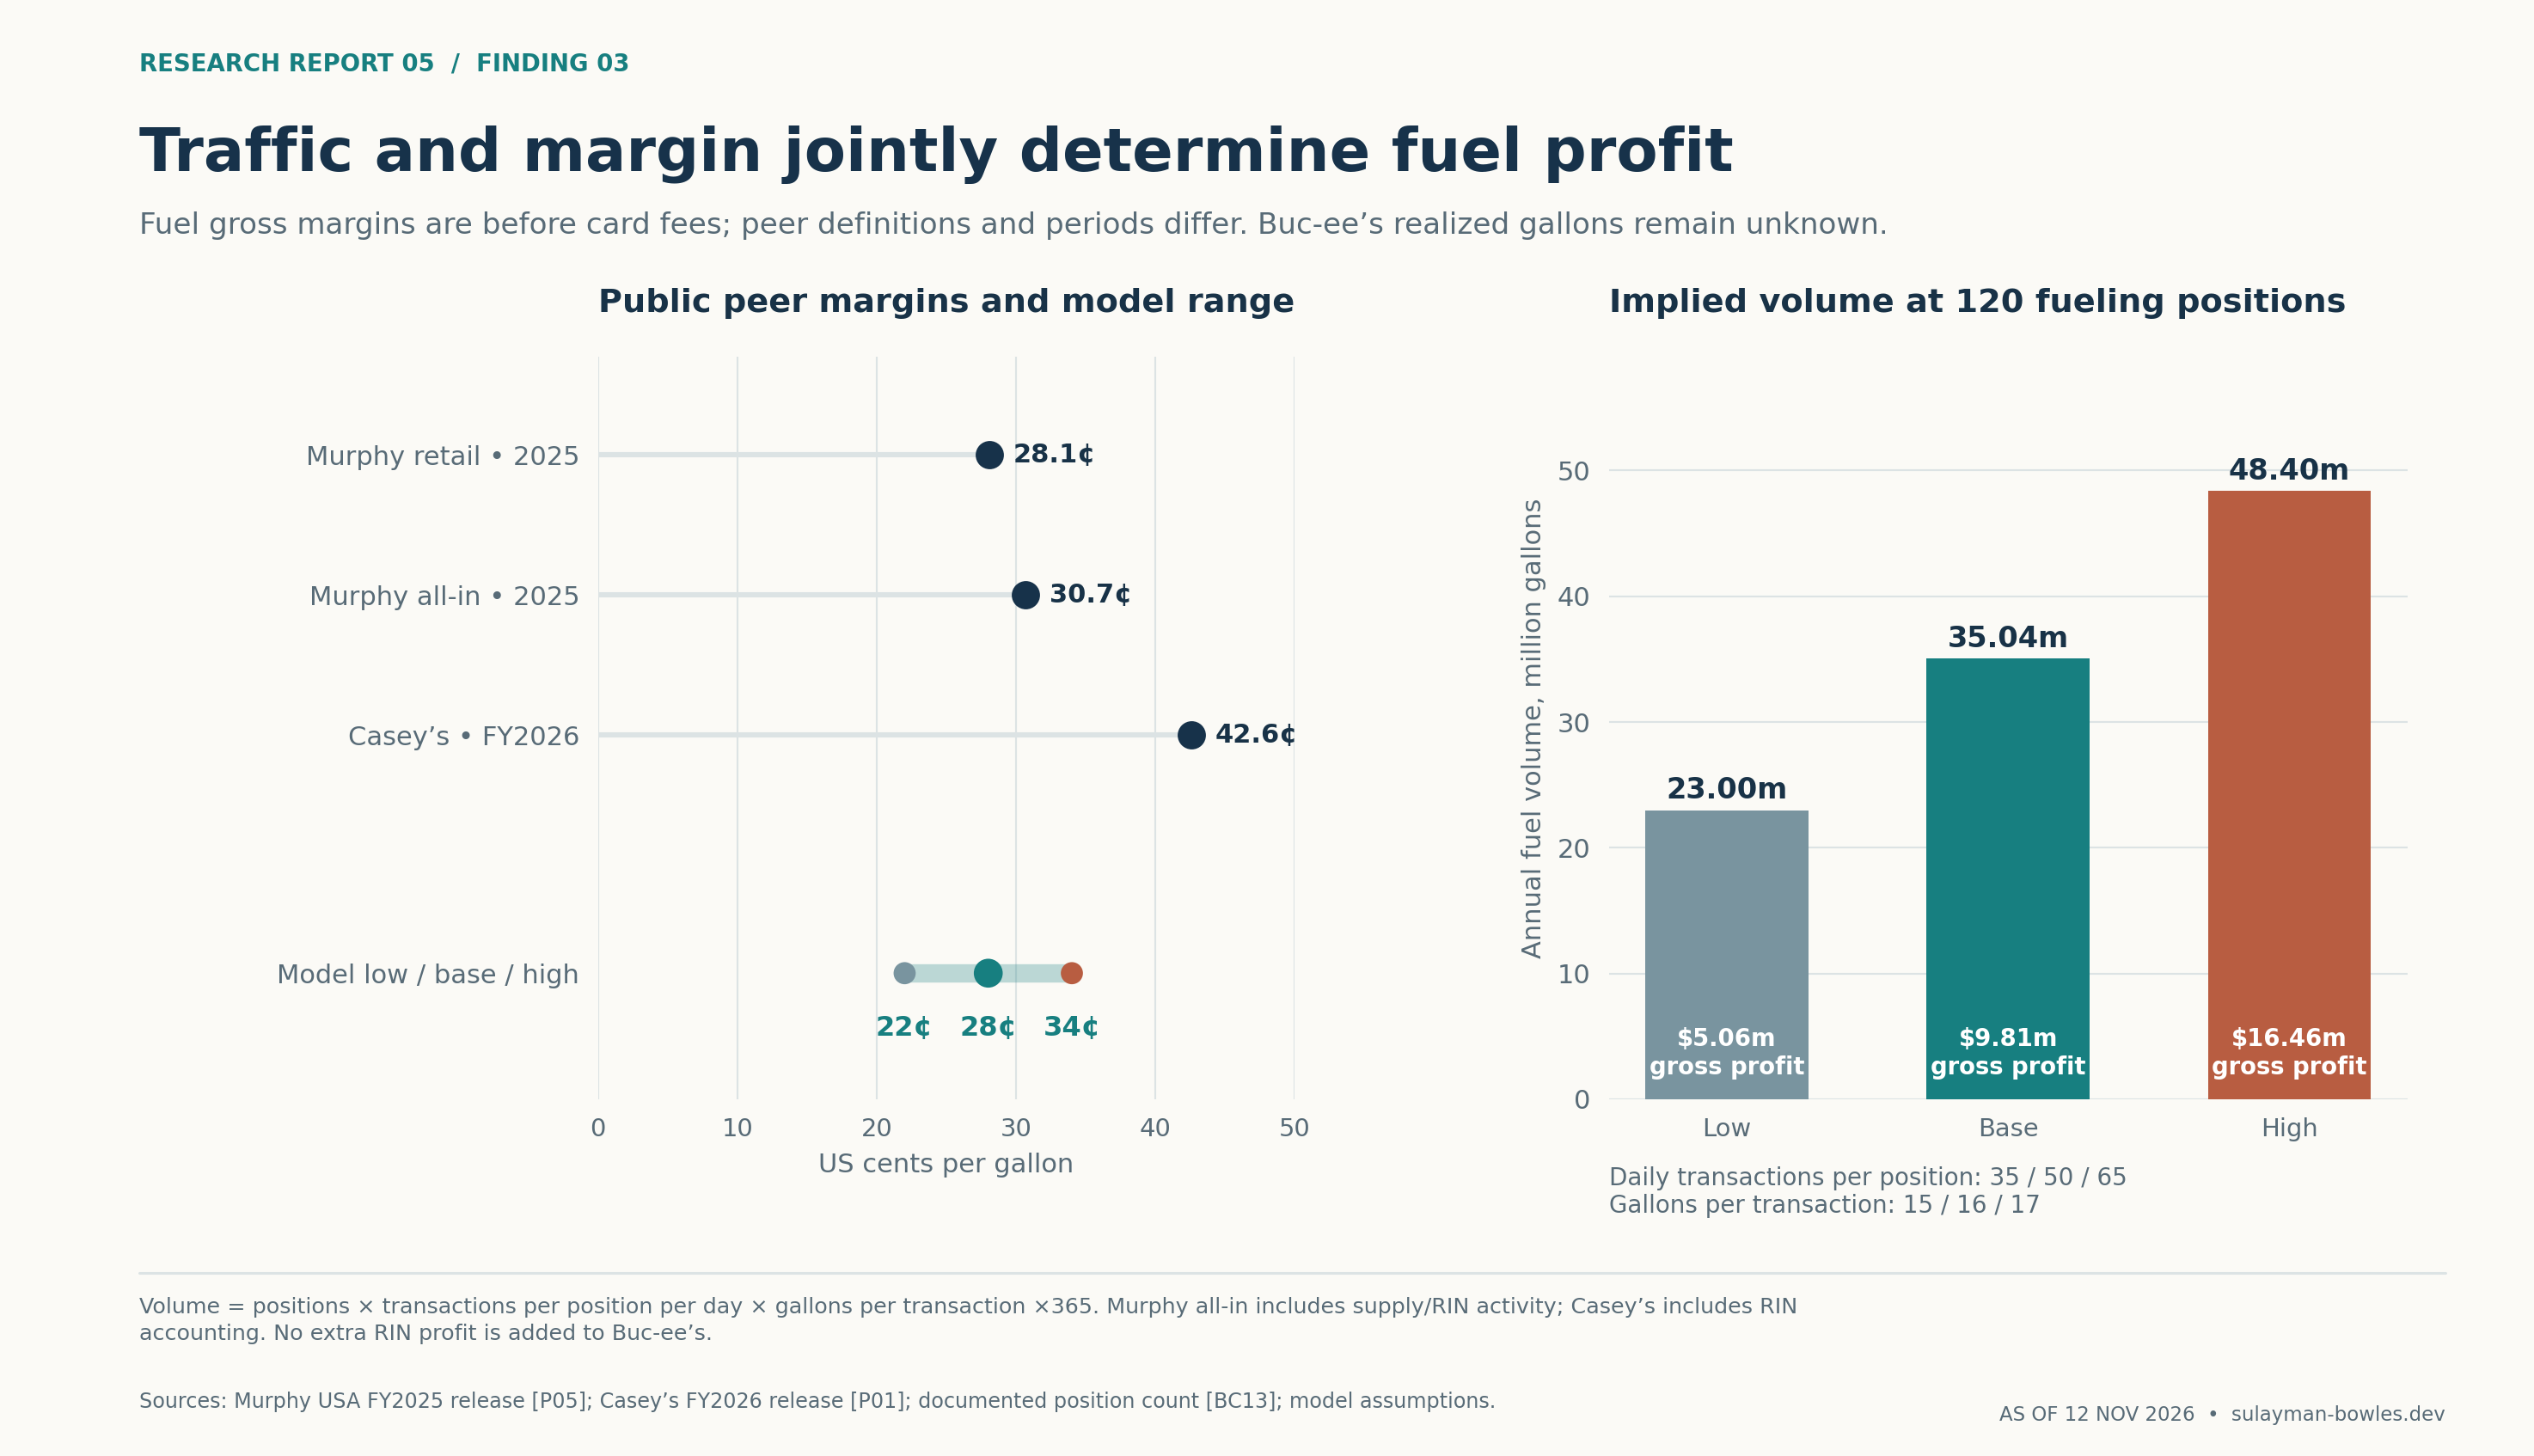
Figure 3. Murphy’s retail and total fuel contributions have different scopes. Casey’s reported fuel margin gives a benchmark. Buc-ee’s margin depends on its own sales and supply costs. Gallons are model estimates.
4. The store earns its return inside—but labor consumes much of the gross profit
The base case assumes a 42% inside product gross margin, between 38% and 46% in the operating scenarios. Casey’s fiscal 2026 disclosures anchor the estimates: 42.2% overall inside margin, 58.6% on prepared food and dispensed beverages, and 35.8% on grocery and general merchandise. Those are product margins before store labor. Buc-ee’s product mix and margins remain unknown.13
It would be a mistake to apply the prepared-food margin to every souvenir, packaged snack and drink, or to treat product margin as restaurant profit. The model then deducts workers, payment fees, utilities, property costs and other operations.
Wages are public; paid hours are not
Buc-ee’s current careers page advertises associate pay of $20–25 an hour, team-lead pay of $23–28, department-manager pay of $33, assistant-general-manager salaries starting at $125,000, and general-manager salaries of $225,000–300,000 or more. Benefits include a 6% retirement-plan match and paid leave.15
Opening releases promise 200-plus jobs at San Marcos and 250-plus at Murfreesboro. Contracts set their own minimum FTE definitions. Neither a job announcement nor a minimum commitment shows how many hours employees were paid for in a year.
The base estimate uses 220 paid FTE × 2,080 hours × $24 blended hourly cash compensation × 1.25 for employer costs, giving $13.73 million of loaded annual labor. The blend must cover managers and supervisors as well as associates. Paid leave is already in paid hours; the benefit load does not add those hours again.
The low and high cases use 190 and 260 FTE, respectively. These are explicit staffing estimates. Twenty additional base-rate FTE would cost $1.25 million a year. A five-percentage-point increase in the benefit load would cost approximately $0.55 million. Small errors in staffing matter.
Payment fees are estimated at 1.6% of receipt-equivalent sales, informed by Casey’s fiscal 2026 fee expense of $278.749 million against $17.561 billion revenue, or approximately 1.59%. This calibrates the model using Casey’s disclosed figures. Buc-ee’s contract terms and accounting remain unknown.13
The central $4.5 million other-operating-cost allowance comprises $0.9 million property tax, $0.9 million utilities, $0.8 million repairs, $0.5 million supplies and waste, $0.5 million insurance, and $0.9 million direct logistics. These amounts are estimates. Repairs are operating costs; replacement capital has its own deduction. Central infrastructure not allocated here is covered by the company overhead allowance.
Three mature-store income statements
| Annual amounts, USD millions | Low | Base | High |
|---|---|---|---|
| Inside sales | 45.00 | 60.00 | 75.00 |
| Fuel receipt-equivalent sales | 68.99 | 105.12 | 145.20 |
| Total receipt-equivalent sales | 113.99 | 165.12 | 220.20 |
| Inside gross profit | 17.10 | 25.20 | 34.50 |
| Fuel gross profit | 5.06 | 9.81 | 16.46 |
| Loaded labor | (11.36) | (13.73) | (16.90) |
| Payment fees | (1.82) | (2.64) | (3.52) |
| Other operating costs | (3.80) | (4.50) | (5.50) |
| Store EBITDA, before headquarters | 5.17 | 14.14 | 25.03 |
| Economic depreciation | (3.00) | (3.00) | (3.00) |
| Store EBIT | 2.17 | 11.14 | 22.03 |
| Normalized cash income tax | (0.54) | (2.79) | (5.51) |
| Replacement capital | (2.50) | (2.50) | (2.50) |
| Cash after tax and replacement | 2.13 | 8.86 | 17.02 |
Cash is EBITDA minus income tax minus replacement spending. Depreciation determines the normalized tax allowance and is not deducted a second time from cash. The assumed 25% tax rate represents an assumed public-company tax treatment. Buc-ee’s tax structure remains undisclosed. Fuel receipt-equivalent sales include fuel excise taxes; the revenue subtotal is not a GAAP revenue reconciliation.
The profit cross-check is necessarily incomplete. Waller’s audit independently supports the sales scale; peer filings support plausible product margins; disclosed wages constrain payroll. Together they make a $14 million operating-earnings case credible enough to analyze. They do not verify that a real Buc-ee’s earns it. A project-level income statement could overturn the result immediately.
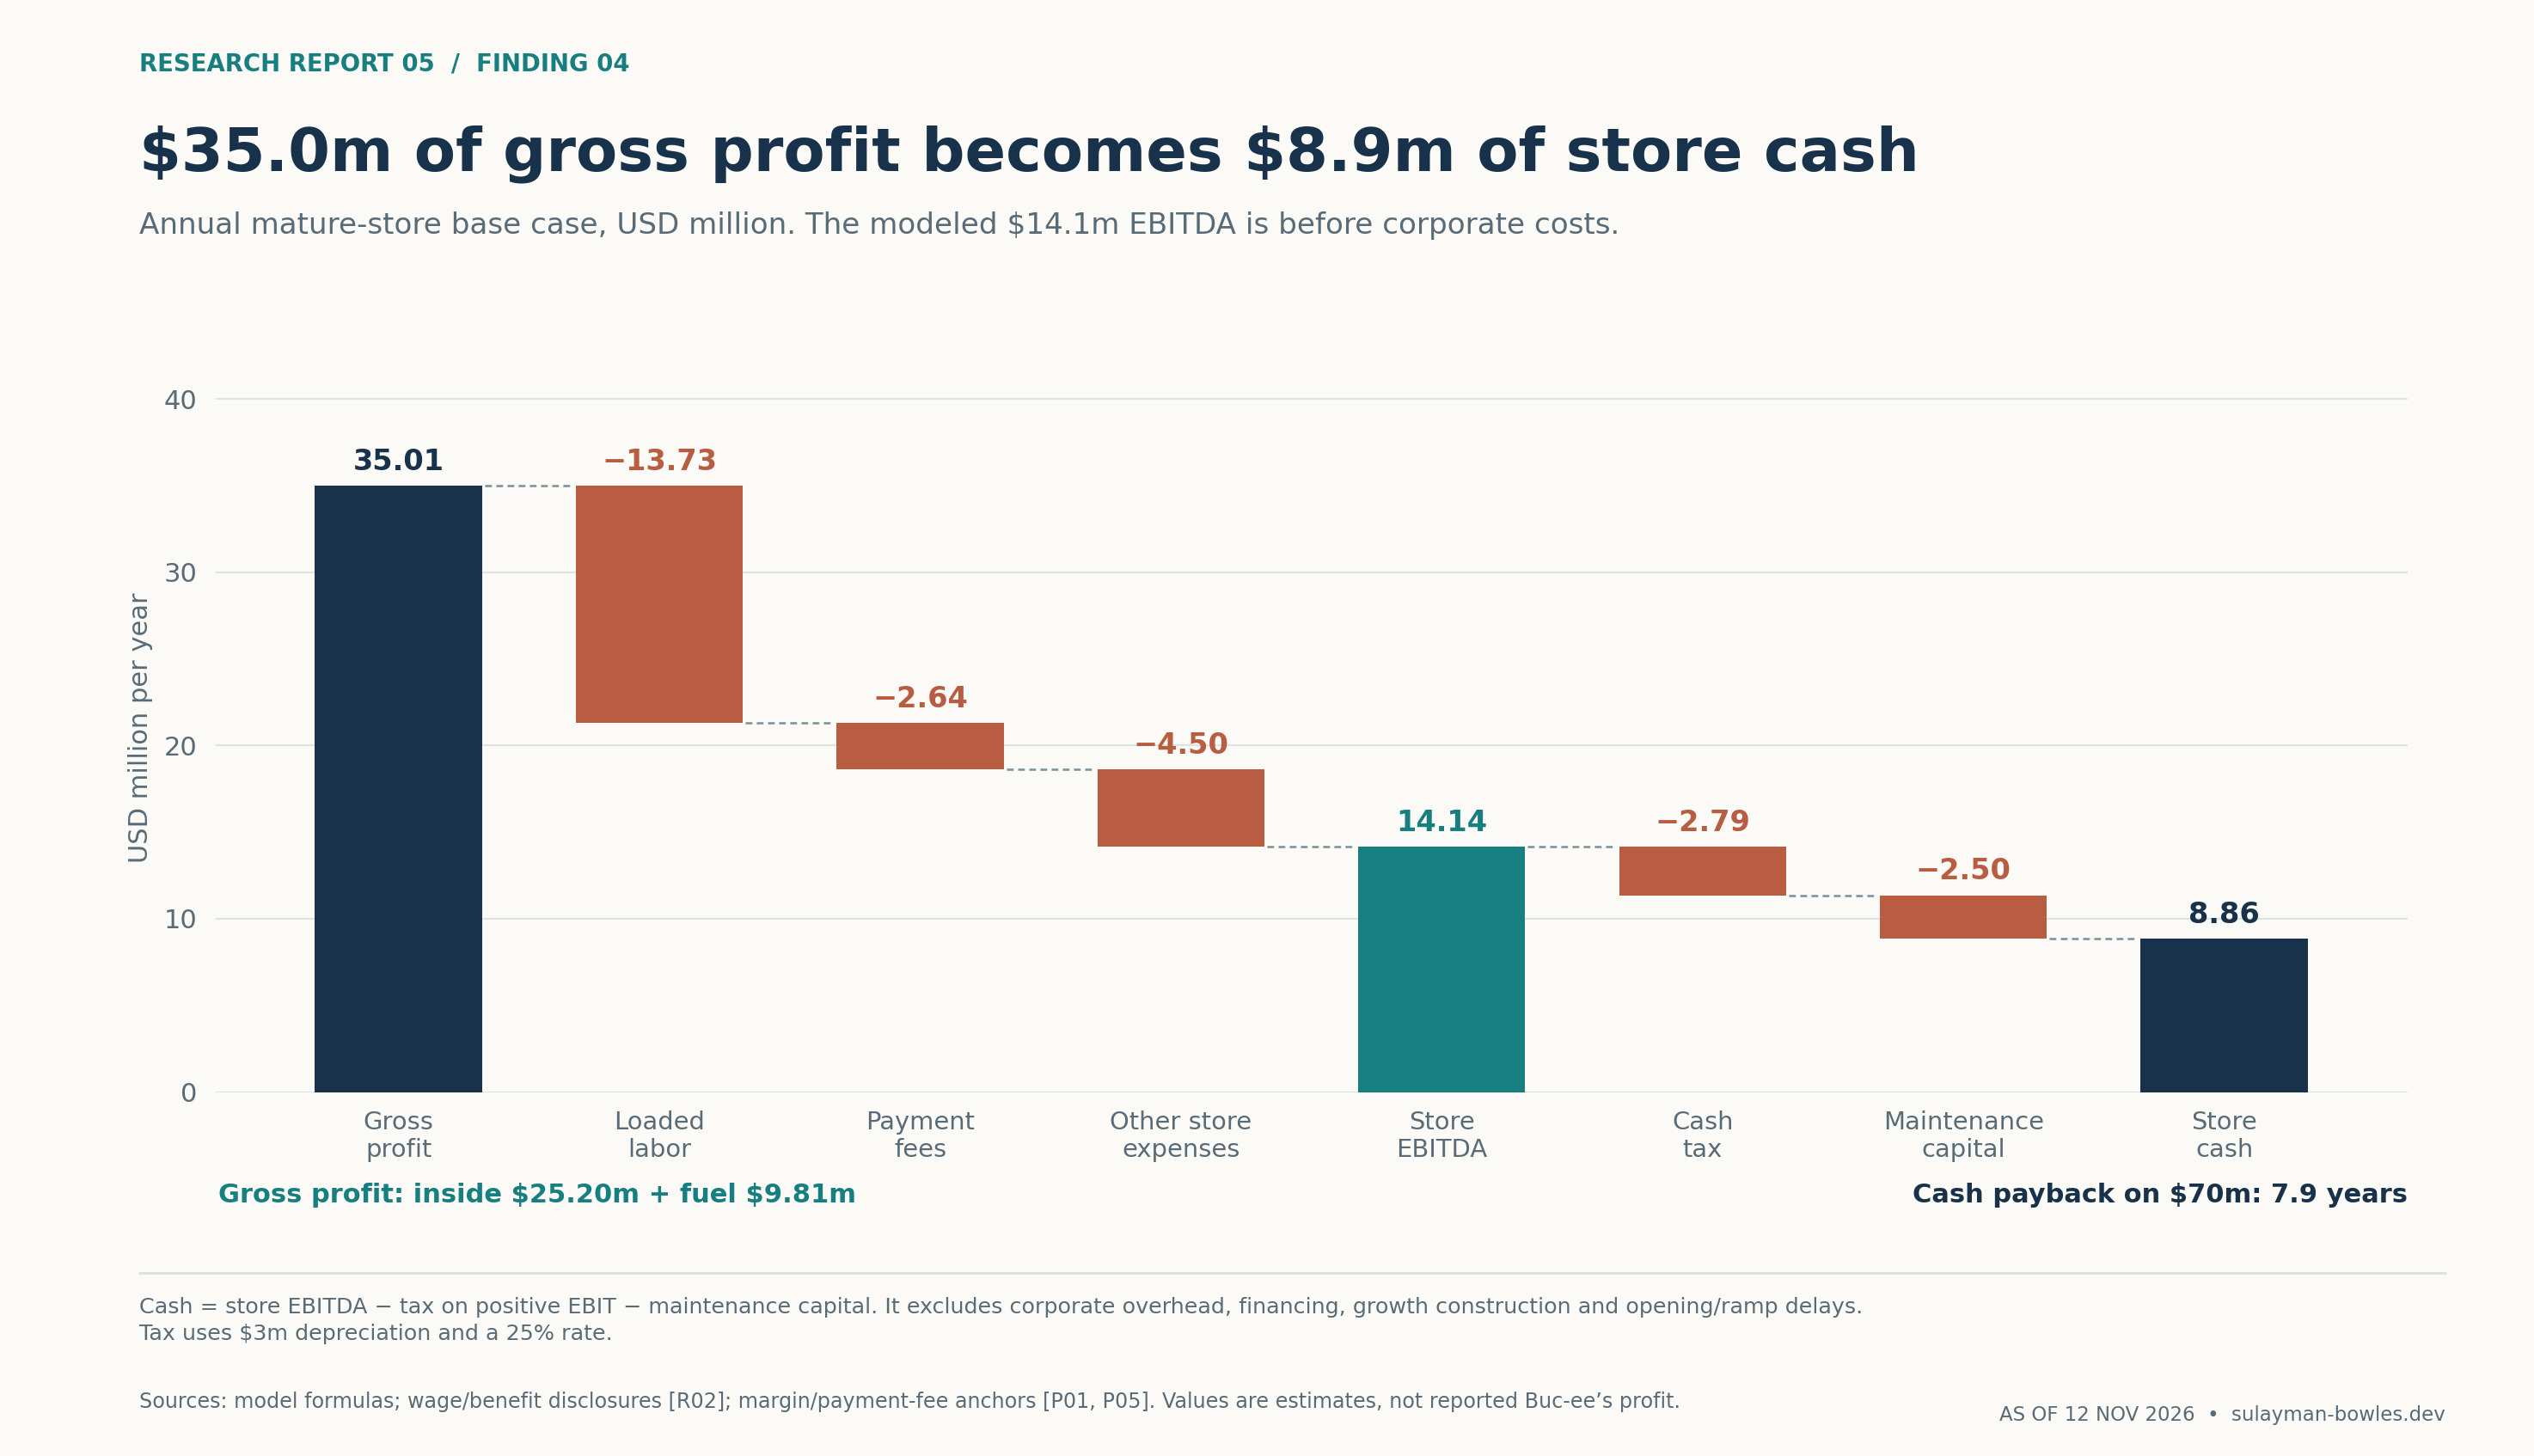
Figure 4. The model converts $35.01 million product gross profit into $14.14 million EBITDA and $8.86 million after-tax, after-replacement cash, before headquarters and interest.
5. Payback depends more on the register than the construction estimate
Dividing $70 million by base EBITDA gives 4.95 years. That is not a cash payback. Taxes and replacement spending extend the ratio to 7.90 years. Allocating $60 million of headquarters costs across 40 destination centers extends it to 9.05 years.
The ratios compare stabilized annual cash flow with initial investment. A project IRR depends on the timing of the cash flows. They exclude construction time, the opening ramp and financing. The low operating case’s 32.87-year cash ratio exceeds the model’s 20-year blended depreciable life, which signals poor economics and gives little reason to assume operations continue unchanged for three decades.
At base operating performance, changing total funded investment from $55 million to $90 million moves simple cash payback from 6.21 to 10.16 years. Holding the $70 million cost fixed while changing inside sales from $45 million to $75 million, with all other base assumptions unchanged, moves it from 16.24 to 5.22 years.
The difference between that last comparison and the joint operating scenarios matters. In the joint low case, fuel volume, fuel spread and merchandise margin also deteriorate. In the inside-only sensitivity, they do not.
Each extra $10 million of inside sales contributes $4.04 million of EBITDA at a 42% product margin and 1.6% payment-fee rate, before any staffing or capacity step-up. The calculation applies at the margin. Labor costs rise when the store adds capacity.
The $30 million downside test is especially revealing. At the other base assumptions, it produces $2.02 million EBITDA but negative $0.48 million cash after replacement capital. A $30 million taxable-sales forecast is not the same as $30 million total inside sales, but confusing the two materially changes the investment conclusion.
The central $60 million inside-sales assumption implies about $803 per building square foot annually and 8,219 inside transactions a day at a hypothetical $20 basket. The latter exceeds the 6,000 daily fuel transactions. That requires non-fueling visits, more than one inside purchase per fueling vehicle, a larger average basket, or some combination. None is measured here. Transactions and basket size would provide an excellent operational test.
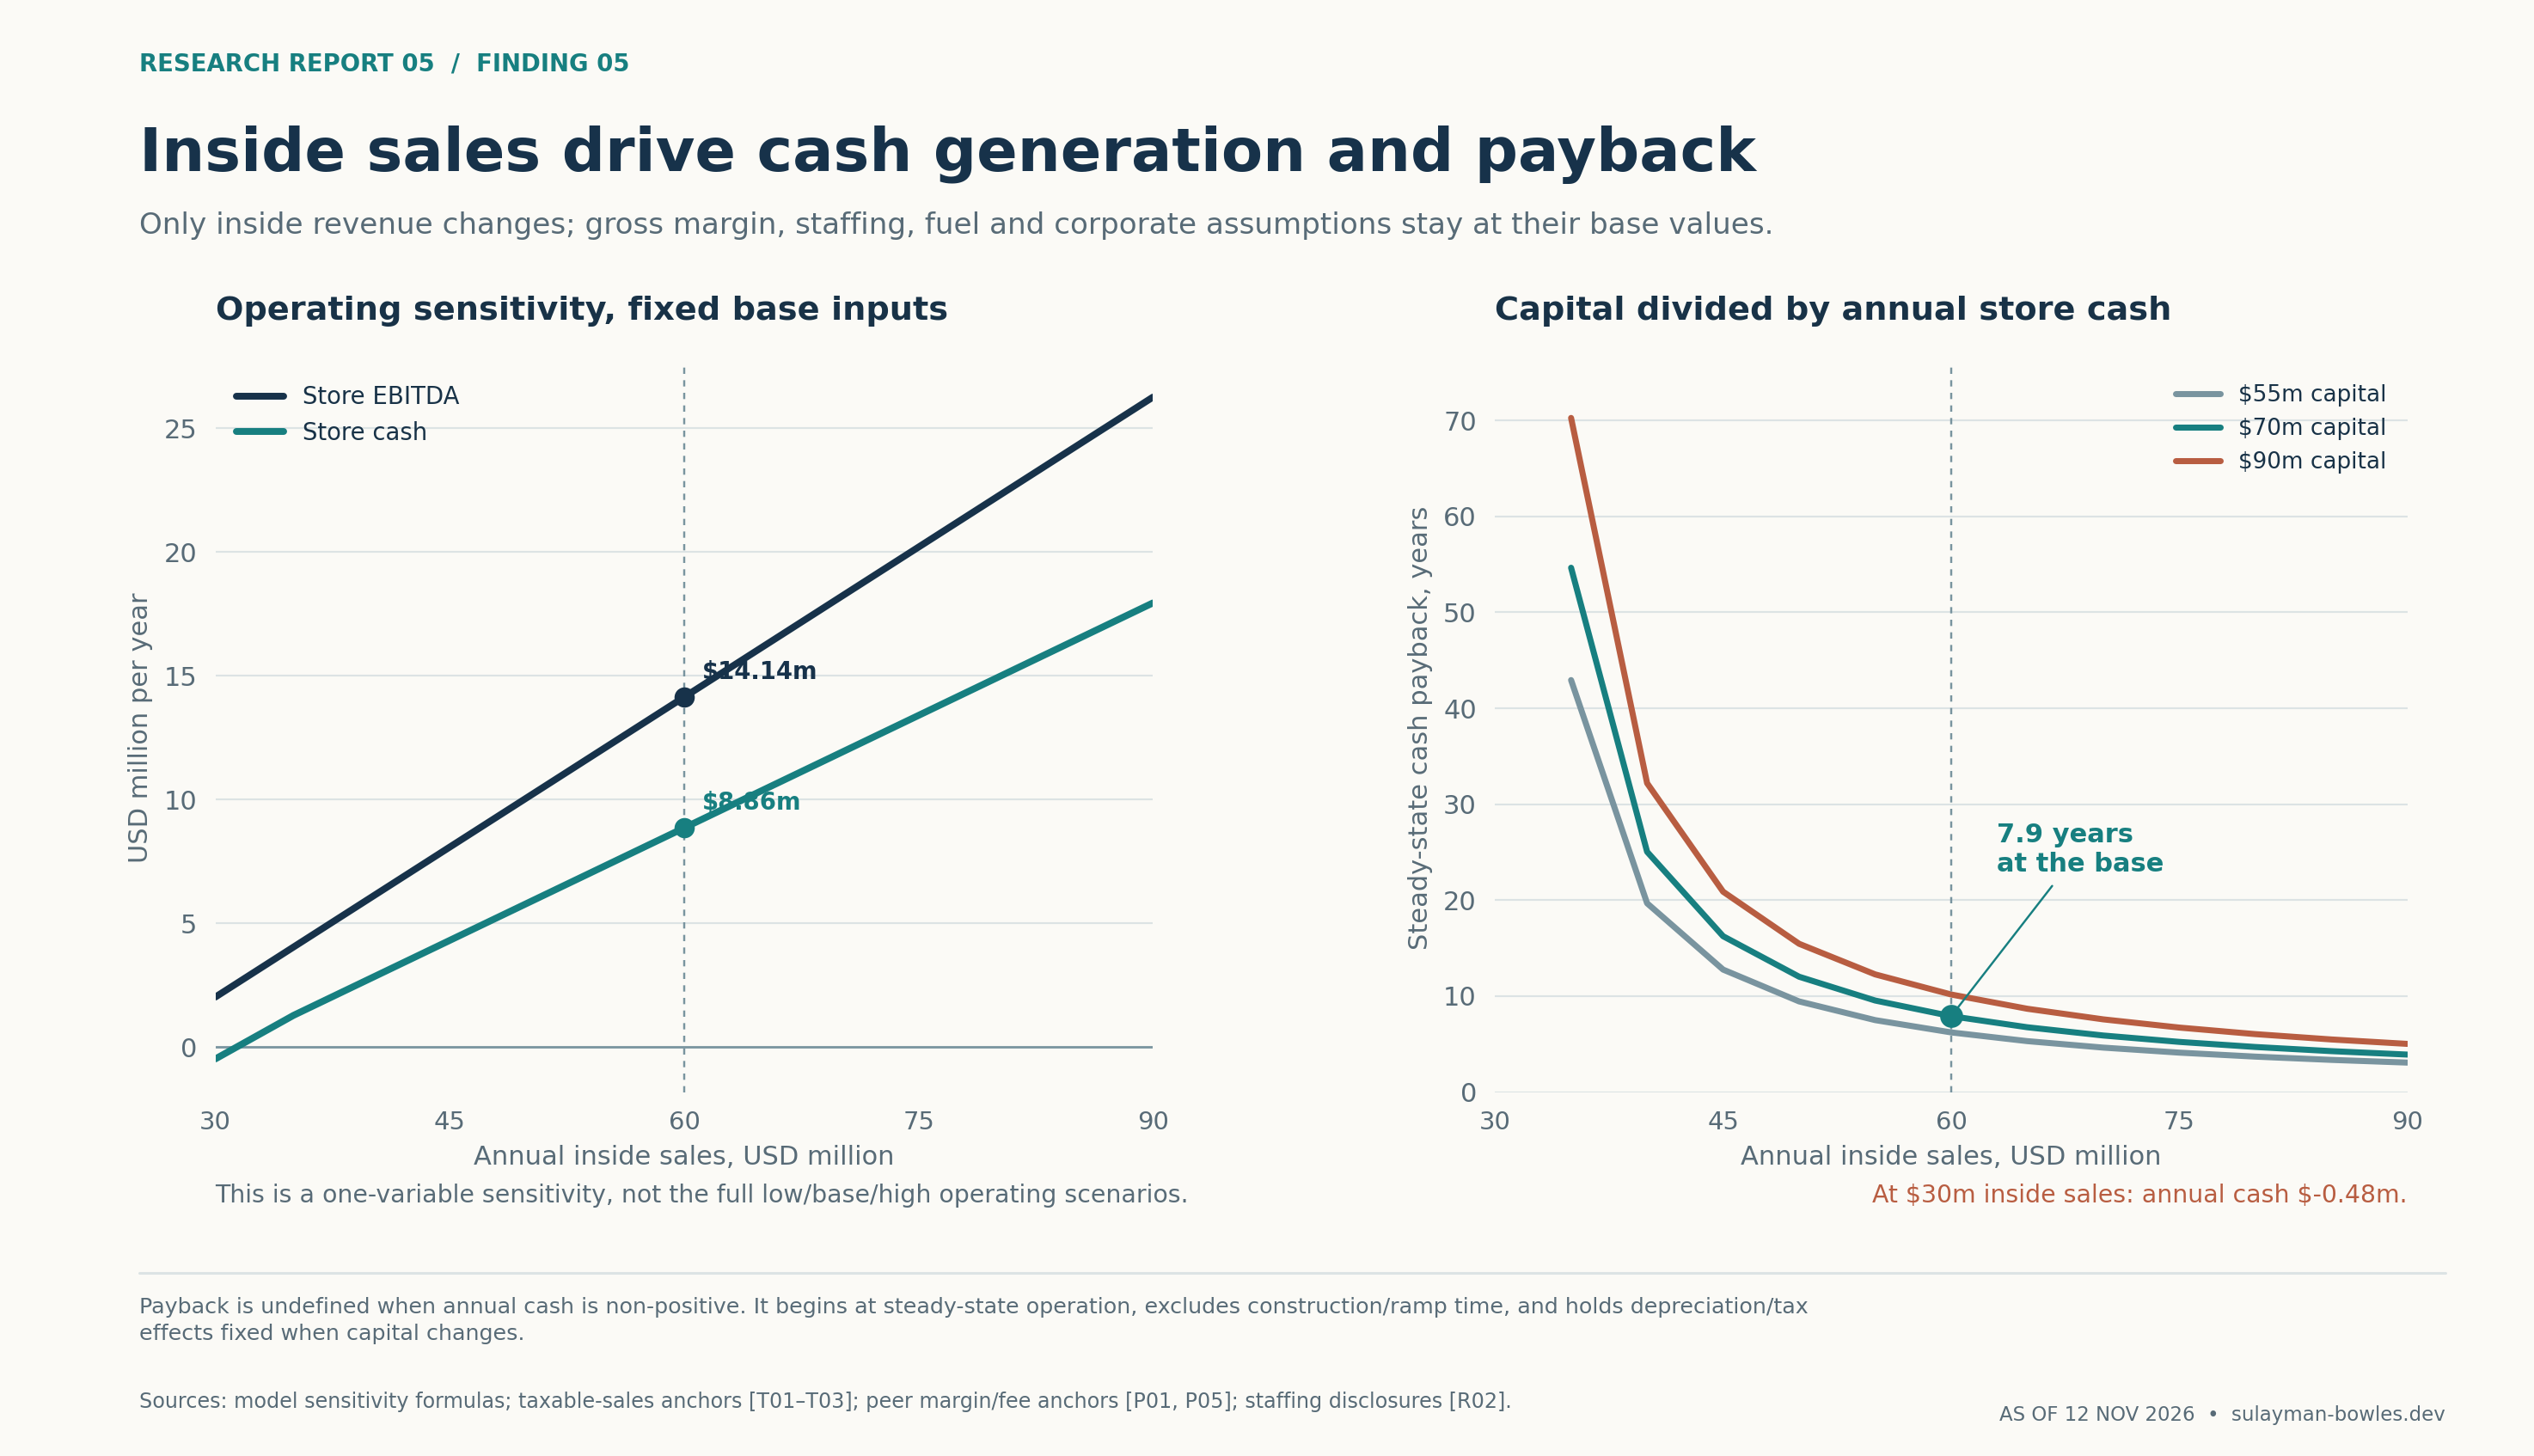
Figure 5. All non-inside operating assumptions are held at Base. Payback begins at mature operations, excludes headquarters and is undefined when annual cash is nonpositive.
6. Count operating stores before multiplying their earnings
The live company directory contained 57 unique store identifiers on November 12: 36 in Texas and 21 outside Texas. The model groups 40 as destination-format centers and 17 as other stores. I classify those sites together for the model.16
This avoids assigning 75,000-square-foot economics to every address. Cypress, for example, is on a much smaller county-record parcel and is placed among other stores; its exact primary building-area card was not obtained. Bastrop’s documented principal building is approximately 80% of the prototype’s size, illustrating why even destination centers need not equal the newest design.3
The central fleet assumption treats 40 destinations as 32 equivalent modern stores, using an 80% factor for their combined size and asset economics. It scales earnings, revenue, depreciation and maintenance together. The model uses my utilization assumptions. Fleet averages remain unavailable. Weak demand alone would not justify reducing roofs, pavement and pump replacement needs proportionately.
Other stores include an additional $0.5 million annual EBITDA assumption each in the base case. The chain then bears $60 million of annual corporate cost, including unallocated infrastructure and hypothetical public-company expenses.
40 × 80% × $14.14128m + 17 × $0.5m − $60m = $401.02m company EBITDA.
Murfreesboro’s announced November 16 opening is still four days in the future at the cutoff. It counts toward the announced pipeline. The operating denominator covers open stores. Its release describes approximately 74,000 square feet, 120 fueling positions and 250-plus jobs.17
The company’s current schedule lists 18 forthcoming openings: Murfreesboro in 2026; four in 2027; seven in 2028; five in 2029; and one in 2031. The raw file identifies every location. A permit announcement without a place on that dated schedule is not silently added to the forecast. Rocky Mount’s October 2026 permitting announcement, for example, documents investment and hiring but not an additional dated opening in this model.17
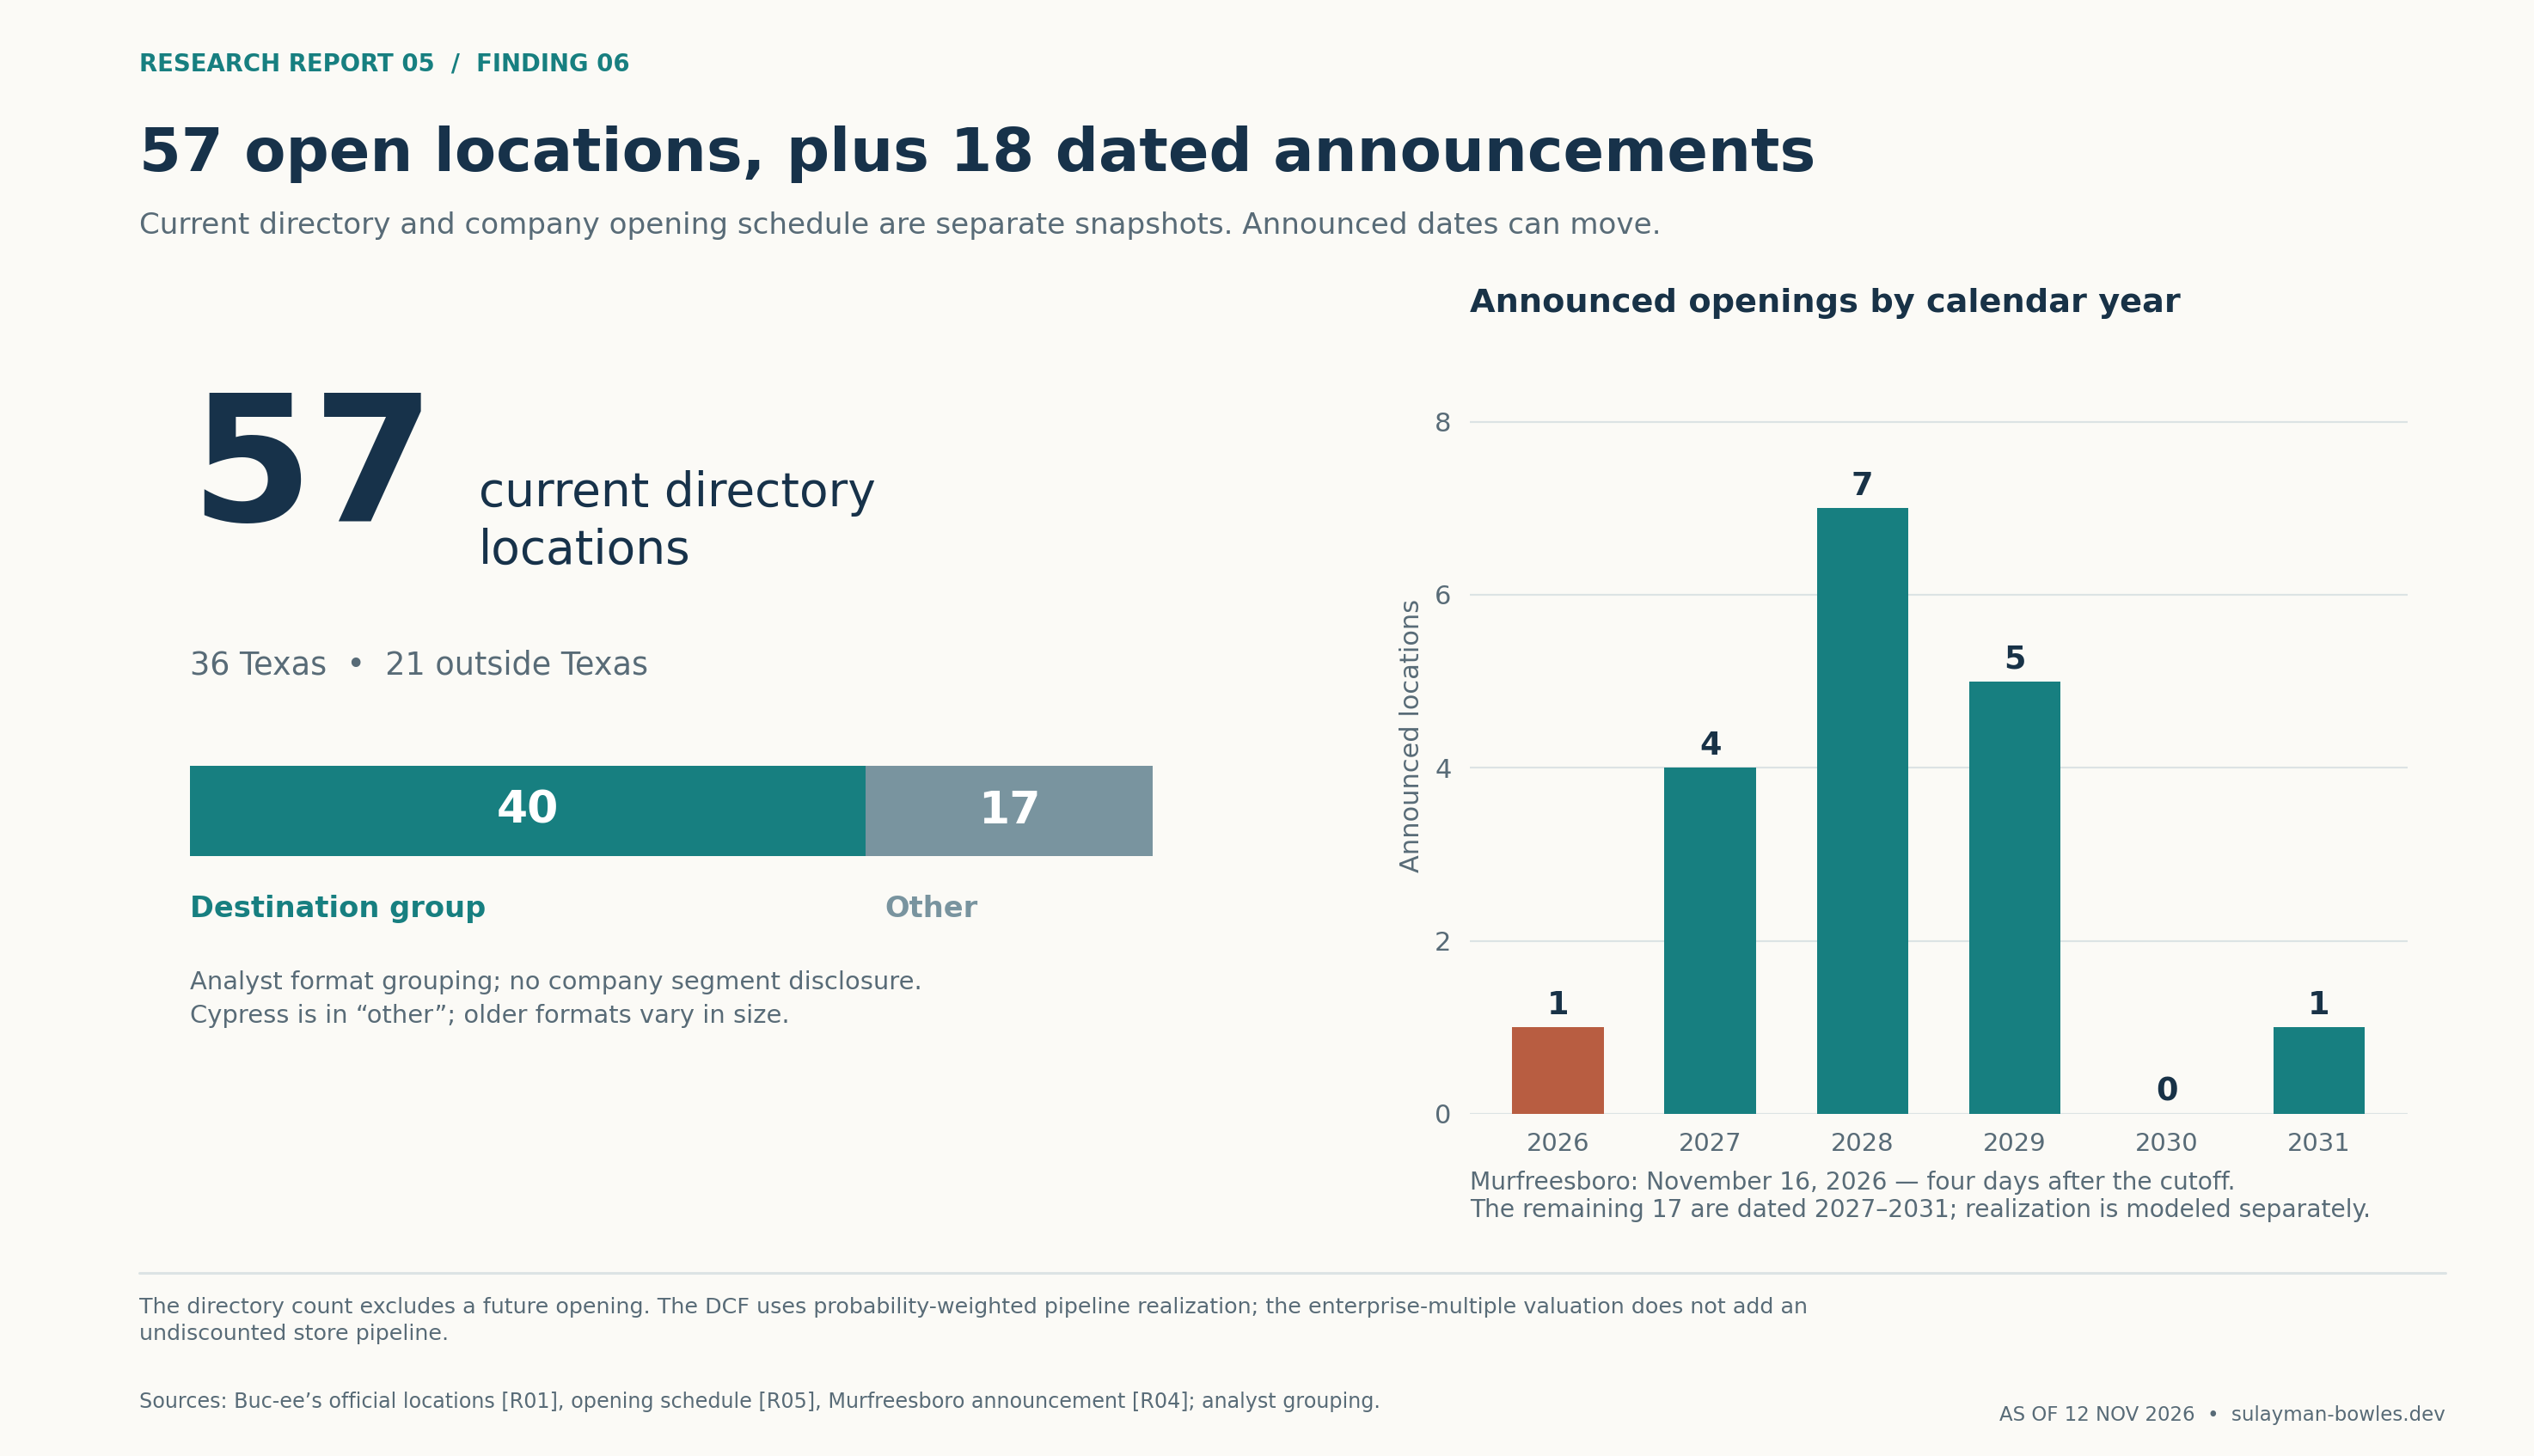
Figure 6. Current counts come from the company directory. The 40/17 format grouping is analytical; the pipeline records announced plans. Each opening depends on approvals, funding and completion.
7. What would the chain be worth on the stock market?
The peer comparison uses the latest financial periods available at the cutoff. The companies use different fiscal-year labels. LTM means the latest twelve months. The calculation is the last completed fiscal year plus the current interim period minus the corresponding prior-year interim period.18
| Peer and LTM period end | Earnings bridge, USD millions | LTM EBITDA / adjusted EBITDA | Reconstructed EV | EV/earnings |
|---|---|---|---|---|
| Casey’s; July 31, 2026 | Reported EBITDA: 1,483.615 + 485.083 − 414.270 | $1,554.43m | $28.30bn | 18.21× |
| Murphy USA; September 30, 2026 | Adjusted EBITDA: 1,019.4 + 991.8 − 728.5 | $1,282.70m | $11.54bn | 9.00× |
| Alimentation Couche-Tard; July 19, 2026 | Adjusted EBITDA: 6,713.8 + 1,783.1 − 1,613.8 | $6,883.10m | $65.49bn | 9.51× |
The EV bridge uses prices of $714.11 for Casey’s, $527.78 for Murphy and C$82.35 for Couche-Tard, matched to November 11, with the latest filed point-in-time share counts. Couche-Tard’s Canadian equity value is converted at the Bank of Canada’s latest available rate, C$1.4181 per U.S. dollar on November 10.19
Casey’s and Murphy price observations are explicitly identified free market-data vendor exceptions: their issuer quote pages did not expose a usable number. Financial statements, share counts, debt and cash are traced to issuer or regulatory documents. Subsequent repurchases between the share-count date and quote date are unknown.
The ratios are not perfectly comparable. U.S. operating rent is already expensed in Casey’s and Murphy’s EBITDA, and their EV bridges exclude operating-lease liabilities. Couche-Tard reports under IFRS; its bridge includes approximately $5.05 billion of lease liabilities, paired with adjusted EBITDA before IFRS lease depreciation and interest. Business mix and acquisition activity differ too. An unqualified average would imply more comparability than exists.18
Couche-Tard’s July 31 announcement of an approximately $8.6 billion equity offer for Żabka is another limitation. The target’s October update still described the transaction as conditional. This historical bridge is not pro forma for that acquisition: neither prospective acquisition financing nor the target’s earnings is inserted into the reported July balance sheet and LTM results, while the November share price can reflect expectations about the deal.20
The model chooses 9×, 13× and 17×, without claiming the middle number is statistically dictated. Thirteen times gives Buc-ee’s a premium to the two lower reference points while remaining below Casey’s. Earning that premium would require durable merchandise economics, attractive reinvestment and continued execution; none follows automatically from a recognizable brand.
| Joint operating/valuation scenario | Low | Base | High |
|---|---|---|---|
| Store EBITDA | $5.17m | $14.14m | $25.03m |
| Fleet equivalent-size factor | 70% | 80% | 90% |
| Corporate costs | $40m | $60m | $85m |
| Company EBITDA | $109.10m | $401.02m | $828.92m |
| Chosen EV/EBITDA | 9× | 13× | 17× |
| Multiple-based enterprise value | $0.98bn | $5.21bn | $14.09bn |
That broad range reflects compounded uncertainty. It is not a confidence interval, and the high case is not evidence of a likely IPO valuation.
The cash-flow cross-check gives a lower central answer
The independent valuation method discounts ten explicit years of cash flows plus a terminal value. Its central assumptions are a 10% required return, 2% annual growth in recurring economics, 2.5% terminal growth, and 75% realization of the 17 scheduled openings after Murfreesboro. Fractional openings reflect the assumed share of projects that open.
Each additional prototype requires $70 million before inflation. The model assumes half the funding in the year before opening and half in the opening year, with 2% capital inflation. Remaining spend on those projects is unknown, so it conservatively treats their entire modeled budgets as still payable. Murfreesboro instead has 5% of full investment remaining, an explicit estimate.
New centers receive 40% of mature annual earnings in the opening calendar year and 85% in the following year. Murfreesboro receives the second-year factor in 2027. Incremental corporate cost is $0.75 million per equivalent new center. The terminal reserve rises to economic depreciation; terminal growth represents continued nominal price/mix growth, without free unannounced store expansion.
The result is $3.067 billion for the existing operating fleet, plus $0.469 billion of net pipeline value, giving $3.536 billion. Roughly 59% comes from the discounted terminal value. This cross-check uses the same underlying profit estimates.
The cash-flow answer is about 32% below the $5.213 billion multiple result. The 13× approach therefore embeds a larger growth or quality premium than this finite announced-pipeline forecast supports. Better unit earnings, a longer expansion runway or a lower required return could close the gap. Adding the pipeline’s cash-flow value on top of the 13× value would risk counting growth twice.
Asset intensity matters as well. Holding depreciation and maintenance at all 40 physical destination sites, instead of 32 equivalent prototypes, lowers the central expanded DCF to $3.33 billion. This tests the possibility that the fleet discount reflects weaker sales on the same asset base.
In the joint low case, the existing-fleet DCF is approximately $0.19 billion, but forcing the assumed expansion program through weak unit economics produces a negative result. That is the outcome under the expansion stress test. Management could cancel uncommitted projects, and no liquidation value has been verified. The optimistic case produces roughly $14.1 billion by either method; their agreement is coincidental because both use the same favorable operating assumptions.
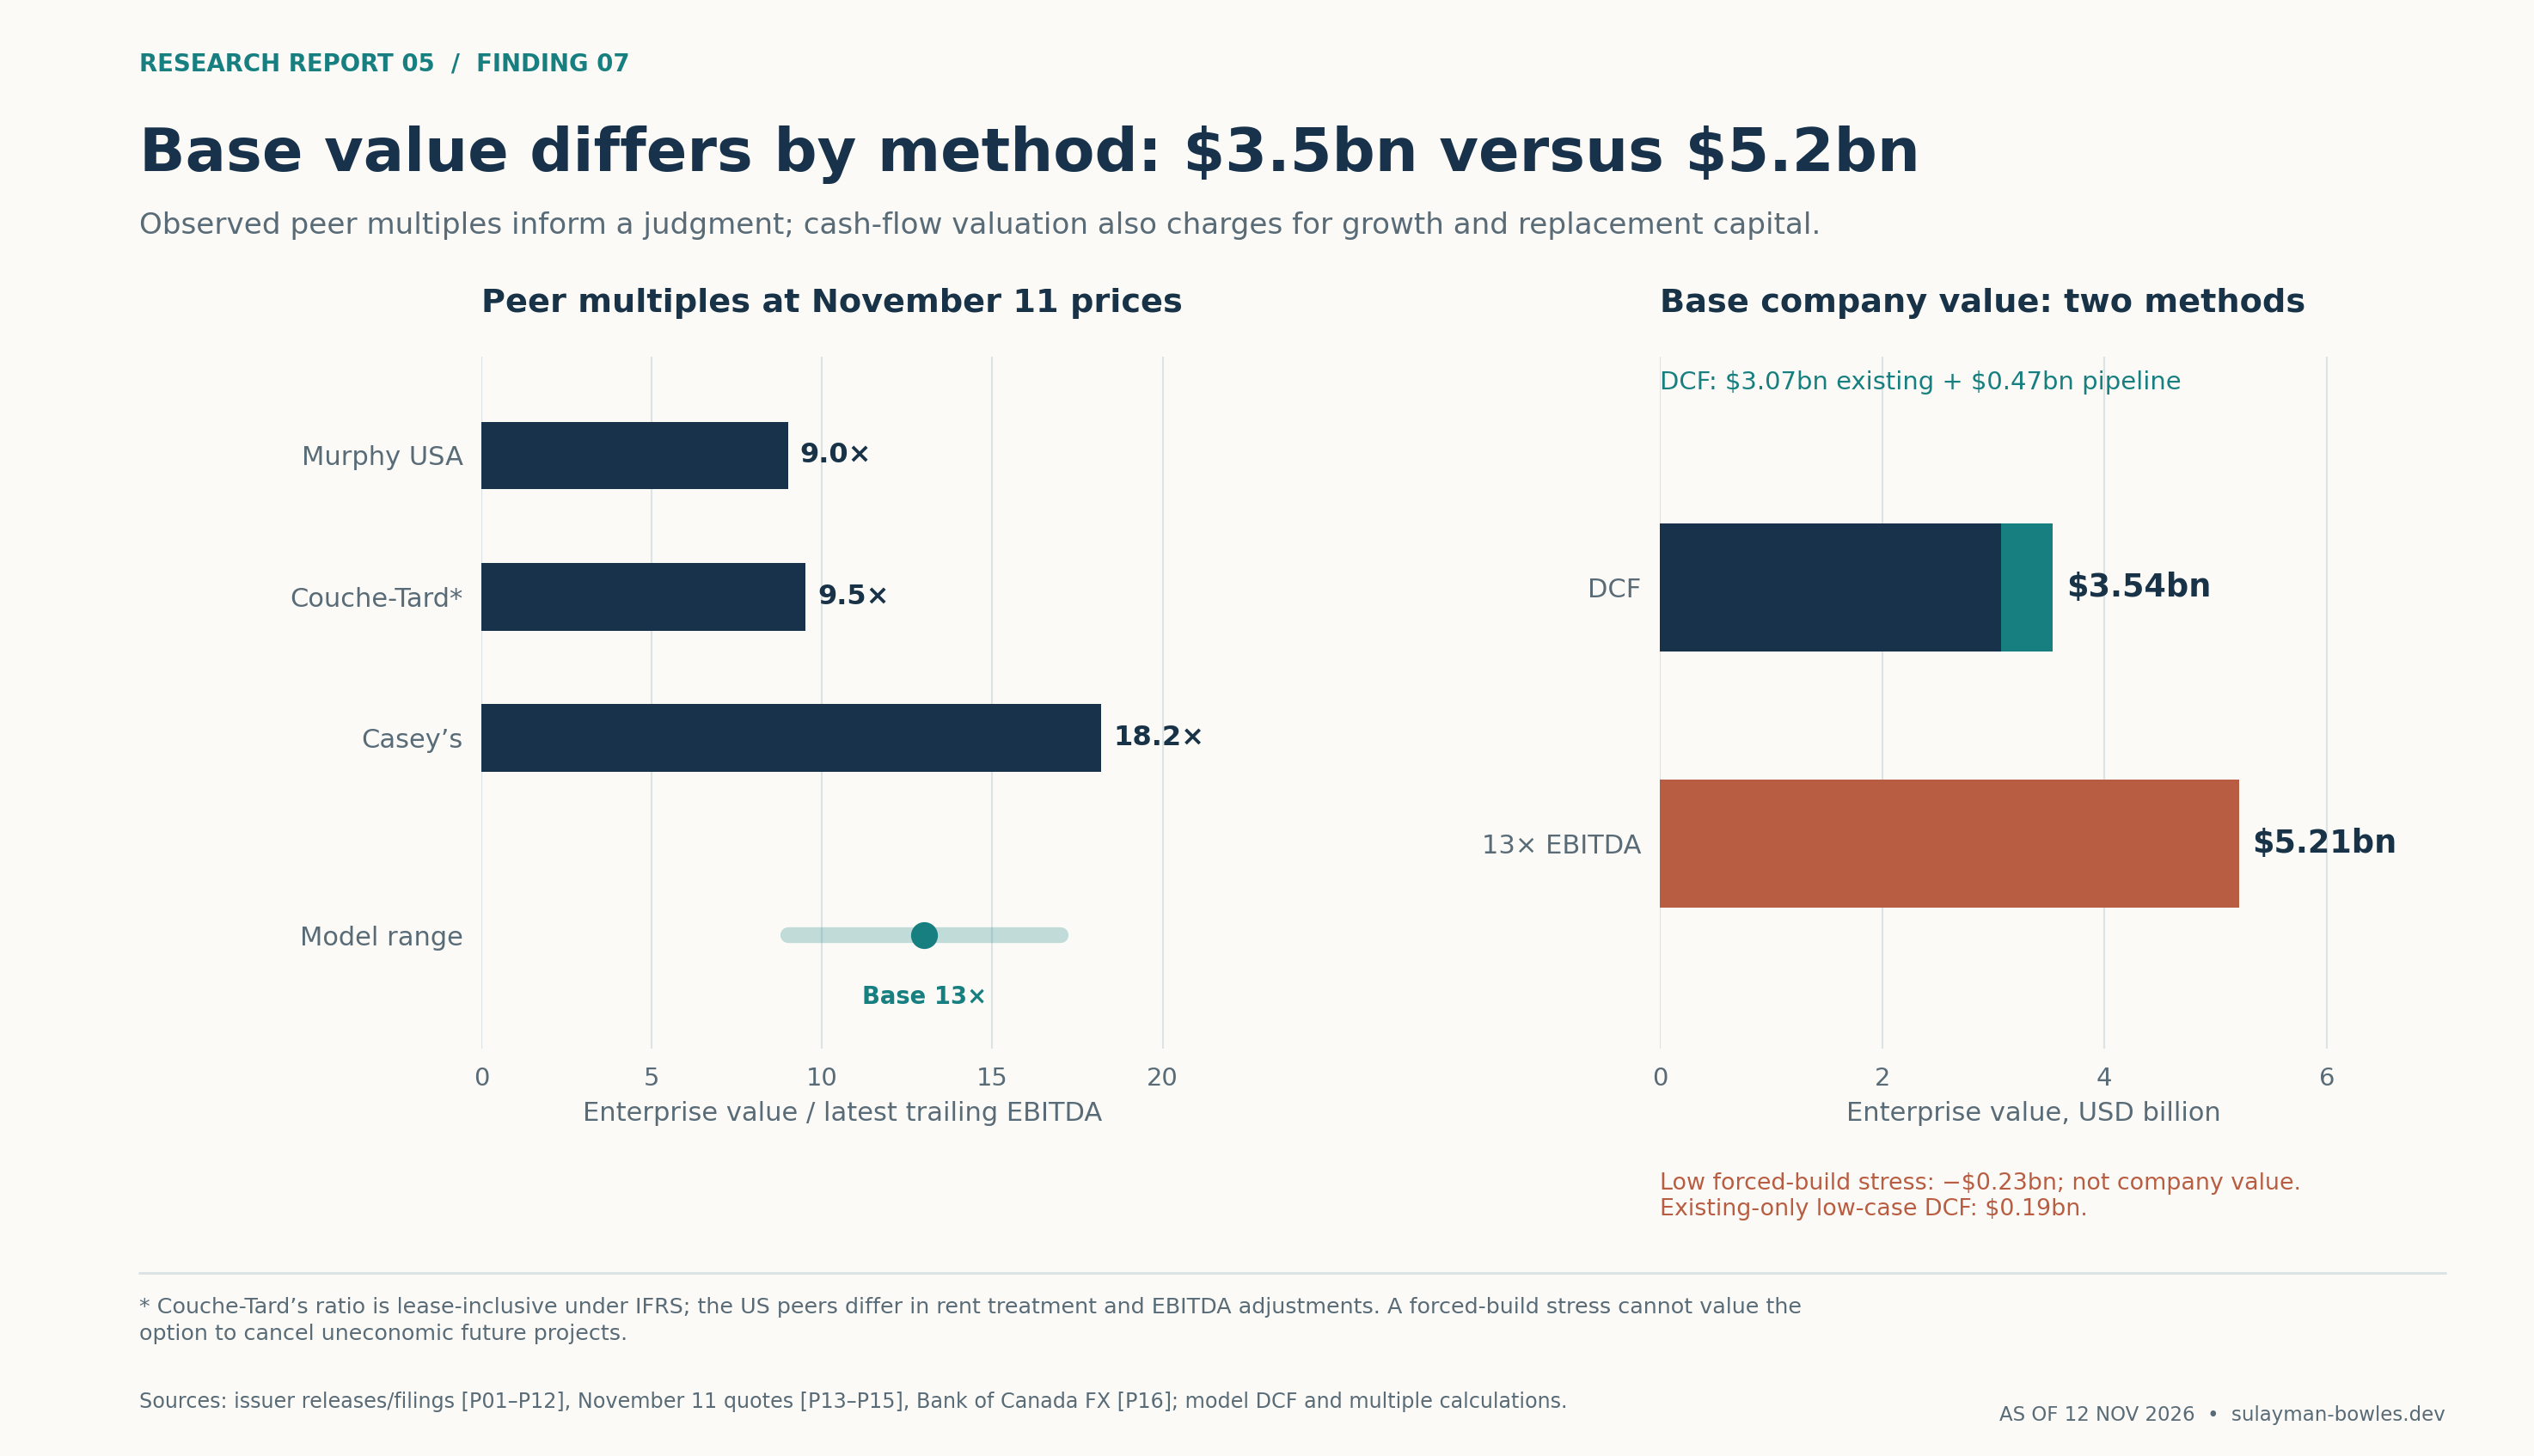
Figure 7. Peer multiples use latest available LTM results and November 11 prices. The central DCF values the existing fleet and deducts future construction spending before adding net pipeline value.
Carry inside uncertainty all the way to value
| Annual inside sales per prototype; all other inputs at Base | $45m | $60m | $75m |
|---|---|---|---|
| Store EBITDA | $8.08m | $14.14m | $20.20m |
| Store cash after tax and replacement | $4.31m | $8.86m | $13.40m |
| Enterprise value at 13× | $2.69bn | $5.21bn | $7.73bn |
| Enterprise DCF including modeled pipeline | $0.92bn | $3.54bn | $6.16bn |
At the central footprint and 13× multiple, every $5 million of annual inside sales changes estimated enterprise value by $840 million, before allowing additional labor or capacity costs. The appropriate research priority is therefore better evidence on store revenue and expenses. More precision in the peer multiple would leave those inputs unchanged.
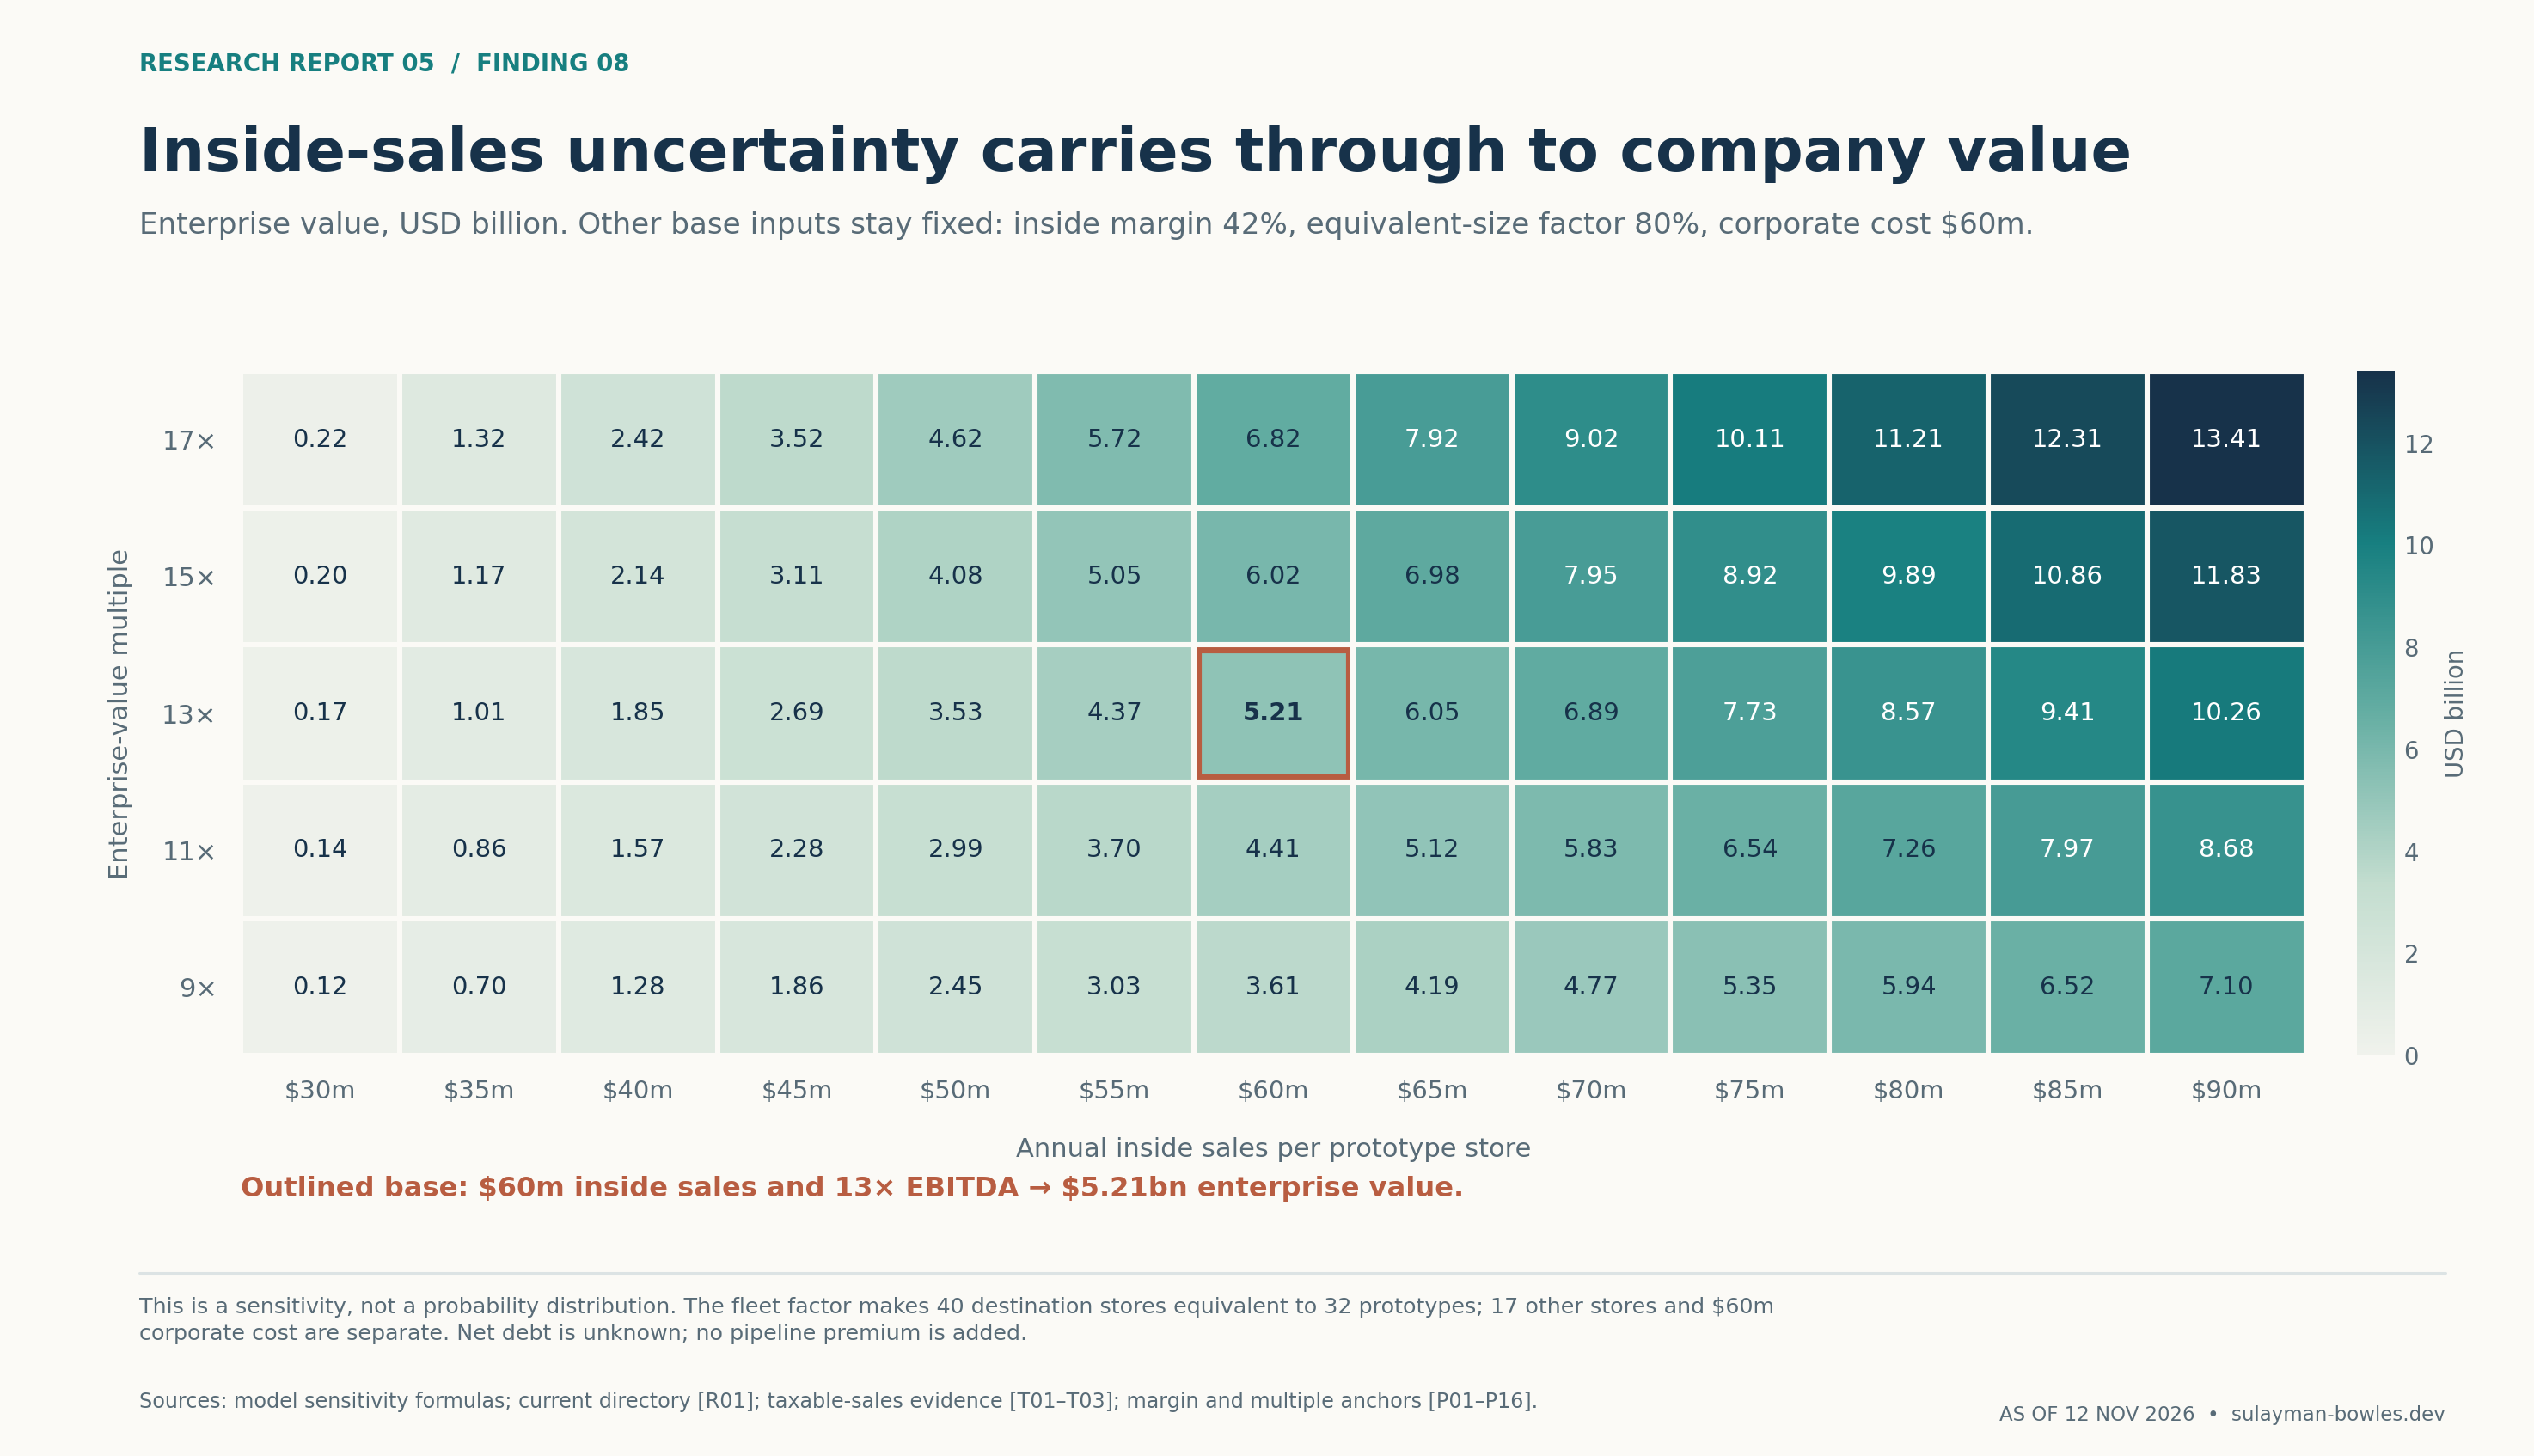
Figure 8. All other operating assumptions remain at Base. The workbook also sends the inside-sales change through the full DCF, including future-store cash generation, working capital and construction funding.
8. What evidence would change the conclusion?
The capital conclusion is the best constrained of the three. Four comparable Texas registrations and the Palmer Lake cost study place large projects in a consistent broad territory. It would change with a completed project ledger showing substantially different land, road, equipment or opening costs. A consolidated $50 million completed project would improve returns; repeated $90 million outcomes would weaken them.
The earnings conclusion is more fragile. The most valuable new evidence would be twelve months of store-level inside sales, taxable sales, gallons and paid labor hours. Inside sales consistently below $45 million, product margins near 35%, or labor materially above the modeled FTE burden would push value down. Inside sales above $75 million with stable staffing and product margins above 42% would move it up. Those are the conditions I would test against operating results.
The Waller inference would change if an official reconciliation showed that its rebate includes taxable receipts beyond the modeled retail project or covers materially different periods. Hillsboro would be easier to verify if the county disclosed the exact return months behind its payment. Neither uncertainty licenses assigning unexplained allocation changes to a specific business.
Company value would also change with a verified store-by-store size and profit inventory, corporate costs, remaining construction commitments, lease obligations and net debt. The 40/17 grouping and equivalent-size factors are material placeholders. A private balance sheet would resolve the difference between enterprise and equity value; until then, an equity number would be invented precision.
Finally, public-market pricing can change daily. The contemporaneous peer snapshot makes the multiple selection reviewable, but does not guarantee what investors would pay for a much smaller issuer with concentrated site exposure. Owned property should not be added wholesale to an operating enterprise valuation: those earnings already benefit from owning the sites. A standalone property valuation requires charging the operating business market rent first.
The supported conclusion is that a modern Buc-ee’s can plausibly be a $70 million capital project producing mid-teens millions of annual store EBITDA, with cash recovery closer to eight or nine stabilized years than five. At the modeled current footprint and announced expansion, that supports central enterprise-value indications of about $3.5–5.2 billion. The documents make the assumptions testable. They do not turn a private company into a publicly reported one.
Sources and calculation notes
All sources were checked or retrieved by November 12, 2026. Page references below distinguish printed pages where necessary. The downloadable source register contains additional documents, exact locators and qualifications; raw CSVs preserve the observations used in calculations. Model estimates are identified in the text and workbook.
- TDLR TABS, project detail tags Estimated Cost / Scope of Work / Square Footage: Hillsboro TABS2022020344, June 1, 2022; Luling TABS2022024145, July 20, 2022; Amarillo TABS2023009437, January 16, 2023; San Marcos TABS2024024885, August 7, 2024; Boerne TABS2023021288, June 13, 2023. Source IDs BC01–BC05. ↩
- Opening/project descriptions: company San Marcos announcement, July 29, 2026, opening paragraph and jobs paragraph; Hillsboro opening release, April 10, 2024; company Luling release, May 28, 2024, and Amarillo release, December 2, 2024, location paragraphs. Luling’s precise completed area comes from the company world-record page, retrieved November 12, 2026. Boerne amendment 0014685, February 12, 2026, amended project and employment provisions. Registration forecasts and specifications at opening have their own labels. ↩
- Hill CAD public downloads, 2026 export, main PID 113209 and adjacent parcels; Caldwell CAD public data, July 31, 2026 certified export, PID 43669; Bastrop CAD exports, October 1, 2026 real-property export, PID 36577, land/building/sale tables. Focused extracts are supplied. Cypress: Harris CAD public GIS query, account 1301600010002, parcel geometry/ownership. Primary exact indoor area for Cypress remains unverified. ↩
- Maricopa County-hosted Bullard Wash Phase II appraisal, revised December 18, 2025, Comparable Land Sale 1, p45; summary p49. Detailed value $17,246,890 versus summary $17,246,749. TxDOT Commission minutes, March 27, 2025, printed pp76–77/PDF pp23–24, minute 116922, $1,905,299 supplemental right-of-way sale. ↩
- Economic & Planning Systems for Palmer Lake, Fiscal Impact Analysis, April 24, 2025, Table 11 p18, Tables 12–13 p19, land discussion p20. $30m is a conservative agreement-based taxable-sales assumption; $63.25m development excludes $7.1m land. The transportation component is already included. ↩
- Waller FY2025 audited financial report, audit opinion March 11, 2026, Note 4 printed p47/PDF p51. Waller agreement 0004110, February 20, 2012, Articles 1.1, 2.1, 3.1 and 4.2, pp2–4. Source IDs T01/T03 and TX01/TX02. ↩
- Waller FY2024 financial report, opinion June 16, 2025, Note 4 printed p46/PDF p50. Waller FY2022 audit, opinion February 10, 2023, year ended September 30, 2022, Note 4 printed p59/PDF p63. The earlier FY2021 receipt/rebate pair does not reconcile at 75% and is excluded from the sales trend; no inference about intent follows. ↩
- Hill County FY2025 annual financial report, opinion July 14, 2026, Note F printed p38/PDF p51. Hill County agreement 0006728, September 29, 2022, pp2–4, definitions and Articles III–IV. The underlying tax-return months remain unknown. ↩
- Texas Comptroller, Grocery and Convenience Stores: Taxable and Nontaxable Sales, product-category guidance, retrieved November 12, 2026; motor-fuel general-sales-tax exemption, September 2025, Tax Code 151.308(a)(2) discussion. The 80% taxable share is an analyst assumption. ↩
- Texas Comptroller Statewide Local Allocation Payment Detail, dataset 3p4v-vsr3, allocation-month and collection-component fields; city comparison dataset vfba-b57j, net_payment_this_period. Retrieved November 12, 2026. Historical quarterly tax-rate archive and exact dated file URLs appear in historical_city_rates.csv. The 2026 distribution schedule distinguishes payment dates from allocation dates. Both source datasets and their publication cutoffs are preserved. ↩
- Texas Governor’s office, Luling opening announcement, June 10, 2024; replacement status and $40m investment. Caldwell County agreement 0006175, June 14, 2022, p1 definitions and p2 Articles 3–7. Source I06 and the normalized agreement CSV preserve the agreement’s scope. ↩
- San Marcos agreement 0009035, effective February 20, 2024, pp2–5; corrected state record, filed May 6, 2024. Hays Caldwell EDP-hosted San Marcos approval release, page dated March 7, 2024 with subsequent county-approval information, retained-city-tax projection. Amarillo signed agreement 0006569, p1 sales qualification, p2 investment, §2.2 p3 jobs/payroll, §3.1 p4 sharing. City signature September 20, 2022; front page February 8. Complete agreement extraction preserves these dates. ↩
- Casey’s fiscal 2026 earnings release, June 9, 2026, Inside, Fuel, Operating Expenses and category tables; 2026 Form 10-K, filed June 22, MD&A pp19–25 and Note 1 p36. Murphy USA FY2025 release, February 4, 2026, Fuel and Merchandise tables; 2025 Form 10-K, February 18, 2026, pp37–38. Source IDs P01/P02/P05/P06. ↩
- Casey’s Q1 FY2027 release, September 8, 2026, quarter ended July 31, Fuel table. Murphy USA Q3 2026 release, October 28, Fuel table; September 30, 2026 Form 10-Q, filed October 30, fuel-contribution discussion. ↩
- Buc-ee’s careers, Travel Center Career Path Opportunities and Benefits, retrieved November 12, 2026. The ranges describe advertised pay. Average payroll remains unknown. Annual paid FTE, blended wages and burden remain model assumptions. ↩
- Buc-ee’s locations, retrieved November 12, 2026, 57 unique current store IDs preserved in current_footprint.csv. The model’s 40 destination/17 other grouping has its own label and does not rely on stale announcement boilerplate. ↩
- Buc-ee’s estimated opening schedule, retrieved November 12, 2026, opening-date list. Murfreesboro announcement, November 2, 2026. Rocky Mount permitting announcement, October 20, 2026; over $60m investment and over $30m annual taxable sales are estimates for the proposed project. ↩
- LTM EBITDA and EV bridges: Casey’s P01/P03 releases and Q1 FY2027 Form 10-Q, September 8, cover shares and balance sheet; Murphy P05/P07 releases and P08 Form 10-Q, cover and balance sheet; Couche-Tard FY2026 release, June 22, 2026, EBITDA reconciliation, and Q1 FY2027 quarterly report, September 1, p5 shares, p9 EBITDA, p10 net debt, pp25–28 statements and leases. Current share counts: CASY September 2; MUSA September 30; ATD August 27. Point-in-time shares are not diluted weighted-average earnings-per-share denominators. ↩
- November 11 close: Casey’s via Yahoo Finance and Murphy USA via Yahoo Finance, explicitly non-primary price-feed exceptions, independently cross-checked; Couche-Tard issuer-hosted stock quote. Bank of Canada daily exchange-rate lookup, November 10 row. Exact quote timestamps, share counts, currencies and debt bridges are in raw peer inputs and Peer Comparison. ↩
- Couche-Tard, Żabka offer announcement, July 31, 2026, offer value and funding paragraphs; Żabka Group, nine-month 2026 update, October 2026, transaction section describing conditions as of October 27. This report uses a historical, non-pro-forma peer bridge. ↩
Supporting material
- Excel model ↗Sourced inputs, live calculations and reported outputs.
- Source and model data (CSV collection) ↗Data tables, source references and calculation exports.
- Source register ↗Download as CSV.