Texas business
What is H-E-B worth?
The base case puts H-E-B’s operations at $28 billion, on estimated annual sales of $52 billion.

H-E-B’s operating business is worth about $28 billion in the base case, with a defensible scenario range of approximately $17 billion to $48 billion. The estimate starts with $51.6 billion of 2026 revenue and $3.61 billion of EBITDA. Revenue has substantial public support; profitability does not. The most consequential judgment is that H-E-B earns a sustainable 5% operating margin, after employee compensation and ordinary operating costs.
This is enterprise value: the value of the operations before allocating that value between financial creditors and shareholders. H-E-B’s current net debt, financial investments and fully diluted ownership register are UNKNOWN from the public evidence reviewed. With an illustrative $2 billion of net financial debt, the base equity value would be $25.7 billion. The assumed debt shows how the equity value changes with the debt balance.
| Model output | Low | Base | High |
|---|---|---|---|
| Estimated 2026 revenue, $bn | 50.59 | 51.58 | 52.58 |
| Assumed operating margin | 4.0% | 5.0% | 6.0% |
| Estimated EBITDA, $bn | 3.04 | 3.61 | 4.21 |
| Discounted cash-flow value, $bn | 13.98 | 26.59 | 53.66 |
| EBITDA-multiple value, $bn | 19.73 | 28.89 | 42.06 |
| Selected operating value, $bn | 16.85 | 27.74 | 47.86 |
The selected value gives equal weight to the cash-flow and multiple approaches. That is an explicit analyst convention. Both depend on the same revenue and margin assumptions, so their agreement is not independent statistical confirmation. The low and high cases combine operating, reinvestment and valuation assumptions; they are not confidence bounds.
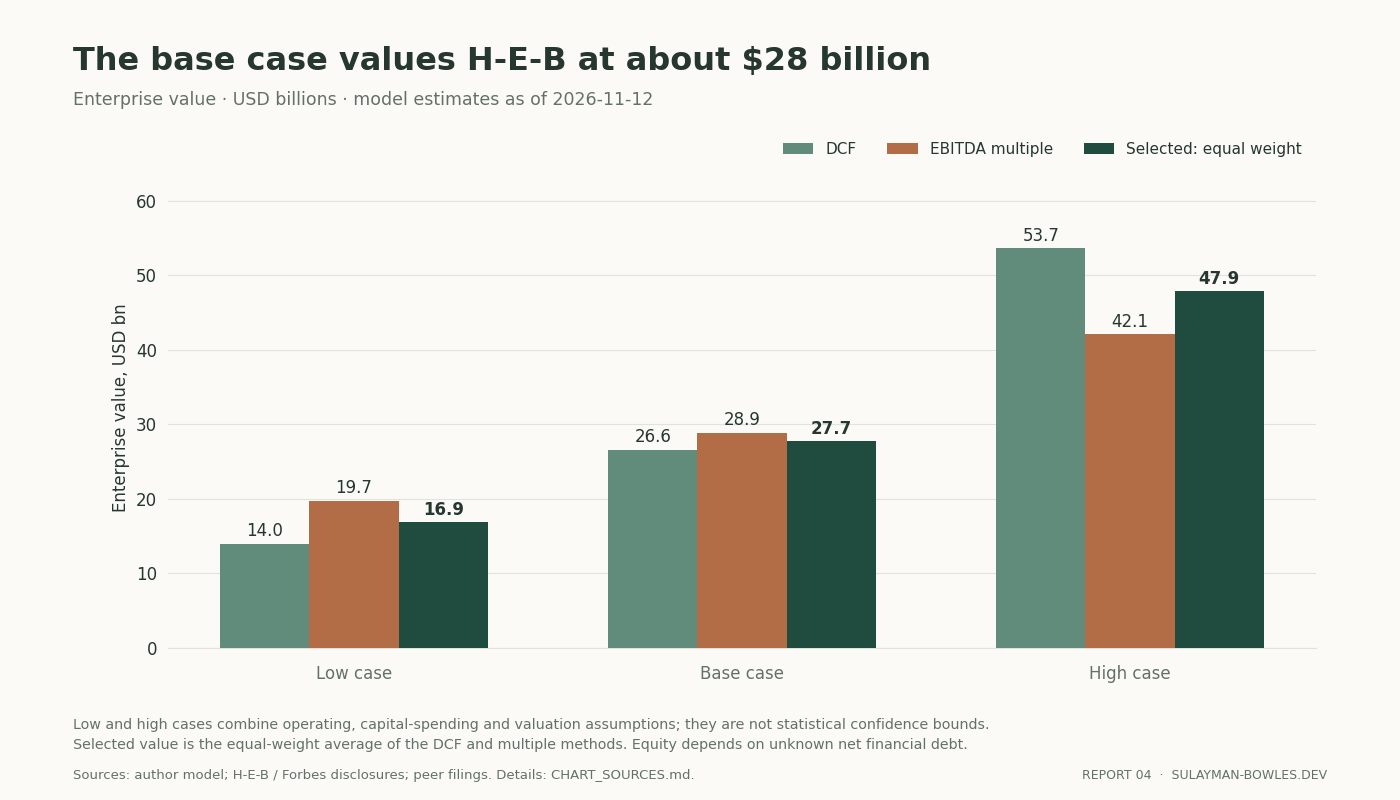
Figure 1. Author model, recalculated November 12, 2026. The workbook and plotted-data CSV preserve unrounded results.
1. Revenue: three methods, one clear winner
Disclosures provide the strongest anchor
H-E-B’s September 30, 2025 leadership announcement says sales reached $50 billion. Its current corporate description says annual sales exceed $50 billion and its footprint exceeds 460 stores in Texas and Mexico. Forbes identifies fiscal 2025 revenue as $49.6 billion. Those figures alone don’t show a discrepancy. The measurement dates and definitions aren’t fully reconciled in public.company, forbes-family
The model applies 2%, 4% and 6% growth to Forbes’s fiscal 2025 number. That produces $50.59 billion, $51.58 billion and $52.58 billion for 2026. None is presented as reported fiscal 2026 revenue. H-E-B has not supplied the public consolidated statements needed to verify the exact fiscal calendar, revenue recognition perimeter or audited current-year result.
There is also a historical-data trap. Corporate boilerplate on old newsroom pages can change when the website is updated. A current $50 billion description displayed beneath an older release is not proof that H-E-B had $50 billion of sales in that older year. Similarly, the downloadable Forbes history is labeled by list year; its repeated $49.6 billion entries are not two independently reported fiscal-year observations.
| Estimated 2026 consolidated revenue, $bn | Low assumptions | Base assumptions | High assumptions | Evidential role |
|---|---|---|---|---|
| Disclosures, rolled forward | 50.59 | 51.58 | 52.58 | Strongest anchor |
| Store count × area × sales density | 35.49 | 47.38 | 62.49 | Operational plausibility check |
| Texas food spending × share, plus Mexico | 39.60 | 50.22 | 63.07 | Geographic plausibility check |
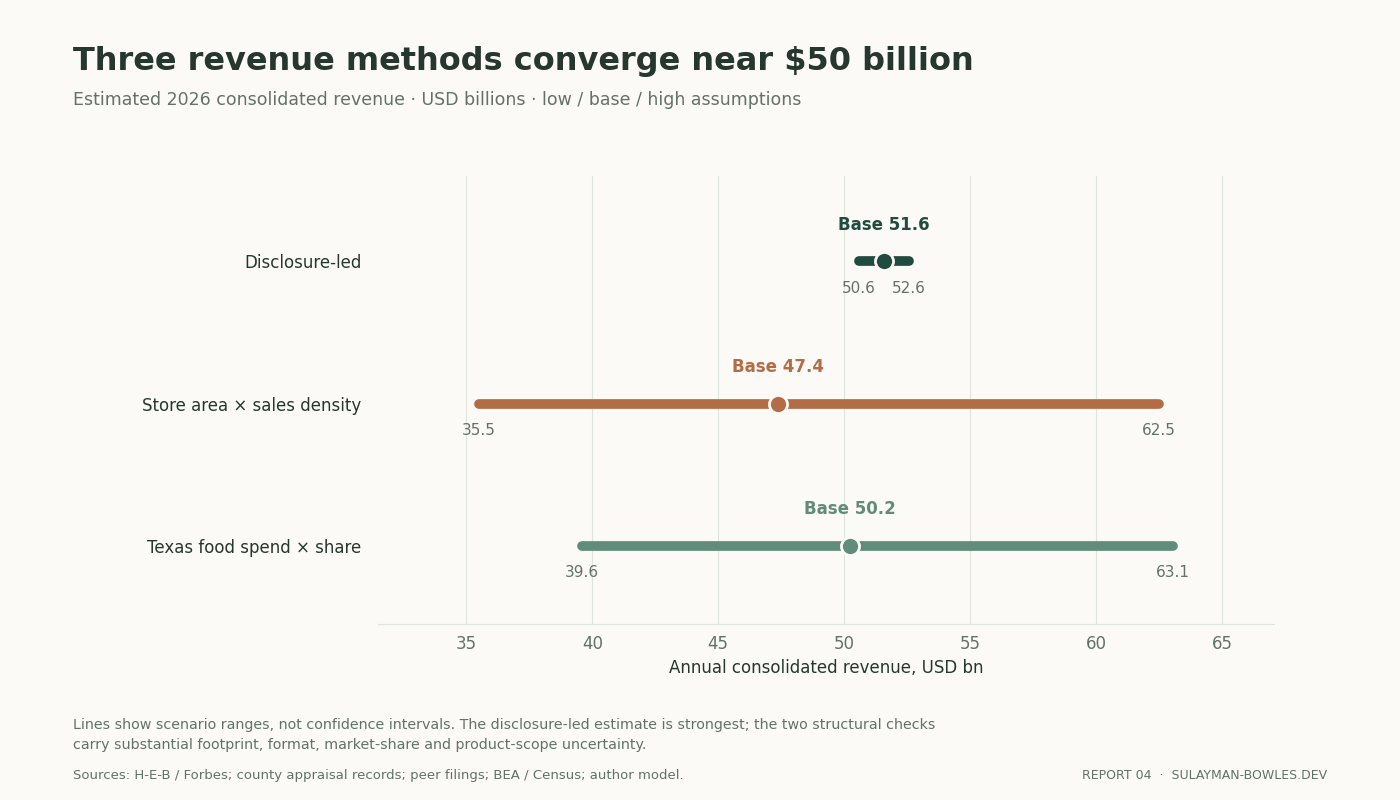
Figure 2. Company and Forbes disclosures; county appraisal records; Publix filings; BEA and Census data; author assumptions. The wide ranges test uncertain parameters. They are not equally likely revenue estimates.
Store area supports the scale, but cannot measure the whole chain
The physical method uses a deliberately small, traceable county sample. Bexar’s record for 302 Valley Hi Drive contains 97,532 square feet in the two grocery “MARKET” building rows. Harris appraisal data report 132,736 square feet at 5251 FM 2920 and 116,449 at 9722 Fry Road. Their mean is 115,572 square feet.county
These measurements cover the gross building area. Bexar’s shopping-center building is excluded. The Harris area fields appear in a municipal mirror with a 2024 tax-year field, while its metadata references an older refresh; the measurement vintage is unverified. Travis ownership and values were accessible, but county building areas were not. Those missing areas remain UNKNOWN and do not enter the average.
The base case applies 85% of the sample mean, producing 98,236 square feet per main-banner store. It uses an estimated 347 main-banner stores, including H-E-B Plus. That count is a residual assumption consistent with the broad group footprint. A verified store-by-store census is unavailable.
Publix reported $62.749 billion of 2025 sales and 67.8 million gross square feet. The resulting $925.50 of annual sales per gross square foot provides the peer anchor. Applying an assumed 1.30 density multiplier gives H-E-B $1,203 per square foot. Main-banner sales then equal $41.01 billion; adding the other formats and Mexico produces the $47.38 billion physical-method estimate.publix-annual
The weaknesses are material. The three properties favor large stores. Placer’s 2023 industry report characterized a standard H-E-B as roughly 50,000 square feet—evidence against casually applying recent flagship dimensions to the whole fleet. That description is not a measured census either.placer-area Fuel, pharmacy, delivery and manufacturing-related revenue can also enter sales without matching the same footprint denominator.
The area haircut and density premium are assumptions that nearly offset: 0.85 × 1.30 equals 1.105. They should not be mistaken for two independently observed corrections. Holding the base footprint and other-format allocation fixed, matching the disclosure-led revenue estimate requires $1,328 per square foot, about 1.43 times Publix’s density, in the main Texas residual business. That is demanding, but the public evidence cannot verify or refute it precisely.
The physical method therefore identifies what must be true. It does not supersede a direct company revenue statement. The estimate excludes parameter combinations producing $35 billion when they conflict with the company’s disclosure.
Texas food spending gives an independent geographic check
BEA’s latest state consumption data put Texas spending on food and beverages purchased for off-premises consumption at $138.862 billion in 2025. The September 30, 2026 release is the latest available annual observation used here. Advancing it by assumed population growth of 1.2% and food-price growth of 2% produces a $143.339 billion 2026 market.bea
The population assumption is close to the latest same-vintage Census comparison: Texas increased from 31.319 million people in July 2024 to 31.710 million in July 2025, approximately 1.25%.census
The base model assigns food-market share proxies of 5% in Dallas–Fort Worth, 25.2% in Houston, 50.8% in Austin, 52% in San Antonio and 35% in the rest of Texas. Population-weighting those regions produces 27.35% statewide. The statewide share is my estimate from those inputs.
Some regional anchors are available only through free reporting of proprietary research. Chain Store Guide figures reported by Axios put H-E-B at 50.8% in Austin, 25.2% in Houston and above half in San Antonio.shares Their grocery-market denominator is not identical to BEA’s consumption category. The model treats them to inform the scenarios, with their different methods in view.
The base calculation is:
$143.339bn × 27.35% ÷ 85% + $4.10bn Mexico = $50.22bn.
The 85% assumption represents food’s share of Texas H-E-B revenue, allowing for pharmacy, fuel, nonfood merchandise and services. BEA’s series includes alcohol and some farm consumption and follows household residence, which can differ from store checkout location. Population weights also ignore regional differences in spending per person. Changing these assumptions creates the wide $39.60–63.07 billion range.
This is the weakest method for precise measurement. Its usefulness is that the scale of Texas consumption and a plausible regional footprint can accommodate the disclosure-based result. The report uses the disclosure method for valuation and the other two methods to challenge it.
2. The other banners matter, but their accounts are not public
H-E-B’s current public material supports ten Central Market stores, fourteen Joe V’s Smart Shops and two Texas Mi Tienda stores. Mexico’s October 2026 Narro opening release calls the company’s footprint 92 stores. Its 2025 report, however, explicitly included an e-fulfillment center in a count of 88 sites. The physical model uses 91 Mexican retail stores, treating continued inclusion of that center as an assumption. A reasonable count interpretation is therefore an estimated 91–92 locations.formats, mexico-count
| Business | Count used | Base 2026 sales allocation, $bn | Status |
|---|---|---|---|
| Main Texas business, including Plus and unsegmented activities | 347 assumed main-banner stores | 45.257 | Residual after other allocations |
| Central Market | 10 | 1.200 | Estimated from area and density |
| Joe V’s | 14 | 0.847 | Estimated from area and density |
| Texas Mi Tienda | 2 | 0.180 | Estimated from area and density |
| Mexico, including Mi Tienda del Ahorro | 91 physical stores assumed | 4.100 | Estimate anchored to Mexican disclosure |
| Group | Counts have different definitions | 51.584 | Disclosure-led estimate |
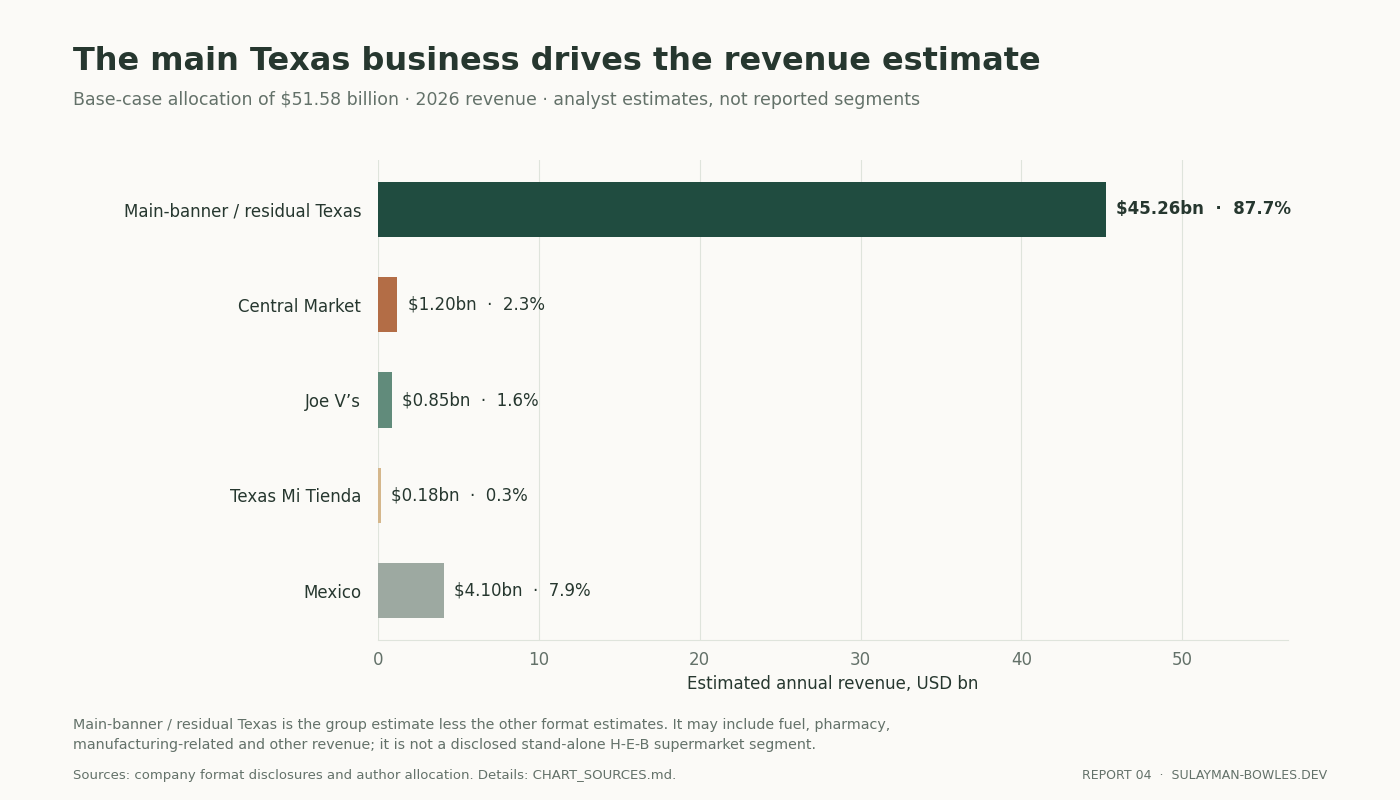
Figure 3. Allocation estimated from available group data. Texas Mi Tienda and Mexico’s Mi Tienda del Ahorro operate in different markets.
Mexico provides the strongest standalone banner evidence. Its 2024 annual report states sales exceeded MXN66 billion. At the Federal Reserve’s 2024 average of MXN18.3062 per dollar, that puts the threshold above $3.605 billion for 2024. The $4.10 billion 2026 base estimate allows subsequent growth but is not a disclosed result. The 2025 report reviewed did not provide a replacement consolidated sales figure.mexico-sales, fx
Central Market’s base allocation assumes 80,000 square feet per store and $1,500 of sales per square foot. Joe V’s assumes 55,000 and $1,100; Texas Mi Tienda assumes 90,000 and $1,000. All are model inputs. They distinguish the formats without pretending that H-E-B publishes their income statements.
The $45.257 billion Texas residual should not be read as pure conventional-supermarket sales. It absorbs unsegmented fuel, pharmacy, services and any other consolidated revenue. Internal manufacturing transfers cannot create extra consolidated sales. Likewise, delivery merchandise value cannot automatically be added as Favor revenue; the recognized revenue and consolidation treatment would need to be verified first.
3. Profitability is the decisive unknown
H-E-B’s brand strength is visible; its consolidated operating margin is not. The valuation therefore uses a 4–6% EBIT range, with 5% as the base. Adding assumed depreciation and amortization of 2% of sales produces EBITDA margins of 6%, 7% and 8%.
The peer accounts show why a single “grocery margin” is inadequate.
| Latest full fiscal year | Sales, $bn | Gross margin | EBIT margin | EBIT + D&A margin | Cash capex / sales |
|---|---|---|---|---|---|
| Publix, 2025 | 62.75 | 25.39% | 7.37% | 9.11% | 3.59% |
| Kroger, 2025 | 147.64 | 22.86% | 1.28% | 3.54% | 2.61% |
| Albertsons, 2025 | 83.17 | 27.18% | 0.87% | 3.18% | 2.21% |
| Sprouts, 2025 | 8.81 | 38.80% | 7.79% | 9.58% | 2.82% |
| Weis, 2025 | 4.94 | 25.10% | 2.30% | 4.83% | 4.10% |
| Ingles, 2025 | 5.33 | 23.89% | 2.20% | 4.51% | 2.15% |
| Walmart US, 2026 ending January 31 | 482.98 | 27.46% | 5.21% | 7.15% | 4.17% |
Author calculations from annual filings. Fiscal labels and cost classifications differ. “EBIT + D&A” uses a common formula across issuers.publix-annual, kr, aci, sfm, weis, ingles, walmart
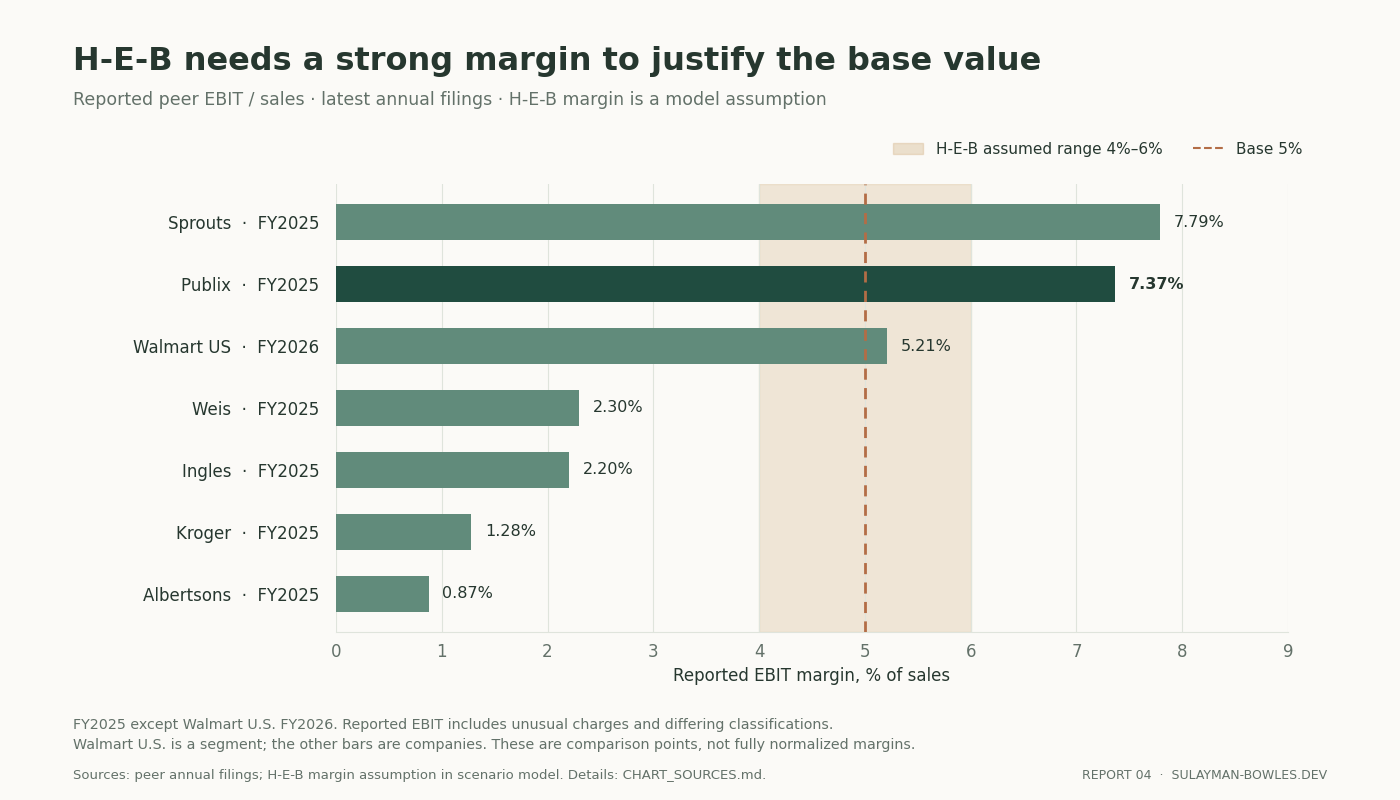
Figure 4. Reported annual EBIT divided by sales. H-E-B’s shaded 4–6% band is an assumption. Unusual charges materially depress some comparison figures.
Kroger’s fiscal 2025 operating profit includes $2.497 billion of fulfillment-network impairment and related charges. Its company-adjusted FIFO operating profit was $4.905 billion, or 3.32% of sales. Treating 1.28% as its normal earning power would mislead. Albertsons reported $3.902 billion of adjusted EBITDA, or 4.69% of sales, but that measure excludes stock compensation and other company-defined items. Its year also contained 53 weeks.kr, aci
Sprouts has a different product mix and little of the fuel and pharmacy scale of conventional chains. Weis’s prior-year figures must use the restatements in its latest annual filing. Ingles’s 2024–2025 comparisons were affected by Hurricane Helene. Walmart US is a segment with general merchandise and e-commerce; its profit includes membership and other income and excludes unallocated corporate costs. Its listed parent cannot be treated as a pure US grocery valuation.sfm, weis, ingles, walmart
These differences also make gross margins imperfect comparisons. Different chains classify distribution, occupancy and depreciation costs differently. The model uses total cash-flow-statement D&A where available, including Sprouts depreciation embedded in merchandise costs, instead of adding back only the amount itemized on the income statement.
Manufacturing and private label support a favorable H-E-B margin assumption, but do not quantify a premium. Vertical integration is common among the peers: their filings describe Kroger manufacturing plants, Albertsons food-production facilities, Publix manufacturing and prepared-food facilities, and production operations at Weis and Ingles.manufacturing
H-E-B Mexico reports private label exceeding 35% of sales in its 2025 report. That percentage applies to Mexico. The combined U.S. and Mexico share remains unknown.mexico-count The model captures potential benefits inside the operating-margin range, without adding a second manufacturing valuation or counting internal factory revenue twice.
Employee ownership is not a reason to remove compensation costs. Publix’s 2025 ESOP contribution expense was $561 million. Stock-based or share-funded compensation can be noncash in a particular period while still imposing an economic cost on owners.publix-annual H-E-B’s assumed operating margins therefore remain after recurring employee compensation. The base case grants H-E-B stronger profitability than normalized Kroger, while remaining below Publix’s annual operating margin. That is a substantial, contestable assumption.
4. Publix is the best valuation comparison—after adjusting its balance sheet
Publix is both employee-owned and an SEC filer. Its board-determined stock price provides evidence for a successful private regional grocer, although it is not an exchange-clearing price or a takeover bid. Its annual filing explains that the valuation process compares its financial results with publicly traded peers. The board price therefore draws partly on the same peer evidence and is not a fully independent valuation cross-check.publix-annual
Effective November 1, 2026, Publix set its share price at $18.70. Multiplying by the latest disclosed 3.172 billion shares, dated October 15, gives $59.316 billion of equity value. The September 26 balance sheet contained $18.460 billion of cash and marketable investments. Those financial assets must be valued outside the grocery business.publix-price, publix-quarter
| Publix bridge | $bn |
|---|---|
| Equity at board-set price | 59.316 |
| Less cash and marketable investments | (18.460) |
| Add disclosed noncurrent finance leases | 0.848 |
| Add noncontrolling interest | 0.034 |
| Operating enterprise-value proxy | 41.738 |
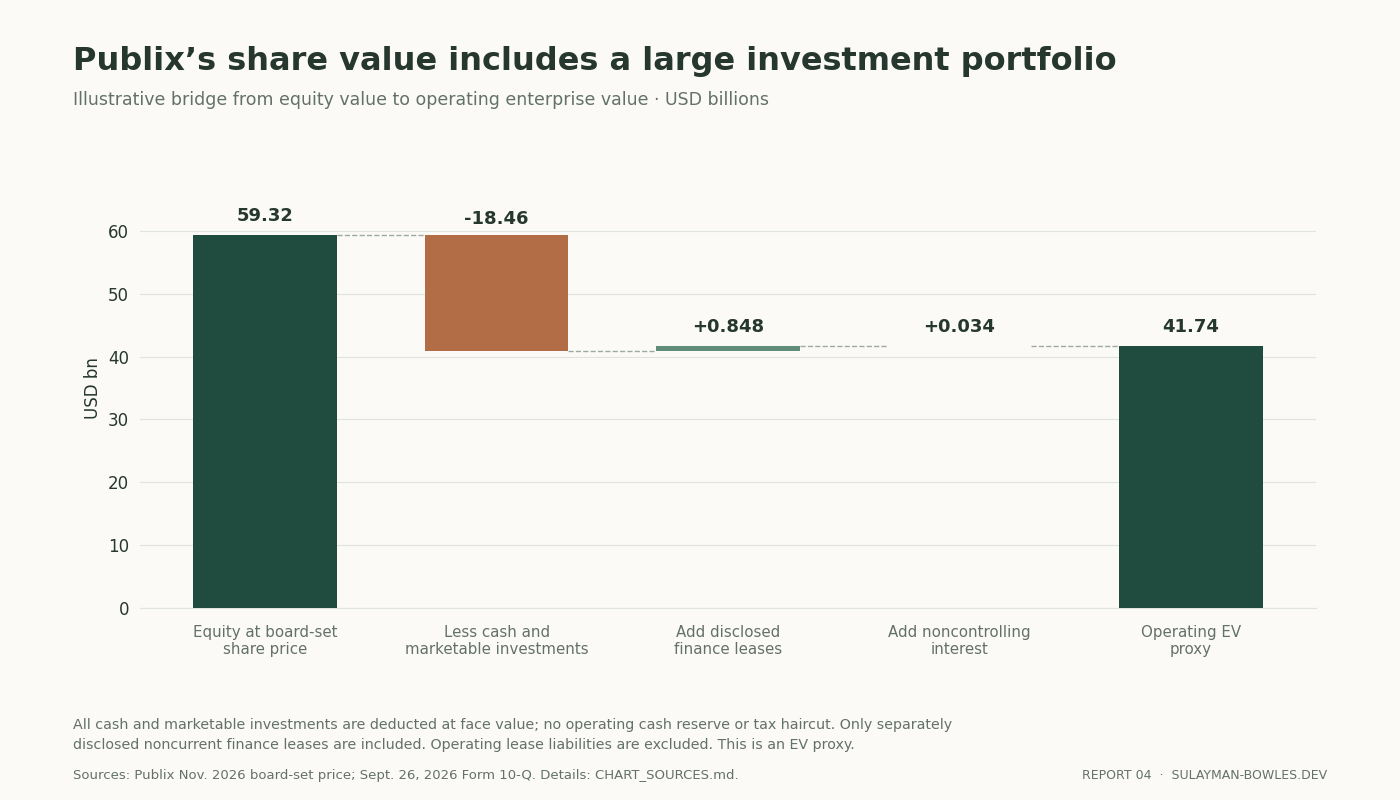
Figure 5. Publix November 2026 stock-price release and September 26, 2026 Form 10-Q. All financial assets are deducted at face value; no operating cash reserve or investment-tax haircut is imposed.
The calculation excludes operating-lease liabilities because rent remains an expense in the earnings denominator. It includes the disclosed noncurrent finance leases; the current finance-lease portion is not identified in the interim balance sheet. The result is therefore an estimate of the operating-to-equity value adjustment. A buyer would need verified debt and cash balances to reconcile it.
The comparable trailing earnings calculation is explicit:
TTM EBITDA = 2025 EBIT and D&A + 2026 year-to-date EBIT and D&A − comparable 2025 year-to-date amounts = $5.569 billion.
Publix’s operating value is therefore 7.49 times trailing EBITDA and 0.659 times trailing sales. Applying the EBITDA multiple to H-E-B’s base $3.611 billion gives $27.06 billion. Applying the sales multiple gives $33.97 billion. These are not two equally persuasive confirmations: the sales approach implicitly imports more of Publix’s superior profitability.publix-quarter
The current comparison is softer than the annual table: Publix’s trailing operating margin is 6.91%, and its third-quarter 2026 comparable-store sales declined 0.6%. Using the latest interim figures matters.publix-quarter, publix-price
The broader comparison uses November 11 public-market prices, the latest disclosed share counts and the latest available interim balance sheets. Each date has its own entry in the workbook. Public quote inputs for Albertsons, Sprouts, Weis and Ingles come from free secondary quote services; their accounting inputs come from issuer or SEC documents.
| Company | Operating EV, $bn | EV / trailing EBIT + D&A | EV / company-adjusted EBITDA |
|---|---|---|---|
| Publix | 41.74 | 7.49× | — |
| Kroger | 56.37 | 10.61× | 6.94× |
| Albertsons | 15.17 | 6.42× | 4.06× |
| Sprouts | 4.57 | 5.41× | — |
| Weis | 1.77 | 6.76× | — |
| Ingles | 1.65 | 6.25× | — |
Latest available trailing periods differ. Kroger and Albertsons adjusted figures are not standardized. Albertsons’s trailing calculation includes an extra week; removing management’s estimated extra-week contribution would increase its adjusted multiple to about 4.13×.peer-current
The model selects 6.5×, 8× and 10× H-E-B EBITDA. Eight times is a premium to the current comparison set, including Publix’s adjusted operating-value proxy. It is justified only if H-E-B’s growth, market position and earnings quality deserve that premium. Ten times is an optimistic case. Neither should be described as the ordinary sector multiple.
There is some current support for the growth thesis: Placer estimated H-E-B visits rose 6% in January–August 2026, against 0.9% for grocery overall, with visits per location up 2.6%. Visits are not sales or profit, so this points in a direction without fixing the multiple.placer-current
5. Owned property supports the business, but cannot be added twice
Public appraisal records document substantial owned operating property. The following is a sample of identifiable parcels. Total portfolio value remains unknown.
| County and address | Recorded owner | 2026 land value, $m | Improvements, $m | Total market appraisal, $m |
|---|---|---|---|---|
| Bexar: 302 Valley Hi Drive | HEB Grocery Company LP | 3.52 | 13.89 | 17.41 |
| Travis: 8801 S Congress Avenue | HEB Grocery Company LP | 10.99 | 14.01 | 25.00 |
| Harris: 5251 FM 2920 | HEB Grocery Company LP | 6.49 | 21.75 | 28.24 |
| Harris: 9722 Fry Road | HEB Grocery Company LP | 10.30 | 16.25 | 26.55 |
| Travis: 2110 W Slaughter Lane | H E Butt Store Property Company No One | 3.48 | 6.77 | 10.26 |
| Harris: 4301 Windfern Road | HEB Grocery Company LP | 16.98 | 62.00 | 78.98 |
County parcel records retrieved November 12, 2026. Windfern is an industrial food/manufacturing property. The Slaughter Lane entity’s exact consolidation and beneficial ownership are unverified.county
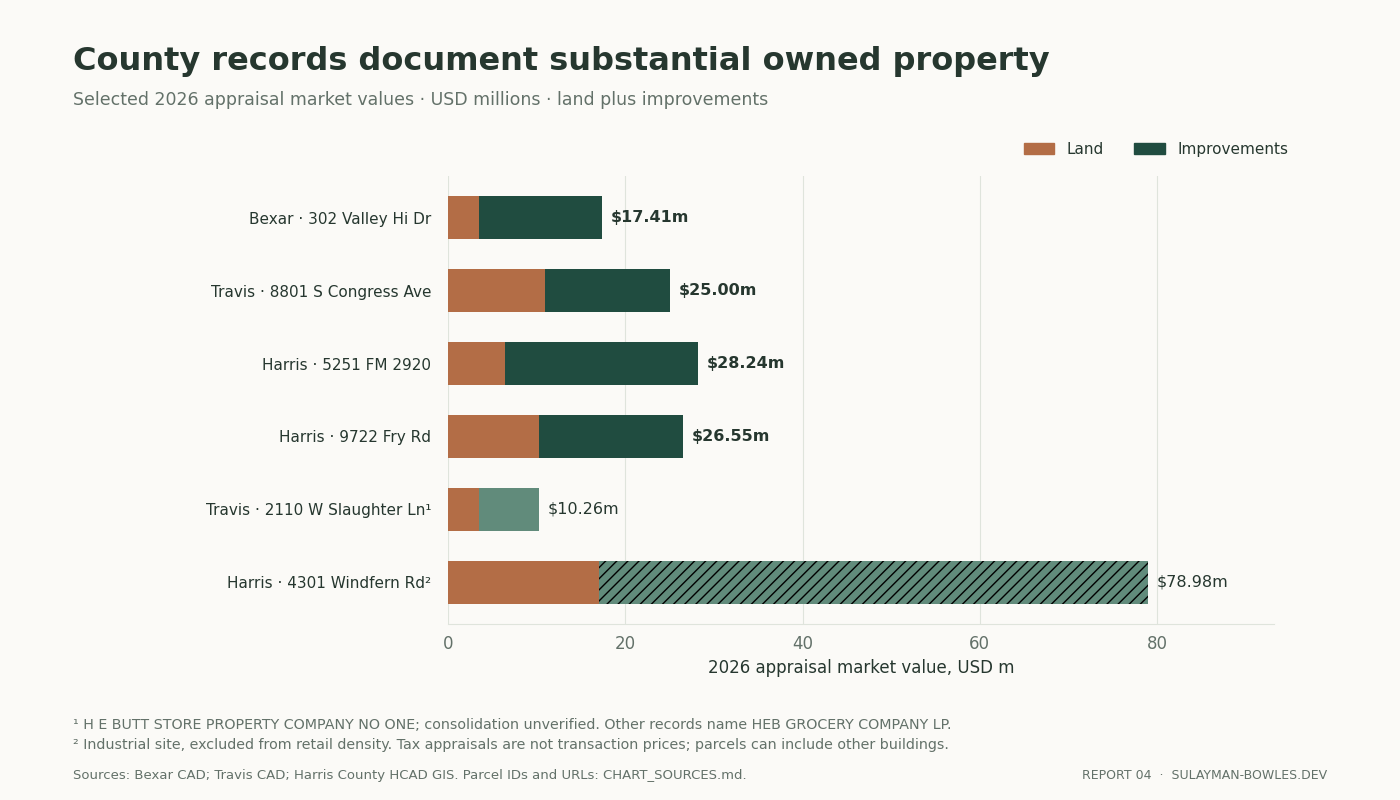
Figure 6. County appraised land and improvements. The industrial site and property entity named in the records are distinguished from directly titled retail sites.
Tax appraisals estimate value for tax purposes. The title records reviewed here leave debt balances unknown. Parcels can include shopping-center buildings, land and improvements beyond the supermarket. The sample is too small and too selected to extrapolate a chain-wide property net asset value.
More fundamentally, owned property already contributes to operating earnings through the rent the business does not pay to a third-party landlord. Adding the county values on top of a going-concern earnings valuation would count that benefit twice. A standalone property valuation would require charging market rent to the retailer, valuing the resulting rental stream, and accounting for property debt, taxes and transaction costs. The public evidence does not support that complete bridge.
The appropriate conclusion is narrower: H-E-B owns meaningful real assets and faces meaningful reinvestment needs. Both belong in the economics of the operating business.
6. The DFW pipeline is real; filed budgets are only part of its cost
Texas Department of Licensing and Regulation TABS records identify seven selected forthcoming DFW flagship projects with $269.139 million of filed construction budgets. Their combined retail-comparison area is approximately 902,863 square feet, including an inferred Hillcrest store area. The registrations record estimates and planned dates. Final expenditures and opening dates can differ.tabs
| Project | TABS project number | Filed budget, $m | Filed completion |
|---|---|---|---|
| Robson Ranch / Denton | 2025013956 | 60.52 | June 10, 2026 |
| Hillcrest / Dallas | 2026021349 | 52.00 | September 6, 2028 |
| Oakmont / Fort Worth | 2027004845 | 45.63 | June 21, 2028 |
| Royse City | 2026026757 | 39.94 | January 28, 2028 |
| West University / Denton | 2026003197 | 30.25 | August 31, 2027 |
| Carrollton | 2026019735 | 22.80 | November 3, 2027 |
| Walsh Ranch | 2025022897 | 18.00 | December 16, 2026 |
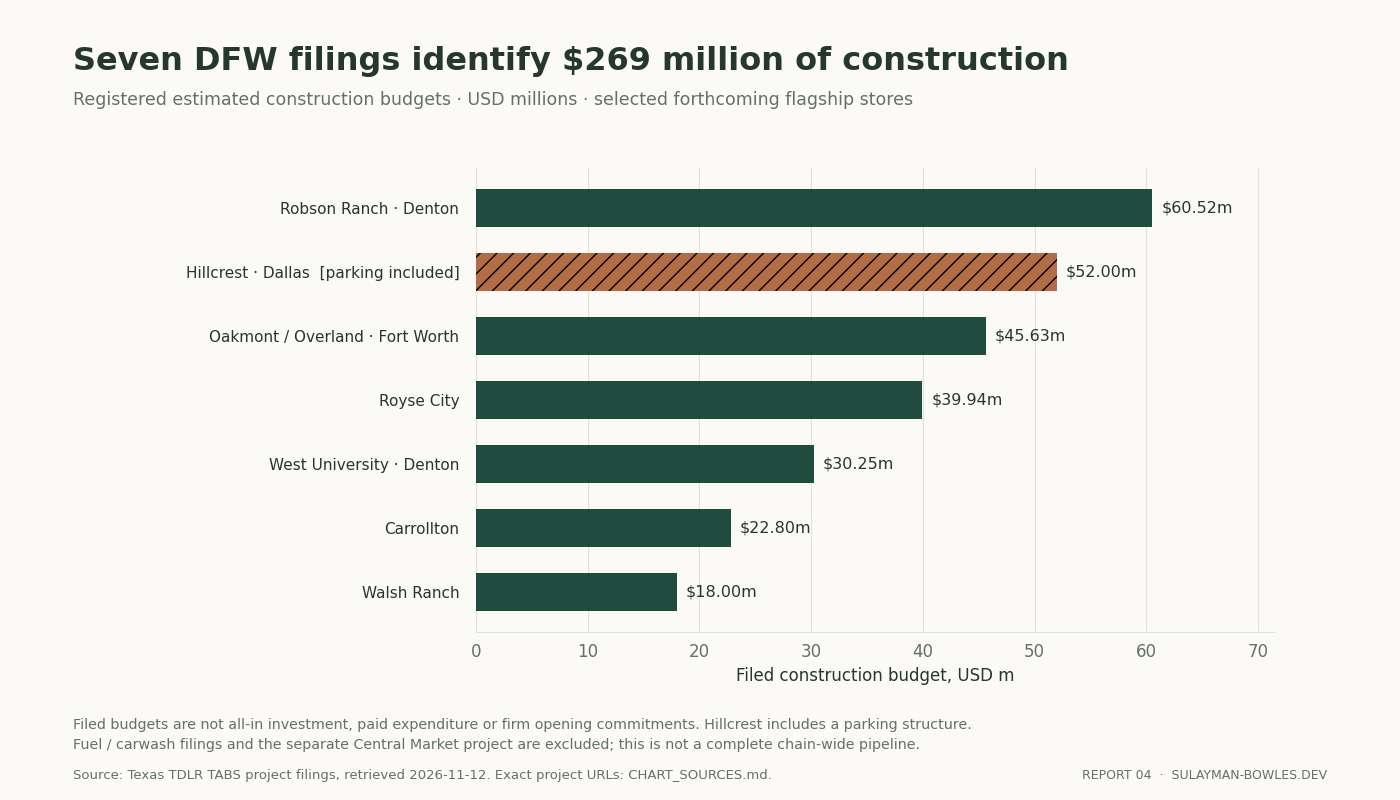
Figure 7. TDLR TABS records, accessed November 12, 2026. Hillcrest includes a parking structure; its budget is not directly comparable with a freestanding supermarket budget.
Several distinctions change the interpretation. Hillcrest’s 493,415 square feet includes 361,995 square feet of parking. The inferred store remainder is 131,420 square feet; the narrative contains a malformed area number. Treating the whole project as selling space would badly distort sales-density analysis.
Robson Ranch’s filed completion date has already passed, but the developer’s current public page describes an early-2027 opening. H-E-B’s Oakmont announcement describes a late-2028 opening, later than the filed construction completion. The model therefore does not equate completion dates with opening dates.opening-dates
Four fuel and car-wash registrations add $6.198 million of budgets but no additional supermarkets. A Central Market project is also kept outside this seven-store flagship sample. Project numbers beginning with 2027 can appear in records registered during calendar 2026; the identifier alone is not an opening-year forecast.
Excluding parking-heavy Hillcrest, the median filed construction budget is $35.10 million. The DCF assumes $55 million of all-in investment per new Texas flagship equivalent, in 2026 dollars, with $65 million in the low valuation case and $50 million in the high case. The base assumption leaves roughly $19.9 million above that construction median for land, fixtures, site works and other opening investment. The model budgets an allowance. Robson Ranch’s construction filing alone exceeds $60 million.
Stores also need a supply chain. In May 2026 H-E-B announced plans for $700 million of additional logistics investment. The model allocates that amount over five years in the base case. The announcement outlines a planned investment budget. The amount spent and annual schedule remain unconfirmed.logistics
7. A busy new store is not automatically a high-return investment
The base new-store assumption is $120 million of mature annual sales, before 25% cannibalization of existing H-E-B revenue. That leaves $90 million of incremental group sales. At a 5% operating margin and 25% economic cash-tax burden, it generates $3.375 million of mature annual after-tax operating cash, assuming maintenance capital expenditure equals depreciation.
Against $55 million of investment, that is an initial mature cash yield of 6.14%. Allocating the base logistics program equally across the first five years’ 60 assumed openings lowers that simple yield to 5.06%. The allocation is intentionally demanding: logistics also benefits existing stores, so assigning all of it to the new openings is not an accounting fact.
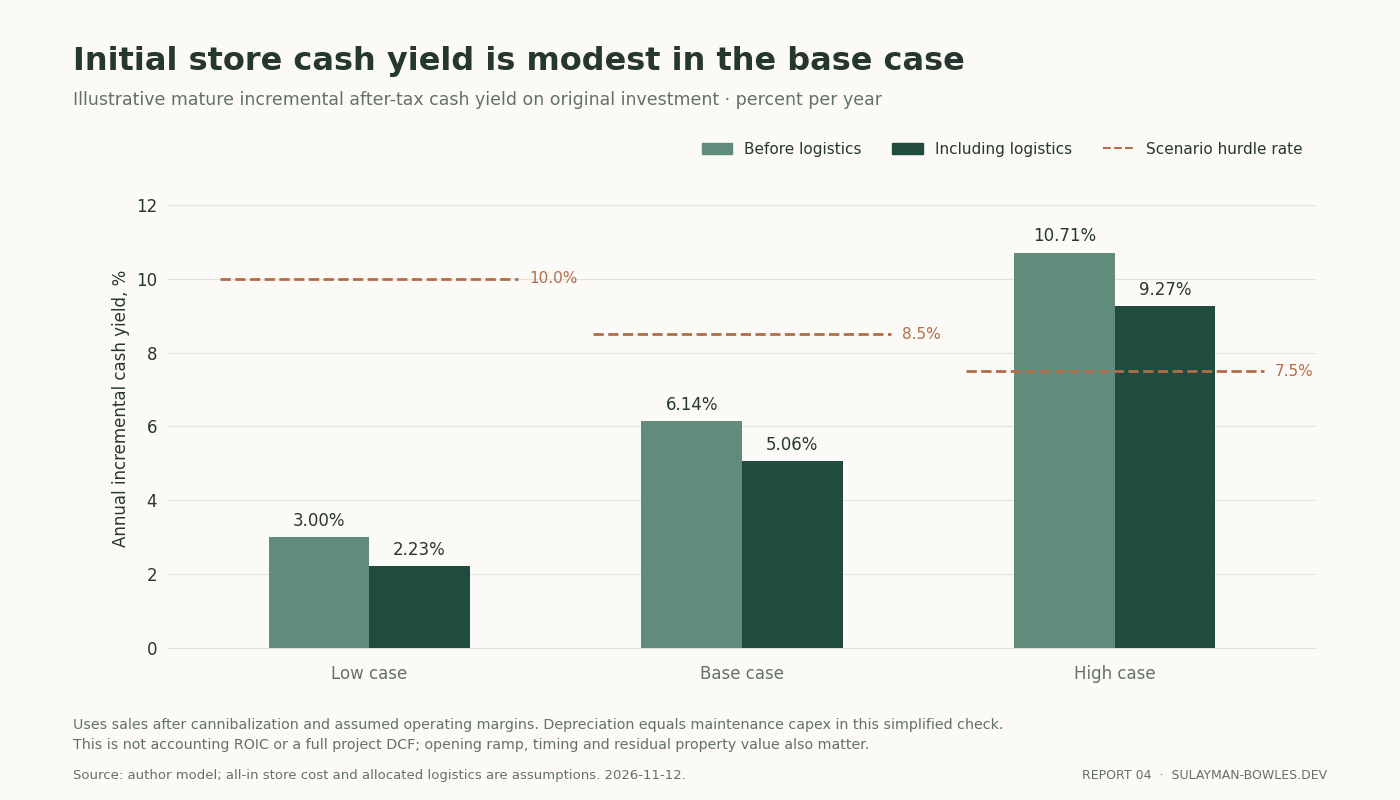
Figure 8. Author model. These ratios divide annual cash flow by original investment. Project IRR depends on the timing of the cash flows. Opening ramps, later growth, timing and residual property value also matter.
Before allocating logistics costs, a flat-sales store would need approximately a 6.93% operating margin, $166 million of mature gross sales, or an investment cost of roughly $39.7 million to produce an 8.5% annual cash yield under the other base assumptions. Each changes one assumption while holding the others fixed.
The base-case initial cash yield leaves the full project return open. Future cash-flow growth can raise its full investment return above its initial cash yield. Conversely, cannibalized sales can leave fixed costs behind at existing stores. The simplified calculation cannot settle either effect. It does show why opening more stores is insufficient evidence for a higher valuation: the margin, construction cost and incremental sales must work together.
8. The DCF values population growth and store expansion after paying for both
The forecast runs from 2027 through 2036. It is a normalized annual DCF prepared on November 12, 2026: the first full-year cash flow is discounted one year, with no partial-2026 stub. It should not be mistaken for an exact intrayear transaction valuation.
| Decisive assumption | Low | Base | High |
|---|---|---|---|
| Annual Texas population growth | 0.8% | 1.2% | 1.6% |
| Annual food-price growth | 1.8% | 2.0% | 2.2% |
| New Texas flagship equivalents/year, first five years | 8 | 12 | 18 |
| New equivalents/year, next five years | 6 | 10 | 15 |
| Mature sales/new unit, 2026 $m | 100 | 120 | 140 |
| Cannibalization of new-unit sales | 35% | 25% | 15% |
| New-unit investment, 2026 $m | 65 | 55 | 50 |
| Mexico annual revenue growth in dollars | 3% | 5% | 7% |
| EBIT margin | 4% | 5% | 6% |
| Discount rate | 10% | 8.5% | 7.5% |
| Terminal nominal growth | 2% | 2.5% | 3% |
| Terminal return on new invested capital | 8% | 8.5% | 12.5% |
I use these assumptions to model the expansion. The discount rate is the modeled investment hurdle. H-E-B’s financing cost remains unobserved. Texas growth uses population and price increases multiplicatively. New stores add 50%, 30% and 20% of assumed mature sales in their first three years, at each year’s prices, after cannibalization; previously recorded sales also grow with the Texas market assumption. The extra increment assumes H-E-B gains share beyond market growth. Population growth alone does not guarantee it.
All cases include a 25% economic tax burden; this is not an assertion about H-E-B’s legal tax classification. Maintenance, remodeling and recurring IT investment consume 2% of revenue. New Texas stores and the logistics program are additional. Mexico growth investment consumes another 3.5% of Mexico revenue, on top of ordinary maintenance. Incremental working capital consumes 1% of revenue growth.
Base free cash flow begins at $1.03 billion in 2027 and reaches $2.20 billion in 2036, when revenue reaches $83.81 billion. The step up after 2031 partly reflects the end of the explicitly modeled logistics program and fewer annual openings. Additional logistics expansions would reduce those later cash flows unless covered by the maintenance allowance.
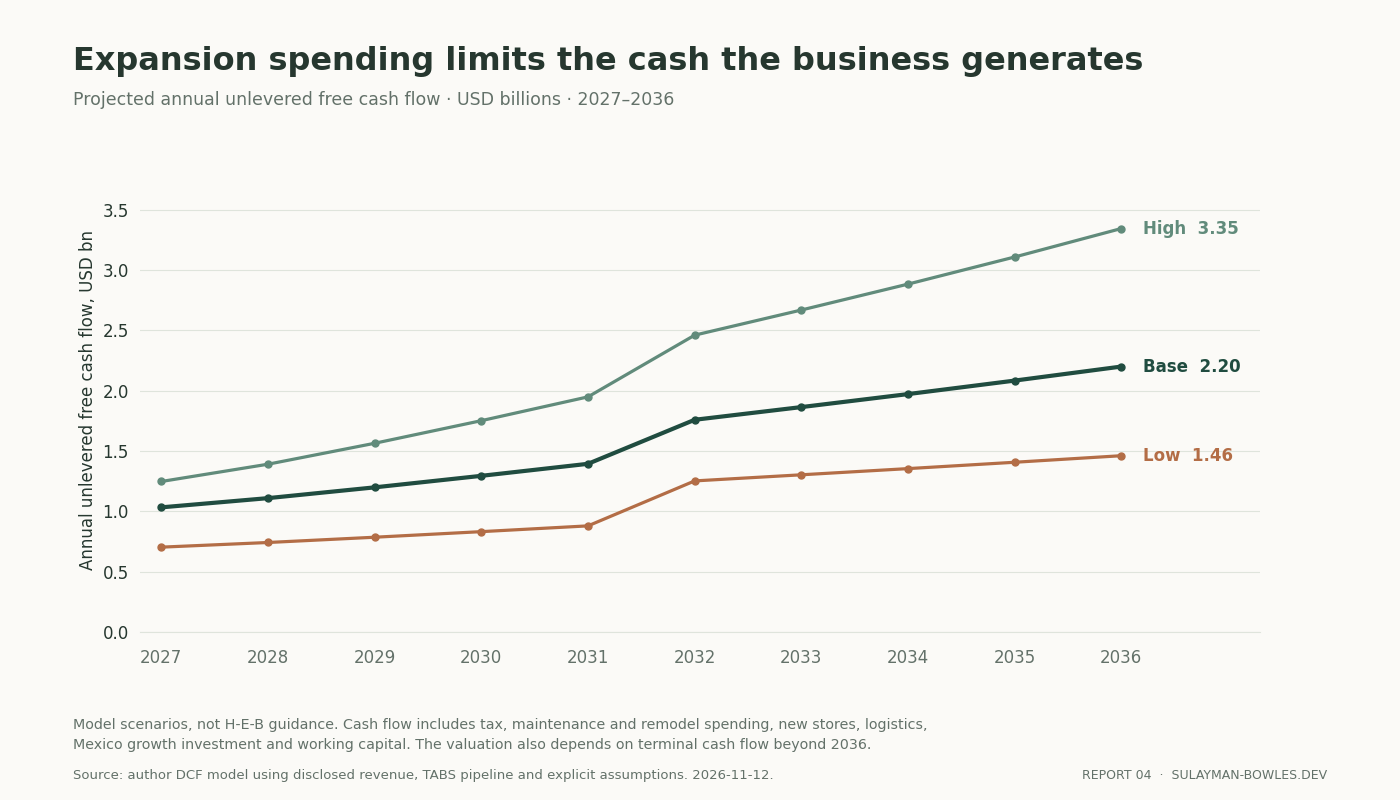
Figure 9. Author forecast after tax, maintenance investment, new stores, logistics, Mexico growth spending and working capital. Each path follows the stated scenario assumptions.
The terminal calculation also pays for growth:
Terminal free cash flow = terminal after-tax operating profit × (1 − growth ÷ return on new capital).
At the base 2.5% growth rate and 8.5% return on new capital, some operating profit must be retained for reinvestment. The discounted value of the explicit forecast is $9.83 billion; the discounted terminal value is $16.76 billion. Together they produce the $26.59 billion DCF. The terminal portion is 63% of that value, making long-run economics a material source of uncertainty.
The discount rate matters more than a flattering growth assumption
| Base operating forecast: DCF value, $bn | Terminal growth 2.0% | 2.5% | 3.0% |
|---|---|---|---|
| Discount rate 7.5% | 31.98 | 32.42 | 32.94 |
| 8.0% | 29.01 | 29.24 | 29.49 |
| 8.5% | 26.51 | 26.59 | 26.67 |
| 9.0% | 24.37 | 24.36 | 24.33 |
| 9.5% | 22.53 | 22.45 | 22.34 |
| 10.0% | 20.92 | 20.80 | 20.65 |
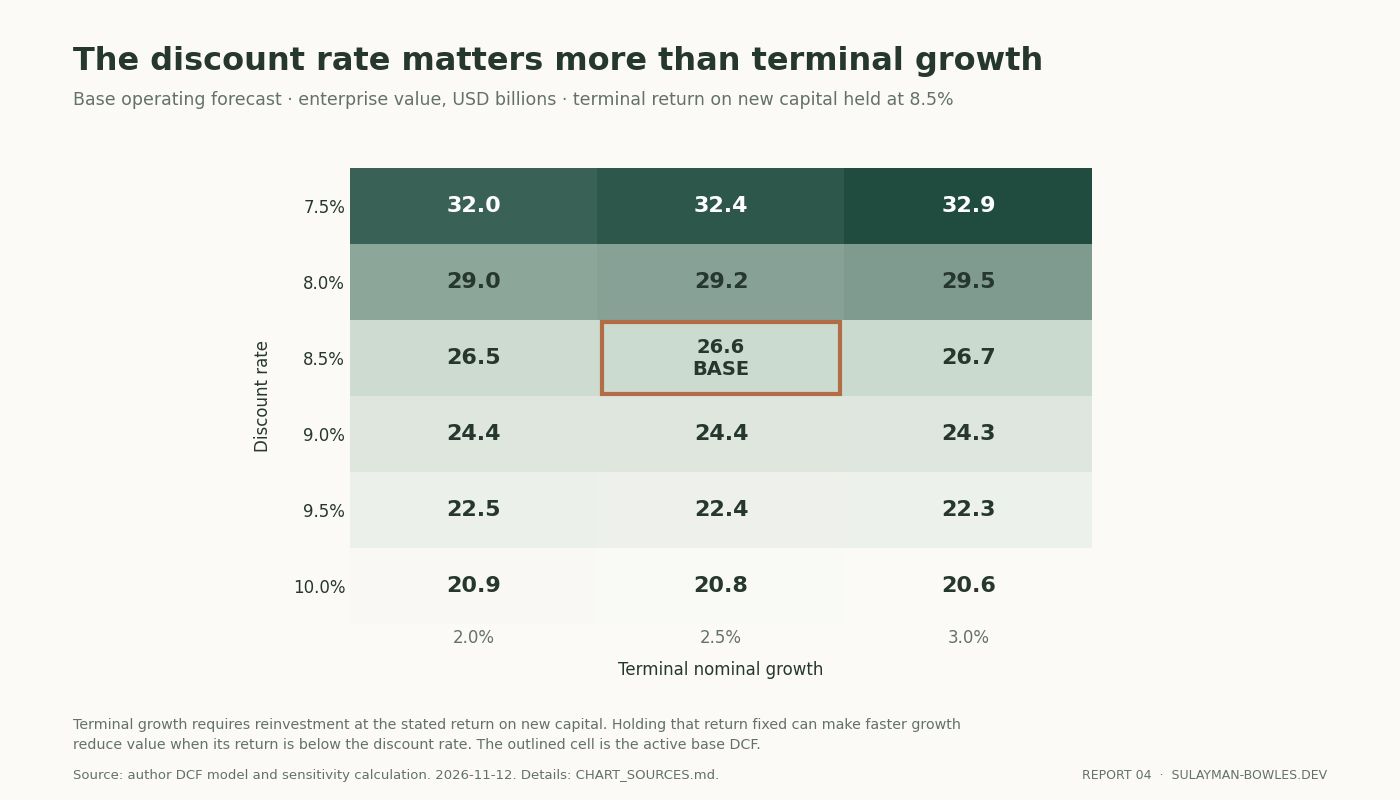
Figure 10. Live model sensitivity. Terminal return on new capital remains 8.5%; the growth assumption therefore changes both future profit and required reinvestment.
The relatively small effect of terminal growth is deliberate. When new capital earns less than the discount rate, faster growth can reduce value. A model that raises perpetual growth without increasing investment can make a low-margin retailer appear much more valuable than its economics warrant.
Holding other base assumptions fixed, changing the terminal return on new capital from 6% to 15% moves DCF value from $23.68 billion to $29.62 billion. The margin assumption is equally consequential: the workbook tests EBITDA margins from 5% to 9% and multiples from 6× to 10×.
Net debt affects shareholders dollar for dollar. At the selected $27.74 billion operating value, $2 billion of net cash would imply $29.74 billion of equity; $6 billion of net financial debt would imply $21.74 billion. Neither balance-sheet position is claimed to be H-E-B’s financial position.
9. Family wealth estimates as a valuation comparison
H-E-B announced its employee ownership plan in November 2015, describing approximately 15% employee ownership over time. That statement does not verify the employee percentage today. Forbes’s 2026 family profile estimates the Butt family owns 87%. The two figures refer to different dates, definitions and evidential standards; the remainder cannot simply be labeled a verified 13% employee stake.ownership, forbes-family
Forbes published a $27.4 billion H-E-B company value in May 2026 and $26.6 billion of whole-family wealth in June. The company-value article does not clearly identify whether its number is enterprise value or equity value. Its proximity to this report’s $27.74 billion operating estimate is interesting, but does not show that the figures measure the same holdings.forbes-value, forbes-family
The arithmetic bridge is transparent. If $27.4 billion were equity value, an 87% family stake would be worth $23.838 billion. The difference from the published $26.6 billion family fortune is $2.762 billion.
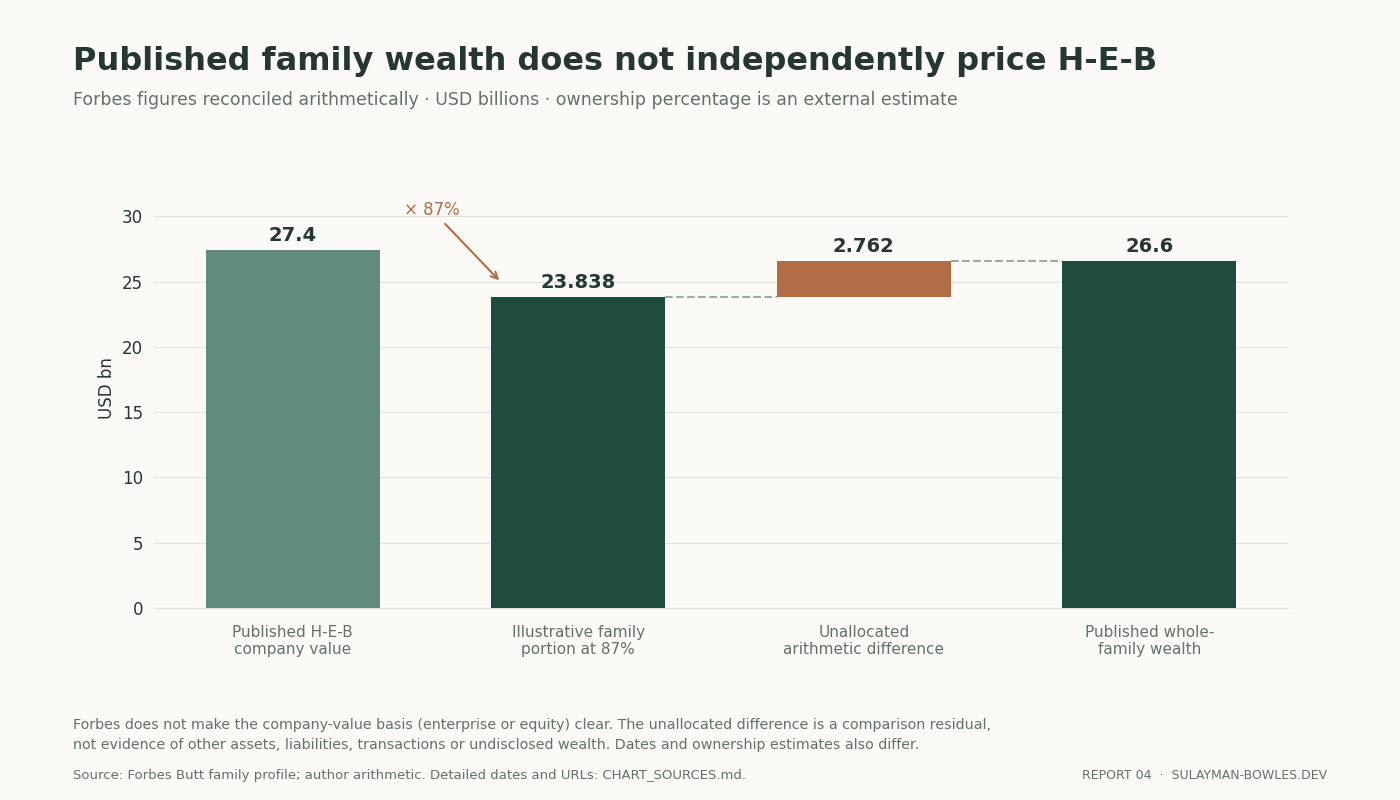
Figure 11. Forbes estimates and author arithmetic. The $2.762 billion bar is an unallocated comparison difference. The records do not identify a particular asset or liability behind it.
Different dates, ownership assumptions and valuation methods can prevent the estimates from reconciling. Other assets and personal financial claims could matter, but the public figures do not provide a complete bridge. The residual should remain unallocated.
Alternatively, dividing $26.6 billion by 87% implies $30.57 billion of company equity, but only under the strong assumption that the entire family fortune consists of that H-E-B stake. It is not an independent appraisal. Individual family-member wealth estimates are subsets of the family total and should not be added on top of it.
Under this report’s illustrative $2 billion net-debt assumption, base equity of $25.74 billion would make an assumed 87% family interest worth $22.39 billion. That does not contradict Forbes: the balance sheet, ownership and other family assets remain unknown. Published wealth cannot fill those gaps by itself. These are whole-company values; they do not price a particular family block or employee share, whose transfer, redemption and voting rights remain unknown.
10. What would change the conclusion?
Evidence on earnings and capital would improve on another rounded revenue estimate.
- A consolidated operating statement. Sustained EBIT below 4% would weaken the base case. Evidence of 6% or better margins, after recurring compensation and ordinary costs, would support the upper cases. Manufacturing benefits need to appear in those consolidated earnings.
- A complete balance sheet and ownership register. These would turn operating value into an equity estimate and clarify the family and employee interests. A $1 billion net-debt correction changes equity by $1 billion.
- A measured, classified store census. Gross area, format, opening date and sales by unit would resolve the largest physical-revenue uncertainties. The required $1,328 main-business sales density is a cross-check against such data.
- Completed-project investment and mature sales. Land, construction, equipment, opening costs, confirmed opening dates and cannibalization would show whether the $55 million / $120 million base-store economics are reasonable. Filed TABS budgets alone cannot answer this.
- Evidence on share gains and reinvestment. The DCF requires new stores to add group sales beyond Texas market growth. A slower ramp, greater cannibalization or a further logistics program would reduce free cash flow. Better cash returns on new capital would raise it.
The three headline numbers each have a cross-check. The $51.6 billion revenue estimate is challenged by the $47.4 billion physical estimate and $50.2 billion spending estimate. The $3.61 billion EBITDA estimate is tested against filing-derived peer margins, but remains unobserved at H-E-B. The $27.74 billion operating value is compared with a $27.06 billion result at Publix’s operating EBITDA multiple. Forbes provides an additional published value, with an unresolved valuation basis.
An independent calculation reproduced the model’s headline outputs and all annual forecasts: 844 numeric comparisons passed, including 780 forecast-field comparisons. A peer review checked 144 financial calculations. The independent calculation reproduces the arithmetic. H-E-B’s undisclosed financial figures remain unknown.
The evidence supports a large, valuable regional grocery business with credible expansion opportunities and substantial capital requirements. About $28 billion for the operations is the most defensible central answer; $17–48 billion describes how much the answer changes when the unknown economics change. A precise family-equity figure must wait for information that public revenue rankings, store openings and county records cannot provide.
Data and model notes
The workbook organizes source inputs, editable assumptions, formula calculations, outputs and reconciliations. Its active-case column updates from the scenario selector; the adjacent low/base/high comparison columns are explicitly labeled saved recalculations. The downloads include the Excel model, raw CSVs and PNG charts with their plotted data.
Historical peer inputs contain three annual observations per company, tied to the latest relevant annual filings and restatements. Current trailing values bridge those annual statements to the latest available interim statements. H-E-B’s Forbes list-year history is reported apart from filing-derived financial history. All public-source access was read-only; no paid information or private requests were used.
Sources and footnotes
All sources below were checked for this report as of November 12, 2026. Page references refer to printed document pages where available; otherwise the named statement, section or record field is the locator. The downloadable source index provides row-level links and qualifications.
- H-E-B, presidential transition announcement, September 30, 2025, article-body section on Boyan’s leadership; and DFW newsroom, current “Our Story” description. The former is dated body text; the latter is current, changeable boilerplate. Source-index HEB01–02. ↩
- Forbes, Butt family profile, June 29, 2026: headline wealth and “From the Editor” bullets for estimated ownership and fiscal 2025 revenue. These revenue estimates come from the publishers. HEB03, HEB05–06. ↩
- Bexar CAD, property 1207614, 2026 “Values” and “Improvement / Building,” updated November 6; Travis CAD, public property search, 2026 PIDs 869784 and 346133, fields
name,landValue,improvementValue,marketValue; Harris County, HCAD parcel service, accounts 1378470010004, 1342080010001, 1065710000001, 2026 owner/value fields. Area source: Houston Water’s HCAD mirror,Total_Building_AreaandTax_Year; area-measurement vintage is unknown. Exact query URLs, parcel rows and exclusions are inproperty_sample.csvand the source index. ↩ - Publix, 2025 Form 10-K, signed March 2, 2026, year ended December 27, 2025: properties pp. 7–8; earnings and cash flows pp. 21, 23–24; segment and benefit-plan notes. The 67.8 million square feet are gross store area. Peer input rows use the original USD-million units. ↩
- Placer.ai, Grocery Trends 2023, June 1, 2023, discussion of H-E-B and small formats. Its roughly 50,000-square-foot description is a market-research description of the format. ↩
- Placer.ai, H-E-B Outpaces a Resilient Grocery Category, September 30, 2026, “More Stores, Busier Aisles,” January–August year-over-year comparison. MAC11–12. Location-data estimates are not company financial disclosures. ↩
- BEA, Personal Consumption Expenditures by State, September 30, 2026 release; series TXPCEFOOD via FRED, 2025 observation 138,861.8 million dollars. MAC01; the 2026 advance is an author calculation. ↩
- Census Bureau, state estimates, January 27, 2026, and Texas QuickFacts, Vintage 2025; metro estimates, March 26, 2026, Table 10. MAC02–07. Population dates are July 1, 2024 and July 1, 2025. ↩
- H-E-B, Central Market renovation, March 26, 2024, current “About Central Market” count; Joe V’s expansion, July 13, 2026, current count near article end; Texas Mi Tienda locations, two named locations. HEB09–13. Current description dates are distinguished from original article dates. ↩
- H-E-B Mexico, official annual-report page and 2025 annual report, PDF last-modified April 27, 2026, printed p. 8 (62 H-E-B, 25 Mi Tienda, one fulfillment center), p. 21 (private label); Narro opening, October 7, 2026, body dated October 6. The 91 physical-store count is an inference. ↩
- H-E-B Mexico, 2024 annual report, June 2025 upload directory, printed p. 4, president’s message. Sales are stated as more than MXN66 billion; the model preserves that lower-threshold interpretation. ↩
- Federal Reserve, G.5A annual exchange rates, January 5, 2026, “MEXICO PESO,” 2024 column. Translation uses the annual-average exchange rate. ↩
- Kroger, 2025 Form 10-K, signed March 31, 2026, year ended January 31, 2026, pp. 33–35 (margin and adjusted FIFO reconciliation), pp. 55, 57 (statements). The latest filing supplies the three historical annual observations used. ↩
- Albertsons, 2025 Form 10-K, signed April 27, 2026, year ended February 28, 2026, pp. 35, 38–40 and 54–57; adjusted EBITDA reconciliation and statements. Fiscal 2025 has 53 weeks. ↩
- Sprouts, 2025 Form 10-K, signed February 19, 2026, year ended December 28, 2025, “Results of Operations,” statements of income and cash flows, Note 3 cost classification. D&A uses the total cash-flow addback. ↩
- Weis, 2025 Form 10-K, signed March 12, 2026, year ended December 27, 2025, income and cash-flow statements and restatement note. Earlier years use the restated figures. ↩
- Ingles, 2025 Form 10-K, signed November 26, 2025, year ended September 27, 2025, income/cash-flow statements, Helene discussion and Note 11. Revenue includes consolidated rental and dairy activities. ↩
- Walmart, 2026 Form 10-K, signed March 13, 2026, year ended January 31, 2026, pp. 77–78, Note 11 and Walmart US discussion. All comparison figures cover Walmart’s U.S. segment. ↩
- The business/properties sections in the Kroger, Albertsons, Publix, Weis and Ingles annual filings above describe their manufacturing operations. H-E-B’s manufacturing careers page, current as accessed, confirms its integrated production activities but does not disclose consolidated manufacturing profit. HEB23. ↩
- Publix, third-quarter results and stock price, November 2, 2026, final stock-price paragraph; price effective November 1. ↩
- Publix, September 26, 2026 Form 10-Q, signed November 2: cover share count dated October 15, condensed balance sheets, earnings and cash flows. Trailing calculations add current year-to-date and subtract comparative year-to-date figures from the 2025 annual statements. ↩
- Latest interim primary documents: Kroger, September 18, 2026, period August 15; Albertsons, October 20, period September 12, and earnings reconciliation, October 13; Sprouts, October 28, period September 27; Weis, November 5, period September 26; Ingles, August 6, period June 27. Locators: cover share counts, balance sheets, operations, cash flows and debt/lease notes. Kroger adjusted EBITDA also uses its September 11 release, Table 5. November 11 quotes: Kroger issuer; secondary ACI, SFM, WMK, IMKTA. The IMKTA display is timestamped 3:59 p.m. ET. The official closing print was not verified. Exact-date primary confirmation for those four secondary quotes is UNKNOWN; documented access checks are included. ↩
- TDLR TABS “Project Details” records: Robson Ranch, Hillcrest, Oakmont, Royse City, West University, Carrollton, Walsh Ranch. Fields: estimated cost, square footage, scope, start and completion dates. Retrieved November 12, 2026; registration dates and accessory-project URLs are in
tdlr_projects.csvandtdlr_accessory_projects.csv. ↩ - Hillwood, Landmark shopping and dining, current H-E-B opening description; H-E-B, Edwards Ranch/Oakmont announcement, October 2, 2026, opening-timing paragraph. Neither a past TABS completion date nor this forward guidance proves that a store opened. ↩
- H-E-B, planned $700 million supply-chain expansion, May 19, 2026, article body. HEB24–25 distinguish the new plan from already-invested Foster Road amounts. ↩
- H-E-B, employee stock-plan announcement, November 2, 2015, second body paragraph. The approximately 15% statement describes an ownership plan over time. Current ownership percentages remain unverified. ↩
- Forbes, America’s Most Valuable Private Family Businesses 2026, May 14, updated May 18, 2026, entry 9, H-E-B. Published company-value estimate; the article does not clearly specify enterprise versus equity value. ↩
Supporting material
- Excel model ↗Sourced inputs, live calculations and reported outputs.
- Source and model data (CSV collection) ↗Data tables, source references and calculation exports.
- Source index ↗Download as CSV.