Texas public finance
What are the Permanent University Fund’s 2.1 million acres worth?
The West Texas land is worth $15.8 billion in the base case, versus the $11.1 billion land value reported by the UT System.
Research cutoff: November 12, 2026. All dollars are U.S. dollars. University Lands fiscal years end August 31; listed-company trailing results end September 30, 2026. Market prices are November 11 closing prices.
If the Permanent University Fund’s University Lands were a debt-free, taxable listed company, this report’s base estimate is $15.8 billion. The low and high scenarios are $4.9 billion and $36.7 billion. The latest UT System disclosure carries the land at $11.06 billion as of August 31, 2026. The base estimate is therefore $4.74 billion, or 42.8%, above that carrying value.1
That is a meaningful difference, but it does not show that the accounts omit a vast undeveloped estate. UT’s valuation already includes a third-party assessment of proved, probable and possible oil and gas reserves, discounted at 10%, plus a comparable-acreage valuation of surface rights. The difference here comes from explicit assumptions about commodity prices, future recovery, drilling speed, taxes and surface cash flow. The latest completed annual audit located is FY2025; its land figure was $10.63 billion. The newer $11.06 billion figure comes from the monthly disclosure. The FY2026 audit was not available.2
| Estimated value, $ billion | Low | Base | High |
|---|---|---|---|
| Taxable listed-company asset value | 4.86 | 15.81 | 36.68 |
| Same operating case under continued PUF ownership | 6.52 | 21.32 | 49.58 |
| Listed value per student across both systems | $10,901 | $35,464 | $82,299 |
The public-owner comparison matters because the existing state-owned mineral interests have tax exemptions that a hypothetical corporation would not automatically inherit. Removing both modeled tax charges raises the base value to $21.3 billion. This is the value of the same assumed cash flows under a different ownership regime. Adding it to the listed-company estimate would count the cash flow twice.3
Three findings support the opening answer. First, the estate generated $2.058 billion of land-related cash receipts in FY2026, a large operating base independently traceable to Texas Treasury records. Second, mineral-peer cash-flow multiples imply roughly $15.4–17.7 billion including the surface business valued on its own, close to the base discounted-cash-flow result. Third, 68.7% of base mineral value comes from future development. The valuation rests heavily on wells that are not yet producing. The low/high range expresses different operating assumptions; it is not a statistical confidence interval.
1. Twelve years of cash show a large, cyclical royalty business
University Lands manages the PUF’s mineral and surface interests across 19 West Texas counties. Its economics begin with royalty ownership: operators fund and operate the wells, while the landowner receives the contractual royalty. Surface agreements produce additional receipts from access, pipelines, power lines, water, grazing, renewables and other uses.4
The most complete consistent historical financial series comes from the Texas Comptroller. The raw extract contains 317 fund/object/year observations spanning FY2000–FY2026, including 144 observations for the twelve-year FY2015–FY2026 analysis. It preserves the original fund codes and groups them into economic categories. The table below shows cash collected, rounded only for display. It excludes the investment portfolio’s AUF distribution and Treasury investment interest.
| Fiscal year | Oil royalties, $m | Gas/NGL royalties, $m | Bonus/rent, $m | Surface/associated, $m | Total receipts, $m |
|---|---|---|---|---|---|
| 2015 | 612.7 | 147.2 | 17.6 | 78.7 | 856.3 |
| 2016 | 371.9 | 90.2 | 38.4 | 56.6 | 557.2 |
| 2017 | 461.9 | 140.6 | 84.3 | 60.8 | 747.7 |
| 2018 | 716.5 | 178.5 | 138.6 | 87.6 | 1,121.2 |
| 2019 | 824.9 | 160.7 | 38.9 | 110.9 | 1,135.3 |
| 2020 | 677.2 | 90.0 | 3.8 | 78.0 | 849.0 |
| 2021 | 808.2 | 166.6 | 4.4 | 64.0 | 1,043.2 |
| 2022 | 1,556.1 | 421.2 | 147.2 | 96.0 | 2,220.5 |
| 2023 | 1,484.0 | 301.5 | 78.9 | 121.3 | 1,985.7 |
| 2024 | 1,582.4 | 213.3 | 54.5 | 126.6 | 1,976.9 |
| 2025 | 1,412.6 | 238.4 | 68.1 | 142.6 | 1,861.7 |
| 2026 | 1,572.0 | 233.3 | 74.8 | 178.3 | 2,058.4 |
Bonus/rent is the mineral amount remitted to the PUF. AUF exploration permits remain in surface/associated income, alongside fees and land-related interest. The raw CSVs preserve individual categories, fund codes and exact dollars.5
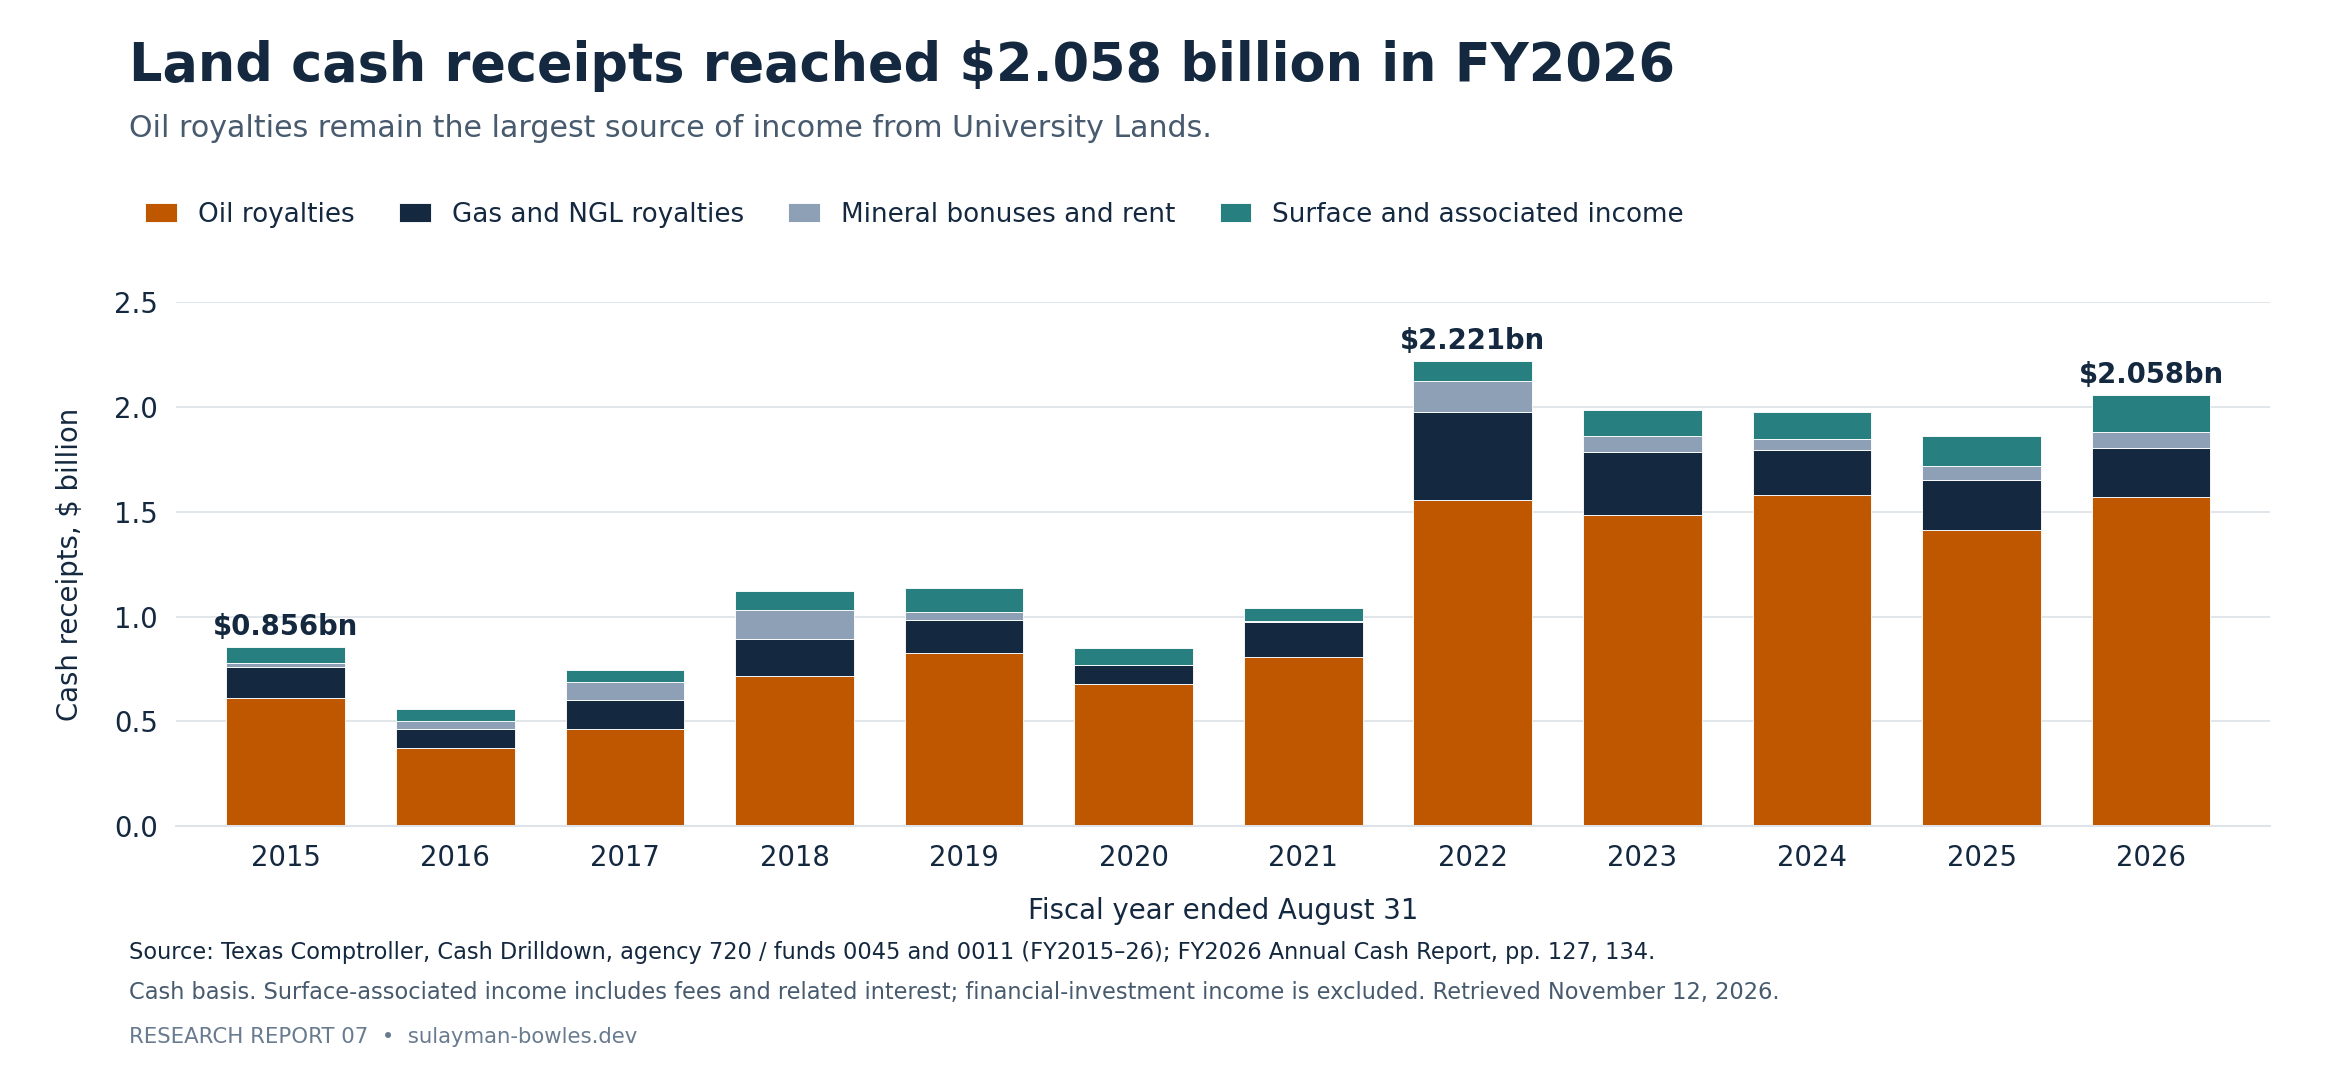
The pattern is clear without fitting a trend line through a commodity cycle. Total receipts fell to $557 million in FY2016, exceeded $2.22 billion in FY2022, and reached $2.058 billion in FY2026. Oil is the principal cash source. Gas and NGL receipts provide a meaningful second stream, while bonuses fluctuate with leasing activity. A single peak year would be a poor permanent earnings assumption.
FY2026 contains $1.572 billion of oil royalties, $233.3 million of gas/NGL royalties, $74.8 million of mineral bonuses and rentals, and $178.3 million of surface and associated receipts. The four mineral receipt codes sum to $1,880,104,395.71. Adding the surface categories gives $2,058,419,753.63. These totals are independently recoverable from the Comptroller’s query system and its November 2, 2026 annual cash report, printed pages 127 and 134.6
The fund receiving some categories of cash changed within this history. Water, damages and sand/gravel receipts entered the PUF in earlier years, including $29.119 million in FY2015 and $11.785 million in FY2016. Treating every PUF remittance as an oil-and-gas royalty would misclassify those receipts. The workbook keeps the economic category alongside the fund receiving the money.
Audited PUF statements provide a second check. FY2025 Treasury mineral receipts match audited PUF land contributions within $29.95, less than the audit’s $1,000 reporting precision. The annual reconciliation preserves two exceptions: FY2018 and FY2019 have approximately equal and opposite differences of $1.69 million, offsetting to within $502.23 combined. Remittance timing is a plausible explanation, but the retrieved documents do not resolve it. The differences appear in the table.7
Cash flow and production cannot simply be multiplied back into each other using rounded annual-report prices. Receipt timing, volume recognition and rounded realized prices differ. The model uses physical production to forecast future royalty economics, while the Treasury series checks the scale and cyclicality of cash collections.
2. A royalty acre needs a denominator—and a location
The familiar comparison, “UT owns 2.1 million acres; TPL owns less land,” skips the most important unit conversion. A surface acre, a fee-mineral acre and a fractional royalty acre represent different rights. This report standardizes royalty acreage to a one-eighth royalty interest:
NRA_(1/8)=gross acres × mineral ownership fraction × (lease royalty) / (0.125).
For example, 640 acres of wholly owned minerals leased at 25% equal 1,280 NRA at one-eighth, 640 NRA at one-quarter, or 160 NRA at 100%. The economic interest is unchanged. For a fixed nonparticipating royalty, its fixed fraction replaces the ownership-times-lease-royalty term.
TPL’s FY2025 property table already supplies the conversion: 5,308 NRA associated with its original 1/128 interests, 185,369 NRA associated with its original 1/16 interests, and 33,380 acquired NRA. The total is 224,057 NRA at one-eighth. Using its rounded gross-acre descriptions instead introduces avoidable rounding error.8
Viper uses another convention. Its November 2026 presentation reports 98,098 NRA at a 100% royalty denominator. The comparable one-eighth number is:
98,098 ÷ 0.125=784,784 NRA_(1/8).
Failing to make that conversion would make Viper appear much smaller relative to TPL than its economic interest is.9
For University Lands, the county map sums to 2,104,773 physical acres. Applying FY2025’s 21.25% reported average oil, gas and NGL royalty to all mapped surface acres, treating them as 100% mineral-owned even where unleased gives an illustrative conversion:
2,104,773 × (21.25%) / (12.5%)=3,578,114 NRA_(1/8).
This proxies contractual net royalty acres. A production-weighted royalty is not an acreage-weighted lease schedule. The calculation also includes unleased acreage. County-level mineral ownership, active lease fractions, depth limitations and royalty burdens would be needed for a proper contractual inventory. Those details remain UNKNOWN in the public material assembled here.
For geography, the report applies the same published Viper core-county screen to both estates. It covers specified Midland and Delaware basin counties; the exact list and county rows are in the workbook. The screen groups tracts by county. Drilling economics can vary on either side of that boundary.9
| Common county screen | UL physical acres | UL illustrative NRA at 1/8 | TPL reported NRA at 1/8 |
|---|---|---|---|
| Core Permian county proxy | 720,949 | 1,225,613 | 210,347 |
| Other counties | 1,383,824 | 2,352,501 | 13,710 |
| Total | 2,104,773 | 3,578,114 | 224,057 |
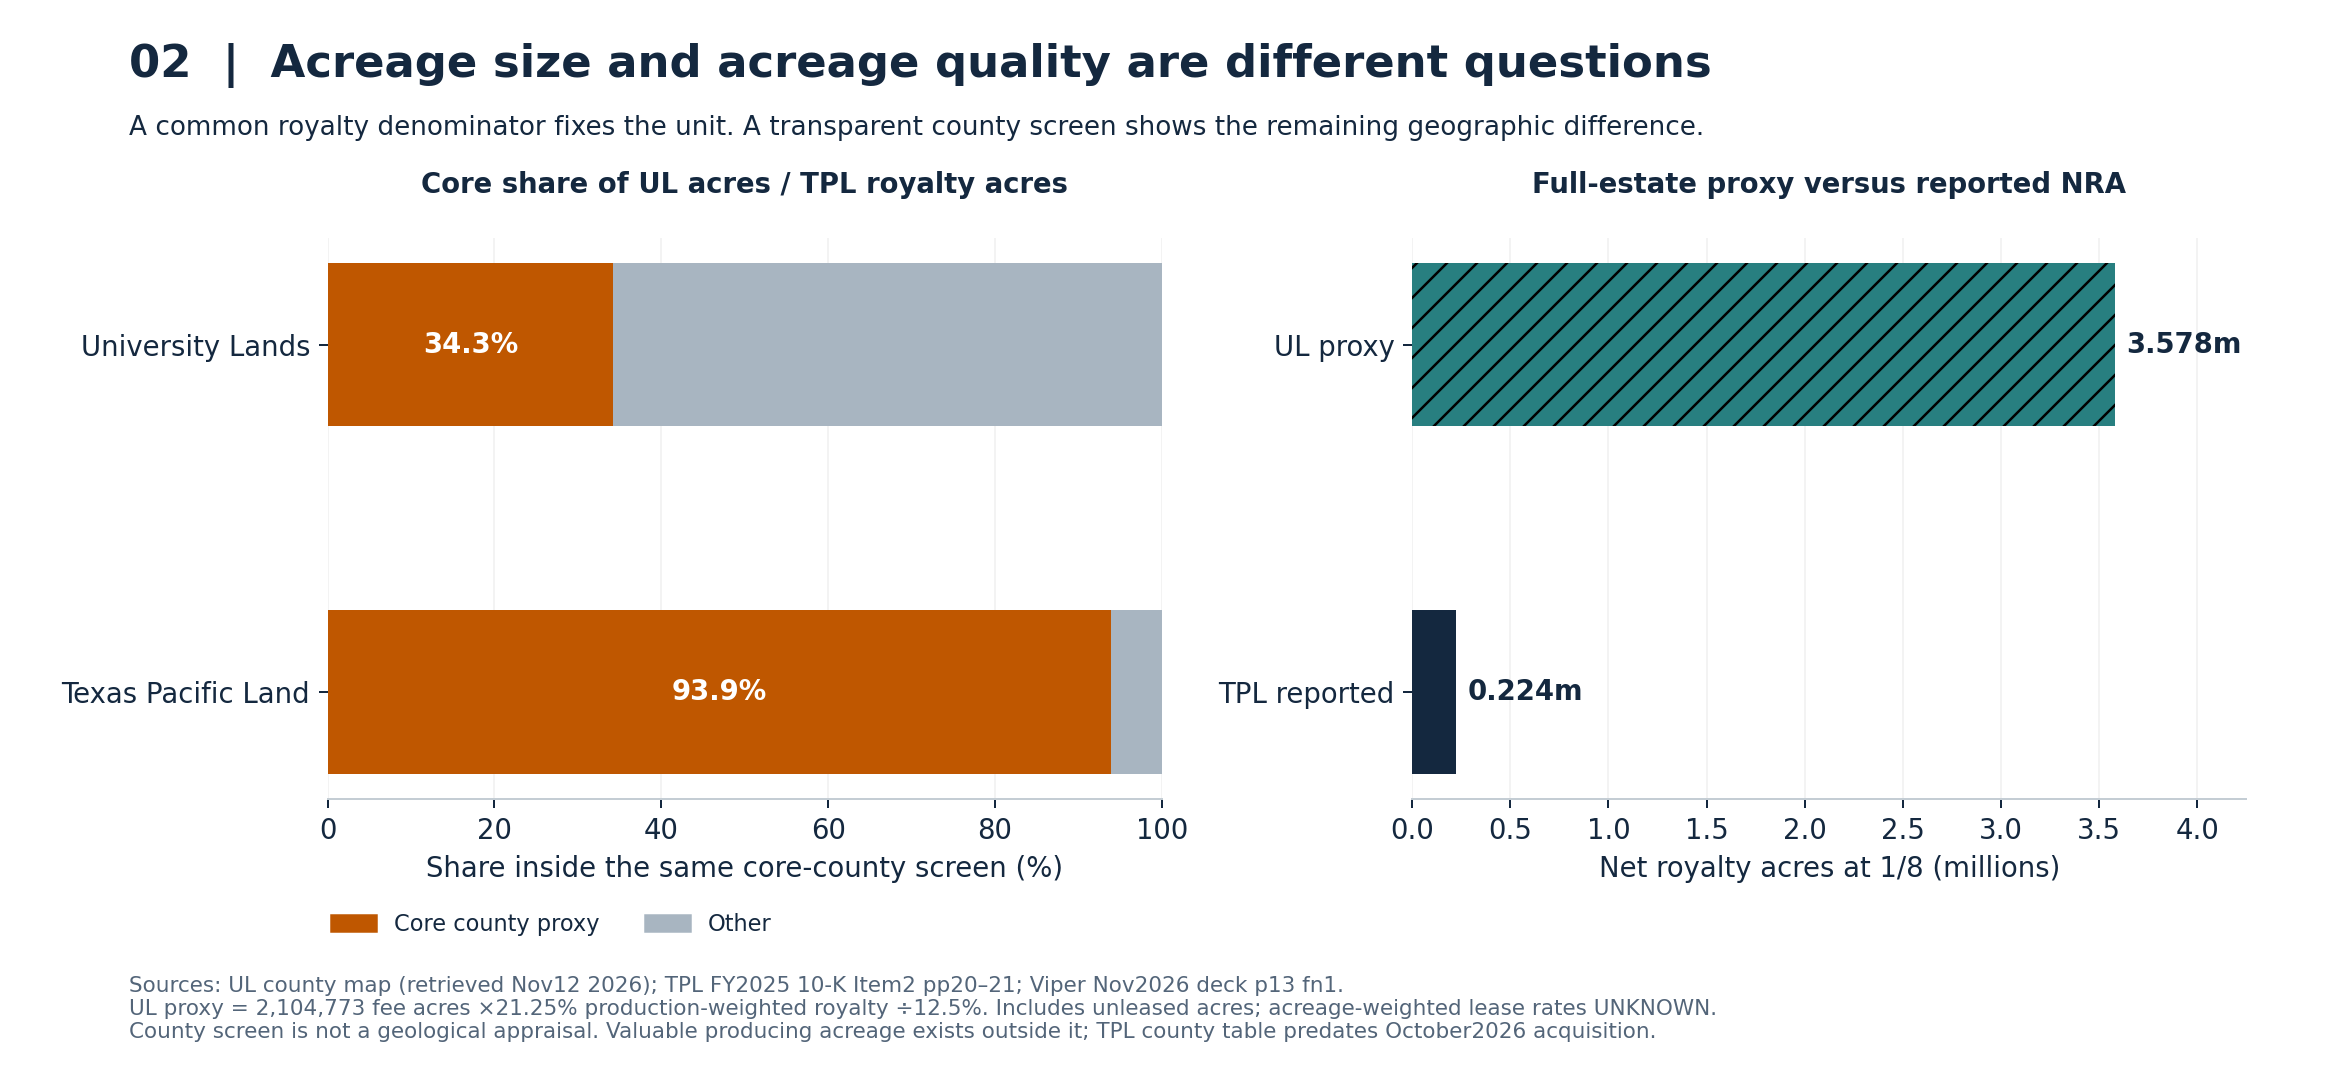
Only 34.3% of UL physical acreage falls within that screen, compared with 93.9% of TPL’s disclosed royalty acreage. UL’s large Hudspeth position helps explain the difference. TPL’s county table is dated December 31, 2025; its later acquisitions mean the comparison uses the stated date. A November 2026 tract census would need updated records.
Railroad Commission data reinforce the difference in geography. In July 2026, the latest county-ranking release located, the core-screen counties supplied 87.5% of oil-plus-condensate production across UL’s 19 counties. Hudspeth and El Paso reported zero production in that month. These are all-owner county totals: allocating them to UL in proportion to acreage would invent ownership and productivity information. RRC also explains that Texas oil production is generally reported at the lease level, which can combine wells.10
The practical conclusion is that acreage normalizes legal exposure; it does not normalize rock quality, remaining inventory, infrastructure or drilling timing. A large fee estate can contain many more theoretical royalty acres while generating a lower price per acre.
3. Production has grown, but the published series has breaks
The physical starting point is FY2025, the latest University Lands annual operating report located. It reports net royalty volumes of 20.120 million oil barrels, 46.086 billion cubic feet of gas, and 7.468 million NGL barrels. At six Mcf per BOE:
20.120+46.086/6+7.468=35.269 million net BOE.
The NGL row’s printed “BBL” unit is inconsistent with the total unless the displayed figure is interpreted as thousands of barrels. That interpretation is an explicit inference, supported by the BOE identity. It is preserved in the sourced input notes.11
| Fiscal year | Net oil, million barrels | Net BOE, millions | Unique leased acres, millions | Producing wells | Wells put on production |
|---|---|---|---|---|---|
| 2019 | 14.973 | 23.662 | UNKNOWN | UNKNOWN | UNKNOWN |
| 2020 | 14.854 | 23.194 | 1.30 | 10,000 | 190 |
| 2021 | 15.362 | 23.321 | 1.24 | 9,800 | 220 |
| 2022 | 17.505 | 26.581 | 1.24 | 10,200 | 229 |
| 2023 | 17.879 | 30.504 | 1.24 | 11,400 | 262 |
| 2024 | 19.962 | 33.754 | 1.30 | 11,500 | 291 |
| 2025 | 20.120 | 35.269 | UNKNOWN | 10,300 | 307 |
Older BOE figures combine gas and NGLs differently. FY2023’s 30.504 million BOE is the later restatement. Leased acres and producing-well figures are rounded disclosures; blank cells are UNKNOWN.12
Net oil barrels provide the cleanest longer comparison: they rose from 14.973 million in FY2019 to 20.120 million in FY2025. The total-BOE series is less uniform. FY2024 reporting broke out NGL barrels and restated FY2023 from 27.179 million to 30.504 million BOE. That reporting change must not be interpreted as physical production growth.
The acreage and well series require similar care. FY2024 reported about 1.3 million acres leased for mineral development. FY2025 instead reports 3.3 million contract-equivalent acres, explicitly allowing multiple contracts over one surface acre. It does not show that physical leased acreage more than doubled. The cumulative drilled-well count also changes from about 27,000 in FY2023 to 23,600 in FY2024 without a reconciled explanation in the retrieved reports. It would be unsound to infer thousands of abandonments from that difference.
For earlier years, the evidence consists of dated snapshots with gaps between observations: 494 wells drilled in FY2015, 9,943 producing wells in October 2016, and a stated 313 wells drilled in 2017. The 2017 regional figures sum to 306, leaving an unexplained difference of seven. These observations have their own entries. A consistent ten-year series for every requested operating field could not be assembled; the financial history is complete for twelve years, and the physical gaps remain visible.13
Decline curves explain why new drilling matters even when annual estate production rises. Two UL-linked RRC lease histories illustrate the point. Oil production on University 217D fell from 17,840 barrels in June 2024 to 2,255 in June 2025, 87.4%. War University 18 22/24A fell from 50,983 barrels in April 2023 to 12,840 in April 2024, 74.8%. Each comparison starts in the month after first positive reported production; monthly totals alone do not prove a full operating month.14
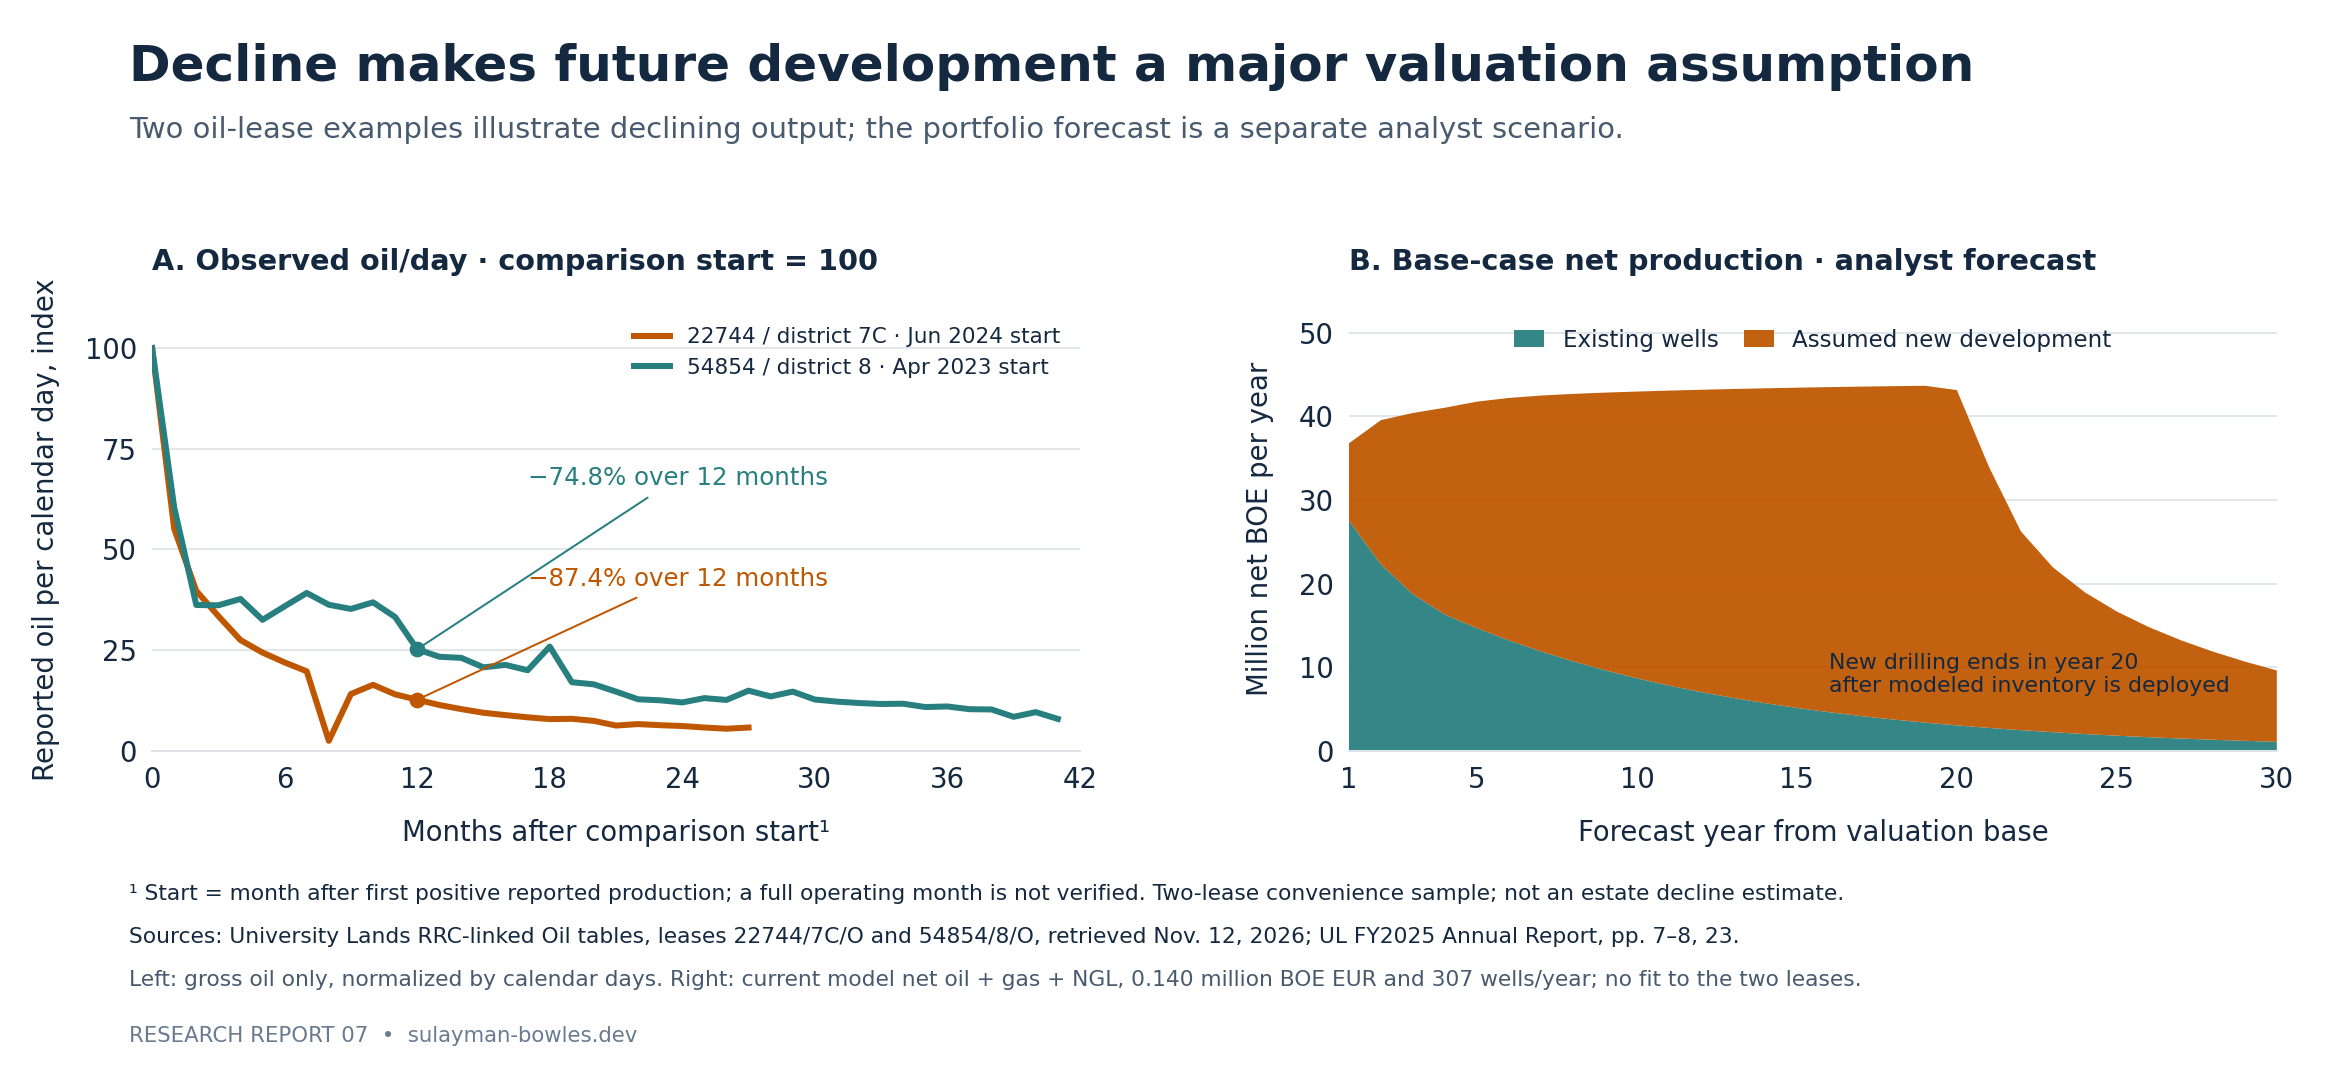
These two readily identifiable leases illustrate decline. An estate-weighted reserve study would need a larger representative sample. Their gross oil declines do not directly calibrate UL’s net-BOE portfolio decline. A mature portfolio blends old and new wells, different benches, royalty fractions and products. The model therefore uses an explicit portfolio assumption and its own new-well type curve, with the illustrative observations serving as a warning against capitalizing today’s production forever.
4. The discounted-cash-flow estimate makes future drilling explicit
The mineral model has two parts: cash from the existing production base and cash from future development. It limits total recovery, schedules new wells, applies a declining production profile, deducts owner expenses and hypothetical corporate taxes, and discounts annual cash. There is no perpetual oil-and-gas terminal value. The first forecast cash flow is discounted one full year from the valuation point; the FY2027 label is an annual-period approximation.
The FY2025 report gives 425 million net BOE of proved reserves and 1.728 billion net BOE of total resource. The report does not provide a public location-by-location development plan or a complete proved-developed versus proved-undeveloped reconciliation. This model assumes the proved amount is included in the total resource; it does not add 425 million to 1.728 billion.11
The base admits 65% of total reported resource, then subtracts 35.269 million BOE as a one-year depletion allowance between the operating report and valuation period:
1,728 × 65%-35.269=1,087.931 million net BOE.
The depletion allowance is an estimate because FY2026 physical production is not yet available in the annual operating series. No reserve additions are credited. Maintaining the FY2025 production rate as the current run rate is also an assumption, editable independently in the workbook.
| Decisive assumption | Low | Base | High |
|---|---|---|---|
| Oil realization, $/barrel | 55 | 75 | 95 |
| Gas realization, $/Mcf | 1.00 | 1.75 | 2.50 |
| NGL realization, $/barrel | 18 | 25 | 30 |
| Nominal discount rate | 12% | 10% | 8% |
| Resource admitted before depletion, million BOE | 425.0 | 1,123.2 | 1,728.0 |
| Recovery after depletion, million BOE | 389.731 | 1,087.931 | 1,692.731 |
| Initial existing-production decline | 30% | 22% | 16% |
| New well equivalents per year | 180 | 307 | 400 |
| Net recovery per new well, million BOE | 0.120 | 0.140 | 0.200 |
| Initial development delay, years | 2 | 0 | 0 |
| Lease bonus per new well equivalent, $million | 0.06 | 0.10 | 0.15 |
The model holds nominal realized prices constant. They differ from EIA’s November 10, 2026 outlook, which forecasts 2027 WTI at $80.54/barrel and Henry Hub gas at $2.88/MMBtu. Henry Hub uses an energy unit; the model’s gas realization uses a volume unit, dollars per Mcf. Local pricing also differs from the benchmark. An earlier 2026 oil forecast would be stale for this research cutoff.15
Existing production declines initially at the scenario rate, with the decline rate easing by three percentage points a year to 10%. The base existing-production schedule consumes 230.953 million BOE, leaving 856.978 million BOE for new development. At 0.140 million net BOE per well, that is 6,121 modeled well equivalents, deployed over approximately 20 years at the assumed pace. They are not disclosed, permitted or scheduled locations.
New-well recovery follows a monthly hyperbolic curve with b = 1 and initial nominal decline of 3.0 per year, switching to exponential decline at an effective annual rate of 10%. Each well has a 30-year life. Midyear completions spread that life across 31 fiscal-year bins. This follows the broad structure of EIA’s published decline methodology, while the selected parameters remain analyst assumptions.16
A simple historical check helps discipline the base EUR. Combining FY2024 and FY2025 volumes, the assumed 22% legacy decline, and 307 completions implies about 0.135 million net BOE per well under the model’s timing convention. The selected 0.140 is approximately 3.8% higher. It produces first-year growth of 4.3%, close to FY2025’s reported 4.5%. This is a rough consistency check; unknown start dates and vintage-level production prevent a reserve-engineering conclusion.
At base prices, the observed product mix yields $50.366 per net BOE. The forecast keeps FY2025’s oil/gas/NGL mix constant. The listed-company case deducts an estimated 7% production/property tax burden, $0.85 per net BOE of mineral management expense, and 21% corporate income tax. The 7% assumption is consistent in scale with Viper’s guidance, but it is not a uniform Texas statutory rate. The public-owner case removes both tax charges because the existing state interests have exemptions.3, 9
The corporate model assumes no depletion deduction or transaction-related tax-basis step-up; Texas franchise-tax and detailed tax-structure effects are not modeled individually. Owner expense models a standalone company. The UL segment cost remains undisclosed. Operators’ drilling capital belongs in their own economics, so the royalty model does not charge it again to the landowner. Operator willingness to drill is reflected in recovery, timing and discount assumptions.
Bonus income is an explicit estimate tied to new-well equivalents. Many new wells on leases held by production will not generate new bonuses. Removing all modeled base bonuses would reduce value by about $206 million, much less than the uncertainty surrounding future production.
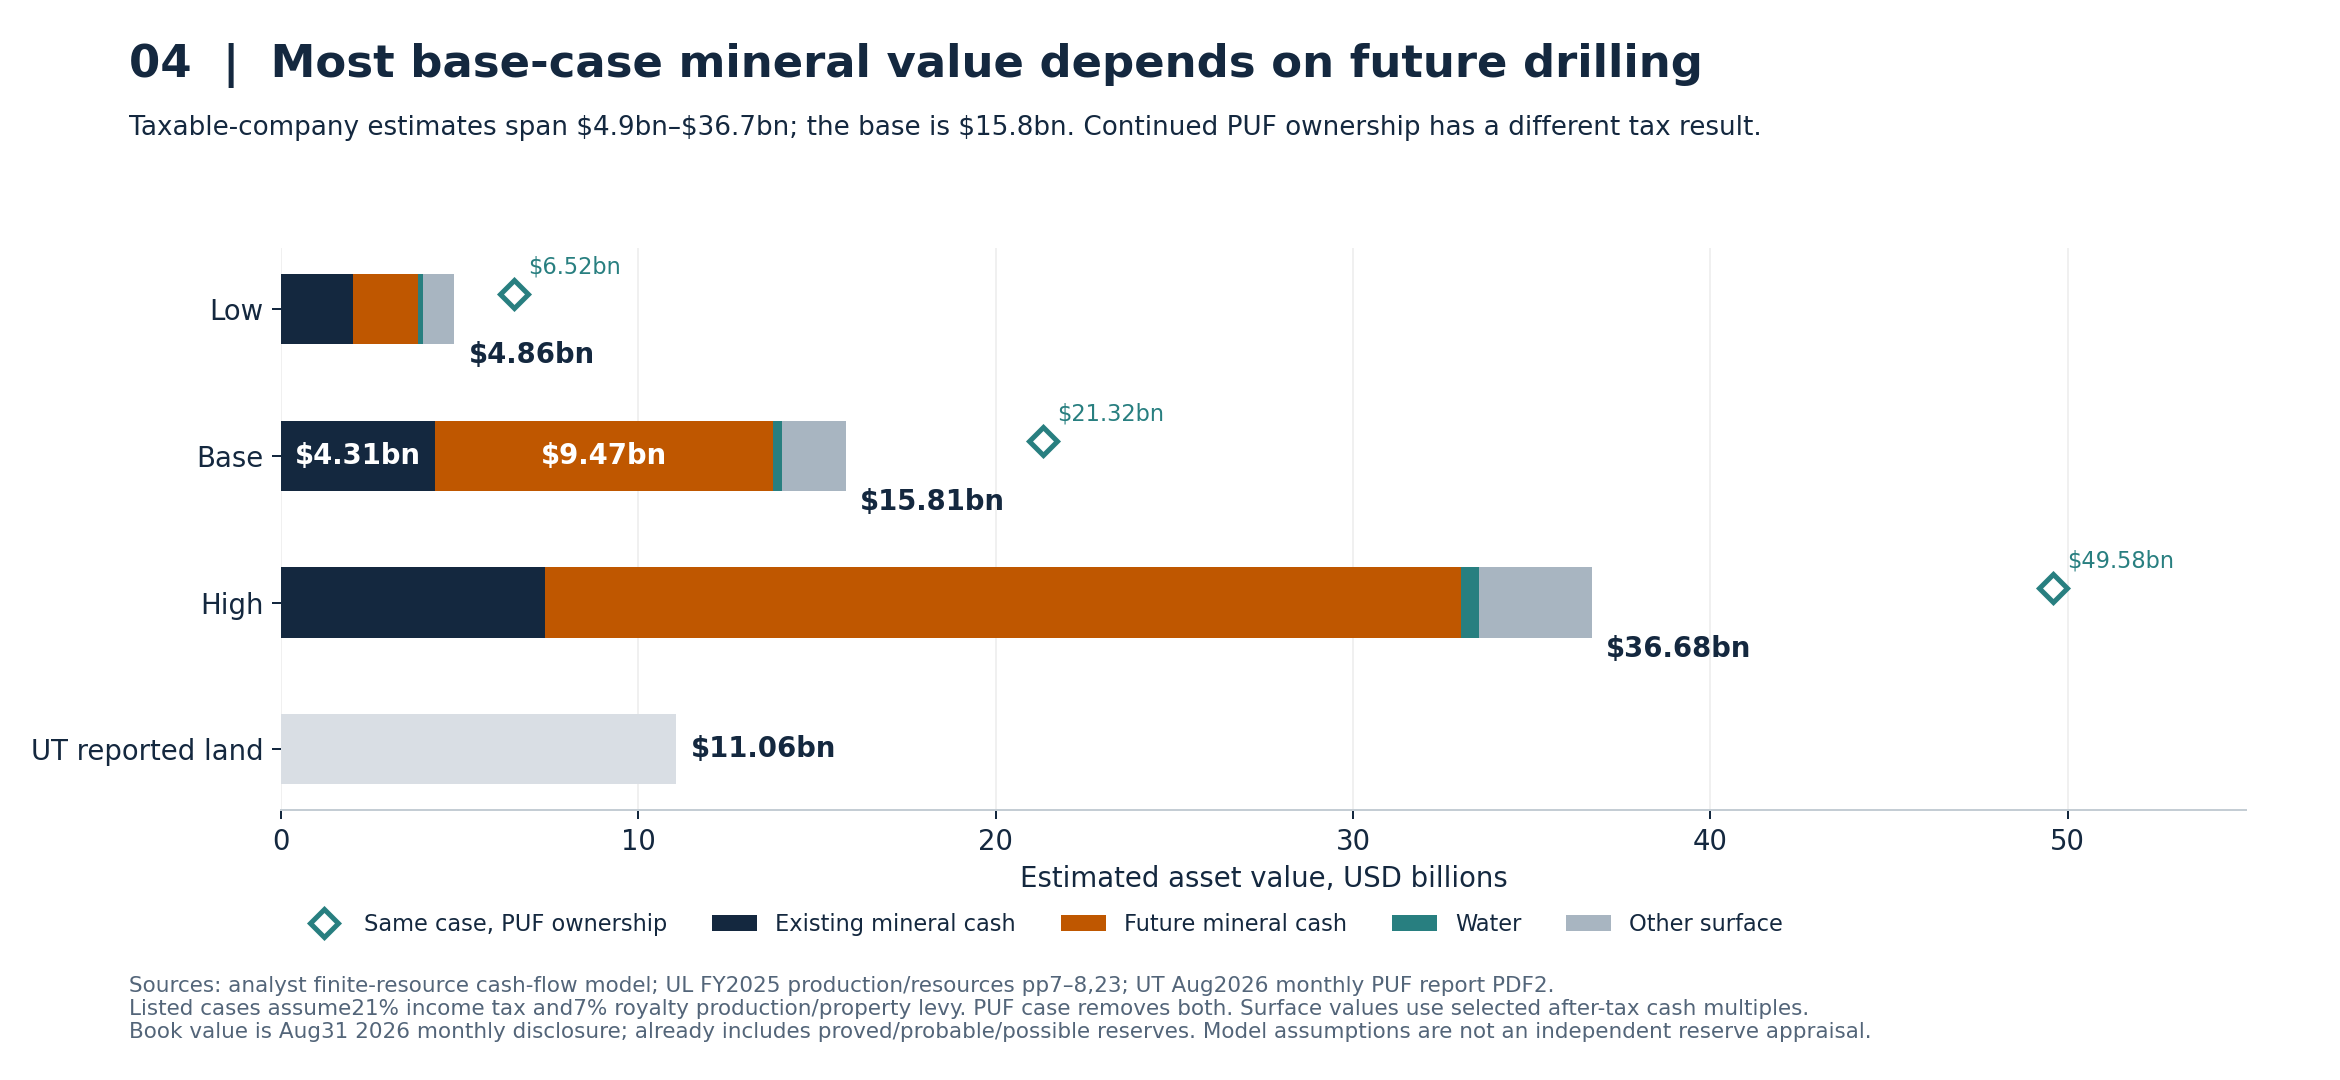
| Base calculation | Value, $ billion |
|---|---|
| Present value of existing mineral production | 4.311 |
| Present value of future production and bonuses | 9.471 |
| Mineral value | 13.782 |
| Water | 0.244 |
| Other surface rights | 1.779 |
| Total estimated asset value | 15.806 |
All admitted mineral recovery in the three headline cases fits within the 60-year portfolio forecast. The “low” case still contains undeveloped recovery; it is not a producing-wells-only liquidation case. With base economics but no future mineral development, existing mineral cash plus base surface/water value would be about $6.33 billion. The value of future drilling is essential to the modeled result.
5. Listed peers support the base range, but TPL’s premium cannot be copied wholesale
The peer comparison uses November 11 closing prices, all economic common shares or exchangeable operating-company units, and September 30 balance sheets. These November prices and September balance sheets are not fully pro forma for post-quarter acquisitions. Enterprise value equals common equity plus gross debt and preferred capital, less cash. The workbook recomputes trailing results from free annual and quarterly filings instead of using an aggregator’s market-cap or multiple field.17
| Peer | Common equity, $bn | Enterprise value, $bn | EV / trailing adjusted EBITDA | Equity / common cash flow |
|---|---|---|---|---|
| Texas Pacific Land | 19.41 | 19.04 | 23.4× | 34.1× |
| LandBridge | 5.61 | 6.36 | 29.0× | 33.7× |
| WaterBridge | 3.46 | 5.26 | 11.8× | Negative cash flow |
| Viper Energy | 15.15 | 17.55 | 8.3× | 9.1× |
| Black Stone Minerals | 2.98 | 3.47 | 9.6× | 10.9× |
Common cash flow means operating cash flow minus cash capital spending and, for Black Stone, preferred cash distributions. Different tax structures and acquisitions limit direct comparability.
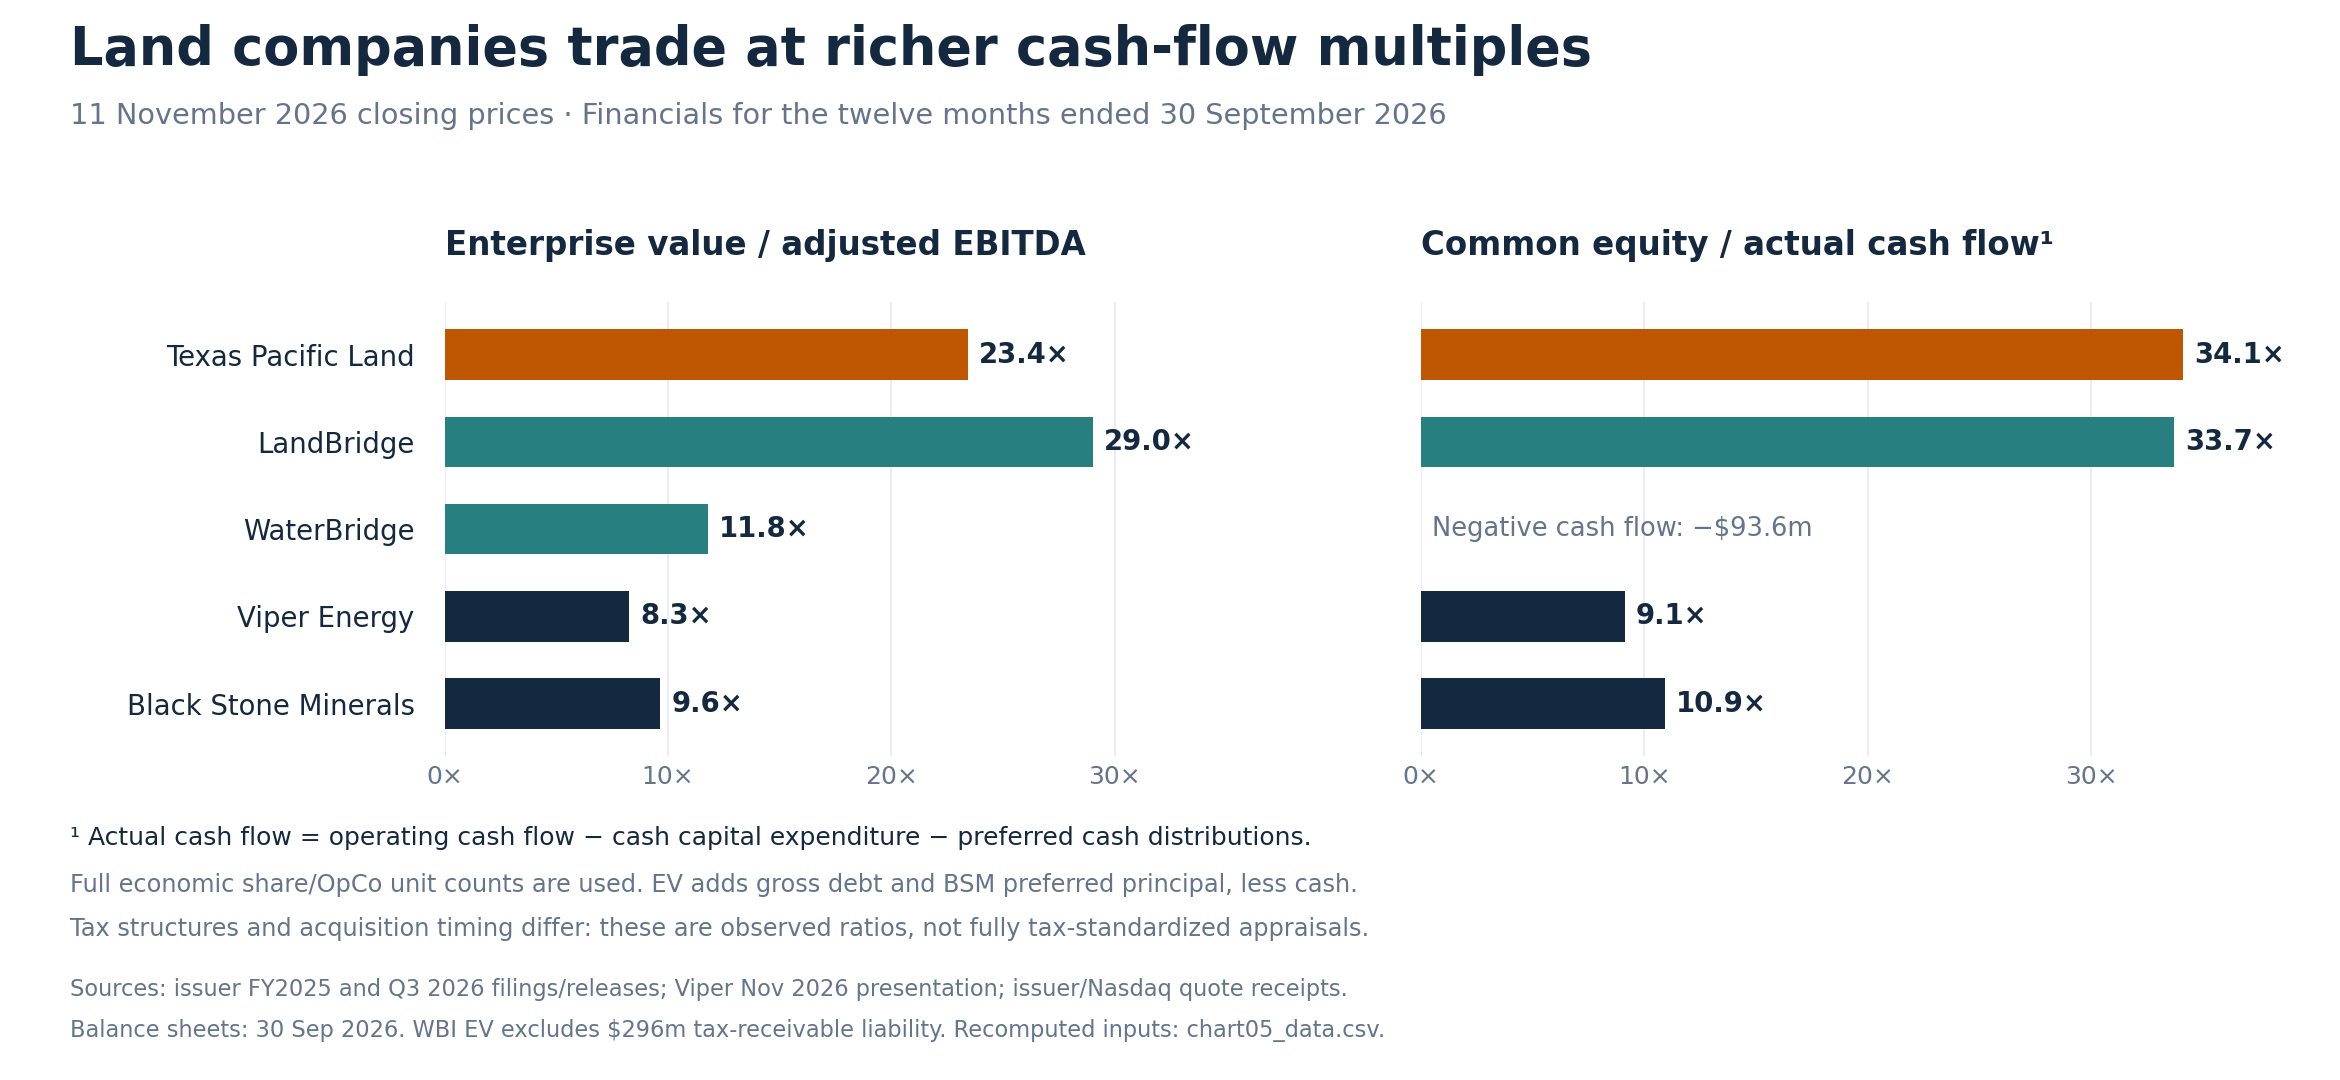
The capitalization adjustments are material. LandBridge, Viper and WaterBridge have exchangeable interests that a Class-A-only count misses. Black Stone’s EV includes $300 million of preferred principal. WaterBridge’s base EV excludes its tax-receivable-agreement liability; including $296 million raises its EV/EBITDA multiple from 11.8× to 12.4×. These conventions appear in the calculation.18
TPL is an attractive reference because it combines royalties with surface and water rights, but its revenue mix is different. In FY2025, oil-and-gas royalties supplied 51.6% of TPL revenue, compared with approximately 88.7% of UL cash receipts. TPL’s royalty production was 12.613 million BOE, with oil comprising about 39% of BOE; UL’s comparable oil share is about 57%. BOE expresses energy in common units.19
Margins also need consistent definitions. UL’s rounded FY2025 annual report shows $30 million of expenses against approximately $1.861 billion of revenue, a roughly 98.4% reported net-revenue margin before the hypothetical corporate charges. TPL’s FY2025 adjusted EBITDA margin was about 86.1% across its mixed businesses. Neither is a directly comparable after-tax distributable margin. TPL’s reported royalties are already net of production taxes; applying another severance-tax deduction to those reported revenues would double count it.11, 19
For mineral valuation, Viper and Black Stone are more direct operating comparisons. Viper is concentrated in the Permian and has undergone large acquisitions; its trailing denominator does not describe a static portfolio. Black Stone has a broader, gas-heavy mineral business. Its rounded ownership averages and the absence of a tract-level net-interest schedule do not support a precise, county-resolved contractual NRA total, so this report does not fabricate one.20
At base prices, FY2025 UL volumes imply $1,776.35 million of normalized royalty revenue. After the assumed production/property levy and mineral management expense, the current annual cash flow is $1,622.03 million before income tax, or $1,281.40 million after 21% tax, excluding a recurring lease-bonus assumption.
Applying Viper’s 8.254× and Black Stone’s 9.649× EV/EBITDA observations to that pre-income-tax cash flow, then adding the $2.023 billion surface/water business, yields $15.41–17.67 billion. This is an independent method check on the $15.81 billion DCF. The rougher common-cash-flow comparison gives $13.71–16.01 billion, but Viper’s Up-C structure and Black Stone’s partnership taxes make that comparison less uniform. The peers also carry debt, and their operating cash flows are after interest; the EV/EBITDA comparison therefore provides the cleaner operating check.
Applying TPL’s entire company multiple to UL minerals would import the market’s surface, water and growth premium into the mineral estimate. Adding a surface valuation afterward would then risk counting that premium twice. TPL helps explain the business model and the market’s willingness to pay for it; the mineral-only peers provide the cleaner pricing check.
6. Surface and water are valuable, with different capital requirements
Surface economics deserve their own valuation. FY2026’s $178.315 million of surface and associated cash includes $123.977 million of easement receipts, $25.698 million of brine/water, $13.099 million of damages, $6.589 million of grazing, $3.599 million of sand/gravel and related materials, and $5.354 million of fees and other interest.6
Annual wind, solar and saltwater-disposal dollar series remain UNKNOWN. University Lands’ reports bundle several of these uses with easements or other surface categories. FY2025 disclosed approximately 74,500 renewable lease acres and 24,500 miles of pipeline/power-line easements, but acres and miles cannot be converted into annual income without contractual prices and terms.11
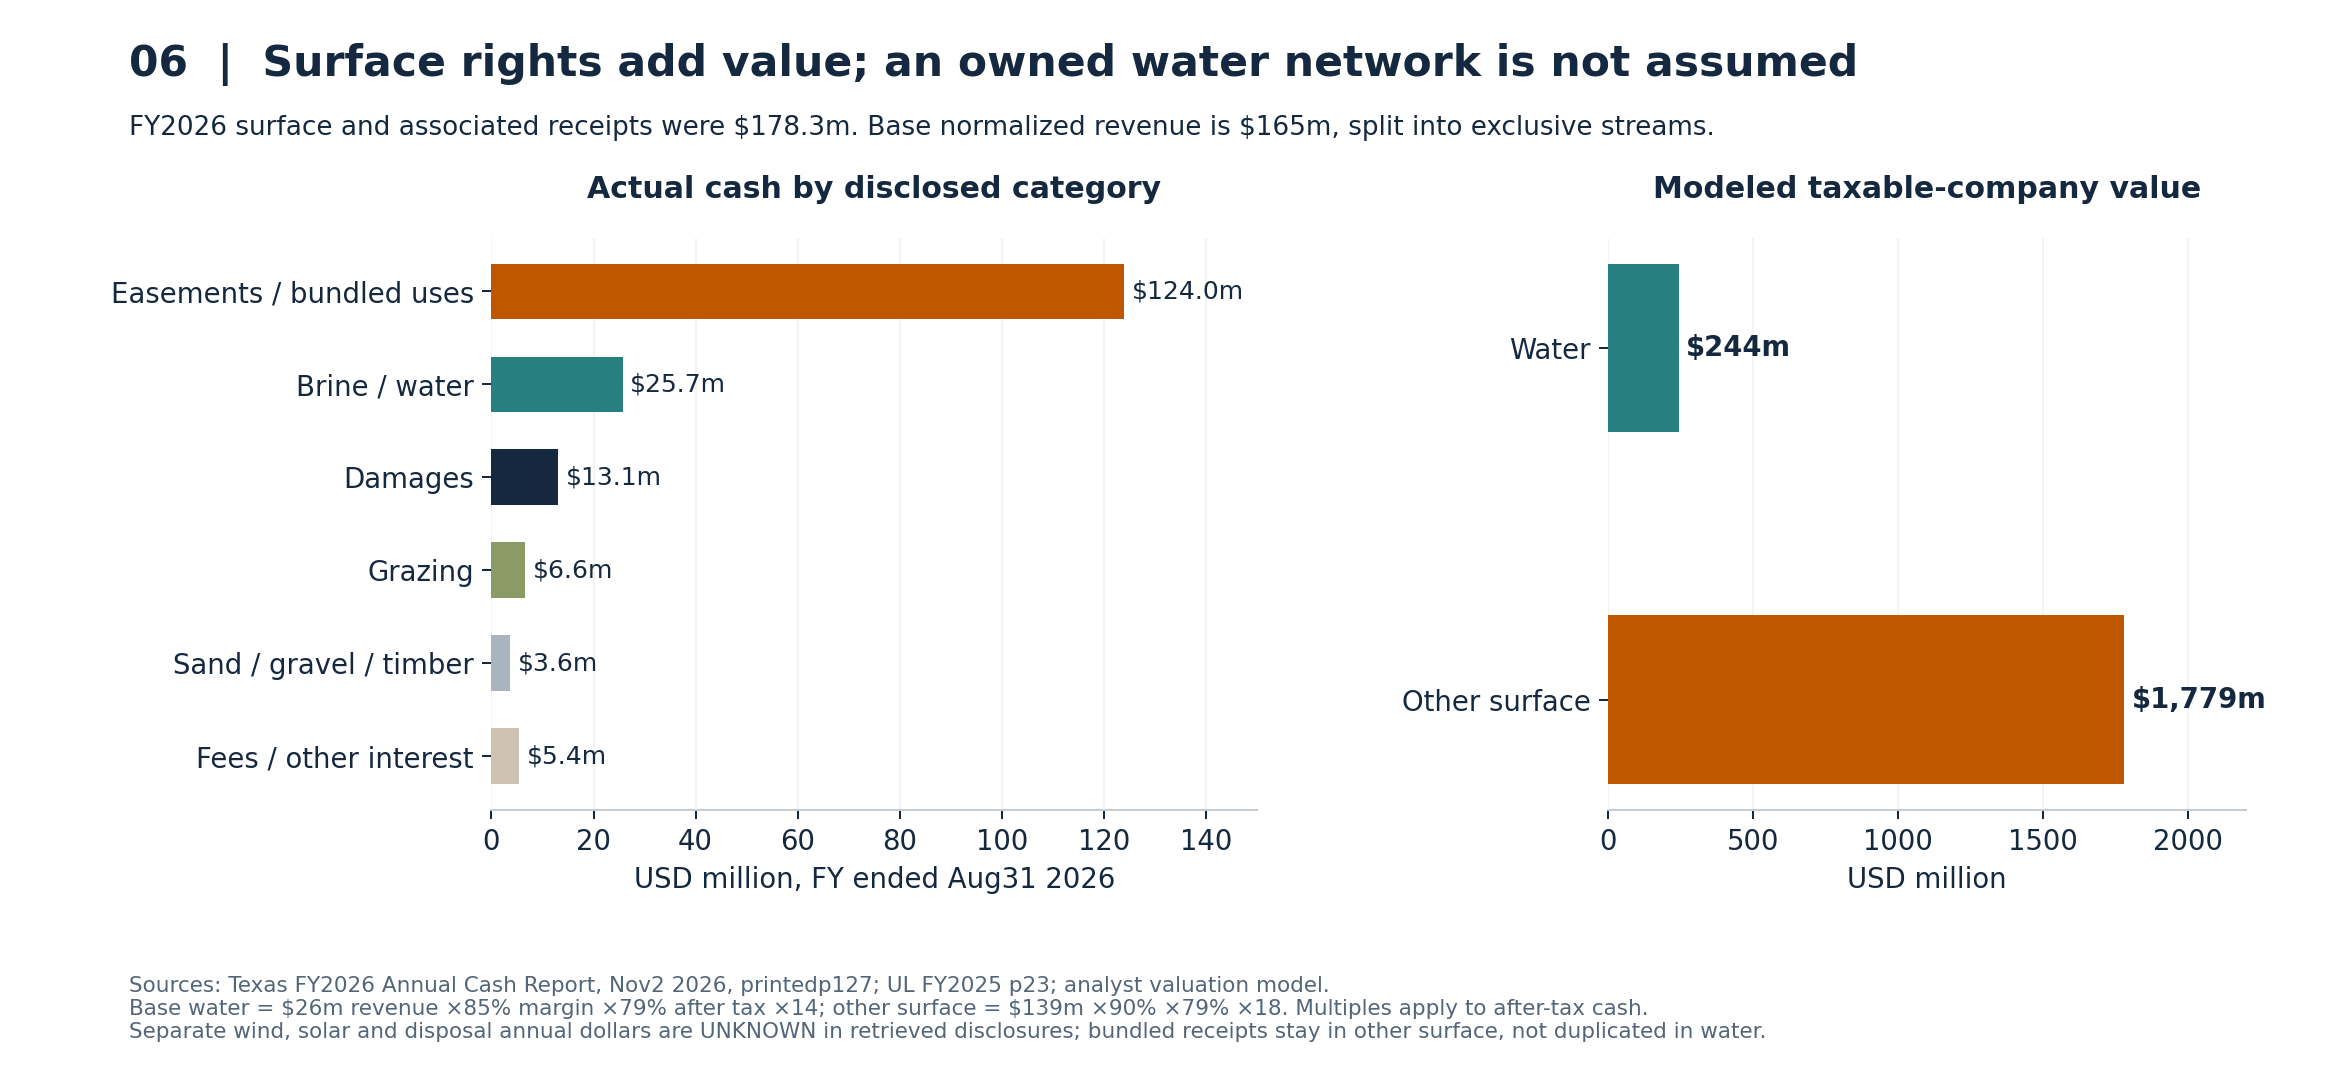
The base normalizes annual revenue to $26 million for brine/water and $139 million for all other surface uses, totaling $165 million. These streams are mutually exclusive. Disposal income bundled in the other-surface disclosure stays there; it is not also added to water. The base valuation is:
Water = 26 × 85% × 79% × 14=$244.426 million, / Other surface = 139 × 90% × 79% × 18=$1,778.922 million.
Margins and multiples are estimates. The 14× and 18× factors apply to after-tax cash. Low-case surface/water value is $1.013 billion; high-case value is $3.652 billion. The range reflects uncertain persistence, pricing, costs and development opportunities. Contract terms and the split between recurring payments and one-time consideration could change it materially.
LandBridge is the more relevant landowner comparison. Its trailing adjusted EBITDA margin is approximately 89.4%, and its surface agreements can monetize access and pore space without owning every pipe. Its portfolio includes disclosed development opportunities, which also make its multiple an imperfect proxy for UL. Those opportunities cannot be assigned automatically to UL merely because both own West Texas acreage.21
WaterBridge is now public, trading as WBI since its September 2025 IPO. It owns and develops water infrastructure and is substantially more capital-intensive. Its trailing cash capital expenditure of $447.3 million exceeded operating cash flow of $353.8 million, leaving negative $93.6 million before financing. Its EBITDA multiple therefore cannot be applied to an assumed costless water royalty.22
LandBridge and WaterBridge also have overlapping sponsorship and contractual relationships. Water-system earnings include payments to landowners. A valuation that adds both the whole operating network and the landlord’s royalty without accounting for those payments can count the same economics twice. This report values documented UL landlord receipts and makes no assumption that UL owns an equivalent WaterBridge network. It also adds no uncontracted data-center option or additional acreage-sale value on top of capitalized surface income.
7. The land sits beside a much larger financial portfolio
UTIMCO’s audited PUF statements report $40.291 billion of financial net position at August 31, 2025, excluding the land. The monthly financial portfolio reached $45.904 billion at August 31, 2026, and $45.982 billion at September 30, 2026. The future-royalty valuation excludes those financial assets.23
At a consistent August 31, 2026 date, the disclosed combination is:
$45.904bn financial assets+$11.065bn land=$56.968bn.
Replacing the reported land amount with this report’s listed-company base gives $61.710 billion. Using the continued-PUF-ownership base gives $67.228 billion. These are analytical combinations of reported financial assets and estimated land values. The figures model the replacement operation. The replacement operation matters: adding both the existing land carrying amount and the new estimate would double count the estate.
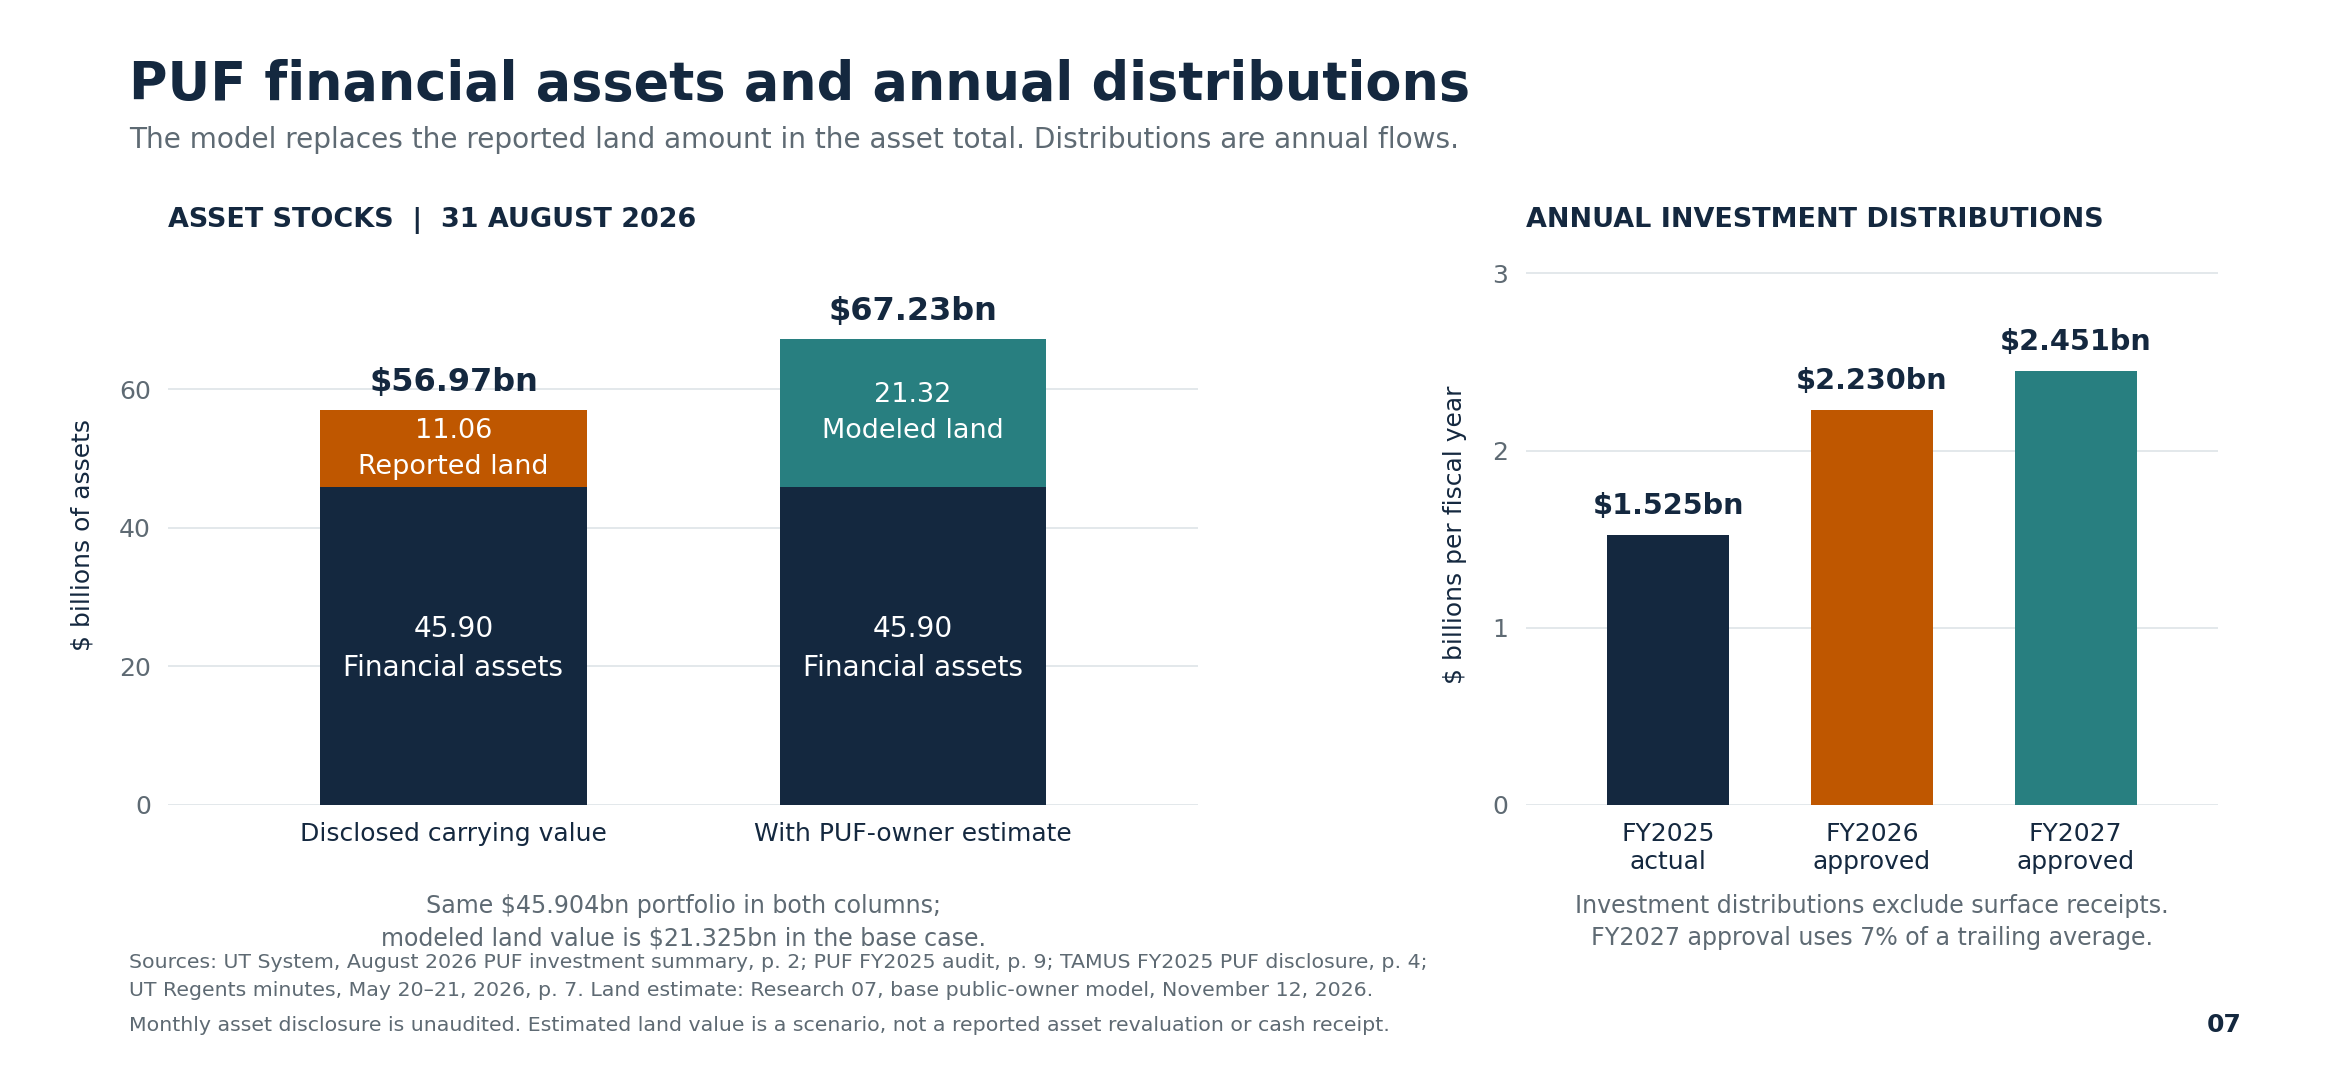
Past royalty receipts already invested in the financial portfolio are not counted again in the forward mineral model. Future receipts have not yet entered those investments. This explains why a financial portfolio and the present value of future land cash can properly coexist, provided their dates and definitions are clear.
Annual support for the universities
The PUF’s annual investment distribution was $1.525 billion in FY2025. Approved distributions increased to $2.230 billion for FY2026 and $2.451 billion for FY2027, the latter effective September 1, 2026. For FY2027, the Regents approved the 7% maximum using the trailing twenty-quarter average of PUF investment assets. For FY2027, the relevant average was approximately $35.013 billion; it is not 7% of today’s $45.98 billion financial portfolio.24
The constitutional AUF division is two-thirds to the UT System and one-third to the A&M System. The shares support authorized debt service and other eligible uses; they are not ownership percentages of UT Austin and College Station. Nor does an analytical increase in land value automatically create a larger budget distribution.25
In FY2025, the investment payout plus surface/other income, less divisible expenses, produced $1.666 billion of divisible AUF. UT System’s share was $1.111 billion and A&M System’s $555.357 million, before each system’s AUF interest. From there, debt service, system uses, allocations and spending follow different schedules.26
| Flagship measure | UT Austin | Texas A&M University |
|---|---|---|
| FY2025 specified operating/enrichment allocation | $524.967m, including technology | $200.000m core operations |
| FY2025 AUF expenditures | $498.677m | $285.906m |
| Budget comparison | FY2027 approved AUF budget: $640.675m | FY2025 total net transfers: $230.101m |
The A&M expenditure figure includes use of prior balances and therefore need not equal the year’s core allocation or transfers. A $315 million FY2027 core-operations projection appears in the earlier AUF planning material; this report does not relabel it a verified final appropriation. Austin’s $640.675 million figure comes from the approved FY2027 budget summaries.27
For scale per student, this report uses a matched fall 2025 denominator: 270,046 UT System students plus 175,635 A&M System students = 445,681. Dividing the listed base by that total gives $35,464 per student, compared with approximately $24,826 of reported land value per student. Continued PUF ownership gives approximately $47,847 under the base assumptions.28
These figures describe scale across both systems. Some campuses have different PUF/HEF eligibility, and nonstudent agencies also benefit. The calculations are not individual entitlements, available scholarships, or amounts that could immediately be spent. Dividing all PUF land by one flagship’s enrollment would misstate the beneficiary base.
8. What would change the conclusion?
The model can be checked when its assumptions are challenged. At base recovery and development timing, changing only long-run oil realization and the discount rate produces the following taxable-company values. Gas, NGL, surface and all other inputs remain fixed.
| Total value, $bn | Oil $55/bbl | Oil $75/bbl | Oil $95/bbl |
|---|---|---|---|
| 8% discount rate | 14.6 | 18.3 | 22.0 |
| 10% discount rate | 12.7 | 15.8 | 18.9 |
| 12% discount rate | 11.2 | 13.9 | 16.6 |
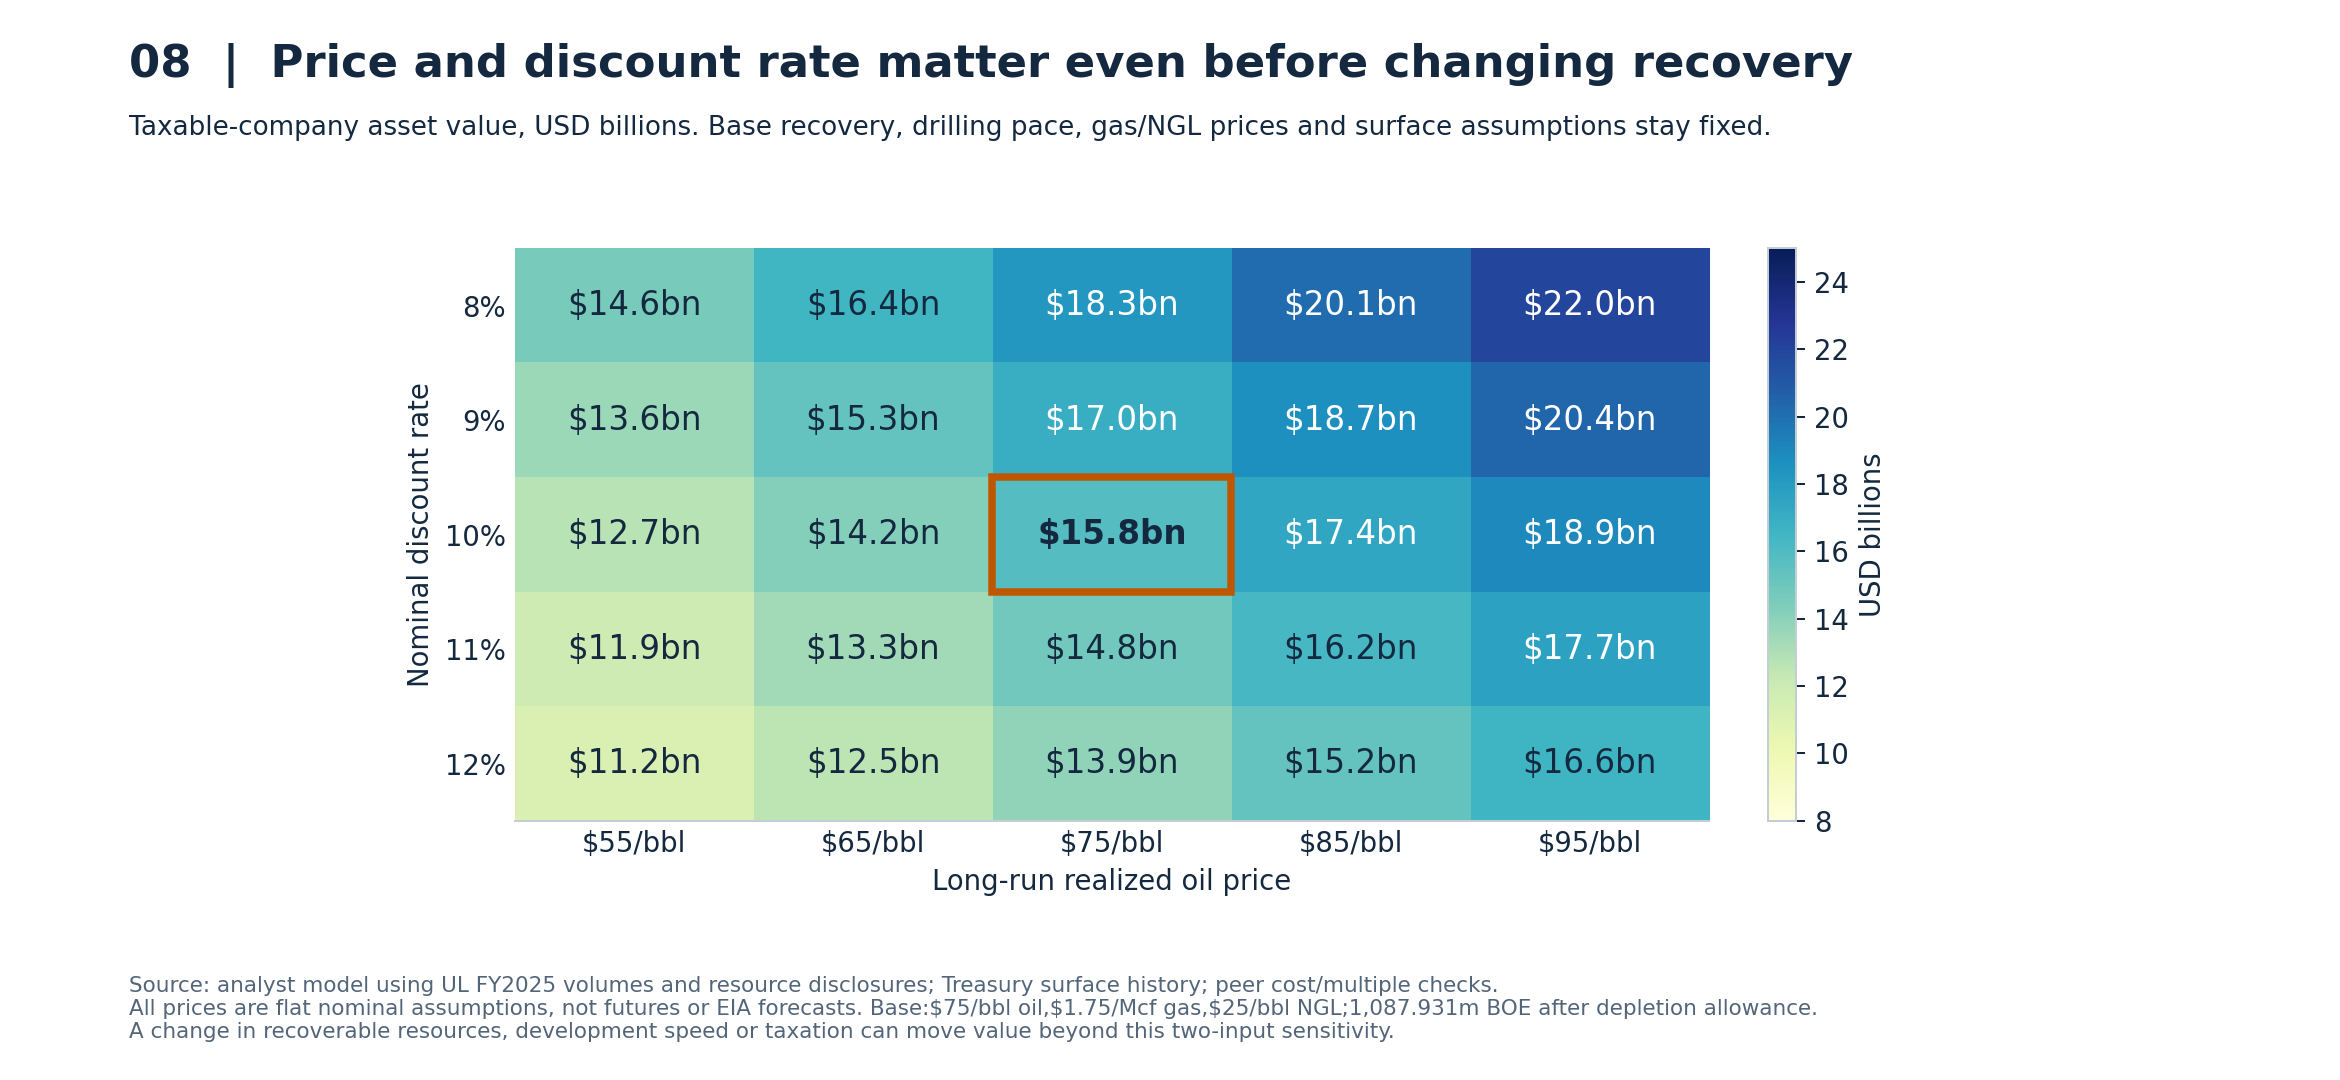
The range in this grid is narrower than the low/high scenarios because the scenarios also change resource recovery, drilling pace, well recovery, delay and surface economics. The high case combines favorable assumptions. It should not be read as the value obtained merely by increasing oil from $75 to $95.
Recovery and timing interact. At base prices, costs and drilling assumptions, limiting admitted resources to the reported 425 million BOE proved amount before depletion reduces total value to about $9.63 billion. Admitting the whole 1.728 billion BOE raises it to about $17.04 billion if the base drilling pace stays the same. Later barrels are discounted heavily. The $36.68 billion high case also needs faster development, better well recovery, higher prices and a lower discount rate.
The evidence most likely to change the answer is specific:
- The reserve-study cash-flow schedule. A public breakdown of proved-developed, proved-undeveloped, probable and possible volumes, prices, risk factors and timing would allow a direct bridge to UT’s carrying value. The category totals and annual cash flows behind that appraisal remain unknown here.
- A contractual mineral inventory. Net royalty interests by tract, depth and county would replace the full-estate NRA proxy. It could raise or lower the comparison with TPL substantially.
- An estate-wide production and development file. Well/lease identifiers, completion dates, royalty burdens and future operator commitments would replace assumed portfolio declines and modeled well equivalents with a defensible vintage analysis.
- Surface contract economics. Revenue by recurring lease, one-time easement, water, disposal, wind and solar—plus remaining terms, escalation and costs—would test the $165 million normalized base and selected cash multiples.
- A specified corporate transaction structure. Tax exemptions, depletion, tax basis, debt allocation and any rights the public keeps would determine how close a listed entity could come to either modeled ownership case.
Independent checks on the three headline numbers
| Headline | Primary calculation | Independent check | Remaining limit |
|---|---|---|---|
| $2.058bn FY2026 receipts | Sum of the 11 FY2026 land-category observations in the 317-row raw extract | Stable annual cash-report fund detail; prior-year tie to UL and audited PUF remittances | Cash is not accrual earnings; earlier timing differences stay visible |
| $11.065bn reported land | August 2026 monthly PUF report, page 2 footnote | Repeated in September’s report; prior FY2025 audit verifies the valuation framework and $10.632bn comparator | No independent completed FY2026 audit located |
| $15.806bn listed base | Finite-resource royalty PV plus a value for water and surface use | An independent monthly-parcel PV reproduces the result; mineral-peer operating multiples give $15.4–17.7bn | Arithmetic agreement does not verify geology or future drilling |
The evidence supports describing University Lands as a large royalty-and-surface business with substantial undeveloped value. A defensible central listed-company estimate is about $16 billion, with the existing public ownership tax treatment supporting about $21 billion under the same operating assumptions. The current $11.06 billion carrying value already recognizes future reserves. The debate is over recoverability, timing and cash-flow pricing, for which the accompanying model makes the consequential choices visible.
Data, calculations and source notes
The accompanying workbook labels sourced observations, assumptions, formula calculations and outputs. One active case and ownership selector drive the forecast; native sensitivity tables recalculate that model. Exact receipts, annual-report observations, peer inputs, county acreage, RRC production and illustrative lease histories are also supplied as CSVs. The figures are supplied as PNGs. All estimates are labeled. Undisclosed operating figures remain blank. Figure source notes and input rows carry the full URLs, document dates and page/table tags.
- UT System, August 2026 PUF Summary of Investments, period ended August 31, 2026, PDF p. 2 footnote: land $11,064,621,977. September 2026 summary, PDF p. 2, repeats the land amount and reports financial investments. Valuation and premiums are this report’s model calculations. ↩
- UT System, FY 2025 and FY 2024 audited financial report, December 2025, Note 3, printed pp. 49–50: valuation methodology and Level 3 amounts. Land at August 31, 2025: $10,631,790,835. Exact reserve-category schedules and individual surface and mineral components were not disclosed in the retrieved material. ↩
- Texas Comptroller, Crude Oil Producer’s Monthly Report instructions, items 16 / 19, state-owned royalty exemptions; oil and gas tax FAQ, ordinary oil 4.6% and gas 7.5% rates. Texas Tax Code 11.11(e), higher-education mineral-interest ad valorem exemption. Retrieved November 12, 2026. Corporate 7% combined levy and 21% income tax are tax assumptions for the modeled ownership structure. ↩
- University Lands, About Us and county acreage map, retrieved November 12, 2026; county acreage embedded in map labels. Annual-report archive supplies the dated operating reports. ↩
- Texas Comptroller cash-query series, Agency 720 and Funds 0045 / 0011, object codes 3301, 3315, 3316, 3320, 3325, 3328, 3337, 3340, 3341, 3344, 3854, as applicable. Example: oil royalty history through FY 2026. Retrieved November 12, 2026. Every observation’s exact query URL is in
comptroller_raw.csv; the annual economic-category aggregation is incomptroller_history_wide.csv. ↩ - Texas Comptroller, State of Texas Annual Cash Report FY 2026, transmittal November 2, 2026, printed p. 127 Fund 0011 and p. 134 Fund 0045. Mineral codes 3315/3316/3320/3325; surface/associated codes 3301/3328/3337/3340/3341/3344/3854. Code 3851 Treasury interest and 3855 investment distributions excluded. Report landing page and downloadable data. ↩
- UTIMCO, FY 2025 PUF audited financial statements, December 2025, printed pp. 8–9; FY 2015 statements, printed p. 9; FY 2017 statements, printed p. 8. The complete FY 2015–25 audit URLs and tags are in
puf_audited_history.csv; cash/audit differences are inaudit_cash_reconciliation.csv. All eleven financial NAV roll-forwards reconcile to audited totals. ↩ - Texas Pacific Land, 2025 Form 10-K, filed February 18, 2026, Item 2, printed pp. 20–21, county royalty-acre table. The calculation uses exact net royalty acres from the table. Original land/royalty interests have no assigned historical book amount; acquired assets use cost, a different basis from UT’s fair-value land assessment. ↩
- Viper Energy, November 2026 investor presentation, p. 13 footnote 1 county screen; p. 14 cost/tax guidance; p. 16 holdings; p. 20 NRA definition. Core counties: TX Culberson, Dawson, Ector, Glasscock, Howard, Loving, Martin, Midland, Pecos, Reagan, Reeves, Upton, Ward, Winkler; NM Eddy, Lea. The workbook applies this exact list to UL/TPL county tables. ↩
- Railroad Commission of Texas, July 2026 county production table, pp. 1–5, preliminary as of September 30, 2026; county-ranking release page. Oil plus condensate across the 19 counties totals 70,961,196 barrels; core share calculated from the county rows. Production-query FAQ explains lease reporting. Figures are not UL-attributable production. ↩
- University Lands, FY 2025 Annual Report, released 2026, printed pp. 1, 7–8, 23: operations, resource and financial tables. Net NGL units are inferred from the reported BOE total. Resource recovery haircuts, depletion allowance, well EUR, drilling schedule and all valuation results are this report’s estimates. ↩
- University Lands annual reports: FY 2020, pp. 2, 6–7, 16; FY 2021, pp. 2, 7–8, 19, including FY 2019–20 comparatives; FY 2022, pp. 1–2, 7–8, 17; FY 2023, pp. 13–16, 25; FY 2024, pp. 5–8, 21. The later FY 2024 re-presentation controls FY 2023 net gas/NGL volumes. Older snapshots and conflicting original numbers remain in the raw CSV notes. ↩
- University Lands commissioned economic-impact report, January 2017, printed p. 9 / PDF p. 14; 2018 water-project proposal notice, February 2018, 2017 drilling totals and regional breakdown. The notice’s 2018 well count is a projection and is not treated as a realized result. ↩
- University Lands RRC-linked production histories, retrieved November 12, 2026: University 217D, district 7C lease 22744 and War University 18 22/24A, district 8 lease 54854. Monthly oil-barrel rows supply the stated dates and percentage changes. Raw extracts and comparison-start flags accompany the charts. ↩
- U.S. Energy Information Administration, Short-Term Energy Outlook, November 2026, released November 10, 2026, assumptions through November 5, tables PDF pp. 32–33 and overview p. 2 for gas units; STEO landing page. The report’s 2027 WTI $80.54/barrel and Henry Hub $2.88/MMBtu forecasts give context for the dated outlook. The DCF uses the stated constant prices. ↩
- EIA, Production decline curve analysis, March 16, 2023, historical AEO 2022 methodology. That release is discontinued; the method is used as historical background. The report’s b, initial decline, terminal decline, life and midyear timing remain explicit analyst inputs. ↩
- Exact price sources, all November 11, 2026 close: TPL Nasdaq historical endpoint, row date 11/11/2026, close 281.42; Viper Nasdaq issuer quote,
primaryData.lastSalePrice41.13, market Closed; LandBridge issuer feed, TradePrice 72.90; WaterBridge issuer feed, TradePrice 27.98; Black Stone issuer feed, TradePrice 13.98. The quote-input CSV records the November 11 prices because live endpoints can change. Seepeer_quote_inputs.csv. ↩ - TPL Q3 2026 Form 10-Q, November 4, cover and balance sheet; LandBridge Q3 Form 10-Q, November 4, balance sheet/debt note; Viper November deck p. 3 economic-share count; Black Stone Q3 Form 10-Q, November 3, cover/preferred note; WaterBridge Q3 release, November 4, balance sheet. EV excludes operating leases and tax-receivable obligations unless itemized. ↩
- TPL FY 2025 results, February 18, 2026, production, financial statements and non-GAAP tables; 2025 Form 10-K Note 2 F-9 for revenue net of production taxes. TPL Q3 2026 release, November 4, statements and reconciliations. FY 2025 royalty revenue 411.677m / total 798.190m; adjusted EBITDA 687.369m. Trailing values are FY 2025 − 9M 2025 + 9M 2026.
peer_inputs_long.csvpreserves each component, URL and tag. ↩ - Viper Q3 2026 results, November 2, financial statements and trailing EBITDA reconciliation. Black Stone Q3 2026 results, November 2, financial statements/production/DCF tables; FY 2025 Form 10-K, February 24, 2026, Item 1 acreage and basin tables. I calculate the peer multiples and their implied UL values. ↩
- LandBridge Q3 2026 results, November 4, quarterly EBITDA/FCF reconciliation and development discussion; FY 2025 results, February 25, 2026. Trailing revenue 245.513m and adjusted EBITDA 219.373m. EBITDA’s four-quarter sum independently reconciles as FY 2025 177.171m − 9M 2025 126.082m + 9M 2026 168.284m, using the Q3 2026 Form 10-Q MD&A reconciliation. ↩
- WaterBridge Q3 2026 release, November 4, financial statements/capital guidance; FY 2025 Form 10-K, March 16, 2026, business/IPO and related-party disclosures; FY 2025 results. Trailing results combine post-IPO Q4 2025 with 9M 2026; pre-IPO standalone comparisons are not spliced into the denominator. ↩
- UTIMCO 2025 audited PUF statements, printed p. 8; UT System August/September 2026 investment summaries, PDF p. 2. Exact financial NAV: August 45,903,854,936.05; September 45,982,078,971.27. The September cost figure 37,937,630,850.34 is not market value or land carrying value. ↩
- UT Board of Regents, May 20–21, 2026 approved minutes, printed p. 7 / PDF p. 8, Finance and Planning item 3: FY 2027 distribution 2,450,890,000 effective September 1. TAMUS 2026A/B official statement, dated June 23, 2026, p. 25, corroborates amount and 7% rate. Minutes date the action May 21; issuer narrative says May 20. This report uses “May 2026 meeting.” Twenty-quarter basis 35,012,743,289 is from the May 2026 agenda, pp. 113–114. FY 2026 approved distribution 2,229,795,000; FY 2025 reported 1,524,925,000. ↩
- Texas Constitution Article VII, §§ 11, 12, 15, 16, 18, retrieved November 12, 2026. Section 12 contemplates land sales under legal terms, so the land should not be described as categorically constitutionally unsellable. A listing is this report’s valuation thought experiment; no transaction is proposed here. ↩
- UT System, FY 2025 AUF Report, December 2025, Table 1 printed p. 3 and Appendix G p. 20. Payout 1,524,925,000 + surface 142,603,853 − divisible expenses 1,459,059 produces published net 1,666,069,793, with a 1-dollar whole-number rounding difference. UT share 1,110,713,195; A&M 555,356,598 rounded. ↩
- UT System FY 2027 operating budget summaries, approved August 13, 2026, printed pp. 26 / 30. TAMUS FY 2025 AUF Report, Appendix F printed p. 8 / PDF p. 10 and Appendix H printed p. 10 / PDF p. 12: allocation 200m; total net transfers 230,100,759.28; reported expenses 285,906,397.63. Allocation, transfer, expense and projection measure different things. ↩
- UT System, SmartBook 2026, printed pp. 6–7, fall 2025 enrollment 270,046; TAMUS December 11, 2025 bond-rating release reports 175,635, corroborated in its 2025A/B issuer official statement Appendix A p. A-5 and 2026A/B statement. A&M figure is preliminary twentieth-class-day enrollment. The comparison uses same-fall totals for both systems. ↩
Supporting material
- Excel model ↗Sourced inputs, live calculations and reported outputs.
- Source and model data (CSV collection) ↗Data tables, source references and calculation exports.