Texas public finance
What Texas Athletics would be worth as a business
Texas Athletics reported $352.55 million in FY2025 NCAA revenue and a $26.74 million deficit after transfers. An all-sport valuation depends on donations and facility costs.
Texas Athletics reported $352.55 million of revenue and $375.89 million of operating expenses in its latest available NCAA reporting year. Including the reported university transfer brings uses to $379.28 million and the after-transfer shortfall to $26.74 million. The figures follow the NCAA reporting categories.1, 2
Football is the commercial engine: its FY2025 allocated revenue exceeded allocated expense by $107.18 million. That surplus supports an institution carrying shared facilities, administration and other sports. It is not a dividend that could simply be capitalized as the earnings of a standalone team.3
Athlete pay adds to the cost of running the department. The current House settlement benefits cap is $21.58 million for July 2026–June 2027. Qualifying Alston awards and added scholarships consume part of that cap. With both initial $2.5 million offsets fully used, publicity payments are $16.58 million. Adding the reported $9.2 million scholarship expansion gives $25.78 million of annualized incremental expense, above a baseline already paying Alston awards. That illustration applies the published benefits rules and the reported scholarship plan. The fiscal-year model produces $25.92 million for FY2027.4, 5, 6
What would it be worth as a franchise? There is no existing UT Athletics equity interest available to buy. For a hypothetical operator keeping all 21 sports and their obligations, a deliberately discounted 2–4 times commercial-revenue yardstick produces $459 million–$1.003 billion, with a $721 million middle case. A cash-flow test is much less forgiving: the base case has essentially no positive distributable value; the optimistic case reaches $947 million before assigned debt. The disagreement is the finding. It would be misleading to average those answers into a confident sale price.
The defensible conclusion is conditional: A revenue yardstick can approach $1 billion; supporting that price from all-sport cash flow requires favorable growth, cost control and continuing donor support. The department’s cash-generating capacity and the terms on which an investor could acquire those rights remain uncertain. Recurring facility obligations, donor retention and cost growth determine how much of the brand’s earning power could reach an investor.
1. Revenue grew rapidly; spending grew faster
The ten-year backbone is the NCAA Membership Financial Reporting System, or MFRS, as published by Knight-Newhouse. Detailed public republications were independently summed and checked against available original UT statements. The accompanying files preserve each year, category, source URL and reporting definition.1, 2
| Fiscal year | Revenue | NCAA operating expenses | Transfer back | Balance after transfer |
|---|---|---|---|---|
| 2016 | 187.98 | 171.39 | 10.10 | 6.49 |
| 2017 | 214.83 | 207.02 | 10.34 | −2.53 |
| 2018 | 219.40 | 206.55 | 10.77 | 2.08 |
| 2019 | 223.88 | 204.23 | 3.19 | 16.45 |
| 2020 | 200.77 | 173.65 | 5.02 | 22.10 |
| 2021 | 152.70 | 160.53 | 6.79 | −14.63 |
| 2022 | 239.29 | 225.15 | 2.09 | 12.05 |
| 2023 | 271.13 | 232.32 | 1.59 | 37.21 |
| 2024 | 331.91 | 325.03 | 2.76 | 4.12 |
| 2025 | 352.55 | 375.89 | 3.40 | −26.74 |
USD millions. NCAA operating expenses exclude the excess transfer shown in the table. Rounding can affect displayed subtraction; the workbook uses unrounded figures.
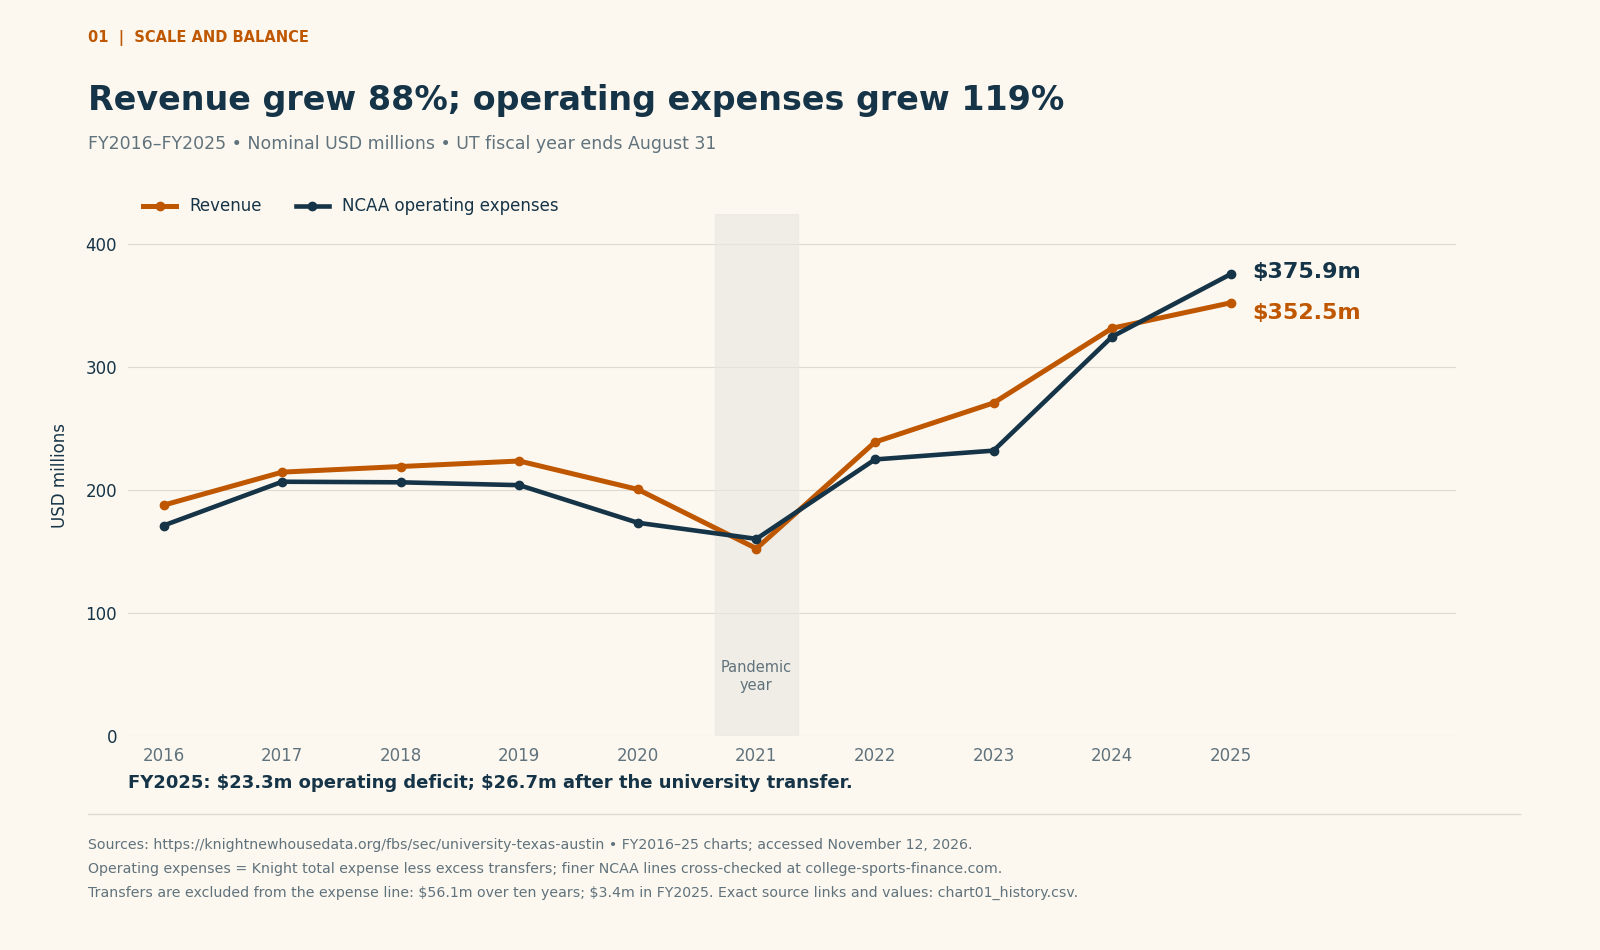
Chart 1. Source: Knight-Newhouse NCAA data, FY2016–FY2025; independently summed public line items. The table gives transfers their own column.
Across the nine intervals between FY2016 and FY2025, revenue rose 87.5%, while NCAA operating expenses rose 119.3%. The pandemic interruption is visible in FY2021. The recovery produced a substantial FY2023 surplus, but by FY2025 spending had again overtaken revenue. These are nominal changes. They do not measure real purchasing-power growth or prove a permanent operating deficit.
NCAA operating costs include some spending on long-lived assets. NCAA reporting includes specified debt principal and other items that would receive different treatment in conventional financial statements. Depreciation is excluded under NCAA instructions. An MFRS surplus is therefore neither EBITDA nor free cash flow.7
Three public views do not collapse into one income statement
UT’s FY2025 annual report presents $336.6 million of sources and $364.0 million of uses, a $27.4 million shortfall. Its management presentation includes capital gifts, projects, debt service and transfers. The NCAA revenue figure is $15.95 million higher. No retrieved public schedule reconciles that difference line by line. Similar shortfalls do not make the underlying accounts interchangeable.8
The audited UT System financial statements supply a different check: they define what the university consolidates and distinguish operating activity, capital assets, capital gifts and financing. The UT Austin supplementary statements are university-wide. They do not isolate an audited athletics balance sheet, unrestricted athletics cash balance or standalone enterprise profit. This report therefore does not use the university’s total auxiliary revenue or net assets as athletics revenue or franchise value.9
There is also newer information. UT’s official FY2026 EADA report shows revenue of $361.21 million and expenses of $337.18 million. Its comparable FY2025 EADA document shows $341.76 million and $272.81 million. On that same basis, revenue increased $19.45 million, expenses increased $64.38 million, and the allocated balance narrowed from $68.96 million to $24.03 million.10
That supports a finding of cost pressure, but it cannot identify the NCAA facility, debt or pay components. In particular, comparing FY2025 NCAA expenses of $375.89 million with FY2026 EADA expenses of $337.18 million would manufacture an apparent spending reduction from incompatible measures. The FY2026 MFRS deadline is January 15, 2027; a complete FY2026 UT NCAA statement was not located as of this report’s date.7
2. Donations are central to the business model
Texas’s FY2025 revenue mix was broader than television and ticket sales:
| Revenue source | FY2025 | Share of total |
|---|---|---|
| Contributions (cash and marketable securities) | $167.79m | 47.6% |
| Reported in-kind contributions | $3.38m | 1.0% |
| Ticket sales | $70.98m | 20.1% |
| Sponsorship, advertising, royalties and licensing | $51.96m | 14.7% |
| Conference, NCAA, media and postseason bundle | $33.60m | 9.5% |
| All other revenue | $24.84m | 7.0% |
| Total | $352.55m | 100.0% |
Source: FY2025 MFRS public line items and Knight’s category totals. “Other” includes concessions, camps, guarantees, restricted endowment income and miscellaneous receipts.
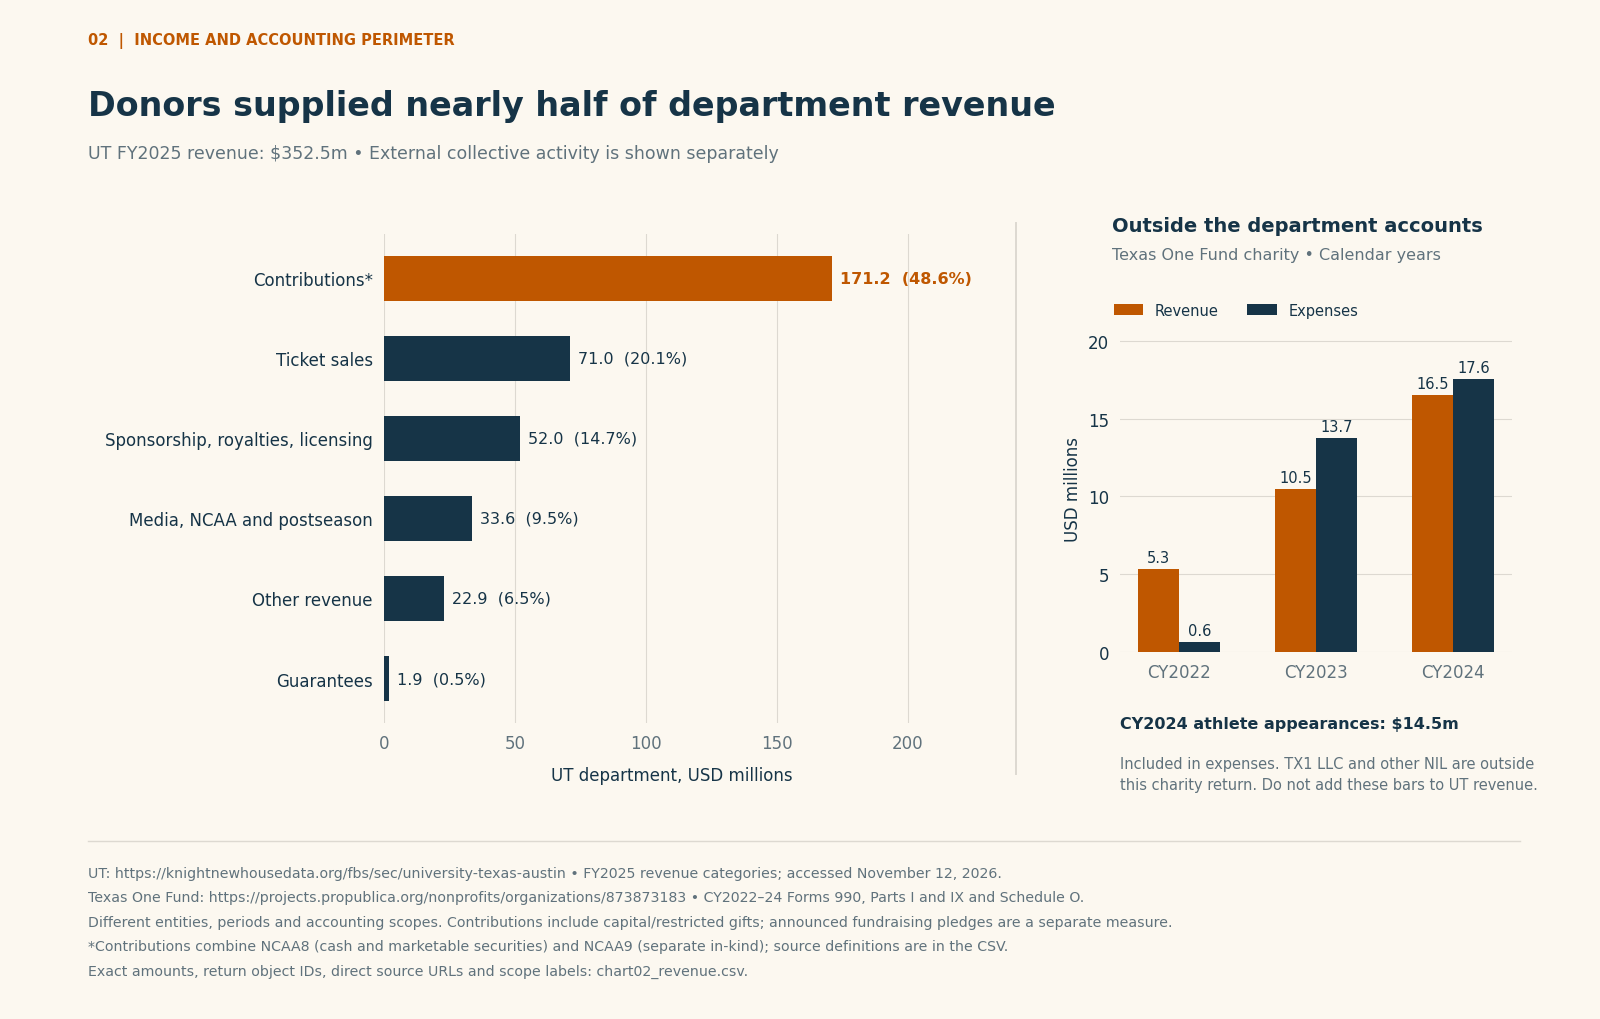
Chart 2. Department revenue uses fiscal 2025. Texas One Fund uses calendar 2022–2024 and appears in its own panel; the totals are not added together.
Donor contributions, including reported in-kind gifts, increased from $42.16 million in FY2016 to $171.17 million in FY2025. That increase accounts for 78.4% of the department’s total revenue growth over the period. Ticket revenue rose only 16.6%, from $60.87 million to $70.98 million. Fundraising drove most of the department’s revenue growth.1, 2
Seat-related gifts belong in NCAA contributions, even when donors pay them to obtain preferred ticket access. Ticket face value belongs in ticket sales. Adding a fundraising announcement to those two revenue lines can count the same economic relationship twice.7
What the Longhorn Foundation raises
The Longhorn Foundation is UT Athletics’ fundraising arm. Its annual-report production figures include cash and pledges; the FY2025 total is about $171 million. The $171 million tracks fundraising production. How much overlaps with the NCAA donor-revenue total remains unclear. Pledges, restricted capital gifts, endowment flows and current-year receipts have different recognition rules.8, 11
For valuation, the model provisionally removes $63 million of capital gifts, using the management cash presentation as a proxy, and removes the $3.38 million in-kind contribution line. The remaining contribution base is $104.79 million before assumed retention and growth. This estimated contribution base uses the cash presentation as a proxy. Verifying the overlap would require tracing the capital gifts into the NCAA statement.
The sponsorship line also requires restraint. NCAA category 15 combines royalties, licensing, advertising and sponsorship and can include products and services supplied in kind. The public total does not disclose the cash portion. The model uses it as a revenue proxy; it does not claim that every dollar becomes cash distributable to an investor.7
Texas One Fund can be measured only in part
Texas One Fund Inc., EIN 87-3873183, is an independent charity. Its publicly released IRS return reports the following:
| Calendar year | Revenue | Total expenses | Athlete appearance/contractor expense |
|---|---|---|---|
| 2022 | $5.32m | $0.61m | $0.42m |
| 2023 | $10.50m | $13.73m | $11.72m |
| 2024 | $16.51m | $17.57m | $14.54m |
The appearance amounts come from the filing’s contract-services schedule. The 2024 filing, submitted December 1, 2025, is a calendar-year, cash-accounting document.12
It does not encompass the for-profit TX1 Fund LLC or all individual athlete endorsement agreements. Those flows remain UNKNOWN. Nor can calendar-2024 charity spending be added to fiscal-2025 institutional NIL expense and presented as audited total athlete compensation.
How to account for the charity depends on each transaction. NCAA instructions can include affiliated or controlled entities and third-party transactions involving the department; they do not require adding every independently arranged endorsement. This report includes reported department transactions, also identifies the charity’s disclosed flows and leaves the undisclosed remainder unquantified.7, 12
3. Facilities and people absorb much of the income
The largest FY2025 uses were facilities, personnel and running competitions. Knight’s broad facilities, debt-service and equipment group totals $129.49 million. Coaching compensation was $57.05 million, other athletics staff compensation $50.28 million, and game expenses and travel $47.81 million. Athlete scholarships and related support were $22.61 million, with the new institutional NIL line reported at $3.24 million.2
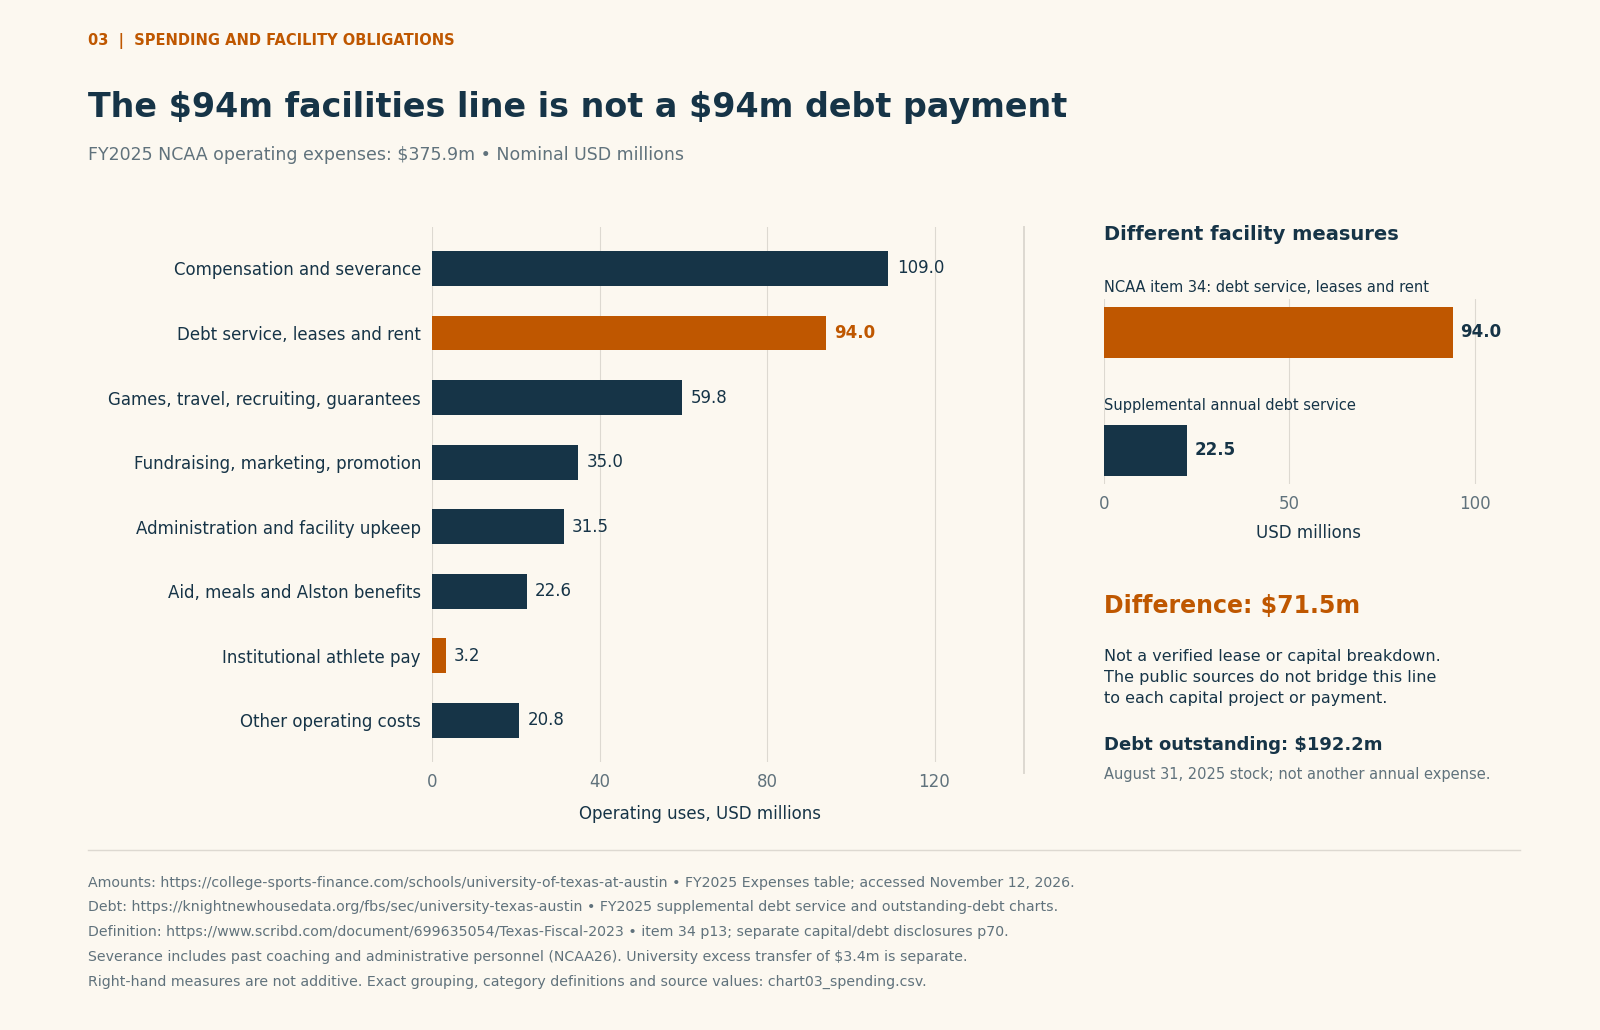
Chart 3. Source: FY2025 NCAA line items, Knight categories and supplemental debt fields. The broad facilities category, category 34, annual debt service and debt outstanding measure different things.
The $94 million line is not $94 million of annual debt service
Inside the broad facilities group, NCAA category 34—facility debt service, leases and rental fees—was $94.02 million. Supplemental annual debt service was $22.50 million; athletics debt outstanding was $192.17 million. The $71.52 million difference between category 34 and the supplemental debt-service figure is a calculated residual. Public records leave the split between recurring rent and project-related obligations unclear.2
The historical documents demonstrate why these classifications cannot be casually relabeled. UT’s FY2023 MFRS reported $20.43 million of capital expenditures, while category 34 was $26.05 million and supplemental debt service was $21.73 million. Its FY2020 agreed-upon-procedures statement says the university owns the plant assets and that changes in plant funds are outside that operating statement.13
Consequently, adding back the whole $94.02 million as “one-time capex” would be unsupported. Removing known debt service when valuing cash flow before financing is conceptually appropriate; deciding how much of the remaining obligation will persist requires more evidence. The model explicitly restores recurring rent, sustaining capital spending and a major-project funding gap, and tests higher obligations.
Moody Center illustrates the importance of defining operating rights as well as construction costs. UT’s announcement describes university ownership of the land and building alongside a private operating arrangement and reserved university use. An investor cannot assume that the venue’s gross construction cost, concert receipts and UT basketball receipts all belong to one freely saleable athletics asset.14
Coaching turnover is a recurring economic risk
Coaching compensation grew 135.6% over the ten-year series. Severance payments, whose NCAA definition includes former coaching and administrative personnel, totaled $53.48 million, averaging $5.35 million annually in nominal dollars. FY2025’s $1.63 million severance expense was well below that average. A valuation that capitalizes one unusually low buyout year as permanent savings overstates sustainable cash generation.
The base case replaces FY2025 severance with that ten-year average and escalates it to the forecast period. The reserve spreads the historical cost across the forecast period.
For a concrete compensation reference, the Regents’ February 2025 approved schedule lists Steve Sarkisian’s guaranteed annual compensation at $10.8 million for calendar 2025 and $11.05 million for 2026, before contingent items. These figures apply to Sarkisian’s contract.15
“Self-supporting” has a limited accounting meaning
The ten-year series reports zero student-fee revenue and zero institutional/government support in Knight’s harmonized categories, while recording $56.05 million of excess transfers back to the university. FY2025’s excess transfer was $3.40 million.1 The management cash presentation lists a $4.1 million administrative fee and $4.2 million of other transfers. Those amounts should not be added to the NCAA transfer without a reconciliation identifying overlaps.8
The reported flows leave open whether athletics pays market rates for university land, credit, administration or the benefits of institutional ownership and reputation. A documented cost allocation would be needed to identify any undisclosed cash subsidy.
4. Football supports the system; sport margins are not comparable corporate profits
Texas football reported FY2025 revenue of $181.06 million against $73.88 million of allocated expense. Men’s basketball reported $17.31 million against $22.40 million; women’s basketball reported $3.94 million against $10.90 million.3
The corresponding peer comparison is useful if its allocation limits stay visible:
| School | Football surplus | Men’s basketball surplus | Women’s basketball surplus |
|---|---|---|---|
| Texas ‡ | 107.18 | −5.09 | −6.97 |
| Ohio State | 68.21 | 8.86 | −5.61 |
| Alabama | 64.83 | 9.18 | −4.67 |
| Georgia | 78.18 | 5.68 | −4.00 |
| Michigan † | 113.64 | 8.51 | −4.63 |
| Texas A&M † | 48.24 | 1.42 | −5.61 |
FY2025 allocated revenue minus allocated expense, USD millions. † Michigan and Texas A&M sport figures are provisional public NCAA republications with cross-checks; complete original MFRS copies were not located. ‡ Texas sport figures use a public NCAA republication; football expense agrees with Knight. Original Ohio State, Georgia and Alabama documents were inspected.16
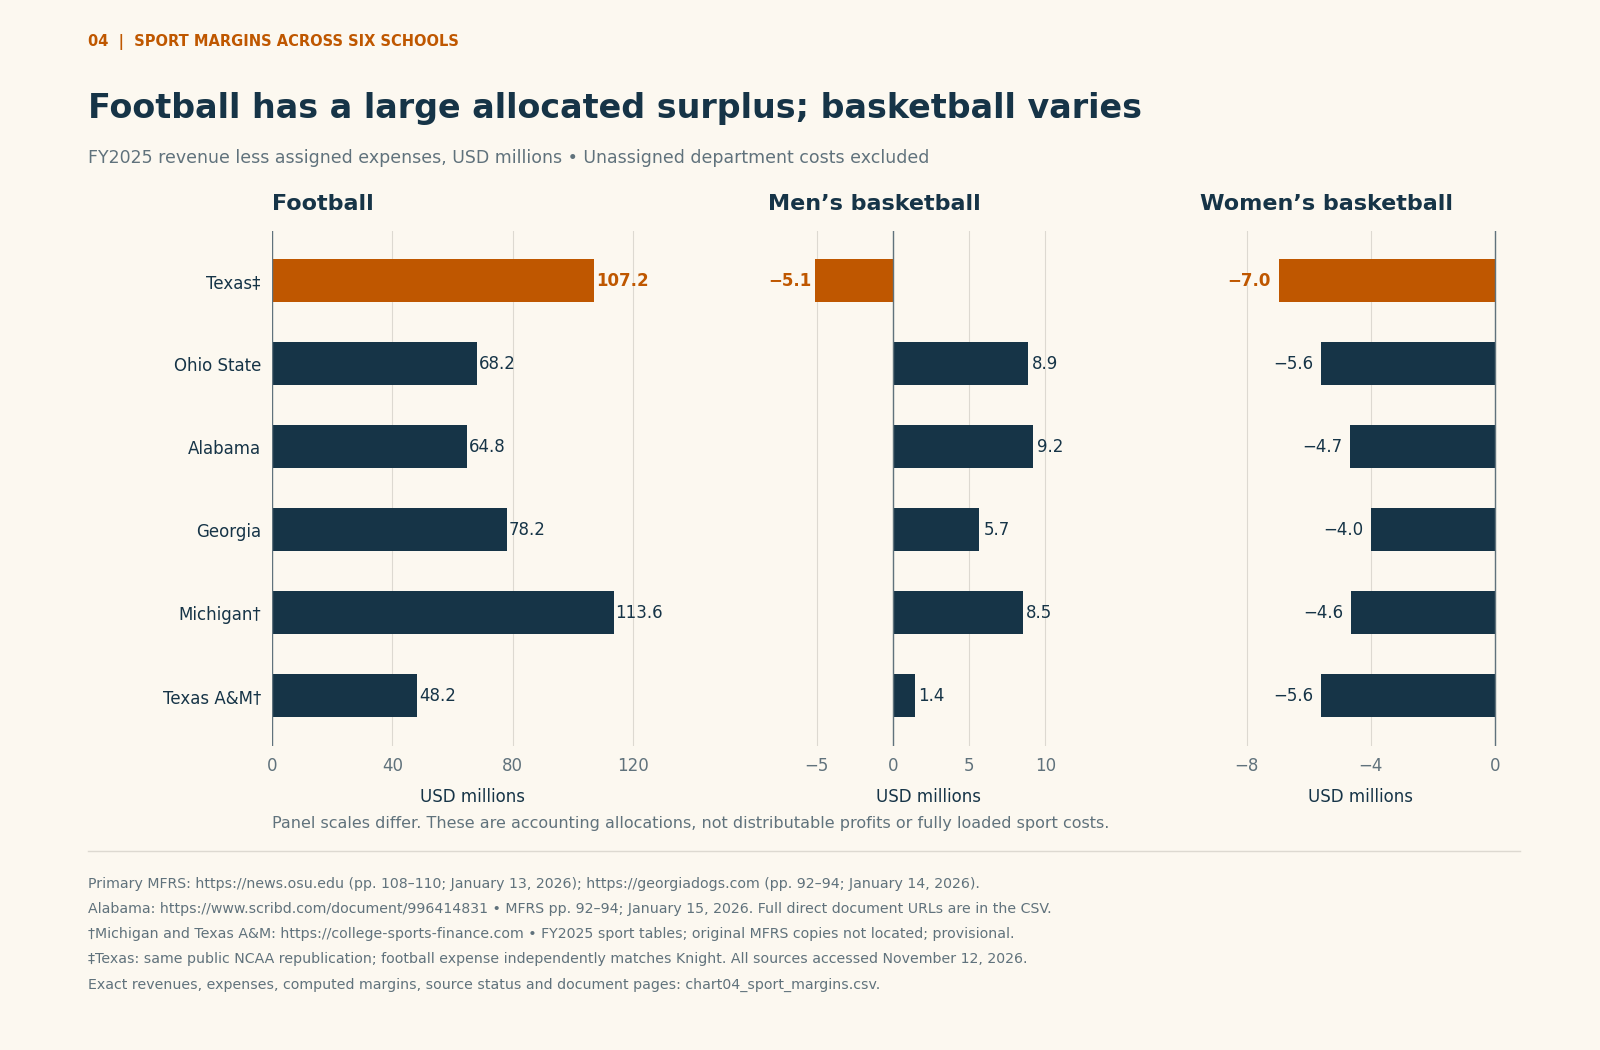
Chart 4. Football, men’s basketball and women’s basketball use different panel scales. The chart uses the reported allocations for each sport. Charges for facilities, administration and capital vary across the sports.
Every school in this comparison reports a large positive football allocation. Every school reports a negative women’s-basketball allocation. Texas men’s basketball is negative in this year while the other five are positive. These observations describe the financial statements; they do not measure educational value, fan welfare or the merit of maintaining a sport.
The source of apparent differences is not always operating efficiency. Ohio State assigned only $1.60 million of contributions to football and $64.01 million to nonprogram activity. Georgia assigned $44.14 million to football and $3.77 million to nonprogram activity. Applying a common football-profit multiple to those allocations would mistake accounting choices for differences in transferable earning power.16
Texas’s own calculated unallocated residual makes the same point. Subtracting published named-sport amounts from department totals leaves $129.34 million of revenue against $220.09 million of expense, a $90.76 million deficit. Subtracting that shared deficit from football’s surplus leaves far less room before the other sports, university transfer and investment requirements enter the calculation.
Other Texas sports also need recurring support under these allocations. FY2025 baseball’s deficit was $1.95 million; volleyball’s was $2.43 million; softball’s was $2.59 million. The workbook includes all other named sports and the ten-year history. It preserves combined sport groups where the source combines them and leaves the individual FY2017 men’s and women’s basketball figures unknown.3
There is an additional quality constraint: six older sport-level republication values disagreed with original UT statements. The delivered preferred data use the original-document values and record each change in a conflict table. No similarly complete original FY2024 or FY2025 UT sport statement was located, so the figures for those years remain uncertain.
5. SEC membership changes the recurring revenue base, but the transition is messy
UT joined the SEC for the 2024–25 academic year. Its first-year distribution is not a sensible steady-state media forecast. The SEC’s February 5, 2026 release reports an average $72.4 million for the 14 fully participating members, including bowl revenue kept by members, while Texas received $12.1 million of specified CFP, bowl and NCAA distributions. Texas and Oklahoma were outside that full-distribution average.17
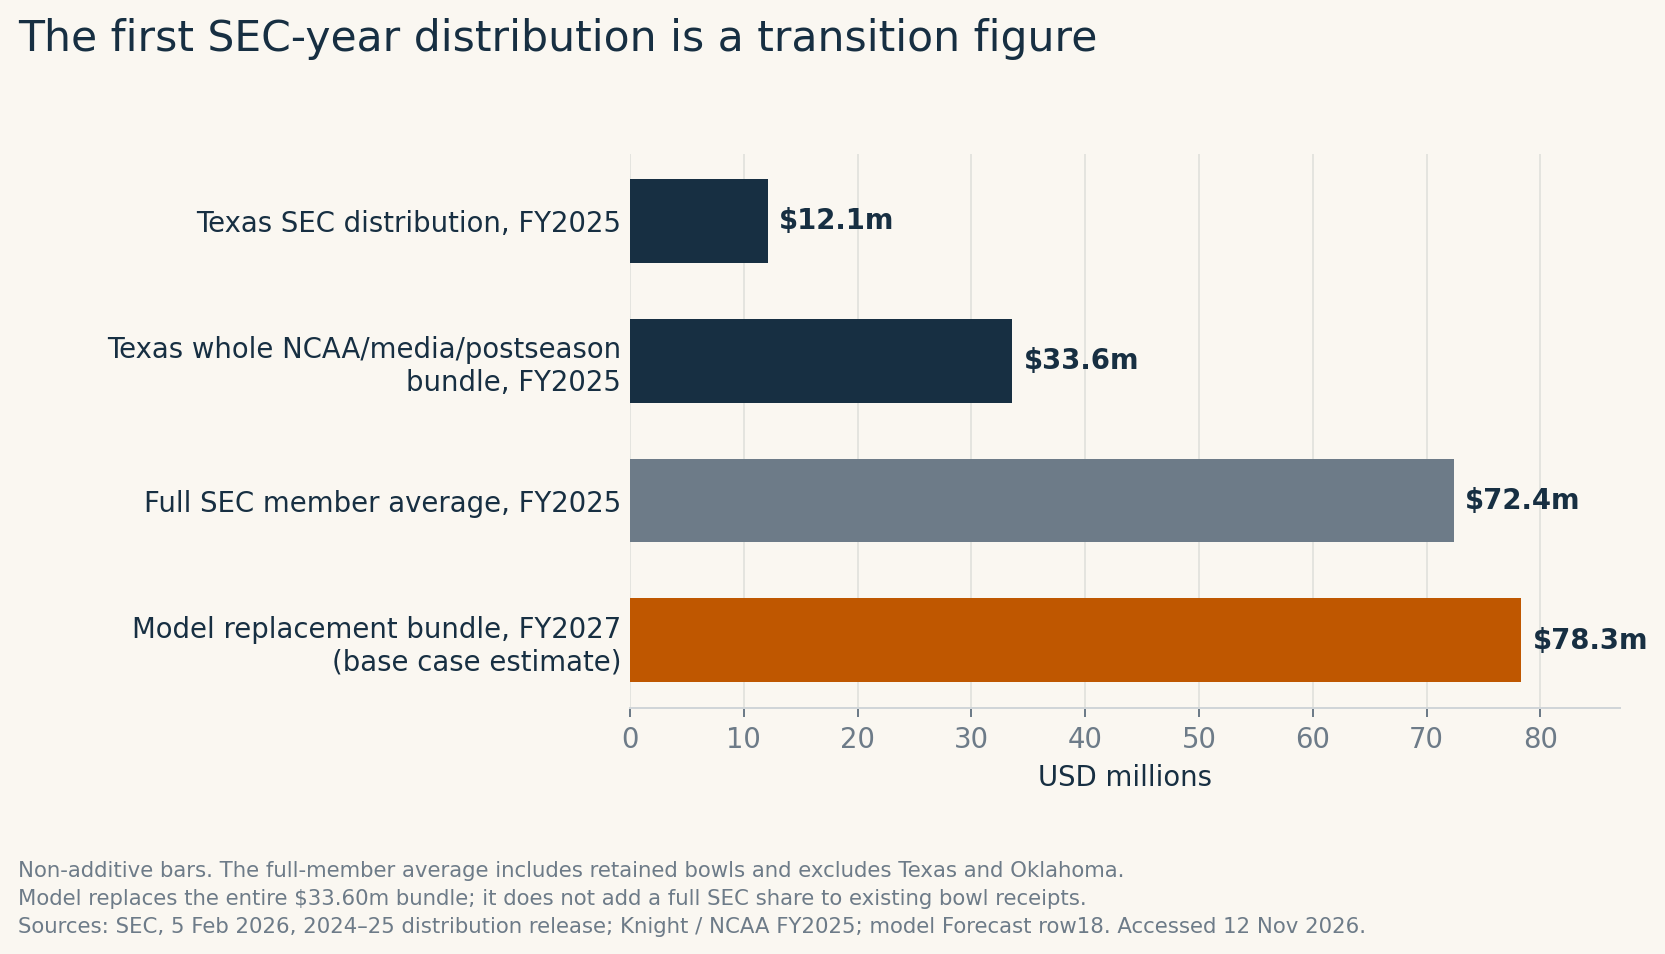
Chart 5. The bars are different measures and are not additive. The model estimates the FY2027 distribution.
The preceding transition year is different again: the SEC reported $27.5 million for Texas tied to transition television arrangements and application-fee returns. That payment should not be treated as a permanent annual supplement. Likewise, the Big 12’s announced $100 million of foregone distributions concerned Texas and Oklahoma together, with offsets; it was not a verified $100 million Texas expense.18
Longhorn Network changed form in July 2024. UT’s official announcement describes a free streaming service, while live event coverage moved into the SEC’s media arrangements. The primary documents examined here disclose neither a termination payment nor a continuing old-style annual LHN rights fee. The valuation therefore does not stack an assumed legacy LHN payment on top of a full SEC share.19
The model replaces the whole FY2025 $33.60 million conference/NCAA/media/postseason bundle with the $72.4 million benchmark. The base FY2027 replacement is $78.31 million, calculated as $72.4 million grown 4% for two years. This assumes Texas approaches the full-member economics and uses the average as a forecasting benchmark. Future distribution policy, postseason results and media escalators could make Texas’s eventual receipts different.
The main scenarios already include bowl revenue in the benchmark. The forecast is consequently sensitive to conference economics without treating overlapping revenue categories as independent cash streams.
6. Athlete pay adds a large cost, but the headline cap is easy to misread
The House framework began with a $20.5 million benefits pool for July 2025–June 2026. The current published cap is $21.58 million for July 2026–June 2027. Older estimates should not displace the College Sports Commission’s October 2026 announcement; a September Congressional Research Service analysis independently reports the same current amount.4, 20
The underlying formula uses 22% of specified average revenue for the defendant-conference institutions and Notre Dame. It is not 22% of Texas’s own $352.55 million revenue. Nor does every revenue category in UT’s financial statement enter that calculation.5
The settlement generally provides 4% annual growth between scheduled recalculations, with rules for stronger broadcast escalators and earlier resets. Scheduled recalculations occur in years four, seven and ten: 2028–29, 2031–32 and 2034–35. The increase from $20.5 million to $21.58 million already shows why simply multiplying an old estimate by 1.04 is inadequate. This report does not infer the Commission’s detailed calculation from that difference alone.
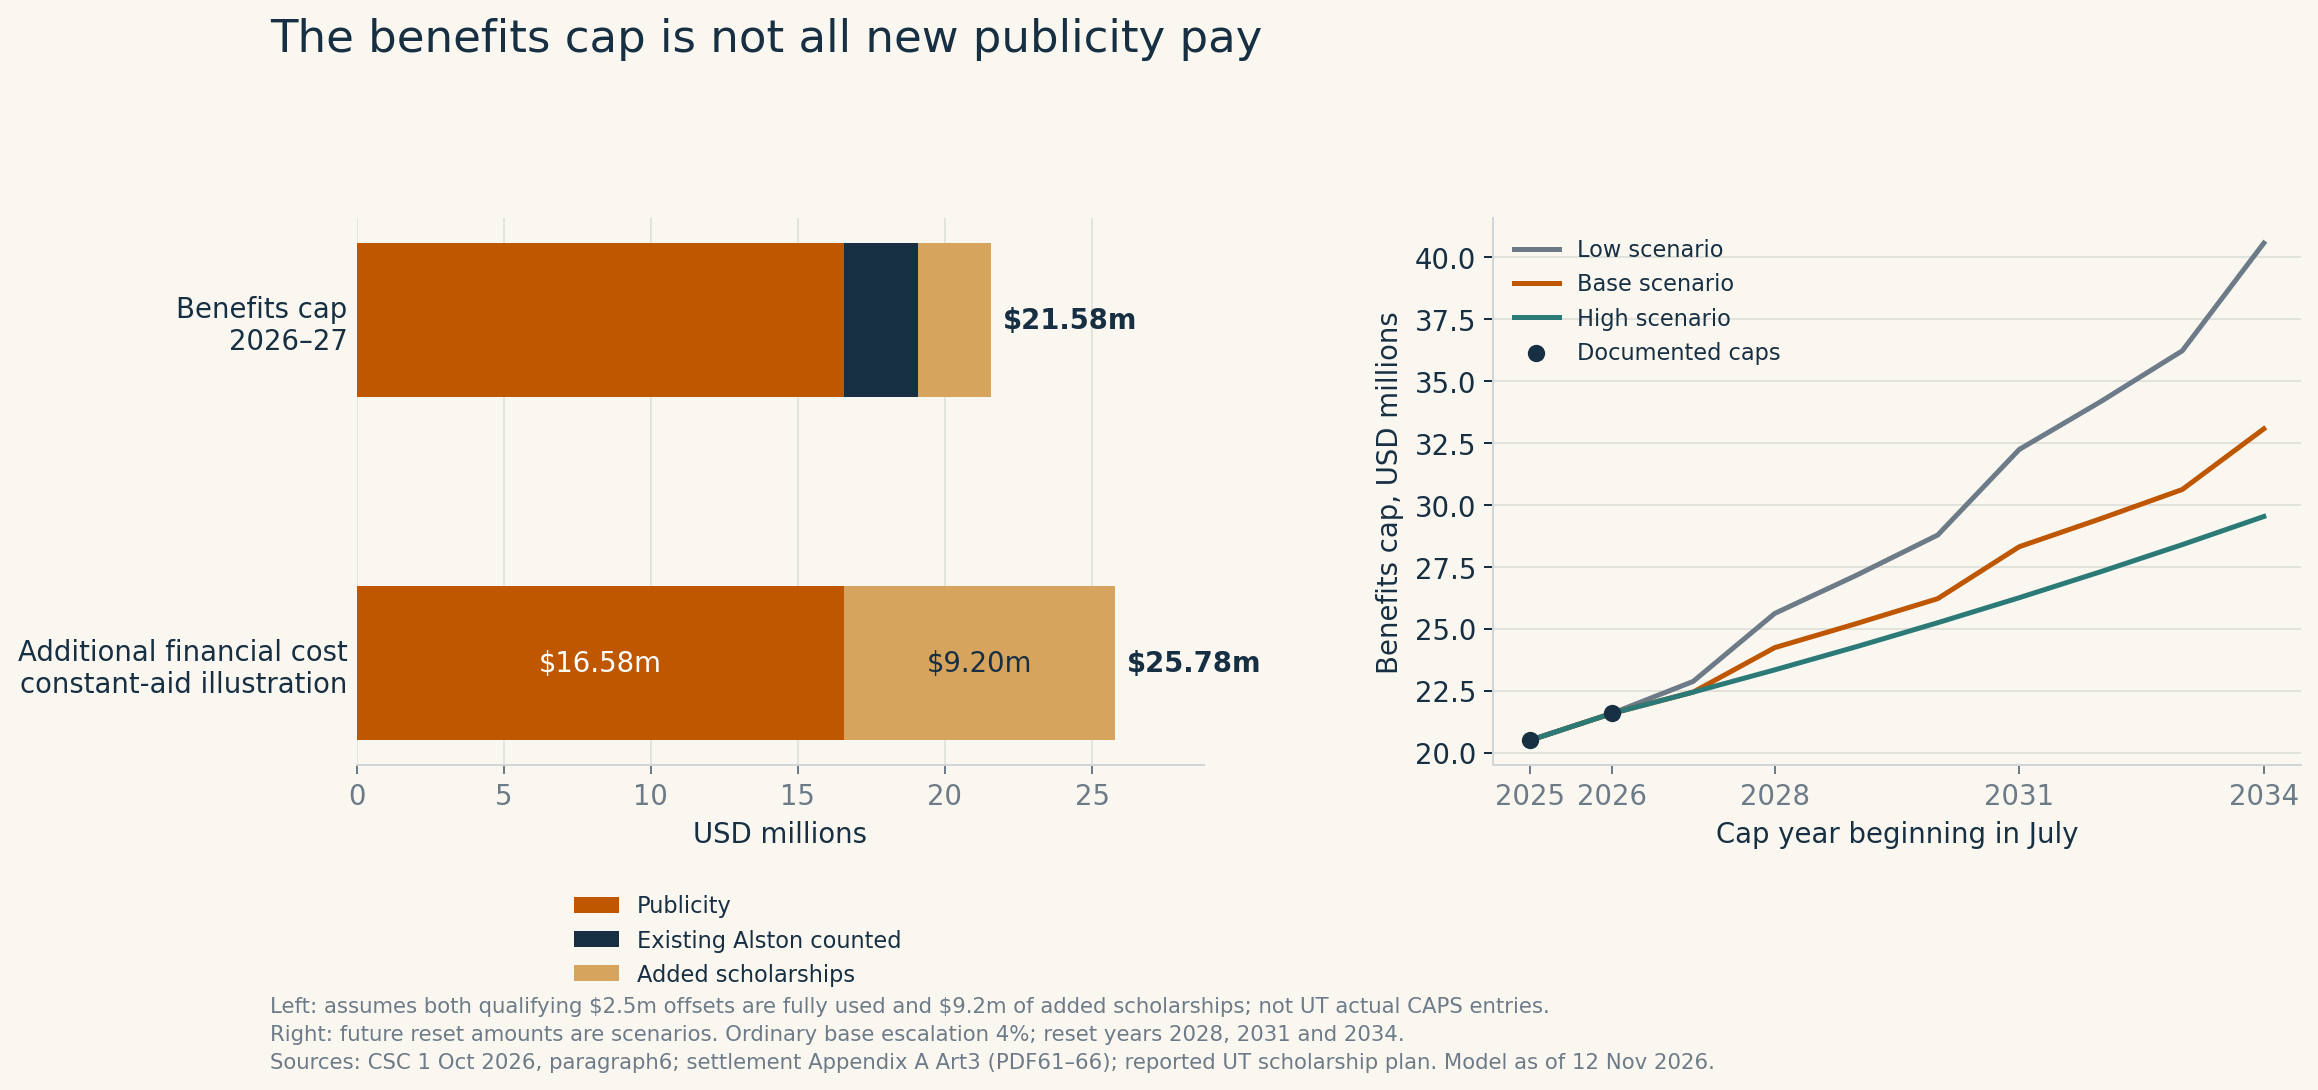
Chart 6. Current caps are documented. Future cap paths and the added-scholarship expense are scenario inputs. The left-hand expense illustration assumes full qualifying offsets.
How scholarships and Alston awards count toward the cap
NCAA implementation rules require qualifying Alston awards and qualifying incremental scholarships to count against the pool, initially up to $2.5 million each. These are not optional exclusions a school can disregard in order to pay the whole cap again in publicity payments.21
The model applies:
Publicity payments = benefits cap − qualifying Alston counted against the cap − qualifying new scholarships counted against the cap − other countable benefits.
Each offset is limited to qualifying benefits paid or provided and its applicable subcap. The two subcaps grow proportionally when the pool is recalculated; they do not automatically rise every ordinary year. Scholarship compliance value uses specified cost-of-attendance rules, which need not equal the university’s marginal cash cost. Public MFRS scholarship spending is therefore not sufficient to reconstruct UT’s CAPS ledger.5, 22
UT’s June 2025 statement committed to maximum permitted benefits and full scholarships across its 21 sports. The $9.2 million added-scholarship figure comes from the reported February town-hall plan, alongside roughly 200 additional scholarships; reporting and the reproduced presentation corroborate the amount. A final budget figure was unavailable. A later report used $10.5 million, which this model treats as a downside expense assumption.6
Using $9.2 million and full offsets, the annualized current-cap calculation is:
$21.58m − $2.50m − $2.50m + $9.20m = $25.78m.
The historical cost base already includes Alston expense. Adding it again would overstate the incremental charge. FY2025 also already contains $3.235 million of institutional NIL expense; the forecast removes that partial-year amount before adding a full payment stream.
UT’s fiscal year starts in September, while the cap year starts in July. With even monthly accrual, the illustrative FY2026 publicity amount is $15.680 million. Base FY2027 publicity is $16.724 million, and publicity plus the assumed $9.2 million added aid is $25.924 million. The amounts are expenses calculated under the model assumptions. Timing, qualifying scholarship value, other countable benefits and how much of the cap UT used remain unknown.
Newer EADA data do not settle the scholarship question: its athletic-aid total increased from $16.22 million in FY2025 to $18.19 million in FY2026, or $1.97 million, on that reporting basis. That is not proof that the reported $9.2 million plan was fully implemented, nor a direct measure of its incremental economic cost.10
Funding has a price and a limit
UT’s March 2025 announcement put the football-ticket increase at about $13 per home game, with seat gifts unchanged. In February 2026, UT announced an approximately 7% season-package increase, alongside a seventh home game, and committed to a price freeze through the 2028 football season.23
The base forecast therefore holds its $83 million ticket assumption flat in FY2028 and FY2029, resuming growth in FY2030. It does not turn a one-time adjustment or an extra game into a perpetual annual price increase. The $83 million starting point estimates ticket revenue for the whole department.
A stronger SEC revenue base, fundraising and cost control can fund athlete benefits. They do not guarantee surplus cash after facilities and other sports. External NIL activity can continue alongside publicity payments. The model leaves the total athlete payroll and any offset to collective spending unestimated.
Finally, the Senate passed the Protect College Sports Act in September 2026, but the current public status checked for this report leaves enactment unconfirmed. The model uses the proposed additional allowances to test higher expense. The settlement’s ten-year term also does not itself guarantee identical rules after June 2035; continuation beyond that date is an explicit valuation assumption.24
7. A franchise valuation must specify what an investor would own
Professional-team sales show that scarce, transferable sporting rights can command substantial prices. A public university department has a different set of rights and obligations from an NFL franchise.
| Transaction | Verified event and date | Price or valuation evidence | Valuation limitation |
|---|---|---|---|
| Denver Broncos | NFL-approved control sale, August 2022 | $4.65bn NFL-reported acquisition price | Debt, stadium perimeter and audited revenue denominator are not reconciled here. |
| Washington Commanders | NFL approval, July 20, 2023 | $6.05bn announced price | Transferable league franchise; not comparable university ownership. |
| Boston Celtics | Seller announcement, March 20, 2025; NBA approval in August | $6.1bn initial valuation for majority sale | Initial valuation is not the same as cash paid for a specified percentage. |
| Los Angeles Lakers | Majority transaction closed October 30, 2025 | $10bn valuation confirmed by transaction counsel | No verified revenue denominator or equity-to-enterprise bridge in the cited announcement. |
| Seattle Seahawks | Control sale closed September 3, 2026 | Team confirms closing; $9.612bn price reported by AP on NFL’s site | Primary team release does not disclose the price. |
| LAFC | Club confirms Carlos Vela’s ownership entry, March 2026 | Reported combined 6% stake purchased by three incoming investors at $1.25bn valuation | Price and stake size are secondary reports; no audited denominator. |
Sources and status distinctions: transaction announcements, league approvals and the delivered transaction ledger.25, 26, 27
The latest reported Lakers resale discussions are not treated as another closed comparable. More generally, multiplying a minority cheque by the inverse of its percentage can mislead when preferred returns, control rights, debt or capital commitments differ. A reported team valuation is not automatically enterprise value.
Houlihan Lokey’s public Fall 2024 review publishes estimated revenue multiples of 8.8× for the Broncos, 11.1× for the Commanders and 8.2× for the Mavericks. The adviser estimated the ratios using transaction and financial databases. The published figures describe professional franchises. Applying a multiple to UT requires assumptions about the rights and expenses an investor would take on.28
What college private-capital deals disclose
Utah’s June 2026 finalized arrangement with Otro Capital created Crimson Brand Partners to manage commercial activities including tickets, sponsorship, licensing, events and digital media. Coaching, recruiting, scheduling, athlete support, private fundraising and ownership of facilities remain with the university. The foundation keeps majority ownership and control under the disclosed structure.29
The private investor acquires commercial rights. The university keeps its varsity teams and campus assets. The disclosed material does not provide the full consideration, precise private stake, earnings waterfall and financial denominator needed to calculate a defensible transaction multiple. A financing envelope cannot fill that gap.
Similarly, RedBird’s public description confirms a completed Big 12 investment through Collegiate Athletic Solutions dated June 2026. It does not disclose a clean public equity price divided by a matching earnings or revenue base. Treating available credit or committed funding as the conference’s enterprise value would confuse financing with valuation.30
UT itself remains under public-university governance. Regents’ rules vest institutional responsibility and athletics oversight within that system; they do not create a presently marketable athletics share. This report does not assert that every commercial partnership is legally impossible. It does require a hypothetical investor to receive defined rights, approvals, duration, distribution priorities and obligations before those rights can be priced.31
The model’s perimeter
The modeled enterprise keeps all 21 sports, recurring university charges, athlete benefits, personnel-severance costs and necessary capital spending. It excludes a sale of campus land, the university’s general endowment, athlete endorsements arranged outside the department and a second legacy LHN revenue stream. The DCF includes recurring contributions that the hypothetical operator could continue to collect and athletics endowment distributions, conditional on university and donor permission. The revenue yardstick excludes those flows; the two approaches test different aspects of the hypothetical business.
For the revenue yardstick, commercial revenue excludes modeled cash donations and restricted endowment income. The resulting FY2027 commercial base is $240.18 million. For comparison, UT’s total FY2025 revenue was $352.55 million. Applying 2×, 3× and 4× to each scenario’s corresponding commercial base yields the $459 million–$1.003 billion range.
Those multiples are analyst assumptions, deliberately below the published professional-team ratios. The discount reflects uncertain transferability, public control, donor restrictions, all-sport obligations and rising athlete costs. There is no evidence precise enough to justify assigning an empirical percentage discount to each risk. The cash-flow model is the stronger test of whether the resulting revenue value could support an investor distribution.
Decisive assumptions
| Assumption | Low | Base | High |
|---|---|---|---|
| FY2027 tickets, $m | 78.00 | 83.00 | 88.00 |
| Recurring donor retention | 85.0% | 95.0% | 100.0% |
| Annual donor growth | 2.0% | 3.0% | 4.0% |
| Annual sponsorship / media growth | 2.0% | 4.0% | 6.0% |
| Annual core-cost growth | 5.0% | 3.5% | 3.0% |
| Temporary FY2025 cost addback, $m | 0.00 | 15.00 | 23.00 |
| FY2027 recurring rent, $m | 8.00 | 5.00 | 4.00 |
| Buyout reserve, FY2025 $m | 7.00 | 5.35 | 3.00 |
| Added scholarships, $m | 10.50 | 9.20 | 9.20 |
| Sustaining capex, $m | 25.00 | 20.00 | 15.00 |
| Annual net major-project gap, FY2027–31, $m | 20.00 | 10.00 | 0.00 |
| Ordinary cap growth / reset-year growth | 6% / 12% | 4% / 8% | 4% / 4% |
| Discount rate | 14.0% | 12.0% | 10.0% |
| Terminal growth | 2.0% | 2.5% | 3.0% |
| Commercial-revenue multiple | 2× | 3× | 4× |
All forward values are estimates. Cost addbacks are in FY2025 dollars; recurring costs and capex are FY2027 amounts unless stated. The base buyout reserve is the reported ten-year average, escalated to FY2027. “Low” means adverse for investor value, so athlete-pay escalation is higher.
Two adjustments deserve particular skepticism. First, removing the full FY2025 facility line and restoring only $5 million of base recurring rent is a large normalization. The model also charges $20 million of sustaining capex and a $10 million annual net major-project funding gap for five forecast years. Even so, no public bridge proves those amounts capture all continuing obligations.
Second, the base removes $15 million of assumed temporary FY2025 operating costs. Public reporting describes temporary fundraising and production pressures, but no retrieved primary schedule quantifies that amount. The zero-addback case shows the result if all of those costs recur. The $63 million capital-gift removal is similarly provisional.
Cash flow provides a demanding cross-check
The forecast runs FY2027–FY2036. The table shows full-year FY2027 forecasts; the valuation includes only the prorated remaining-year cash flow after November 12, 2026. All cash flows are discounted to that date. Free cash flow equals operating surplus less hypothetical cash tax, sustaining capex, the net major-project gap and working-capital investment.
The illustrative taxable operator pays 25% on positive operating surplus after a depreciation proxy equal to sustaining capex. The workbook also shows the valuation with zero cash tax. Working capital consumes 1% of incremental revenue. Debt service is excluded from these pre-financing cash flows; the equity calculation deducts debt once.
| USD millions | Low | Base | High |
|---|---|---|---|
| FY2027 normalized revenue | 325.89 | 349.46 | 367.93 |
| FY2027 operating surplus before capex/tax | −22.54 | 32.13 | 65.34 |
| FY2027 free cash flow | −67.93 | −1.53 | 36.93 |
| Commercial-revenue yardstick | 459.24 | 720.55 | 1,003.39 |
| Signed cash-flow present value | −1,074.69 | −3.59 | 946.74 |
| Positive distributable value convention | 0.00 | 0.00 | 946.74 |
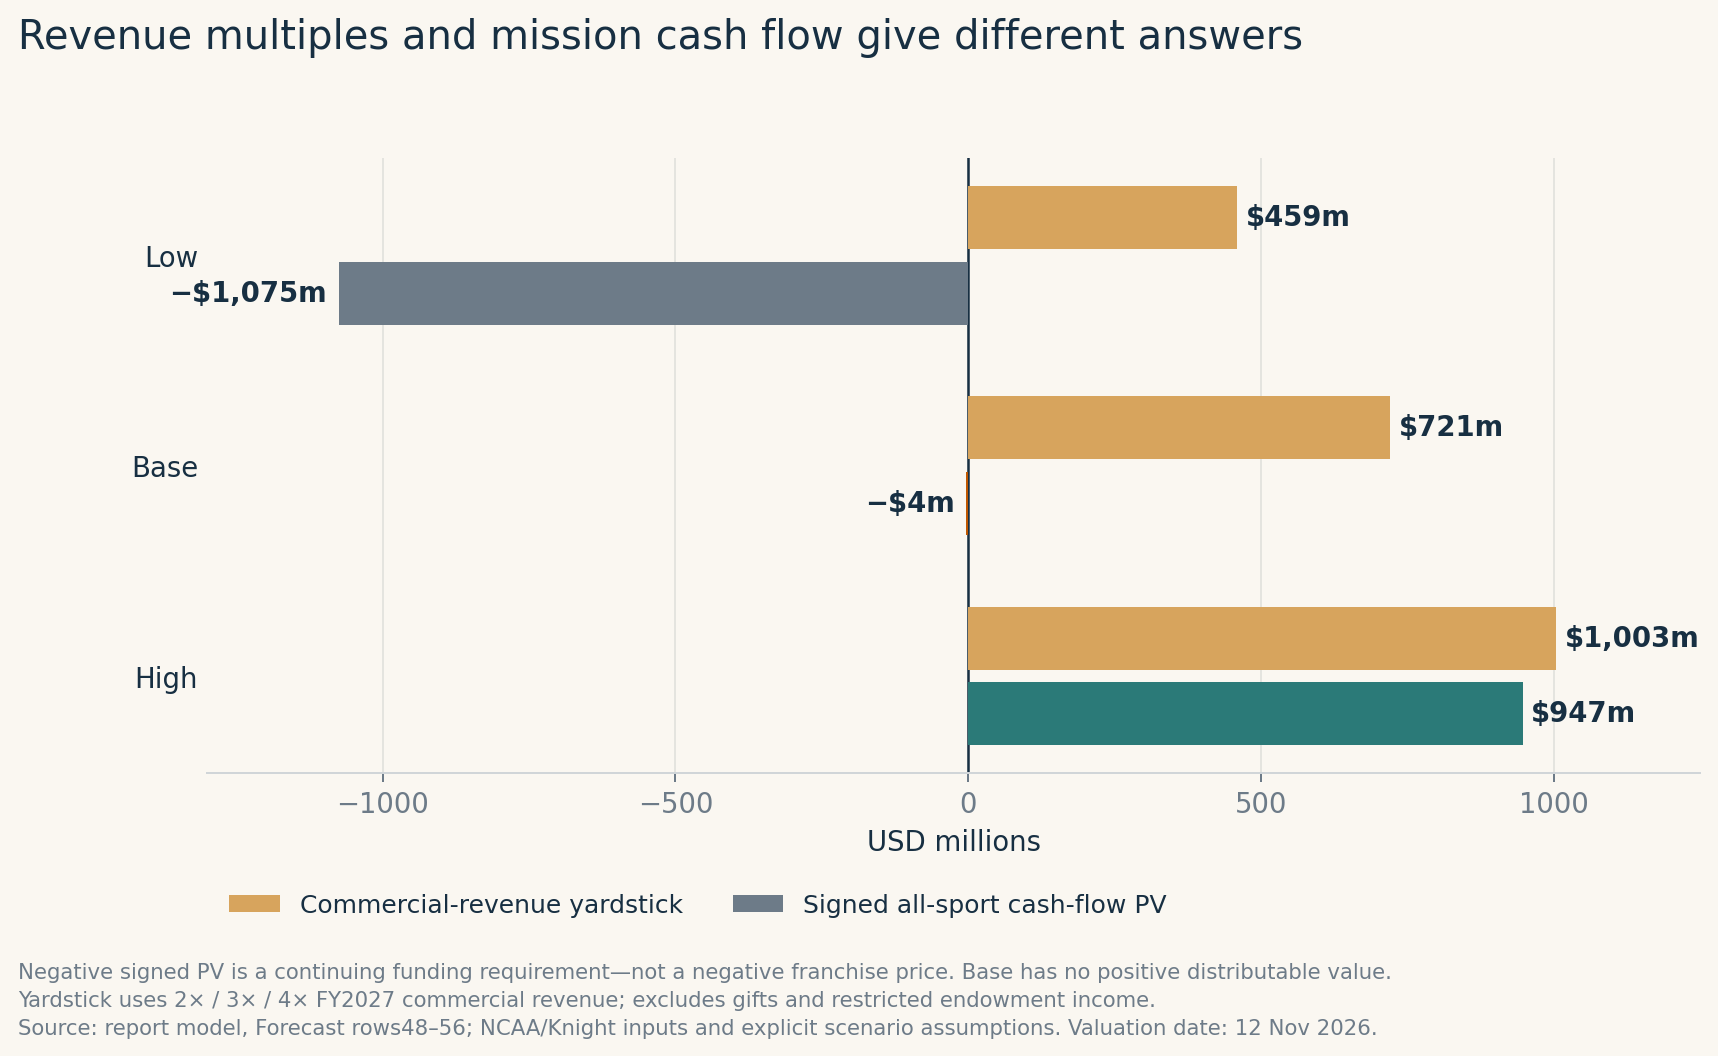
Chart 7. A negative cash-flow present value measures the funding the operator would need under the assumed continuing mission. The revenue yardstick and DCF appear side by side.
The base produces $32.13 million of FY2027 operating surplus before financing, capital spending and tax, but negative $1.53 million of free cash flow after modeled taxes, reinvestment and working capital. Its signed DCF is negative $3.59 million, sufficiently close to zero that small changes dominate the result. It provides no persuasive support for a $721 million cash-distributing enterprise.
The high case reaches $946.74 million, with $36.93 million of FY2027 free cash flow. It assumes full retention of the estimated recurring gift base, faster sponsorship and media growth, slower cost growth, lower capital needs and no net major-project funding gap. About 61.7% of that value comes from the terminal period. The upside is possible within the stated model; the outcome depends on assumptions beyond the current filings.
The low case’s negative $1.075 billion signed present value is the modeled cost of continuing obligations as expenses outrun receipts. It is not an appraisal saying the university owes a buyer that amount. Showing zero positive distributable value is only a reporting convention; it does not erase the funding need or assert that the Longhorn brand has no value.
If all reported FY2025 athletics debt of $192.17 million were assigned to the hypothetical operator, the high-case value remaining after that debt would be $754.58 million, before any cash adjustment. Unrestricted cash, debt assignment and transaction expenses are unknown. That subtraction shows the value remaining under the assumed debt assignment.
8. The evidence that could change the conclusion
Small changes in operating assumptions can move the valuation sharply. It is the ability to identify which documents and operating outcomes would change the answer.
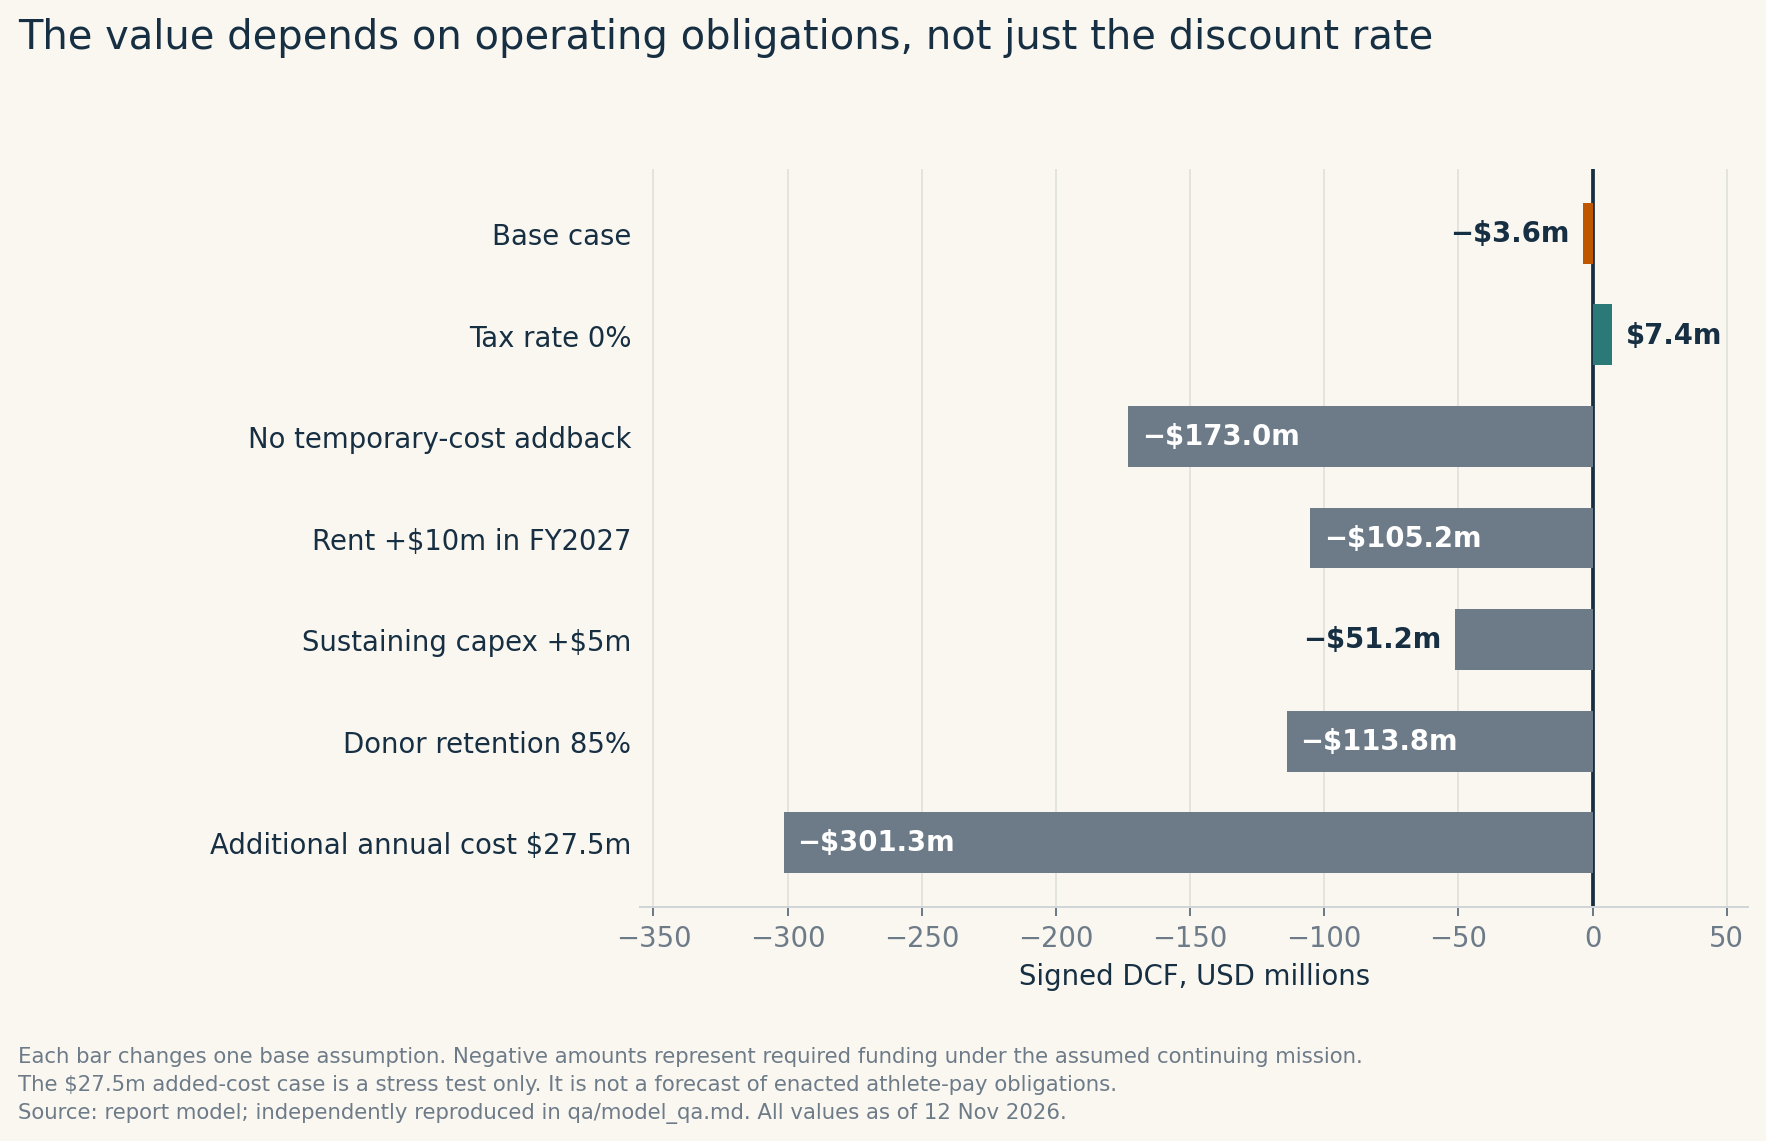
Chart 8. One assumption changes at a time. Added annual costs grow with the base operating-cost assumption unless otherwise specified. Source: workbook calculations, independently reproduced.
| One change to the base case | Signed cash-flow present value |
|---|---|
| Base assumptions | −$3.59m |
| Tax rate reduced to zero | +$7.43m |
| No $15m temporary-cost addback | −$172.99m |
| Recurring rent $10m higher in FY2027 | −$105.24m |
| Sustaining capex $5m higher in FY2027 | −$51.17m |
| Keep 85% of the recurring gift base versus 95% in the base case | −$113.82m |
| Add $27.5m of annual operating cost as a policy stress | −$301.34m |
The $27.5 million stress is not a forecast of enacted law or observed incremental payroll. It tests how additional permitted benefits could affect value if Texas chose or had to fund them without matching revenue. Likewise, a lower tax rate cannot rescue a business whose principal constraint is recurring expenditure.
The terminal assumption is another limitation. Base free cash flow weakens late in the explicit forecast, but the terminal formula assumes it subsequently grows 2.5%. At zero terminal growth the base signed DCF is negative $4.79 million; omitting terminal value entirely gives negative $8.87 million. The near-zero base conclusion survives those alternatives. A long-term agreement with a fixed end date would require a valuation limited to that term.
Four evidence packages would matter most:
- A facility cash-obligation bridge. A schedule connecting NCAA category 34, debt service, leases, project payments and restricted gifts could validate or overturn the largest normalization. More enduring obligations would reduce value; a documented end to substantial temporary payments would strengthen it.
- A full post-transition operating year. FY2026 and later NCAA reports, matched to reported SEC distributions, would show whether recurring media gains and athlete expenses move as modeled. The current EADA report signals cost pressure. A reconciliation would show how it connects to the NCAA accounts.
- Benefits paid and donor restrictions. UT’s cap-year totals, qualifying scholarship values, gift restrictions and permission to route donor income to a commercial operator would replace assumptions about offsets and contributions that the operator could continue to collect.
- A genuinely comparable capital transaction. Disclosed consideration, ownership percentage, debt, preferred returns, rights duration and matching financials would permit an observed college-sports multiple. A financing headline alone would not.
Independent checks on the three headline numbers
| Headline | Check performed | What the check covers |
|---|---|---|
| $352.55m FY2025 revenue | Direct Knight extraction versus independent summation of the public NCAA line-item republication | Exact agreement at $352,547,602. The two extractions use the same underlying filing. UT’s different management presentation remains explicitly unreconciled. |
| $21.58m current benefits cap | CSC’s October release versus September CRS analysis; treatment checked against settlement and adopted NCAA rules | Corroborates the published cap; CRS also cites CSC, so this is not a second calculation of the underlying conference averages. Does not disclose UT’s allocation. |
| $721m base revenue yardstick / near-zero base DCF | An independent cash-flow calculation, a live formula workbook and a comparison with transaction context | Arithmetic agrees; economics do not converge. Only the optimistic case supports value near $1bn. This is evidence against presenting the yardstick as a verified market price. |
Texas’s business strength is clear in its ability to attract ticket buyers, sponsors and donors. Its investor economics are less clear because a public athletics department converts that strength into teams, facilities, educational benefits and competitive spending. The next valuation question is the contractual one: which cash flows could an investor receive, after which obligations, for how long? Until those rights are defined and the facility bridge is documented, a single confident franchise price would conceal more than it explains.
Sources, document locations and reproducibility
The evidence and valuation date is November 12, 2026. FY2025 ended August 31, 2025 unless a source uses a different period. Dollar amounts are nominal U.S. dollars. Page references are document pages unless a PDF page is specified. The downloadable source CSVs list exact URLs, source dates, tags, original labels and uncertainty. The workbook has sheets for sourced inputs, one editable forecast, scenario calculations and outputs. Each chart has a PNG, SVG and underlying CSV.
- Knight-Newhouse, University of Texas at Austin, FY2016–FY2025 revenue, expense, transfer, football, debt and debt-service charts; methodology. Exact annual chart responses were re-extracted. The package’s history CSV gives the year and chart tag. Knight adds harmonized excess transfers to its expense total. ↩
- College Sports Finance, Texas FY2025 totals and line-item detail, revenue and expense tables; the same public year selector supplies 2016–2024. The public site republishes NCAA data. The raw file preserves its labels; the preferred file updates obsolete FY2025 labels using original NCAA definitions. No complete original UT FY2024/FY2025 MFRS copy was located. ↩
- Public NCAA sport republications: football, men’s basketball, women’s basketball and the other sport URLs in
history_source_ledger.csv. FY2016 cross-check: Texas Tribune’s published NCAA database. Unallocated amounts are department totals less named sport totals. ↩ - College Sports Commission, first-year revenue-sharing announcement, published October 1, 2026, paragraphs 3 and 6. States $20.5m prior cap and $21.58m current cap; distinguishes institutional payments from third-party NIL. ↩
- Fourth Amended House Settlement, filed May 7, 2025, Appendix A, Article 3 §§1 and 3, PDF pp61–66: revenue pool, growth/recalculations and offsets. Article 9, PDF p84: term and subsequent negotiation. Model reset growth and continuation after June 2035 are assumptions. ↩
- UT, Forty Acres Insider, June 10, 2025, maximum permitted benefits/full scholarships commitment. Numerical plan: February 26, 2025 town hall, with reporting and reproduced presentation in On3, February 27, 2025. Exact source URLs and the later $10.5m secondary estimate appear in
sources_pay_rights.csv. The $9.2m is a reported plan, with FY2026 spending unverified. ↩ - NCAA, Financial Reporting System, FY2026 deadline; Agreed-Upon Procedures guidance, pp7–12 reporting perimeter, pp18–30 categories, p47 collective-related scope. AUP reporting is not an audit opinion on standalone corporate earnings. Categories 8, 15, 34, 43 and institutional NIL are treated differently. ↩
- UT Athletics, 2024–25 Annual Report, published January 27, 2026, PDF p25 / printed p23 for financial sources/uses; printed pp24–25 for fundraising production. Capital gifts $63.0m, capital projects $76.7m and debt service $21.4m come from this presentation. A reconciliation to the MFRS remains unavailable. ↩
- UT System, FY2025/FY2024 audited financial statements, auditor’s report dated December 11, 2025, publicly released December 12; auditor’s opinion PDF pp5–7; UT Austin supplementary statements PDF pp163–165 / printed pp161–163. The audit opinion is on the System’s consolidated statements; institution schedules are supplementary information. ↩
- UT official FY2025 EADA, October 15, 2025, pp7 and 9; FY2026 EADA, October 28, 2026, pp7 and 9. The report uses these exact published versions; later federal/aggregator FY2025 extracts differ and are not silently substituted. ↩
- UT, Longhorn Foundation mission, February 22, 2021, official fundraising-arm description; UT annual report cited above. NCAA contributions and gift-production announcements have different recognition rules. ↩
- Texas One Fund Inc., calendar-2024 rendered public IRS Form 990, submitted December 1, 2025 according to IRS document metadata; Part I lines12/18 and Schedule O, Part IX line11g. Organization filing index links 2022/2023 returns. Exact IRS document identifiers and schedule URLs are in
texas_one_fund_990_raw.csv. ↩ - UT, FY2023 MFRS public copy, AUP issued January 10, 2024, item34 and p70 supplemental items52/54/56; FY2020 AUP public copy, pp10–14, especially note1 p13; FY2019 statement, pp10–14. Copies were read freely; Scribd’s generated titles are not treated as source descriptions. ↩
- UT Texas Connect, Moody Center partnership details, May 4, 2022, ownership, private operation and university-use provisions. Construction cost is not added to the franchise valuation. ↩
- UT Regents, February 2025 meeting minutes, February 20, 2025, printed p163, approved football-head-coach guaranteed compensation schedule. ↩
- Ohio State, FY2025 NCAA report, AUP January 13, 2026, pp107–110; Georgia, FY2025 NCAA report, AUP January 14, 2026, pp91–94; Alabama, published FY2025 report, AUP January 15, 2026, pp92–94. Public republications for Michigan and Texas A&M, FY2025 sport tables; all basketball URLs and cross-checks are in
peer_sports_fy2025.csv. Michigan official EADA, pp8–9/12, checks football but does not remove all basketball differences. ↩ - SEC, 2024–25 revenue distribution, February 5, 2026; full-member average and Texas/Oklahoma paragraphs in the public page’s complete text. The $72.4m includes bowl revenue kept by members. ↩
- SEC, 2023–24 distribution release, February 6, 2025, Texas/Oklahoma transition paragraph; Big 12, withdrawal agreement announcement, February 9, 2023, combined foregone distributions and offsets. ↩
- UT/Longhorn Network, LHN streaming-service relaunch, June 24, 2024. ESPN’s December 10, 2020 agreement announcement gives the agreement term as 2024–25 through 2033–34. The model excludes the unverified reported contract price. ↩
- Congressional Research Service, The Protect College Sports Act of 2026: Potential Implications for Title IX, September 23, 2026, LSB11484, free public copy of CRS text, current benefits-cap discussion. This is a primary government analysis reproduced by a public archive. ↩
- NCAA, adopted Proposal 2025-10, Bylaw16.13, particularly 16.13.1.3–.4: mandatory counting of qualifying new scholarships and Alston awards, subject to their subcaps. ↩
- NCAA, February 11, 2026 implementation Q&A, p5 A13, pp20–22 designated athletes, pp27–30 D7–D13: cap accounting, scholarship valuation and Alston treatment. ↩
- UT, Forty Acres Insider, March 4, 2025, ticket increase; February 10, 2026, seventh home game, approximately 7% season increase, unchanged seat gifts and freeze through 2028. ↩
- Congress, S.4668, Senate-passed text, September 28, 2026; Senate Commerce Committee, passage announcement, states that the bill moves to the House. No enacted-law premise is used in the model; post-settlement continuation and added-cost stress are labeled assumptions. ↩
- NFL, Commanders sale approval, July 20, 2023; Broncos approval and price, August 9, 2022. Boston Basketball Partners, seller announcement, March 20, 2025; NBA approval, August 13, 2025. ↩
- ArentFox Schiff, Lakers transaction-counsel statement, confirms $10bn valuation and October 30, 2025 closing; NBA approval. Seahawks, closing announcement, September 3, 2026; NFL-hosted AP price report. October 30, 2026 Lakers resale status reporting is documented as an announced transaction. ↩
- LAFC, Carlos Vela joins ownership group, March 2026; secondary price/stake report. The club confirmation alone does not verify the reported transaction economics. ↩
- Houlihan Lokey, Sports Market Update, Fall 2024, pp23 and 53, selected franchise valuation/revenue multiples and underlying source notes. The adviser publishes estimated revenue denominators. ↩
- University of Utah, Crimson Brand Partners finalized, June 12, 2026; governance and functions kept by the university, January 9, 2026. Financial consideration and a usable transaction multiple remain undisclosed in the retrieved primary material. ↩
- RedBird Capital, Collegiate Athletic Solutions, Big 12 transaction description, June 2026. Financing capacity is not treated as equity consideration or enterprise value. ↩
- UT Regents, Rule 20201, Presidents, amended November 20, 2025, §4.13 athletics responsibility; Rule 10101, Board authority and state-property governance. The valuation assumes a hypothetical approved operating arrangement; it does not assert a currently saleable ownership interest. ↩
Supporting material
- Excel model ↗Sourced inputs, live calculations and reported outputs.
- Source and model data (CSV collection) ↗Data tables, source references and calculation exports.
- History source ledger ↗Download as CSV.