Texas public finance
Can Austin finance its first light-rail line?
The base case assumes a $4.07 billion federal grant and $3.32 billion in peak borrowing. Its cash cushion falls to $14.8 million after opening.
Austin’s 9.8-mile first phase can meet its payments in the base case if the requested $4.07 billion federal grant comes through. The model also assumes City tax transfers grow, construction stays near the current estimate and lenders accept the borrowing structure. Accumulated cash covers a recurring revenue shortfall in the first years of grant-bridge borrowing.
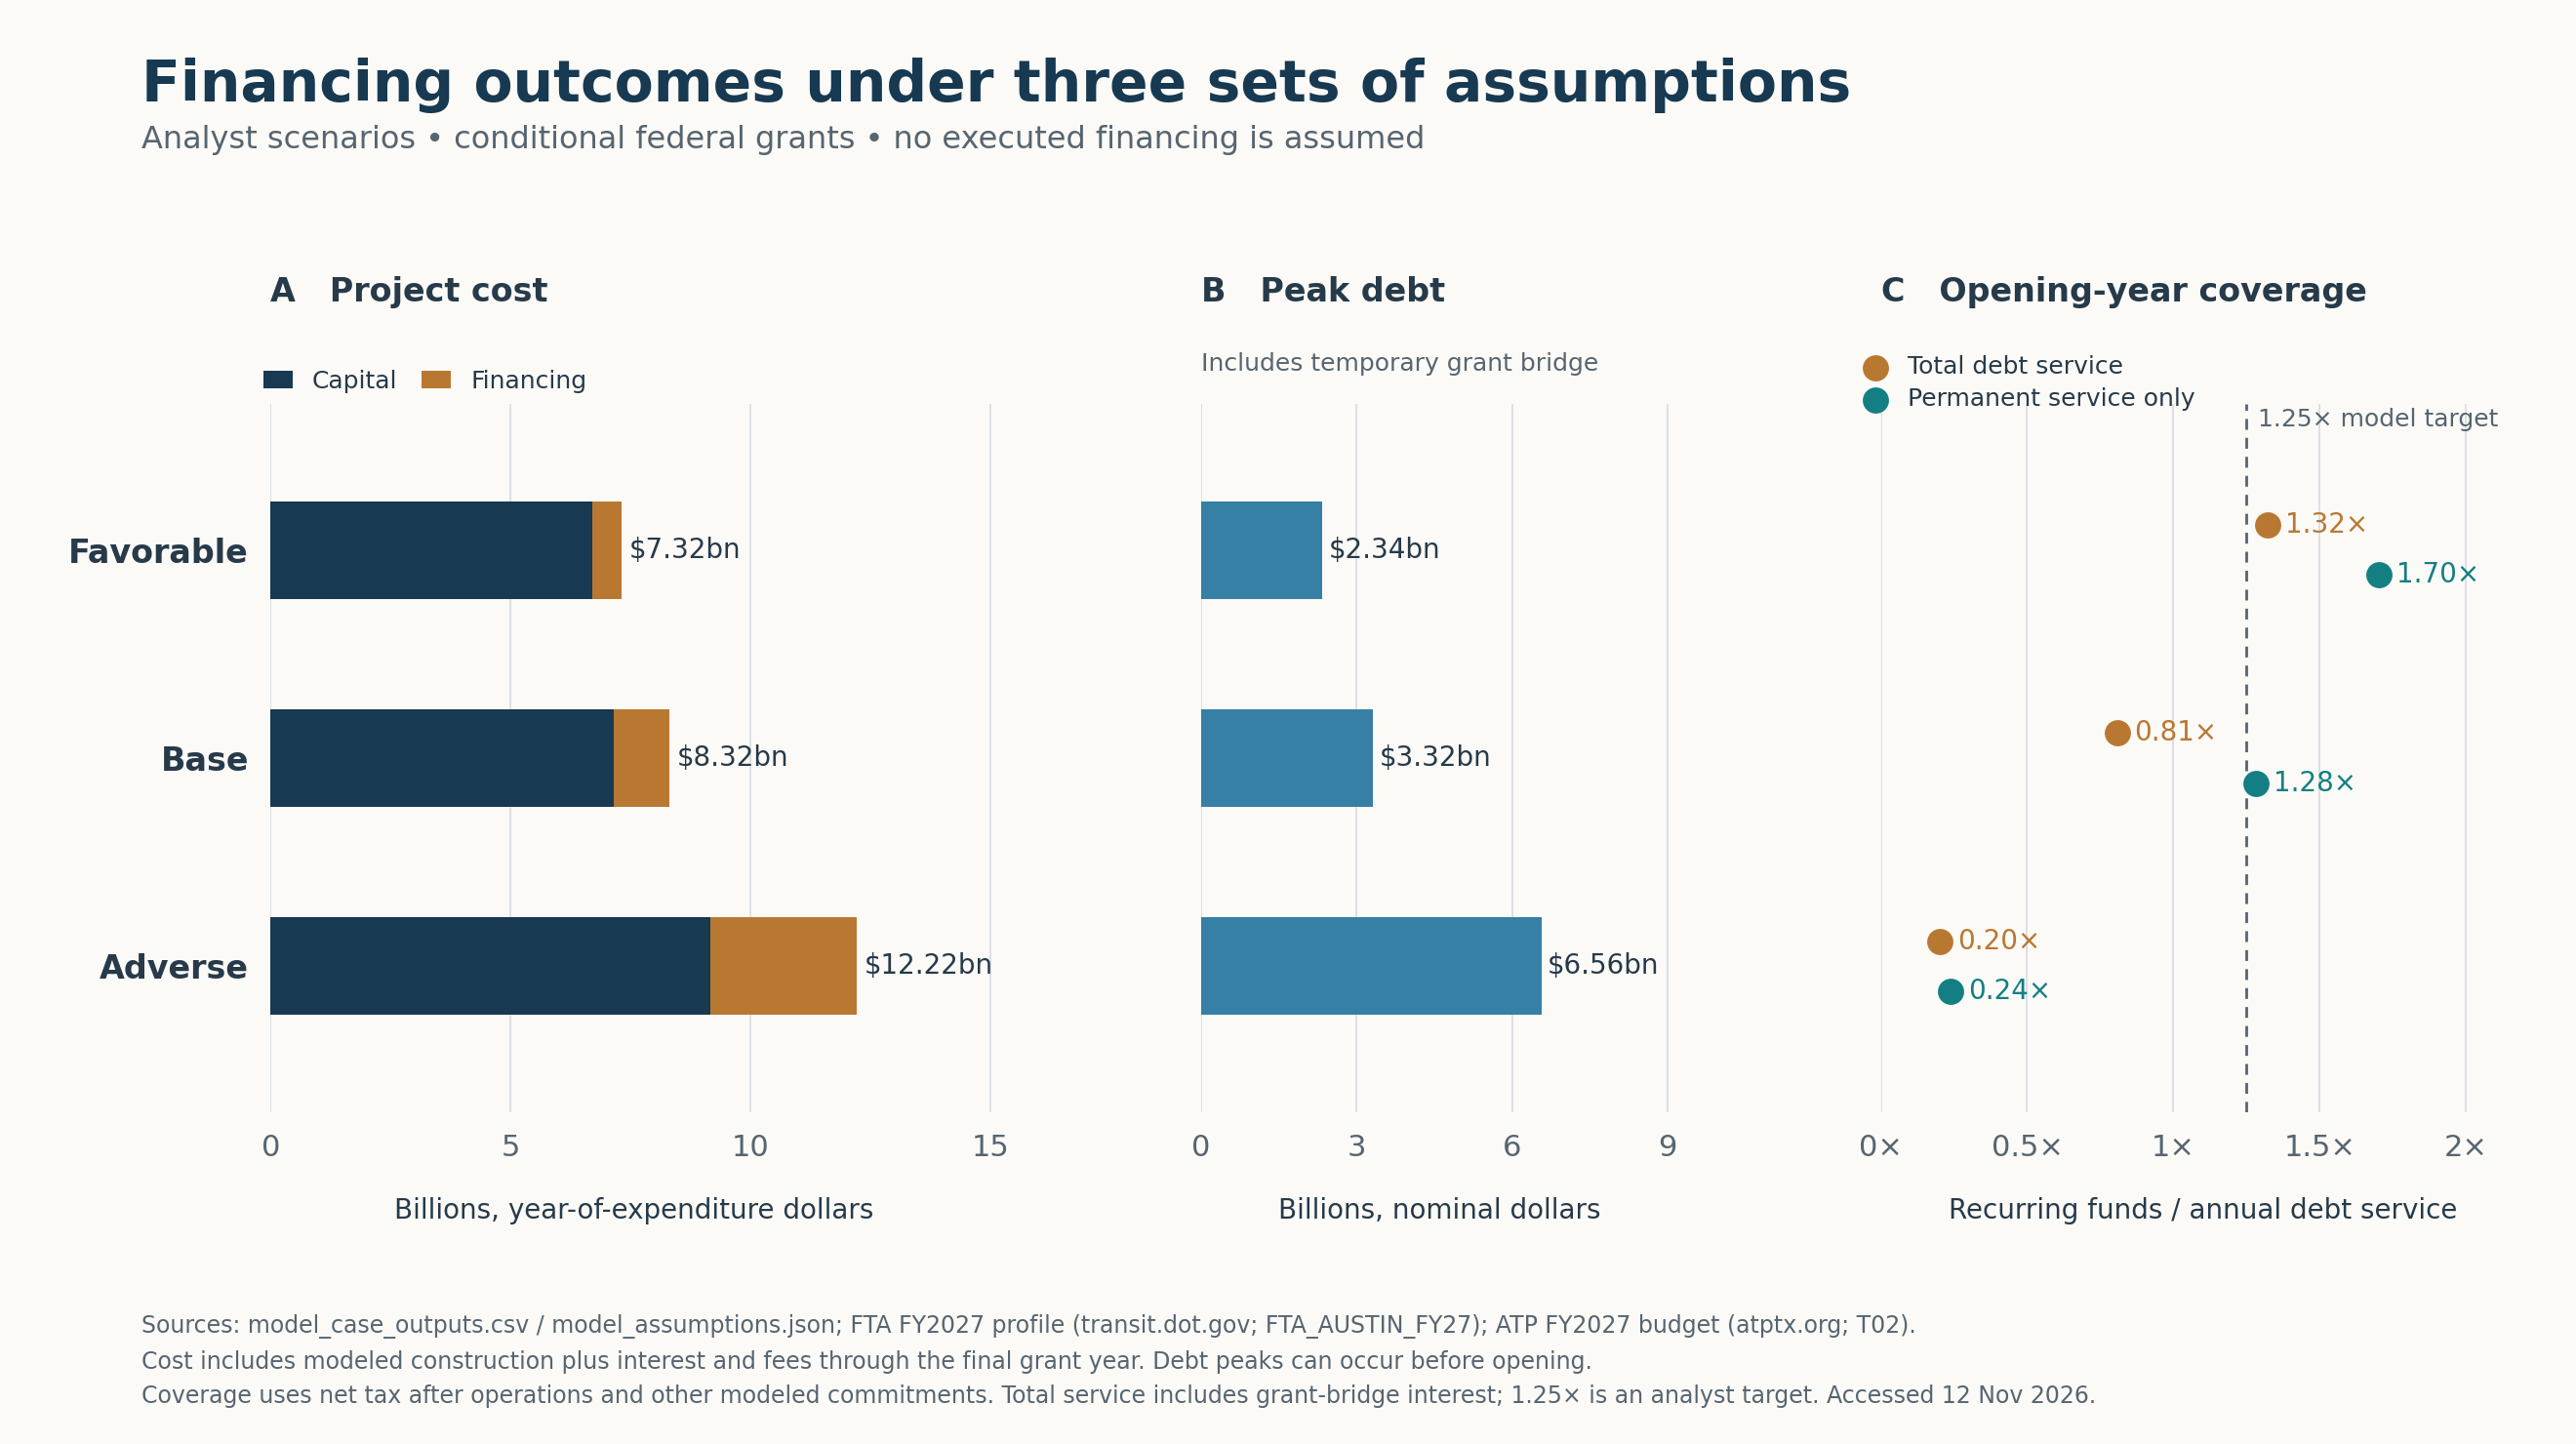
The base case produces $8.32 billion of capital and project-period financing costs and $3.32 billion in peak borrowing. The official cost estimate is $8.234 billion. Opening-year recurring cash covers permanent debt service 1.28 times, but only 0.81 times permanent service plus bridge interest. The smallest postopening cash balance is $94.8 million, excluding a $20 million reserve. That leaves $14.8 million above the model’s operating cash floor.
Federal records place Austin in Project Development as it pursues a full-funding grant agreement. Texas litigation over ATP’s financing remains unresolved in the public court records reviewed. In May 2026, the Texas Supreme Court directed the trial court to decide the attorney general’s jurisdictional plea. The 2025 legislative proposals directed at Project Connect failed to become law. rail-s1, rail-s2, rail-s3, rail-s4
The existing revenue stream falls short in the case without a Capital Investment Grants award. Higher costs or slower reimbursement can consume the base case’s cash cushion. Annualized capital and operating cost comes to about $31 per projected 2045 linked trip in 2026 dollars. Applying an older forecast for additional transit trips produces an illustration of about $85 per additional trip.
1. Project scope and federal funding status
Environmental clearance and the federal grant request
FTA’s project profile lists Austin’s Phase 1 at 9.8 miles, 15 stations and $8.234 billion, with a $4.067 billion Capital Investment Grants request. The October 27 project list classifies Austin as a New Starts project in Project Development. The November 6 dashboard’s Austin row, transcribed in the research files, records environmental completion on January 7, 2026, matching commitments in progress and a prospective grant agreement in summer 2027. The Engineering-entry field is blank. rail-s1, rail-s2
A Record of Decision clears the federal environmental decision for the selected project. It does not appropriate money, execute a grant, complete every permit, or promise a borrowing rate. Nor does a project rating do those things. The April 2026 FY2027 profile repeats a rating assigned in November 2024; its publication date should not be mistaken for a fresh underwriting decision. rail-s2
The public financial profile allocates the official total as follows:
| Proposed source | $ billion | Financing meaning |
|---|---|---|
| Federal CIG grant | 4.06740 | Requested grant |
| Local pay-as-you-go funds | 1.85638 | Accumulated and future local resources |
| TIFIA loan | 1.34046 | Repayable federal credit |
| Local bonds | 0.96936 | Repayable local borrowing |
| Total | 8.23360 | Proposed sources equal the published project estimate |
No executed TIFIA agreement was located. The grants and loans consequently remain assumptions in this analysis. The financing model uses public filings. rail-s2
Litigation over the financing
In No. 24-1078, decided 22 May 2026, the Texas Supreme Court required the trial court to decide the attorney general’s jurisdictional plea. The opinion expressly declined to resolve the underlying argument. It should not be summarized as a final ruling that ATP may issue the proposed debt, or that Project Connect is illegal. rail-s3
Two subsequent appeals, 15-26-00155-CV and 15-26-00156-CV, were filed on August 13. Their official public records retrieved on November 12 displayed events through September 1, without a later merits disposition. The public docket entries reviewed stop at September 1. The Cocco tax-rate appeal was described as pending in a March 2026 City bond disclosure; its current official docket returned a maintenance page. Its November disposition remains unverified. rail-s3
The relevant 2025 bills—SB 2519, SB 3067, SB 3071 and HB 3879—did not become law. Their official histories and the City’s end-of-session memorandum agree. “Failed” here does not mean each lost a floor vote: some stopped at referral or calendar stages. The earlier 2023 HB 3899 also failed. The next legislative risk cannot be assigned a credible dollar probability from these records. rail-s4
ATP’s January 21, 2026 resolution authorized up to $150 million of contract-revenue bonds, with pricing authority through January 21, 2027. The accompanying board summary says the bonds had not yet been issued when reauthorization was requested that January. The resolution authorizes an initial financing. ATP lacks independent taxing power; the City’s annual revenue commitment and appropriation framework are central to its security. rail-s5, rail-s9
Present status: a selected, environmentally approved project pursuing federal funding, with continuing financing litigation and substantial proposed borrowing. That status supports continued analysis; it does not support treating anticipated grants or bonds as cash already secured.
2. The price rose while the promised scope changed
The familiar $7.1 billion figure from 2020 is not a clean baseline for today’s first-phase estimate. It described a broader Project Connect program, including light rail, commuter-rail and bus improvements, and $300 million for anti-displacement measures. The original rail vision included airport service and a downtown subway. Comparing that program directly with today’s shorter first phase confuses scope with escalation. rail-s6
| Vintage | Published amount | Scope and price basis |
|---|---|---|
| 2020 election materials | $7.1bn | Broader initial Project Connect program; approximately 45% federal funding anticipated |
| April 2022 estimate, documented in November report | Light rail rose from $5.8bn to $10.3bn | Earlier, larger light-rail concept; prompted scope and delivery reassessment |
| May 2023 implementation plan | $4.5–$4.8bn | 9.8 miles and 15 stations, explicitly in then-current dollars |
| Current federal profile and ratings appendix | $7.1483bn capital + $1.0853bn finance = $8.2336bn | Phase 1, year-of-expenditure capital plus financing allowance |
Sources: 2020 City election explanation; ATP 2022 management report p15; May 2023 plan p6; FTA ratings appendix Table 2A. rail-s6, rail-s7, rail-s8
The current phase connects the Guadalupe/38th Street area south toward Oltorf and east along Riverside toward Yellow Jacket. It does not deliver the entire original network. ATP’s November 2026 airport-extension planning announcement describes a future extension whose construction budget and committed financing remain unverified. rail-s7, rail-s22
The inflation comparison also needs discipline. The May 2023 figure was in current dollars; today’s capital figure includes expected expenditure-year escalation. ATP’s January 2025 finance FAQ described roughly 32% combined allocated and unallocated contingency and escalation assumptions of approximately 4.5% nearer term and 3.5% later. Adding another 32% contingency or escalating the entire published capital estimate from scratch would double count provisions already embedded in it. rail-s8
The large remaining uncertainty is not whether there is a contingency line. It is whether the detailed quantities, utilities, right-of-way, construction interfaces and procurement prices will fit the current scope and allowance. Development contracts and board authorizations cover only part of the work needed to price the whole railway. The model therefore preserves the official capital total in the base case, then tests the effects of higher remaining costs and additional inflation.
3. What the tax produces
The tax rate and taxable value
Project Connect began with an 8.75-cent-per-$100 increment in the 2020 tax election. The funding agreement expresses that as 20.789% of the City’s adjusted maintenance-and-operations tax revenue, with specified deductions and annual appropriation. It is not a permanent 8.75-cent levy on every later appraisal roll. The agreement also addresses adjustment of the percentage following a subsequent successful tax-rate election. rail-s9
The working calculation is:
Gross Project Connect component = taxable value ÷ 100 × City M&O rate × 20.789%.
A second step reconciles gross levy to ATP receipts, allowing for collection timing and the agreement’s deductions. Debt-service taxes are excluded. Tax-increment and homestead-preservation zones, among other adjustments, prevent gross levy from equaling the net transfer.
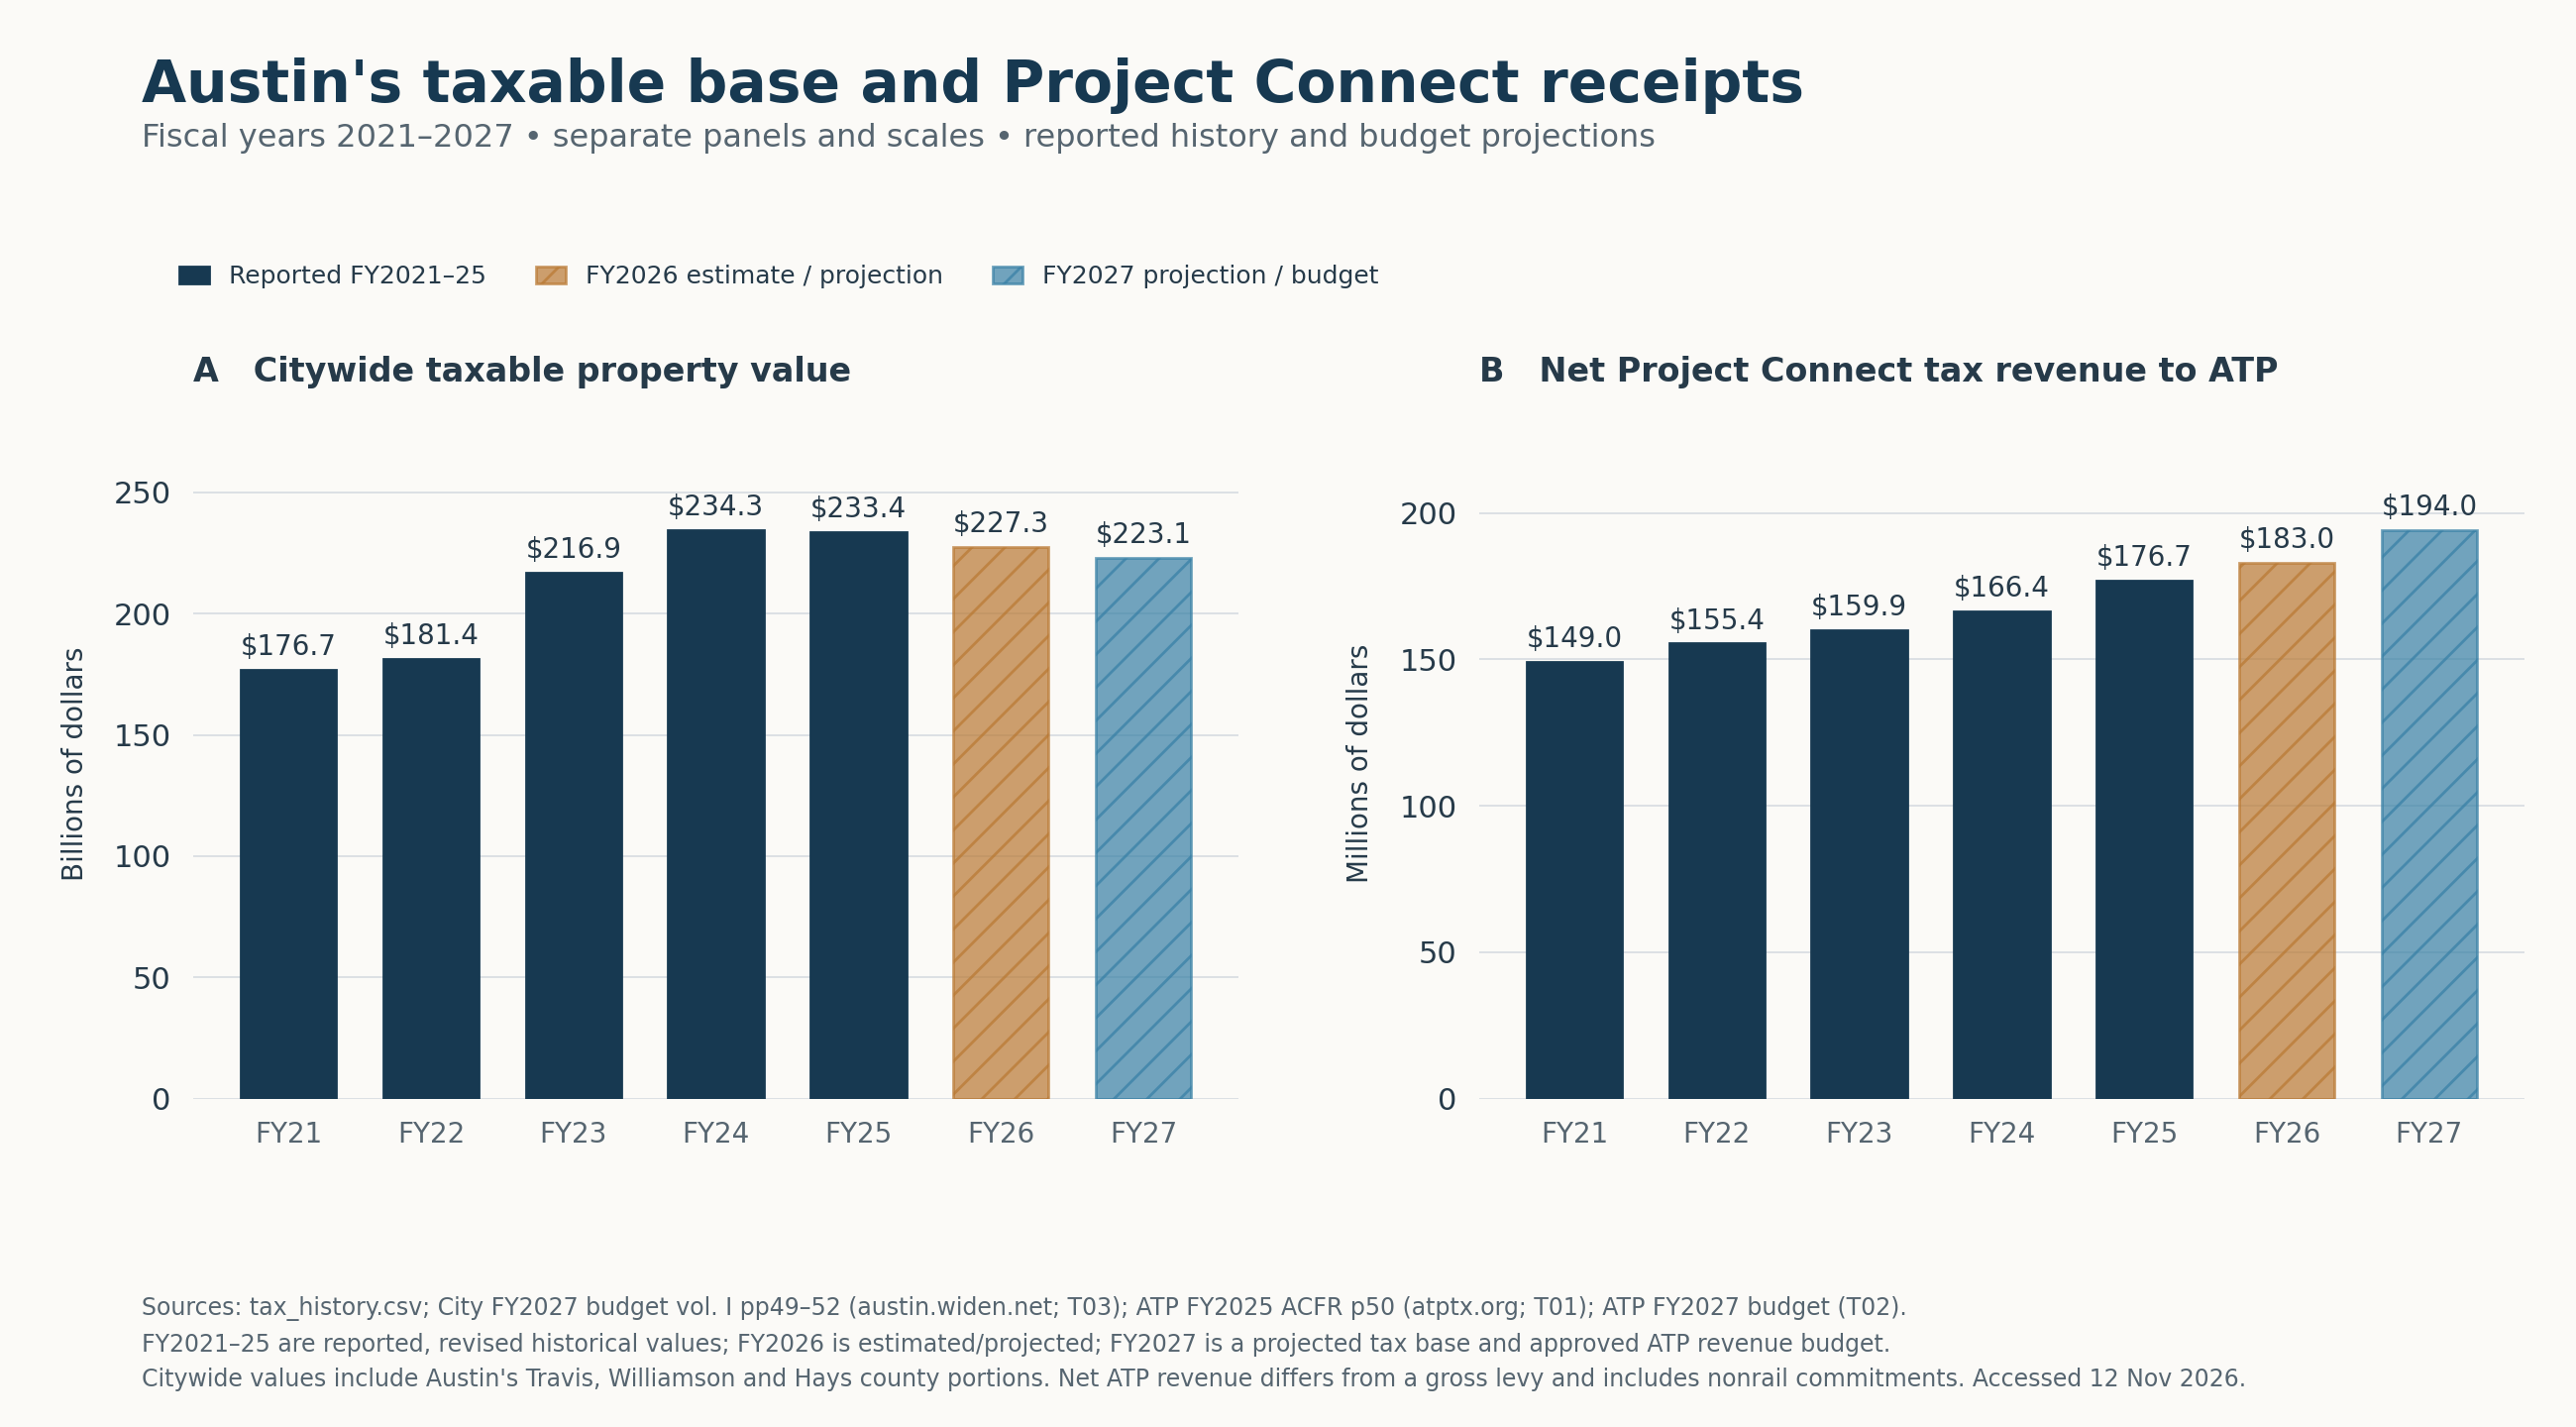
TCAD’s 2026 City of Austin jurisdiction 02 roll reports $212.015 billion of net taxable value for the Travis County portion. Applying the FY2027 M&O rate and 20.789% share gives $195.977 million of gross Project Connect levy for that portion. The City’s budget uses $223.064 billion citywide, including Austin property in Williamson and Hays counties and a different estimation basis. Applying the rate to all of Travis County would be wrong; using only TCAD’s Austin portion would omit the other counties. The workbook applies historical rates to each TCAD Austin roll, shows the geographic reconciliation, and uses the consolidated City series for funding projections. rail-s10
Reported history contradicts a simple “appraisals fall, rail revenue falls” story
| Fiscal year | Citywide taxable value, $bn | City M&O rate, $/100 | Gross PC component, cents/$100 | Net ATP tax revenue, $m |
|---|---|---|---|---|
| 2021 | 176.672 | 0.420900 | 8.750 | 148.977 |
| 2022 | 181.435 | 0.428000 | 8.898 | 155.386 |
| 2023 | 216.894 | 0.366900 | 7.627 | 159.850 |
| 2024 | 234.257 | 0.357700 | 7.436 | 166.388 |
| 2025 | 233.405 | 0.381500 | 7.931 | 176.712 |
| 2026 | 227.280 estimated | 0.410282 | 8.529 | 183.000 projected |
| 2027 | 223.064 projected | 0.444636 | 9.244 | 194.000 budgeted |
Sources: City FY2027 budget pp49–52, published tax rates, ATP audited statements and approved budget. FY2021–25 receipts are recognized governmental-fund revenues; FY2026–27 are not audited actuals. The original 2020 increment is exactly 8.75 cents; subsequent components use the agreement’s rounded percentage. rail-s10, rail-s11, rail-s12
From FY2025 to FY2027, the consolidated taxable base falls approximately 4.43%, but the M&O rate rises 16.55% and the ATP receipt grows 9.78%. The rate-setting mechanism changes how taxable values affect receipts. City decisions, statutory calculations, any necessary elections, collection losses and appropriations still matter.
For FY2027, $223.064 billion multiplied by the gross component produces $206.190 million, versus the $194 million net budget. The model calibrates a 94.09% net-to-gross factor to reconcile them. That factor bundles deductions and timing; it is not a statutory collection rate or a promise of future collections.
In the base forecast, taxable value grows 2% annually while net receipts grow 3.75% through FY2030 and 3.5% thereafter. The City’s public forecast envisages approximately 1%–3% taxable-value growth in FY2028–31, while ATP’s published planning assumptions support the early levy-growth convention. The long extension remains an analyst assumption. A modeled rate reset achieves the target levy; the model does not independently calculate legal tax-rate authority for every future year. rail-s8, rail-s10
A 10% fall in taxable values requires an 11.11% higher rate merely to preserve the same gross levy, all else equal. The reset sensitivity therefore preserves receipts but shifts the burden into the tax rate. The frozen-rate sensitivity instead lets receipts fall and keeps the FY2027 M&O rate fixed thereafter. These test different policy responses; they are not two forecasts of the same legal obligation.
4. Opening cash and existing commitments
ATP recognized $807.314 million of Project Connect tax revenue during FY2021–25. Its FY2025 audited general-fund balance was $436.945 million, including approximately $78.365 million committed, $20 million assigned and $338.423 million unassigned. A further $49.992 million sat in the anti-displacement fund. The audit is useful evidence of accumulated resources; it is not a finding that the future railway is affordable. rail-s11
The financing forecast starts from the approved budget’s projected FY2026 closing balances: $379.136 million operating plus $44.048 million rail, or $423.184 million of rail-facing funds. A $20 million reserve stays outside modeled cash. These figures are projected budget fund balances. The model’s $80 million cash floor and the reserve total $100 million. rail-s12
Two existing commitments reduce what is available for rail:
- Anti-displacement: the published $300 million schedule provides $20 million annually through FY2033 after the initial larger allocations.
- CapMetro projects: the October 2025 agreement schedules $30 million in FY2029, $30 million in FY2030 and $37.5 million in FY2031. Earlier FY2026 commitments are already reflected in the opening-balance estimate. rail-s13
FY2027 planned rail spending is $471.769 million. I subtract $4 million in City betterment reimbursements from both spending and reimbursement, leaving $467.769 million in the model. The $424.3 million operating-to-rail transfer is internal: counting it as additional funding would create cash from an accounting transfer. rail-s12
The modeled FY2027 closing rail-facing balance is $142.110 million, compared with $145.015 million in the budget. The $2.904 million difference is explained: the model credits 3% on beginning cash, or $12.696 million, versus $15.6 million budgeted investment and other income. The difference comes from the model’s lower assumption for investment and other income.
5. The annual financing model
Construction, inflation and grant timing
The base case ties total nonfinance capital to FTA’s $7.1483 billion. ATP’s budget reports approximately $386 million spent through projected FY2026. After that amount and FY2027 spending, $6.2945 billion remains. I allocate the remainder across FY2028–33 at 10%, 17%, 25%, 27%, 15% and 6%.
That annual distribution is an analyst estimate. The detailed current FTA submission’s annual cash-flow spreadsheet was not recovered publicly. The $386 million is also a rounded budget figure for costs treated as historically eligible in the model. Both gaps are visible in the inputs, and one scenario sets historical eligibility to zero.
Federal receipts follow an illustrative ten-year installment schedule, constrained by prior modeled eligible expenditure. A final-year true-up avoids leaving earned reimbursement stranded. Interest is treated as potentially eligible within the project financing window; issuance fees are not. Eligibility before a federal agreement is conditional throughout. The model does not convert estimated grant reimbursement into an enforceable receivable.
Borrowing fills construction-period cash needs, including a 1% issuance fee and half a year’s interest on new draws. After opening, grant receipts retire debt; the same grant dollars are not also credited as operating revenue. Permanent payments use a 35-year fixed-payment proxy at the scenario interest rate. Subsequent grant reimbursements can accelerate retirement, so this is not a claim that every case pays an identical annuity for exactly 35 years.
The model credits no passenger fares or formula operating grants, and reserves the whole rail operating estimate against the tax stream. That is conservative relative to a plan with dependable additional operating revenue, but avoids inventing a fare settlement or double counting another agency’s contribution. O&M starts from FTA’s $83.06 million in 2033 dollars, escalated 3% annually; FY2034’s modeled bill is $85.552 million. rail-s2, rail-s8
Decisive assumptions and three outcomes
| Assumption | Low-cost / favorable | Base | High-cost / adverse |
|---|---|---|---|
| Remaining FY2028+ capital | 5% lower | Published total preserved | 15% higher |
| Extra annual construction inflation | −0.5 percentage point | None beyond embedded estimate | +1 percentage point |
| Additional delay | None | None | Two years |
| Assumed blended debt rate | 4.5% | 5.5% | 7.0% |
| Grant award cap | $4.067bn | $4.067bn | $2.882bn |
| First assumed grant cash | FY2027 | FY2028 | FY2030 |
| Tax policy | Reset to levy path | Reset to levy path | FY2027 rate frozen |
| FY2028 taxable-value shock | None | None | −10%, then 2% annual growth |
| O&M relative to official estimate | −5% | Unchanged | +15% |
The adverse grant cap equals 35% of the original $8.2336 billion estimate. Delay also adds assumed administration and escalation. The adverse case uses assumed grant terms.
| Modeled result | Favorable | Base | Adverse |
|---|---|---|---|
| Capital excluding finance | $6.704bn | $7.148bn | $9.174bn |
| Financing classified to project | $0.620bn | $1.168bn | $3.049bn |
| Capital plus financing | $7.324bn | $8.316bn | $12.224bn |
| Financing classification through | FY2036 | FY2037 | FY2039 |
| Conditional federal cash | $3.607bn | $4.067bn | $2.882bn |
| Peak total debt | $2.344bn | $3.318bn | $6.563bn |
| Opening permanent-debt allocation | $1.715bn | $1.957bn | $5.410bn |
| Annual permanent payment | $98.2m | $127.2m | $417.8m |
| Opening total-service coverage | 1.32× | 0.81× | 0.20× |
| Opening permanent-only coverage | 1.70× | 1.28× | 0.24× |
| First operating model FY | 2034 | 2034 | 2036 |
| Cash conclusion | Positive with room | Positive, narrow reserve margin | Unfunded at opening |
The favorable grant total falls below the cap because the assumed grant share applies to a smaller eligible project. In the adverse case the grant equals only 23.6% of modeled all-in cost. The modeled bridge depends on lenders accepting the proposed revenue pledge and loan terms.
Why the base case passes cash and still looks fragile
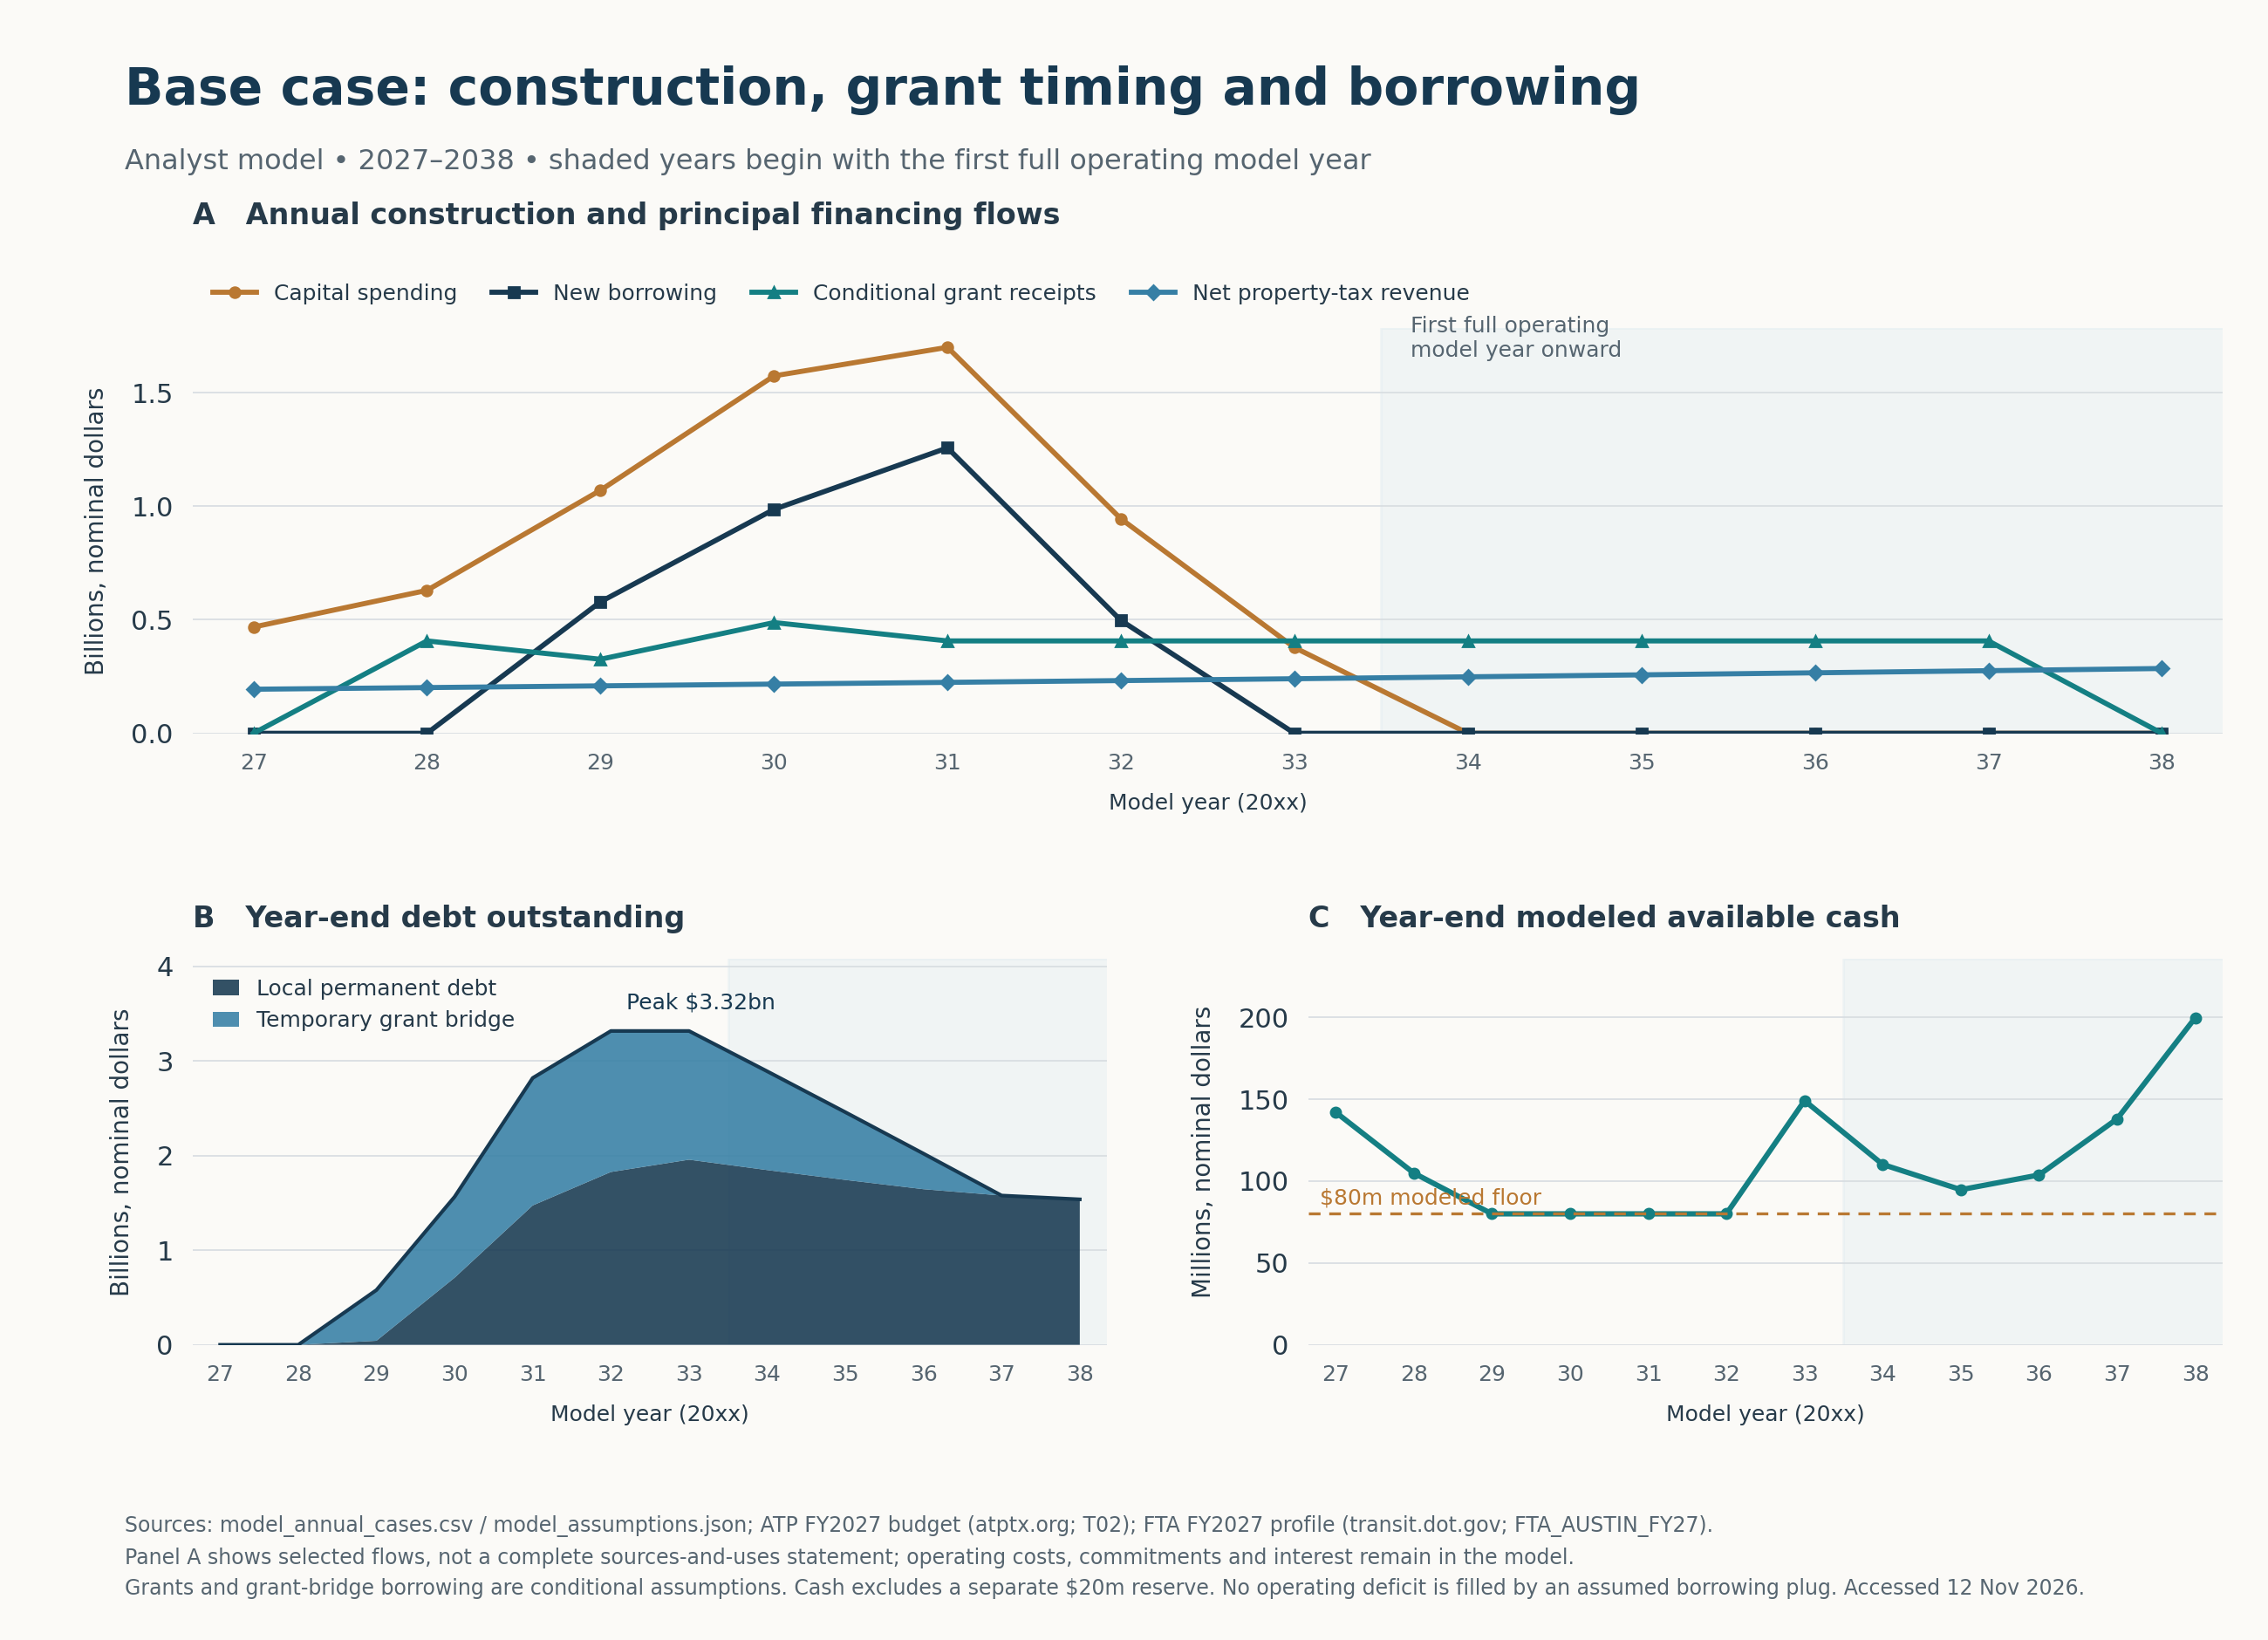
The following annual schedule makes the financing need visible. Figures are nominal $ millions; debt and cash are year-end balances. Housing, CapMetro, operating costs, investment income and interest are included in the workbook, although omitted from this compact table.
| FY | Capital | Net tax | Federal cash | New debt | Ending debt | Ending cash |
|---|---|---|---|---|---|---|
| 2027 | 467.8 | 194.0 | 0.0 | 0.0 | 0.0 | 142.1 |
| 2028 | 629.5 | 201.3 | 406.7 | 0.0 | 0.0 | 104.9 |
| 2029 | 1,070.1 | 208.8 | 326.0 | 578.9 | 578.9 | 80.0 |
| 2030 | 1,573.6 | 216.7 | 487.5 | 985.9 | 1,564.8 | 80.0 |
| 2031 | 1,699.5 | 224.2 | 406.7 | 1,256.8 | 2,821.6 | 80.0 |
| 2032 | 944.2 | 232.1 | 406.7 | 496.8 | 3,318.4 | 80.0 |
| 2033 | 377.7 | 240.2 | 406.7 | 0.0 | 3,318.4 | 149.2 |
| 2034 | 0.0 | 248.6 | 406.7 | 0.0 | 2,892.1 | 110.2 |
| 2035 | 0.0 | 257.3 | 406.7 | 0.0 | 2,459.8 | 94.8 |
| 2036 | 0.0 | 266.3 | 406.7 | 0.0 | 2,021.8 | 103.7 |
| 2037 | 0.0 | 275.6 | 406.7 | 0.0 | 1,578.4 | 138.0 |
| 2038 | 0.0 | 285.3 | 0.0 | 0.0 | 1,538.0 | 199.8 |
The base reaches opening with $149.164 million of modeled cash. In FY2034, tax receipts less operations leave $163.063 million, against $202.037 million of permanent service plus bridge interest. The $38.974 million difference comes from cash. FY2035 consumes another $15.427 million. Cash then recovers as grant receipts retire bridge debt and the tax stream grows.
Thus 0.81-times coverage and positive cash can coexist. The relevant warning is dependence on preaccumulated liquidity and lenders’ treatment of bridge interest. The 1.25-times benchmark used here is a modeling benchmark. A lender could require a different definition, additional reserves, stronger legal security, or a grant agreement before advancing funds.
This concern is independently consistent with FTA’s published financial assessment: the underlying assumptions and capacity assessment was Medium-Low, including concern about optimistic property-tax growth and insufficient demonstrated additional capacity for shortfalls. That assessment’s November 2024 vintage limits how current it is; it nevertheless contradicts an interpretation that the published overall project rating certifies abundant financial room. rail-s2, rail-s8
Sensitivities show where the model breaks
Each row changes the base case alone unless its description explicitly combines an appraisal shock and policy response.
| Change | First modeled cash deficiency | Interpretation |
|---|---|---|
| No CIG grant | FY2034: −$157.6m | Opening permanent debt rises to $6.17bn; existing stream cannot support this scope |
| Grant cap reduced to 40% of original estimate | FY2035: −$45.6m | Reserve floor already breached in FY2034 |
| FY2028 values −10%; rate reset maintained | None | Revenue preserved by a higher required City rate |
| Values −10%; FY2027 rate frozen thereafter | FY2034: −$13.0m | Combines the appraisal shock and a frozen rate |
| Remaining FY2028+ capital +10% | FY2034: −$0.7m | Later minimum reaches −$76.5m |
| Interest rate +1 percentage point | FY2035: −$9.9m | Reserve floor breached a year earlier |
| First grant cash delayed two years | FY2034: −$2.9m | Later minimum reaches −$140.8m |
| Extra construction inflation +1 point | No negative cash | Minimum $13.1m, well below the $80m floor |
| No historical costs eligible for grant | None | Minimum $85.2m; most of the reserve cushion disappears |
Balances exclude the protected $20 million reserve. A small negative model balance is not proof that every dollar in every ATP account is gone. It exposes a need to release reserves, add funding, change borrowing terms or reduce spending. Later deficits in the failing cases exceed that reserve.
In the combined adverse case, FY2036 requires roughly $398.3 million more than recurring cash after operations; its initial $80 million offsets only part, leaving $318.3 million unfunded. The later amortization rows show the required payments after the shortfall. The model supplies no hidden postopening borrowing plug.
Financing-cost labels also matter. FTA’s convention includes finance costs through the later of project completion/opening or fulfillment of the CIG commitment. The base therefore includes financing through FY2037. With no grant, that reporting window ends earlier. A smaller displayed no-grant capital-plus-finance total would be a change in which costs count: through the common FY2033 cutoff, financing costs are approximately $1.056 billion without CIG versus $580 million in the base. rail-s14
6. What does a ride cost—and which ride?
The current FTA profile forecasts 18,700 daily / 6,070,100 annual linked trips under its 2023 current-year conditions, and 33,800 daily / 10,986,900 annual linked trips in 2045. Neither is observed Austin light-rail ridership. The first is not a verified opening-year forecast; the second requires the horizon-year land use and service assumptions. A linked trip counts a passenger journey, which can include transfers. rail-s2
For a comparable annual resource-cost measure, I convert construction spending to 2026 dollars at 3%, annualize it over 40 years at a 3% real rate, and add operations in the same price year. Historical spending is treated as 2026 dollars because a precise same-scope historical expenditure schedule is unavailable. The base produces:
- Present-price capital: $6.375 billion.
- Equivalent annual capital cost: $275.786 million.
- Annual operating cost in the same prices: $67.535 million.
- Total equivalent annual resource cost: $343.321 million.
Dividing by official annual trips gives $31.25 per 2045 linked journey, or $56.56 against the lower current-land-use model denominator. The favorable/base/adverse range using the 2045 forecast is $29.41 / $31.25 / $37.54. If ridership is 25% below that forecast while cost stays fixed, the base becomes $41.66; at half the forecast, $62.50.
These estimates measure resource cost per projected linked trip. Financing charges are excluded from this annualized calculation to avoid charging for capital twice. Federal grants change who pays; they do not make construction consume fewer resources. The estimate is also not FTA’s official cost-effectiveness calculation, which uses its own methodology and exclusions. FTA assigned cost-effectiveness a Low rating in the published justification table. rail-s8
The 40-year capital life is a simplifying assumption. ATP’s January 2025 FAQ says its earlier operating estimate included state-of-good-repair and lifecycle replacements, so it would be incorrect to assume all renewal costs are omitted. The remaining gap is a current component-level renewal schedule reconciled to the $83.06 million FTA operating figure. Different asset lives or renewal treatment would change annual resource cost. rail-s8
Additional riders cannot be inferred from total project use
The FEIS air-quality appendix provides a same-vintage 2045 systemwide comparison: 109,200 No Build versus 121,700 Build linked trips, a difference of 12,500 daily journeys. It projects 28,968 project trips. The newer FTA profile projects 33,800. The transportation appendix likewise identifies an earlier modeling vintage. rail-s15
Using 325 days to annualize the increment gives 4.0625 million additional annual linked trips and an illustrative base cost of $84.51 per additional journey. The appendix uses 325 to annualize vehicle-miles traveled. This analysis applies the same factor to the change in linked trips. The favorable and adverse equivalents are approximately $79.53 and $101.53.
The precise gap is a Build/No Build linked-trip output matching the updated 33,800-trip forecast. Without it, a current official cost per net-new journey cannot be verified. Unique new people are a further different denominator: the documents leave open how many individuals produce those extra trips. Counting every future train passenger as a newly attracted transit rider would overstate the incremental ridership benefit.
7. Operating costs at peer systems
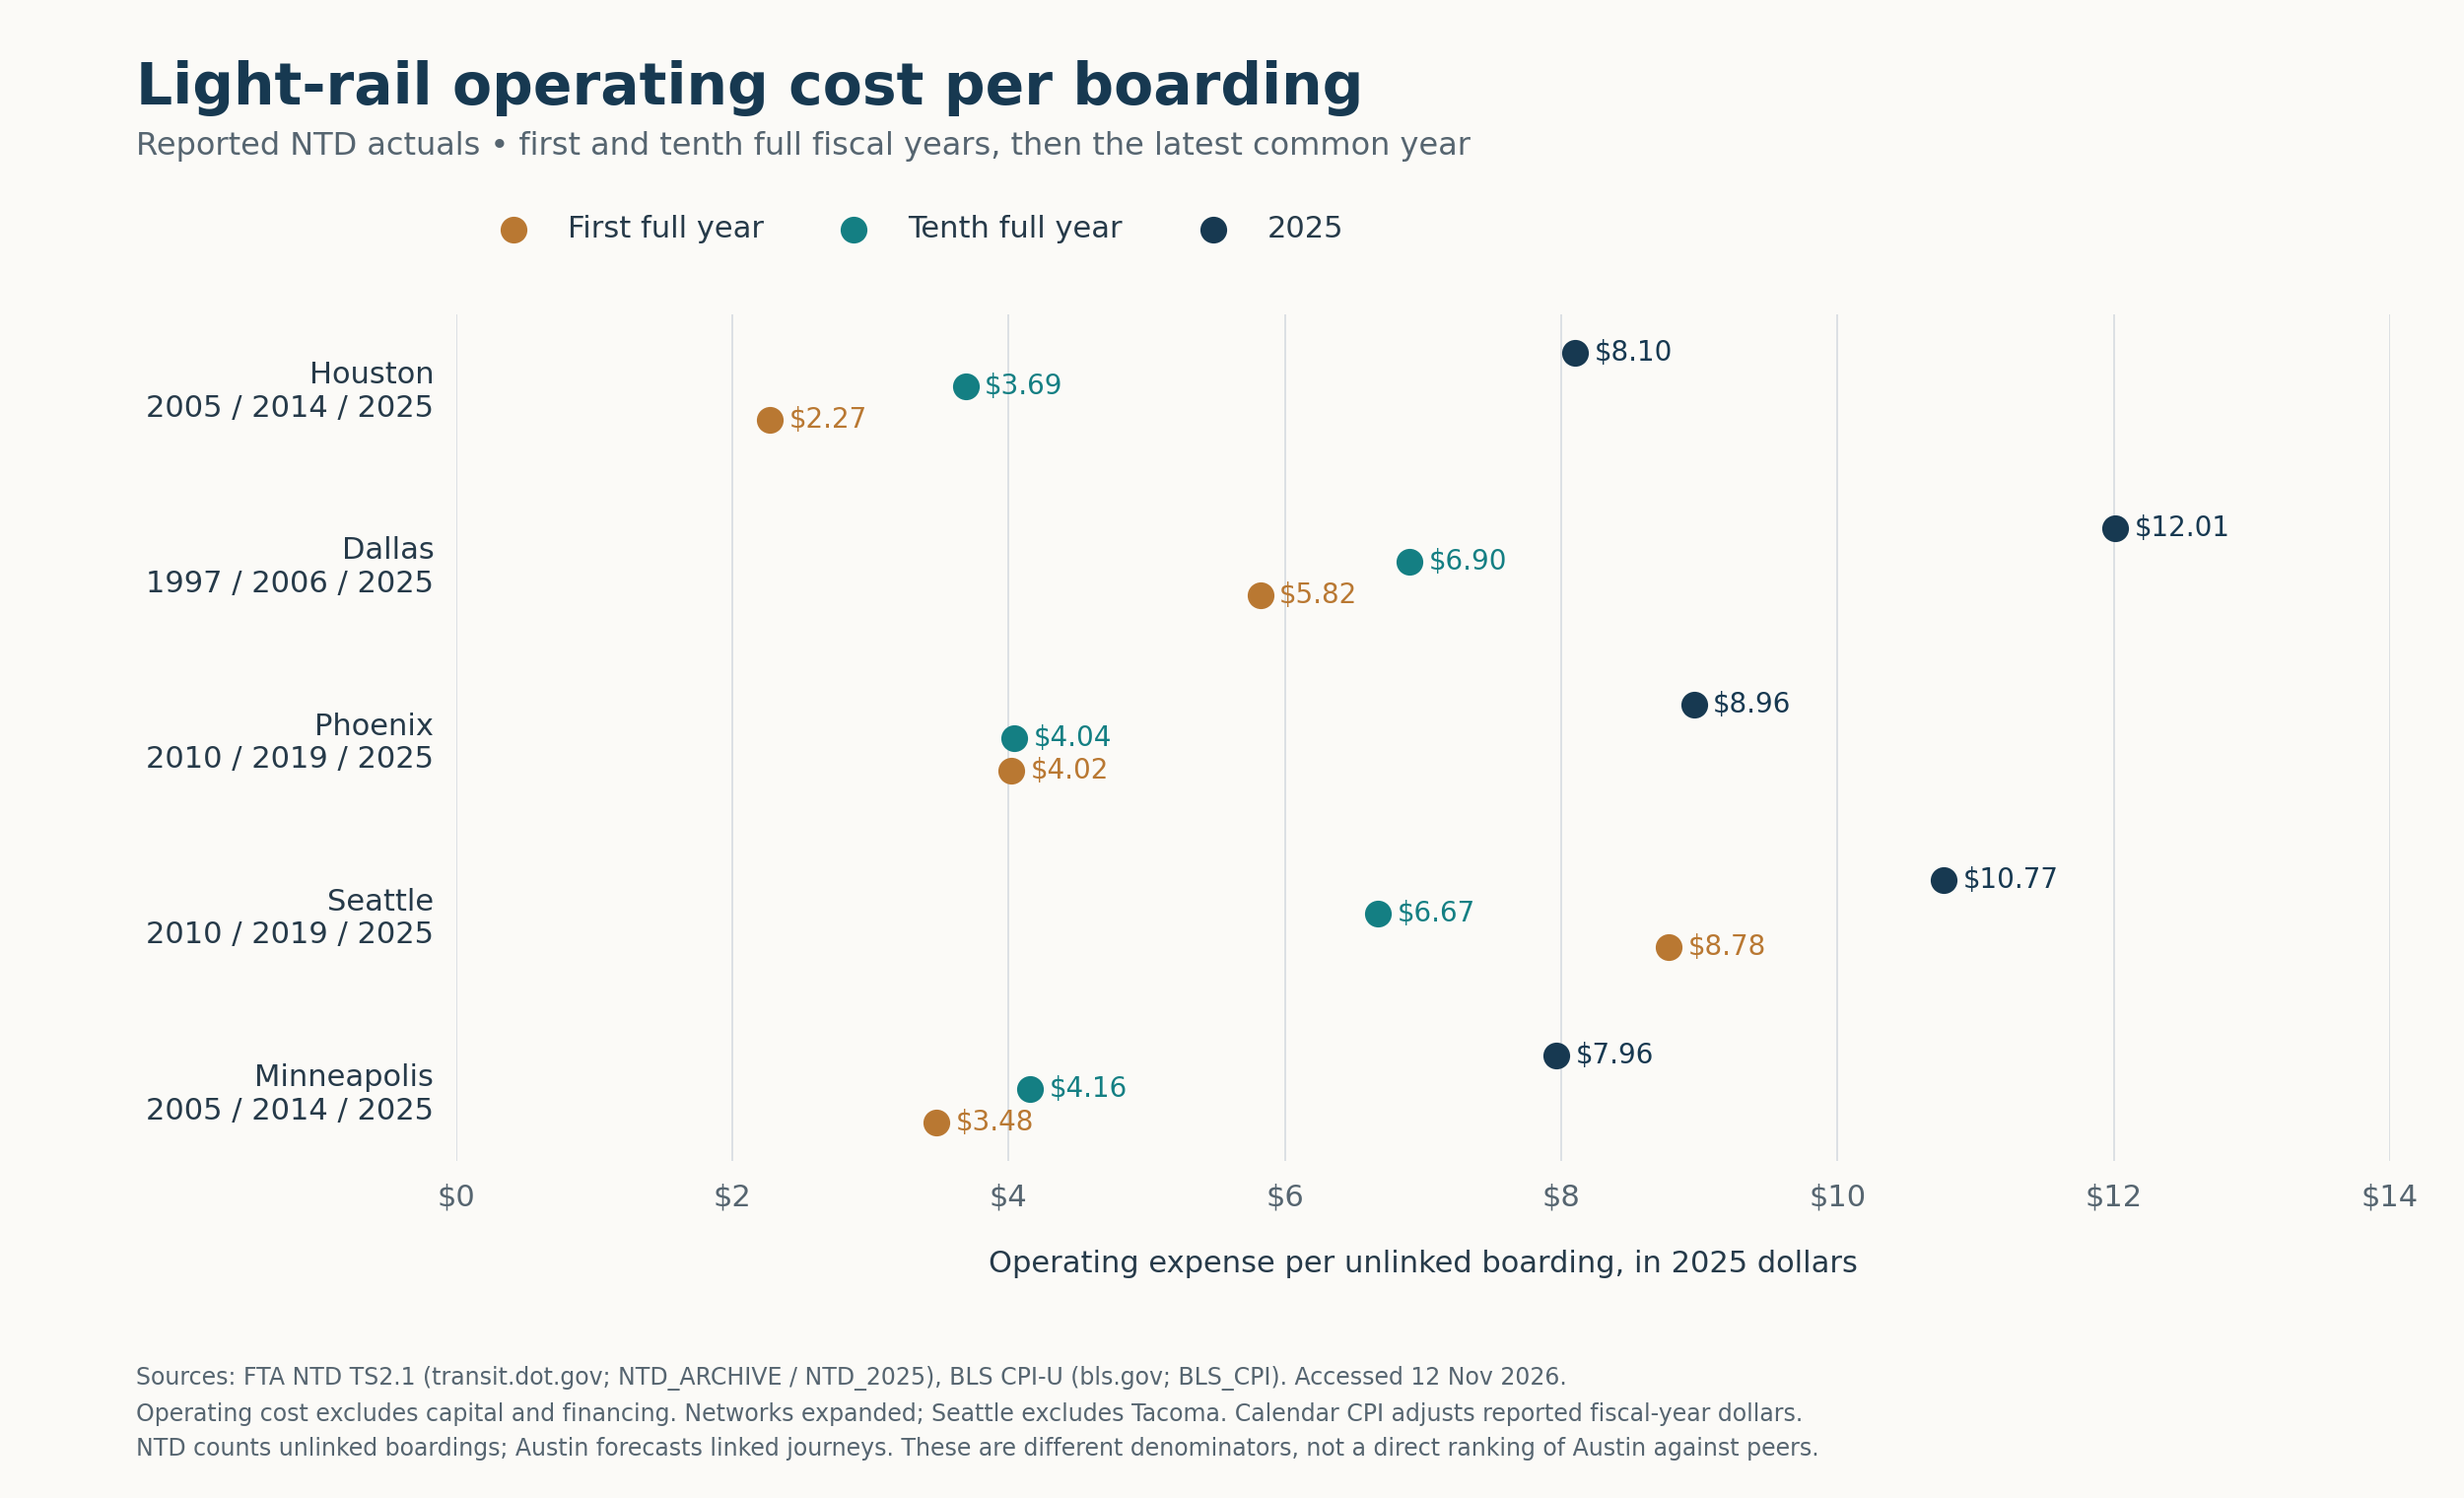
The National Transit Database supplies operating expenses and unlinked passenger trips, meaning boardings. I extracted light rail alone for Houston, Dallas, Phoenix, Seattle and Minneapolis, preserving 108 agency-year observations and 1,275 original metric cells with workbook, worksheet and cell references. Costs are converted to 2025 CPI-U dollars. rail-s16, rail-s17, rail-s18
Opening calendars require care. Houston’s January 2004 opening falls inside a September-ending fiscal year, so FY2005 is its first full reporting year. Dallas starts with FY1997; Phoenix and Seattle with FY2010; Minneapolis with FY2005. Phoenix FY2009 is a partial opening year, despite the temptation to call it “year one.” The principal mature comparison is the tenth full reporting year. That avoids comparing Phoenix and Seattle’s opening conditions with pandemic year 2020; the eleventh-year rows remain in the raw data and are flagged.
| System | First full FY | Operating $/boarding, first full FY | Tenth full FY | Operating $/boarding, tenth FY | Operating $/boarding, 2025 |
|---|---|---|---|---|---|
| Houston | 2005 | $2.27 | 2014 | $3.69 | $8.10 |
| Dallas | 1997 | $5.82 | 2006 | $6.90 | $12.01 |
| Phoenix | 2010 | $4.02 | 2019 | $4.04 | $8.96 |
| Seattle | 2010 | $8.78 | 2019 | $6.67 | $10.77 |
| Minneapolis | 2005 | $3.48 | 2014 | $4.16 | $7.96 |
All costs are constant 2025 dollars. The calculations use the official NTD TS2.1 workbooks. rail-s16, rail-s17, rail-s18
Seattle demonstrates that substantial ridership growth can improve operating cost per boarding: boardings rose from about 6.96 million in its first full year to 24.76 million in its tenth. The other four do not demonstrate a universal decline in unit costs as systems mature. Phoenix is roughly flat in that comparison; Houston, Dallas and Minneapolis are higher.
These comparisons follow agency networks as they grow. Directional route mileage grows between first and tenth full years by approximately 72% in Houston, 115% in Dallas, 39% in Phoenix, 31% in Seattle and 81% in Minneapolis. Additional routes change both demand and cost. Matching service age improves on an arbitrary cross-section, but cannot remove network expansion, labor markets, service frequency or macroeconomic conditions.
The latest actuals provide a second perspective:
| System, report year 2025 | Boardings, million | Operating expense, $m | Average passenger trip, miles |
|---|---|---|---|
| Houston | 13.201 | 106.900 | 2.78 |
| Dallas | 22.058 | 264.956 | 7.27 |
| Phoenix | 9.859 | 88.338 | 7.07 |
| Seattle | 37.948 | 408.702 | 8.42 |
| Minneapolis | 13.250 | 105.526 | 3.52 |
Seattle requires a specific audit correction: Central Link was reported as LR/purchased transportation in 2009–11, while Tacoma occupied a different light-rail reporting row before its later streetcar classification. Simply summing all early Sound Transit light-rail rows contaminates the cohort. The corrected extraction excludes Tacoma, and WSDOT’s 2010 public-transportation report independently corroborates Central Link’s figures. rail-s19
Austin’s modeled operating cost divided by its full 2045 annual forecast is roughly $5.97 in 2025 dollars per linked trip, below these five 2025 operating-cost-per-boarding observations. The comparison depends on Austin’s demand and service-cost assumptions. Linked journeys and unlinked boardings differ; Austin’s horizon forecast is not an opening observation; NTD expenses and ATP’s lifecycle-cost assumptions may cover different costs. The $31 capital-plus-operations estimate must never be compared directly with an $8 NTD operating-only boarding cost.
8. What a median Austin homeowner has paid
The household estimate applies the City homestead exemption before calculating the tax on the remaining taxable value. City budget documents provide annual assessed-value benchmarks for ordinary non-senior homesteads. Applying the applicable exemption and Project Connect rate component produces the following estimates. rail-s10, rail-s20
| Fiscal year | Median assessed value before exemption | General homestead exemption | Estimated PC allocation |
|---|---|---|---|
| 2021 | $363,902 | 10% | $286.57 |
| 2022 | $399,760 | 20% | $284.56 |
| 2023 | $453,727 | 20% | $276.86 |
| 2024 | $499,524 | 20% | $297.17 |
| 2025 | $515,472 | 20% | $327.06 |
| 2026 | $494,803 | 20% | $337.63 |
| 2027 | $471,603 | 20% | $348.74 |
The six completed FY2021–26 levy years total approximately $1,809.84. Including the newly levied FY2027 bill produces $2,158.58, but the latter should not be described as already paid by every homeowner on November 12. The FY2027 benchmark independently reproduces the City’s approximately $2,188.04 total municipal tax bill; Project Connect’s component is about $348.74 of that total.
For the period through opening, household tax-bill growth is not identical to citywide revenue growth. New construction can expand the City’s base without increasing an existing homeowner’s bill by the same amount. Exemptions, appraisal caps, ownership changes and relative valuation shifts also matter. I therefore use 0%, 3% and 6% annual household-bill growth scenarios after FY2027.
| Payment benchmark | 0% annual growth | 3% annual growth | 6% annual growth |
|---|---|---|---|
| Cumulative FY2021–33 levies | $4,251 | $4,482 | $4,737 |
| Additional FY2034 levy | $349 | $429 | $524 |
| Cumulative including FY2034 | $4,600 | $4,911 | $5,262 |
Planned November 2033 service falls in FY2034. A tax bill may be levied before opening and paid afterward. “Through opening” is consequently about $4,482 through FY2033, or $4,911 including the overlapping FY2034 levy, in the middle scenario. A delayed opening adds further tax years; these payments do not stop automatically when trains begin running.
The calculation adds successive annual median benchmarks. Public parcel-level payment histories sufficient to compute that distribution were not recovered. The allocation also funds broader Project Connect obligations, including anti-displacement and other transit commitments; labeling all of it “tax paid for light rail already delivered” would misstate its purpose.
9. What would change the conclusion?
Three major findings were cross-checked independently. Federal funding status agrees between FTA’s November dashboard and October project list. The tax mechanism agrees between the signed funding agreement, adopted City rates and the ATP/City budget reconciliation. Current cost and total ridership are supported by the federal profile and ratings appendix; the additional-trip denominator comes from the older FEIS Build/No Build table, which does not verify the updated forecast. An independent Python reconstruction also matched all three annual financing cases to numerical rounding, while a check of the source cells found no mismatches in the 1,275 NTD metric cells.
The most valuable new evidence would be:
- An executed full-funding grant agreement, including eligible costs, payment timing and treatment of overruns. Lenders need grant terms and timing to assess bridge collateral.
- Executable debt documents and pricing, with legal security, coverage definitions, reserves, TIFIA terms and bridge repayment requirements. Those determine whether modeled the modeled financing can proceed.
- A current integrated ATP financial workbook, reconciled to audited balances, the latest construction schedule and all nonrail commitments. Annual phasing is particularly important when the base reserve margin is only $14.8 million.
- Resolved litigation or authoritative financing opinions that remove uncertainty about issuance and the pledged revenue arrangements, rather than another procedural ruling described as a final victory.
- A scope-consistent construction estimate and updated ridership files, including the latest Build/No Build annual linked trips, opening-year ramp, service plan and lifecycle replacement schedule.
A larger committed grant, lower priced borrowing, verified additional operating support or earlier reimbursements could materially strengthen the case. A smaller award, slower payment, higher construction cost or inability to reset City rates could reverse it. The sensitivity results identify the magnitudes; no invented probability distribution is needed.
For a working analyst, the actionable judgment is to treat Phase 1 as a plausible but incompletely secured financing with limited modeled room for error. The existing tax stream is a substantial asset. It does not independently buy the present railway, and the apparent availability of federal money must survive the transition from request, to agreement, to timely cash receipts. Even if that transition succeeds, the policy decision still has to justify the resource cost against the service and additional journeys the line provides.
Source notes and audit trail
All sources below were accessed on 12 November 2026. Page references are printed pages unless identified as PDF pages. The accompanying sources.csv supplies the broader registry. The raw CSVs identify exact source cells, status, periods and calculation inputs. Figures described as modeled, inferred, calibrated or estimated are this report’s calculations.
Reproducibility. the XLSX shows public inputs, scenario assumptions, annual calculations and outputs, plus live household and peer calculations. Change the single scenario selector to rerun the model. Raw CSVs preserve which figures are reported and which are estimated. Figures use the accompanying CSV data. The source registry gives document links and locators. rail-s21
- FTA CIG dashboard, 6 November 2026. current CIG projects. Dashboard p1 Austin row, p2 notes. Data November 5. Project list October 27, 2026. ↩
- FTA Austin Phase 1 profile. April 2026 FY2027 combined profiles. Standalone pp1–3. FY2027 PDF pp63–65: costs, funding, trips, operations, financial assessment. Rating November 2024. Forecasts 2023/2045. ↩
- Texas Supreme Court No. 24-1078. Fifteenth Court 15-26-00155-CV. 15-26-00156-CV. City March 2026 disclosure. Supreme Court pp3–7, May 22, 2026. Appeal dockets visible through September 1. Cocco: draft disclosure printed p46/PDF p52, “Litigation—Austin Transit Partnership”. ↩
- City legislative memorandum. SB2519. SB3067. SB3071. HB3879. 2023 HB3899. Memo p6 and attached Project Connect table, June 3, 2025. Official 89R histories. HB3899 final displayed action May 26, 2023. ↩
- ATP Resolution 2026-004. pp1, 3–7. January 21, 2026 authorization. ↩
- City 2020 Proposition A explanation. Project Connect scope, $7.1bn, federal assumption, tax increment. 2020 election. ↩
- ATP 2022 management report. May 2023 implementation plan. 2022 p15. 2023 PDF p6 current-dollar estimate and scope. ↩
- FTA FY2026 ratings appendix. ATP finance FAQ. Appendix Tables 2A/2B/2C, PDF pp2–4. FAQ pp4, 6–9, January 2025. ↩
- City–ATP amended funding agreement. §§2.2–2.4, printed agreement pp3–6/PDF pp6–9. February 2024. ↩
- City FY2026–27 approved budget, volume I. City tax rates. TCAD 2026 roll. City FY2027–31 forecast. City budget pp49–52, FY2021–27. TCAD PDF p13 jurisdiction 02, July 2026 roll. April 15, 2026 forecast pp5, 9–10. ↩
- ATP FY2025 ACFR. pp21–25, notes 10–11 pp40–41, historical table p50. Year ended September 30, 2025. Statistical section unaudited. Basic statements audited. ↩
- ATP FY2026–27 approved budget. pp21–22 and 36–39. Prior actuals, FY2026 projections, FY2027 appropriations. ↩
- City anti-displacement funding schedule. ATP–CapMetro agreement. Housing 13-year table. Agreement pp2–3 and Exhibit B p17, October 2025. ↩
- FTA FY2028 New Starts reporting instructions. Printed p33/PDF p36, finance-cost reporting boundary. April 2026. ↩
- FEIS Appendix F-1. FEIS Appendix D. F1 p17/PDF p20 Table 5 and annualization footnote. D p59 Table 5-1. December 2025 documents, older model. ↩
- NTD TS2.1 2025 data product. Linked official XLSX, report years 2015–25. OpExp Total, UPT, PMT, DRM and other worksheets. Exact cells in raw CSV. ↩
- NTD archived 1991–2014 workbook. LR agency/type-of-service rows, annual columns. Exact cells preserved. ↩
- BLS annual CPI-U table. U.S. city average, all items, annual Avg column. 2025 index 321.943. ↩
- WSDOT 2010 public transportation summary. Printed p43/PDF p49, Central Link. 2010 actuals. ↩
- City FY2022 budget. FY2024 budget. FY2025 budget. FY2027 taxpayer impact. FY2022 pp184–185 covers FY2021–22 medians. FY2024 p52 covers FY2023–24. FY2025 p45. FY2027 impact p1. Recent medians also appear in the City FY2026–27 approved budget p51. ↩
- Analyst model and independent audit files.
model_annual_cases.csv,model_sensitivities.csv, live XLSX andmodel_independent_qa.md. Calculations dated November 12, 2026. ↩ - ATP airport-extension announcement. board memorandum. November 10, 2026. Memorandum pp1–2. Registry L18/L27. Planning scope excluded from Phase 1 financing. ↩
Supporting material
- Excel model ↗Sourced inputs, live calculations and reported outputs.
- Source and model data (CSV collection) ↗Data tables, source references and calculation exports.
- Sources ↗Download as CSV.