Financial systems
The Warner Bros. Discovery auction, bid by bid
Paramount paid $31.02 a share. The base case values WBD and the buyer’s savings at $96.9 billion, below the announced $110 billion enterprise value.

Paramount completed its acquisition of Warner Bros. Discovery on October 6, 2026, paying $31.01666668 cash for each eligible WBD common share. The definitive agreement was signed February 27. WBD became a wholly owned subsidiary. Its proposed split into Warner Bros. and Discovery Global did not occur. The acquirer renamed itself Skydance Corporation, trading as SKYD. WBD’s closing filing, the buyer’s closing filing and Nasdaq’s corporate-action notice each confirm the closing.S01, S02, S03
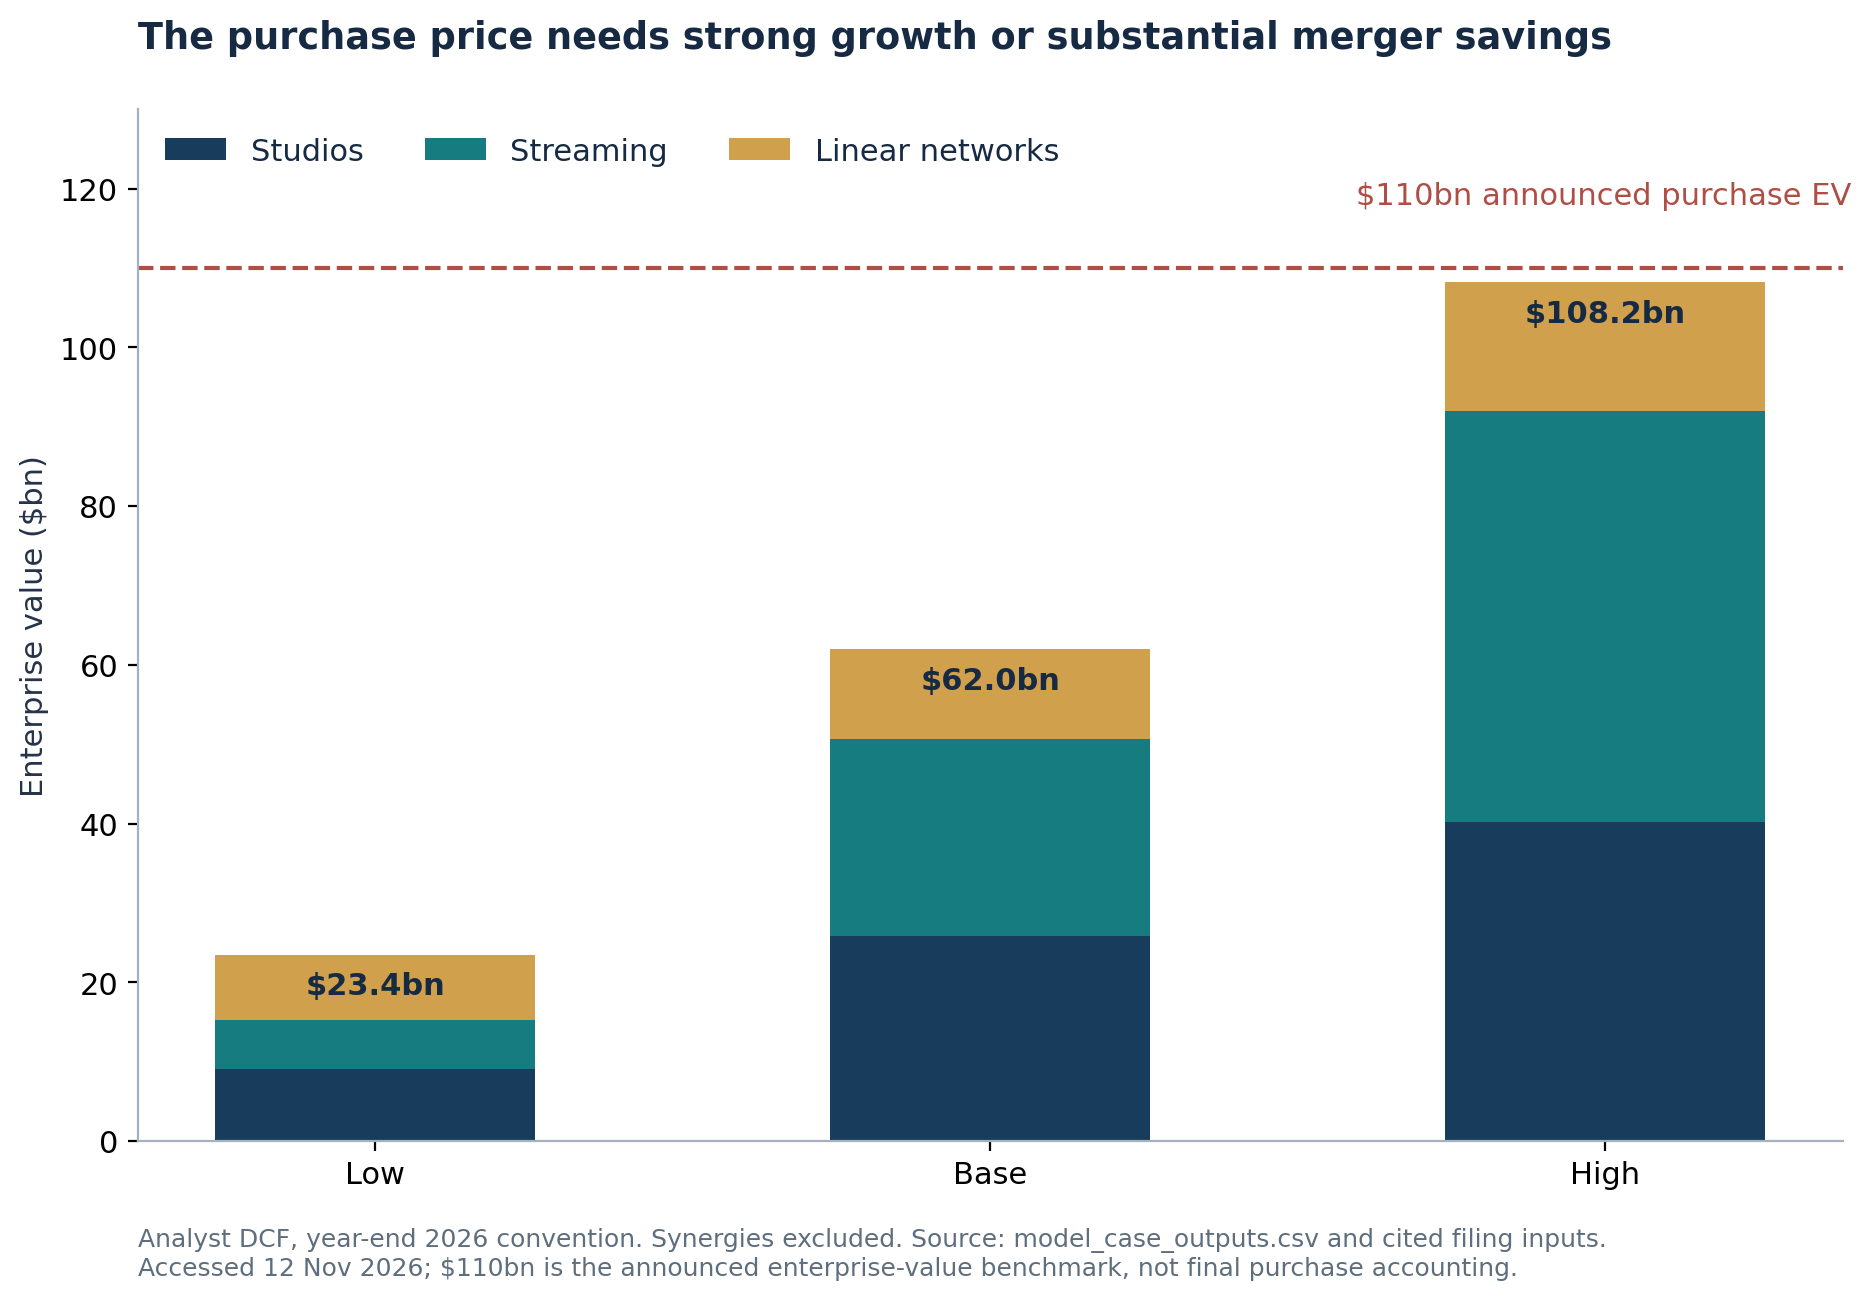
The transaction delivered a strong exit relative to this report’s standalone valuation. Whether it creates value for the buyer is much less settled. A discounted-cash-flow valuation of Studios, Streaming and cable networks produces $23.4 billion, $62.0 billion and $108.2 billion of standalone enterprise value in the low, base and high cases. The base case gives full credit to $6 billion of annual merger savings, phased in and then maintained indefinitely. After integration spending and modeled remedy costs, those savings are worth another $34.9 billion. Combined value is $96.9 billion, below the announced $110 billion purchase enterprise value and further below a $112.8 billion benchmark including the Netflix termination fee.
The comparison depends on the modeled cash flows, savings and required return. The high case supports the acquisition comfortably. At the modeled business cash flows and required return, the base case needs about $8.0 billion in durable annual savings to reach the $110 billion announced enterprise value. The hurdle rises to $8.4 billion if the $2.8 billion Netflix termination fee is added to that benchmark. Revenue synergies and strategic benefits are excluded because their incremental cash contribution is undisclosed.
For the buyer’s existing holders, dilution and refinancing matter as much as content ownership. The final equity issuance was approximately $47.0 billion at $12 per share, substantially below the original $16.02 subscription price. Management subsequently described approximately $87 billion of gross debt, approximately $10 billion of cash and roughly $6 billion of annual cash interest. Those facts make execution measurable: savings must become cash, cash must reduce debt, and per-share earnings must overcome the enlarged denominator.S02, S13, S14
1. Reconstructing the auction
The offers that changed the decision
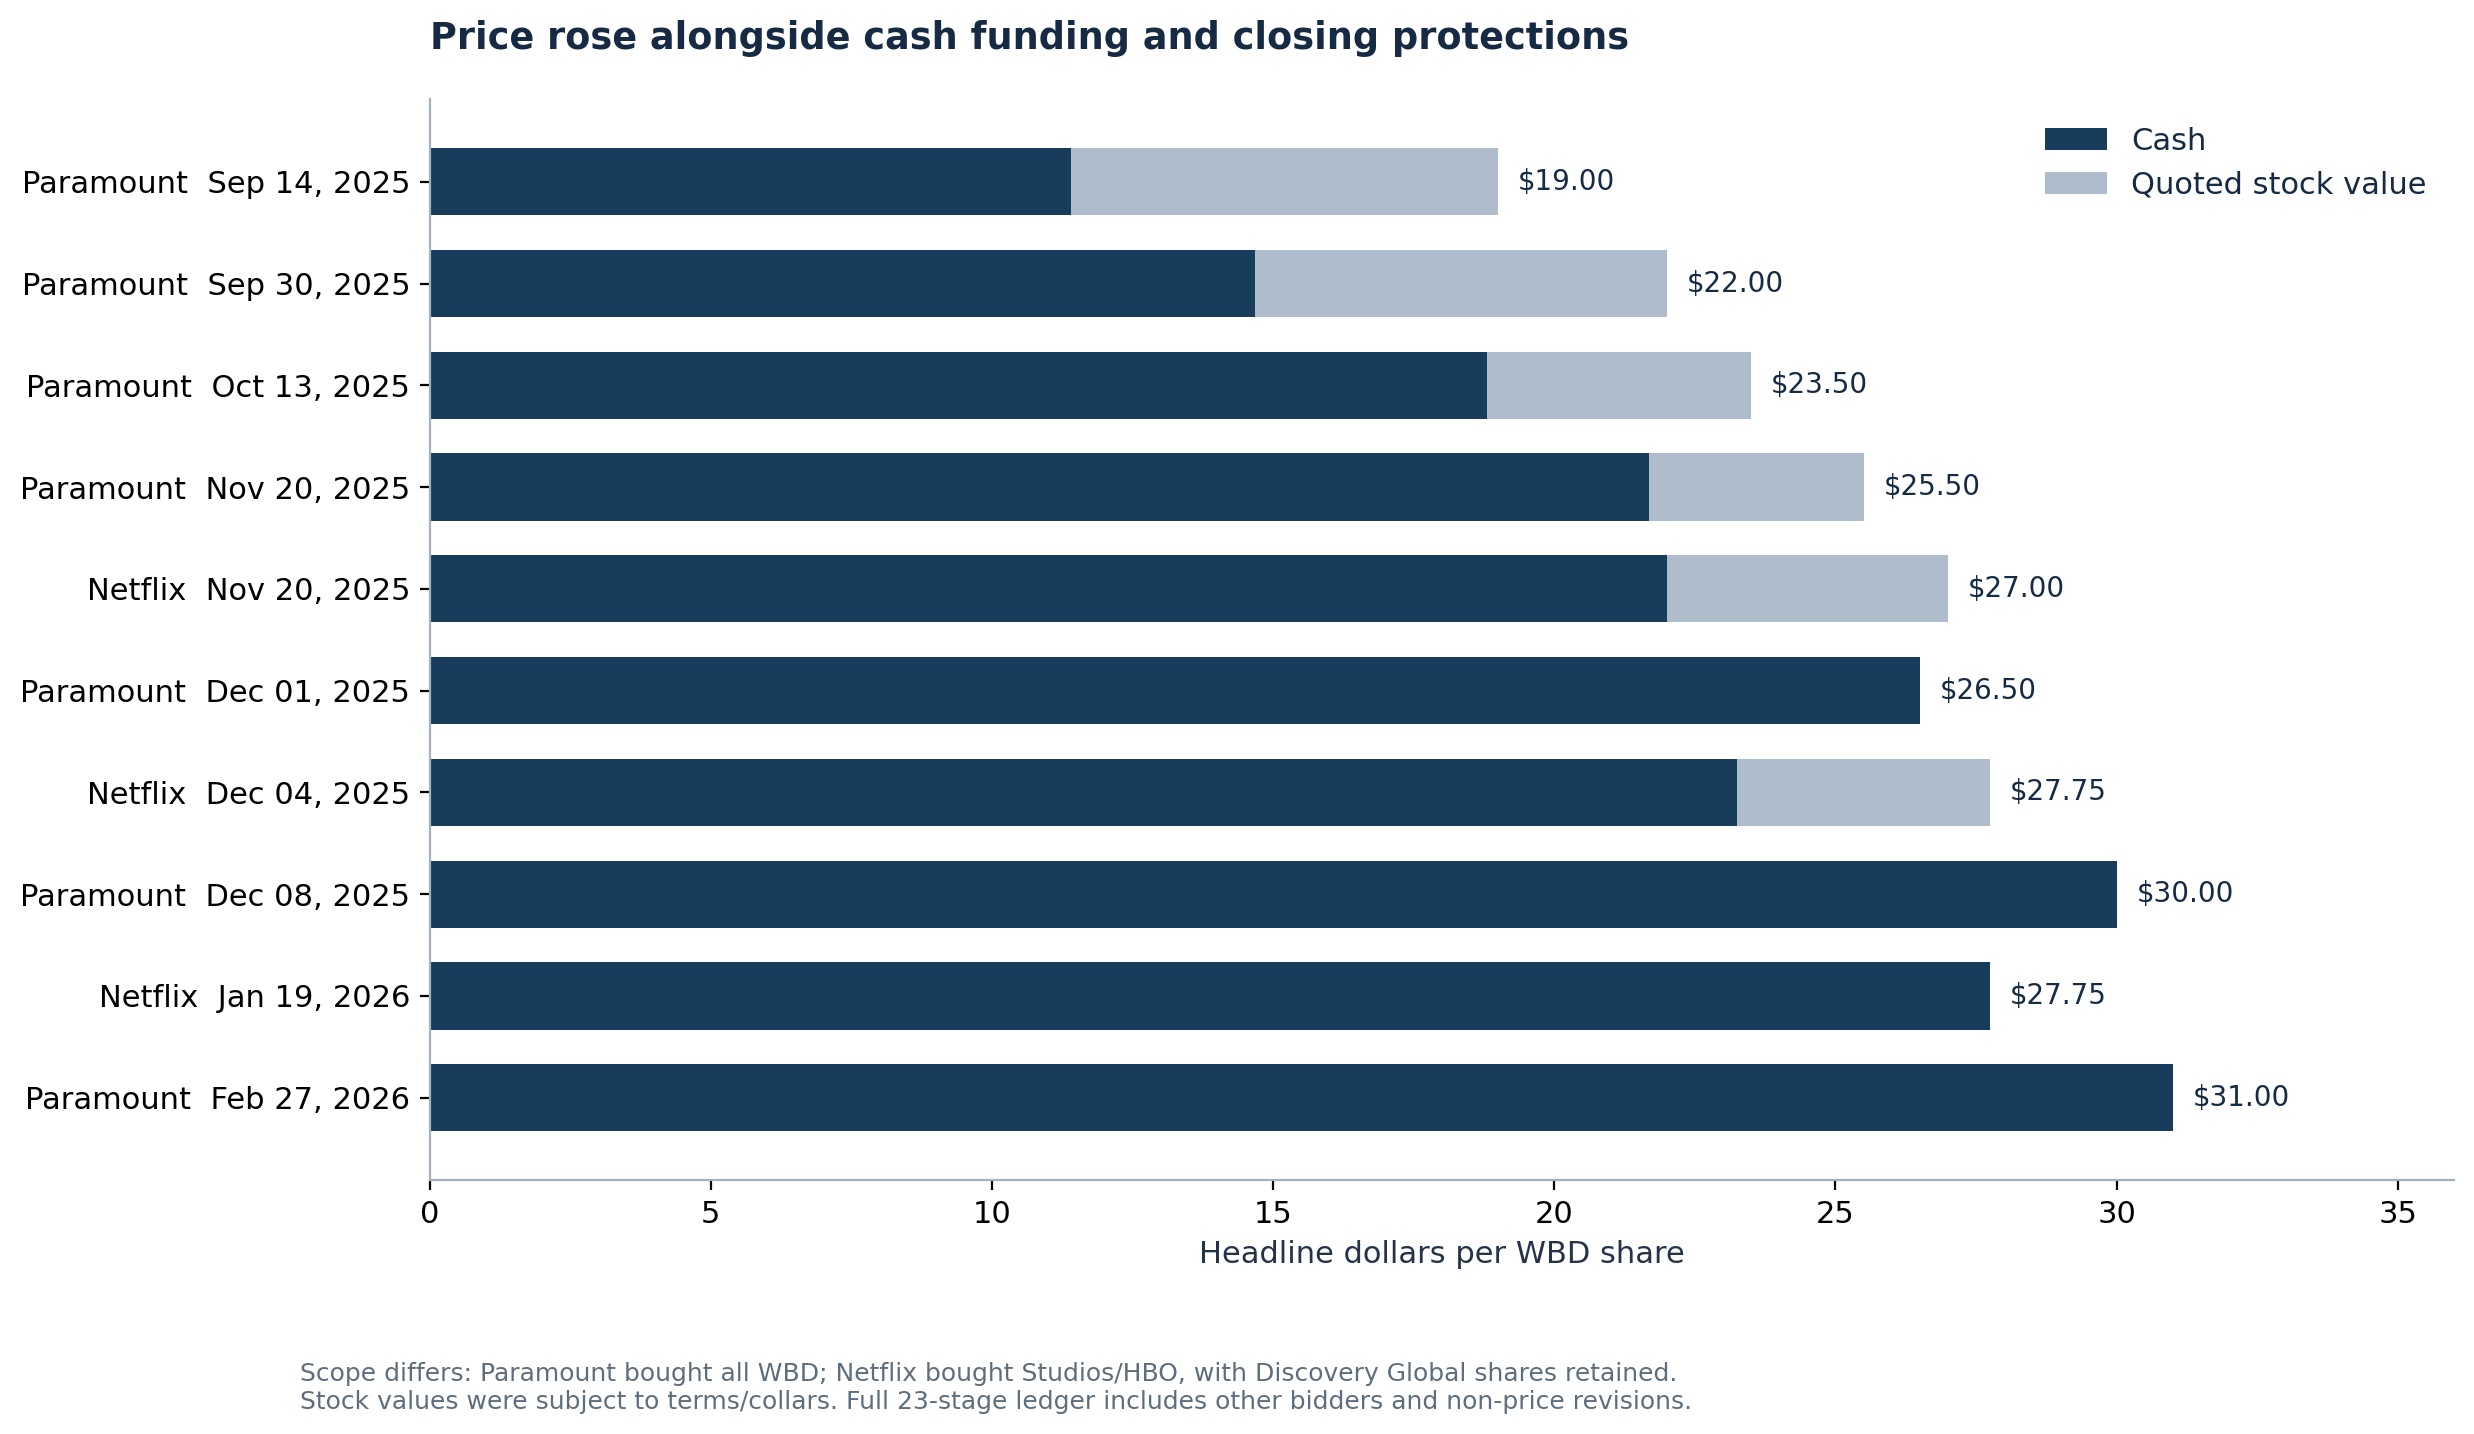
The relevant unit is not simply dollars per WBD share. Paramount pursued the whole company. Netflix pursued Studios and HBO-related streaming after the planned split, leaving WBD holders with Discovery Global. Company A proposed combining Streaming and Studios with some of its own businesses after spinning off Discovery Global; its indicative headline values also came with DG shares that WBD holders would keep. The table preserves these differences; the accompanying CSV contains 23 dated stages, including documentary revisions that did not change price.
| Proposal date | Bidder and perimeter | Headline value per WBD share | Cash / quoted stock | Board response or change in execution risk |
|---|---|---|---|---|
| Sep. 14, 2025 | Paramount; all WBD | $19.00 | $11.40 / $7.60 | Rejected September 22. Initial financing assertion included $14bn equity and $32bn debt. |
| Sep. 30 | Paramount; all WBD | $22.00 | $14.67 / $7.33 | Rejected October 7; $2bn reverse termination fee proposed. |
| Oct. 13 | Paramount; all WBD | $23.50 | $18.80 / $4.70 | Rejected October 20; strategic review announced October 21. Reverse fee $2.1bn. |
| Nov. 20 | Paramount; all WBD | $25.50 | $21.68 / $3.82 | First auction round; $34.5bn equity and $40bn debt proposed, with $5bn reverse fee. |
| Nov. 20 | Netflix; Studios/streaming | $27.00, plus DG shares | $22.00 / $5.00 | Continued in process; $2.8bn reverse fee proposed. |
| Nov. 20 | Company A; business combination | $33.25 indicative, plus DG | $3.75 / $29.50 | WBD holders would own 48% of combined company; contingent value rights up to $3.85. |
| Nov. 20 | Company C; DG plus 20% of core | $25bn aggregate | No comparable share price | Requested 90-day exclusivity; not actionable on the proposed basis. |
| Dec. 1 | Paramount; all WBD | $26.50 | All cash | $37.2bn equity involving seven cross-conditioned investors; $50bn debt; $5bn reverse fee. |
| Dec. 1 | Netflix; Studios/streaming | $27.75, plus DG | $22.50 / $5.25 | Reverse fee increased to $5.8bn; WBD termination fee $2.8bn. |
| Dec. 1 | Company A | $35.43 indicative, plus DG | $5.25 / $30.18 | 49% combined ownership; contingent rights up to $4.81; predominantly stock value. |
| Dec. 3–4 | Netflix; signed Dec. 4 | $27.75, plus DG | $23.25 / $4.50 | WBD selected Netflix; announcement December 5. |
| Dec. 4; tender Dec. 8 | Paramount; all WBD | $30.00 | All cash | $40.65bn equity and $54bn bridge proposed; board rejected tender December 16. |
| Dec. 22 | Paramount amended tender | $30.00 | All cash | Ellison personal guarantee of $40.4bn; reverse fee increased to $5.8bn. Rejected January 6. |
| Jan. 19, 2026 | Netflix amended agreement | $27.75, plus DG | All cash, subject to debt adjustments | Removed share-price exposure; announced January 20. |
| Feb. 10 | Paramount revised tender | $30.00 | All cash | Added ticking payment after December 31, Netflix-fee funding and debt-exchange protection. |
| Feb. 21–26 | Paramount improved offer | $31.00 | All cash | $7bn reverse fee; earlier ticking start; further protections. Binding offer February 26 judged superior. |
| Feb. 27 | Paramount definitive agreement | $31.00 plus ticking | All cash | Netflix waived matching; WBD signed with Paramount. |
| Oct. 6 | Completed transaction | $31.01666668 | All cash | Six days of ticking consideration paid. |
Sources: initial WBD recommendation, Paramount’s tender and amendments, and the two merger proxies. The merger proxies record the terms of the early approaches.S04, S05, S06, S07, S08, S09, S34
Company A remains Company A here: the cited filings anonymize it. Likewise, a February 18 communication from Nobelis Capital mentioning $32.50 was not a verified, financeable competing offer. The board could not verify its credentials or funding. The chronology includes the approach with its verification status.S04
Why $30 initially lost, and $31 eventually won
The board’s disclosed concerns extended beyond price: enforceability of equity support, financing conditions, interim operating restrictions, regulatory allocation and the consequences of failure. Paramount progressively tightened the package. The December personal guarantee addressed a specific funding concern; the February revisions moved more failure and timing risk to the bidder. This is the economic explanation for a board rejecting $30 cash while supporting a lower headline offer that left shareholders with assets.S05, S06, S07, S08
The original Netflix agreement offered $23.25 cash and $4.50 in stock within a $97.91–$119.67 Netflix-price collar. Outside the collar, fixed exchange ratios of 0.0460 or 0.0376 applied, so the stock component was not invariant. January’s all-cash amendment removed that exposure. The planned break-up still carried risks. Planned Discovery Global net debt was $17.04 billion at June 2026 or $16.14 billion at December 2026, and reallocating debt could reduce the Netflix cash amount.S09, S10
At final Paramount signing, equity commitments were approximately $46.97 billion and debt commitments included a $54 billion bridge plus $3.5 billion revolver. The contract provided a $7 billion buyer reverse termination fee and a $3 billion WBD termination fee, with specified reimbursement obligations involving Netflix’s fee and debt-exchange costs. These provisions depended on contractual triggers; they were not unconditional amounts all payable together. February’s package also advanced ticking to after September 30 and added solvency/equity-cure and operating protections.S04, S34
Inference: the decisive improvement was a larger cash price supported by stronger closing obligations. The fee package transferred risk; it could not make regulatory approval or business value certain.
2. What the operating history supports
The historical bridge matters because Studios and Streaming trade with each other. Summing segment profit without corporate expenses and eliminations exaggerates earning power.
| Reported metric | 2023 | 2024 | 2025 |
|---|---|---|---|
| Studios revenue | 12.192 | 11.607 | 12.619 |
| Streaming revenue | 10.154 | 10.313 | 10.876 |
| Networks revenue | 21.244 | 20.175 | 17.656 |
| Consolidated revenue | 41.321 | 39.321 | 37.296 |
| Studios adjusted EBITDA | 2.183 | 1.652 | 2.545 |
| Streaming adjusted EBITDA | 0.103 | 0.677 | 1.370 |
| Networks adjusted EBITDA | 9.063 | 8.149 | 6.412 |
| Corporate / EBITDA eliminations | (1.242) / 0.093 | (1.260) / (0.186) | (1.096) / (0.487) |
| Consolidated adjusted EBITDA | 10.200 | 9.032 | 8.744 |
| Operating cash flow less capex | 6.161 | 4.427 | 3.088 |
The raw CSV preserves revenue eliminations as well as these profit bridges. In 2025, $10.327 billion of segment EBITDA became $8.744 billion after $1.096 billion corporate expense and $487 million of eliminations. Of those eliminations, $419 million related to Studios/Streaming.S11, S12
First-half 2026 consolidated revenue was $17.610 billion and adjusted EBITDA $4.082 billion. Operating cash flow of $640 million less $544 million capex left only $96 million of free cash flow. That interim number is seasonal and affected by transaction activity; annualizing it would be inappropriate. Nevertheless, it prevents presenting the acquisition as a purchase of immediately abundant distributable cash.S15
Streaming: subscriber growth is not ARPU growth
At year-end 2025, WBD reported 131.6 million streaming subscribers: 59.2 million domestic and 72.4 million international, versus 116.9 million total a year earlier. Annual domestic ARPU fell from $11.89 to $10.79; international ARPU was $3.80 versus $3.85. Global annual ARPU declined from $7.76 to $6.92.S11
The ARPU footnote is essential: the numerator includes subscription revenue and net advertising revenue. Adding another advertising forecast would double count. This model uses average subscribers multiplied by monthly ARPU and twelve, with a calibrated residual for revenue outside that approximation. The 2025 residual is about $334 million; it reconciles the segment figures to the consolidated total.
WBD stopped reporting quarterly subscriber and ARPU metrics after 2025. Management’s February expectations of more than 140 million subscribers in first-quarter 2026 and more than 150 million by year-end were targets. the filings reviewed here contain no later subscriber counts to check them against. The model’s 2026 starting total of 150 million, domestic/international split of 61/89 million and ARPUs of $10.65/$4.15 are therefore estimates.S12
3. Three DCFs, with the assumptions exposed
The valuation convention is year-end 2026, discounting 2027–2031 cash flows and terminal value. It uses the latest standalone WBD net-debt disclosure available in this research—June 30, 2026—and October closing common shares. The result combines debt and share counts measured at different dates.
For each business:
UFCF=(EBITDA-eliminations-overhead-economic SBC)-cash taxes-capex-net content investment-Δ NWC
Cash taxes equal 25% × max(0, economic EBITDA − physical depreciation). Content expense already sits inside EBITDA. Only cash content investment above expensed content is deducted again. The calculation tracks physical depreciation, capex and acquired-intangible amortization individually.
WBD’s filings support that treatment. WBD’s 2025 physical depreciation was $1.079 billion, compared with $5.684 billion total depreciation and amortization. The adjusted-EBITDA bridge excluded $751 million of stock compensation; the cash-flow statement’s $769 million is a different measure. Removing the content fair-value and capitalized-interest adjustments already excluded from EBITDA produces approximately $370 million of net content cash drag.S11
Segment capex and net-content cash schedules are unavailable at the required detail. Explicit estimated revenue ratios fill that gap: capex is 2.8%/3.5%/2.7% for Studios/Streaming/Networks; net additional content cash is 1.5%/2.0%/0%; physical depreciation is 1.5%/2.0%/2.5%. Incremental working capital is 1% of revenue change. Historical ratios calibrate the model, but do not turn those allocations into reported facts.
| Principal analyst assumption | Low | Base | High |
|---|---|---|---|
| Studios revenue growth, 2027; 2031 | 3%; 2% | 12.9%; 3% | 15%; 5% |
| Studios EBITDA margin, 2031 | 22.0% | 28.5% | 31.0% |
| Domestic subscriber growth annually | 0% | 2% | 4% |
| International subscriber growth annually | 6% | 14% | 20% |
| Domestic / international ARPU growth | 0% / 0% | 3% / 3% | 4% / 5% |
| Streaming EBITDA margin, 2031 | 20% | 28% | 33% |
| Networks revenue decline annually | 12% | 9% | 6% |
| Networks EBITDA margin, 2031 | 26% | 28% | 31% |
| Studios / Streaming / Networks WACC | 11.5% / 11.5% / 13% | 9.5% / 10% / 12% | 8.5% / 9% / 11% |
| Terminal growth, same order | 0% / 1% / −10% | 2% / 2.5% / −7% | 2.5% / 3% / −5% |
| Full annual merger savings | 3.0 | 6.0 | 7.5 |
Base Studios revenue and EBITDA for 2027–2030 follow the rounded management projections in the final proxy. Streaming is built independently from subscribers, ARPU and margins. Base subscribers reach approximately 239 million in 2031, versus 296 million in the high case. These are demanding growth paths, especially because international additions initially monetize at much lower ARPU than domestic subscribers.S04 (model estimates)
The Networks base case assumes a continuing decline. Its negative terminal growth prevents today’s high margin from becoming an infinite stable annuity. The chosen 12% WACC is deliberately more demanding than the approximately 7%–8% ranges used in some transaction-adviser analyses; changing that judgment materially changes residual cable equity.
Standalone SOTP
| Analyst valuation | Low | Base | High |
|---|---|---|---|
| Studios EV | 9.11 | 25.85 | 40.25 |
| Streaming EV | 6.10 | 24.81 | 51.69 |
| Networks EV | 8.23 | 11.32 | 16.26 |
| Total EV | 23.45 | 61.99 | 108.19 |
| June net debt, including finance leases | (29.69) | (29.69) | (29.69) |
| Residual equity / funding shortfall | (6.24) | 32.29 | 78.50 |
| Common value per closing share | $0 floor | $12.85 | $31.24 |
The negative residual in the low case measures a funding shortfall. The model excludes restructuring and option value. Net debt comprises $32.402 billion debt principal plus $659 million finance leases less $3.369 billion cash.S15
The base valuation depends heavily on cash flows beyond the explicit forecast: terminal value supplies approximately 74% of Studios EV and 80% of Streaming EV, versus 33% for Networks. A working analyst should therefore challenge mature margins and discount rates before interpreting the second decimal place.
As an independent methodological cross-check, use the proxy’s 2027–2030 unlevered cash-flow forecasts and extrapolate 2031 at each stated terminal-growth rate. Warner Bros. at 10% WACC and 2% terminal growth is worth about $48.4 billion; Discovery Global at 12% and −7% is worth $14.6 billion. Their combined $63.0 billion is close to the $62.0 billion estimate built from segment forecasts. This check uses different cash-flow construction and contractual perimeters, with the same broad risk judgment.S04 (proxy_dcf_crosscheck.csv)
4. Debt and overhead: two rules, two different residuals
Neither allocation rule is a legal allocation of acquisition debt. Both are analytical conventions for testing whether a business can carry its share of the capital structure.
Rule 1, the default: allocate net debt and corporate overhead by 2025 gross segment revenue. Studios receives 30.7%, Streaming 26.4% and Networks 42.9%.
Rule 2: allocate both by positive 2025 segment EBITDA after assigned eliminations. The weights become 23.6%, 12.0% and 64.5%. The $419 million core elimination is allocated between Studios and Streaming by revenue; the remaining $68 million goes to Networks.
| Base case | Revenue rule: EV / debt / residual equity | EBITDA rule: EV / debt / residual equity |
|---|---|---|
| Studios | 25.85 / 9.11 / 16.75 | 26.67 / 7.00 / 19.67 |
| Streaming | 24.81 / 7.85 / 16.96 | 26.46 / 3.55 / 22.91 |
| Networks | 11.32 / 12.74 / (1.42) | 10.06 / 19.14 / (9.08) |
| Total | 61.99 / 29.69 / 32.29 | 63.19 / 29.69 / 33.50 |
Debt allocation alone cannot change total equity value. Overhead allocation can: assigning costs to businesses with different discount rates changes their combined present value. That explains the $1.2 billion difference between these totals.
The practical finding is more robust than either allocation. Loading debt according to current EBITDA puts the largest obligation on the fastest-declining business. The Networks allocation puts more debt on the business than its modeled cash flows can support.
5. What each price implies for the pieces
For comparability, the bid bridge uses 2.595 billion equivalent shares, calculated from Netflix’s announced $72 billion equity value divided by $27.75. It holds June net debt constant. The table applies the same enterprise-value method to each bid.
Reported Streaming includes Discovery+, while the Netflix perimeter excluded it. The model allocates 8.33% of Streaming value to Discovery+, using the proxy’s 2030 EBITDA mix: $0.4 billion divided by $4.8 billion combined streaming EBITDA. This is an estimated perimeter bridge. Base Discovery Global value consequently becomes $13.39 billion, and Studios plus HBO-related streaming $48.59 billion.
For whole-company bids, hold Discovery Global at that DCF value and assign the remaining price to the core. Split core value between Studios and HBO in proportion to their DCF values. No public purchase-price allocation gives those values.
| Offer, normalized | Total acquired EV | Implied Studios | Implied HBO/core streaming | DG value assigned |
|---|---|---|---|---|
| Paramount $19 | 78.99 | 34.90 | 30.70 | 13.39 |
| Paramount $22 | 86.77 | 39.04 | 34.34 | 13.39 |
| Paramount $23.50 | 90.66 | 41.11 | 36.16 | 13.39 |
| Paramount $25.50 | 95.85 | 43.87 | 38.59 | 13.39 |
| Paramount $26.50 | 98.45 | 45.25 | 39.80 | 13.39 |
| Paramount $30, including unchanged-price amendments | 107.53 | 50.08 | 44.05 | 13.39 |
| Paramount $31, including final signing | 110.12 | 51.47 | 45.27 | 13.39 |
| Netflix $27, plus DG shares | 83.61 | 44.48 | 39.13 | Goes to WBD holders |
| Netflix $27.75, stock or all-cash form | 85.55 | 45.52 | 40.04 | Goes to WBD holders |
Rounding can affect displayed sums. The live workbook calculates these allocations. Netflix’s normalized $85.55 billion differs from its announced $82.7 billion EV because the comparison uses a different debt date and convention. It would be misleading to present the difference as a bid increase.S10
Company C offered $25 billion cash for DG plus 20% of the core. That asset bundle has $23.11 billion base DCF enterprise value. Only if the $25 billion is treated as total enterprise consideration does holding DG fixed imply $58.04 billion for the full core. The disclosed summary leaves the debt allocation unknown, so the enterprise-value comparison depends on the assumed allocation. Company A cannot be allocated credibly from its quoted share value alone: the contributed-business valuation, debt bridge and contingent rights prevent a clean cash-equivalent SOTP. Its implied standalone pieces remain UNKNOWN.
The Netflix-versus-Paramount hurdle
To equal $31 cash, Netflix’s $27.75 needed at least $3.25 per WBD share of DG equity that holders would keep. On the normalized share base and planned $16.14 billion DG debt, that requires about $24.57 billion of DG enterprise value. The base estimate of $13.39 billion does not clear the debt; even the high case’s $20.57 billion implies a combined Netflix package of only about $29.46 per share before any cash-price adjustment.
This result is sensitive to the cable hurdle rate. Applying 7.5% WACC and −3% terminal growth to the proxy’s DG cash forecasts produces approximately $24.06 billion EV, close to the required amount. A belief that cable cash flows merit that lower required return makes Netflix considerably more competitive. The board comparison was therefore partly a disagreement about the durability and debt capacity of Discovery Global, in addition to the $31 and $27.75 headline prices.
6. The winner’s financing and per-share hurdle
Financing at closing
The buyer issued 3,917,657,246 new shares at $12, raising $47.0119 billion. At $16.02, the same proceeds would have required approximately 2.935 billion shares. The lower issuance price therefore required about 983 million additional shares, a 33.5% increase in newly issued shares.S02
The final package included about $56.9 billion of new debt. A remaining $49 billion bridge was terminated undrawn, and a $5 billion revolver remained undrawn. The debt ledger details eight dollar first-lien bond tranches totaling $30 billion, three dollar second-lien tranches totaling $11.4 billion, euro second-lien notes and dollar/euro term loans. Dollar first-lien coupons range from 6.30% to 8.90%; dollar second-lien coupons from 8.25% to 9.125%.S13
Those borrowings fund more than shareholder cash. Preliminary transaction consideration was $97.402 billion, comprising $77.952 billion common consideration, $1.951 billion pre-combination awards, $14.699 billion WBD term-loan repayment and the $2.8 billion Netflix termination fee. The fee was paid earlier and is already in that accounting total. The difference between new funding and these listed uses is not automatically surplus cash: timing, existing cash, expenses, other refinancings and unpaid awards prevent a complete closing funds-flow reconciliation.S13
Ellison’s reported new equity was $14.85 billion and RedBird’s $5.2 billion. The remainder came through the financing syndicate. FCC-approved foreign ownership percentages describe permissions and expected stakes. Each sovereign investor’s final contribution remains undisclosed.S13, S22
Cash available for deleveraging needs care
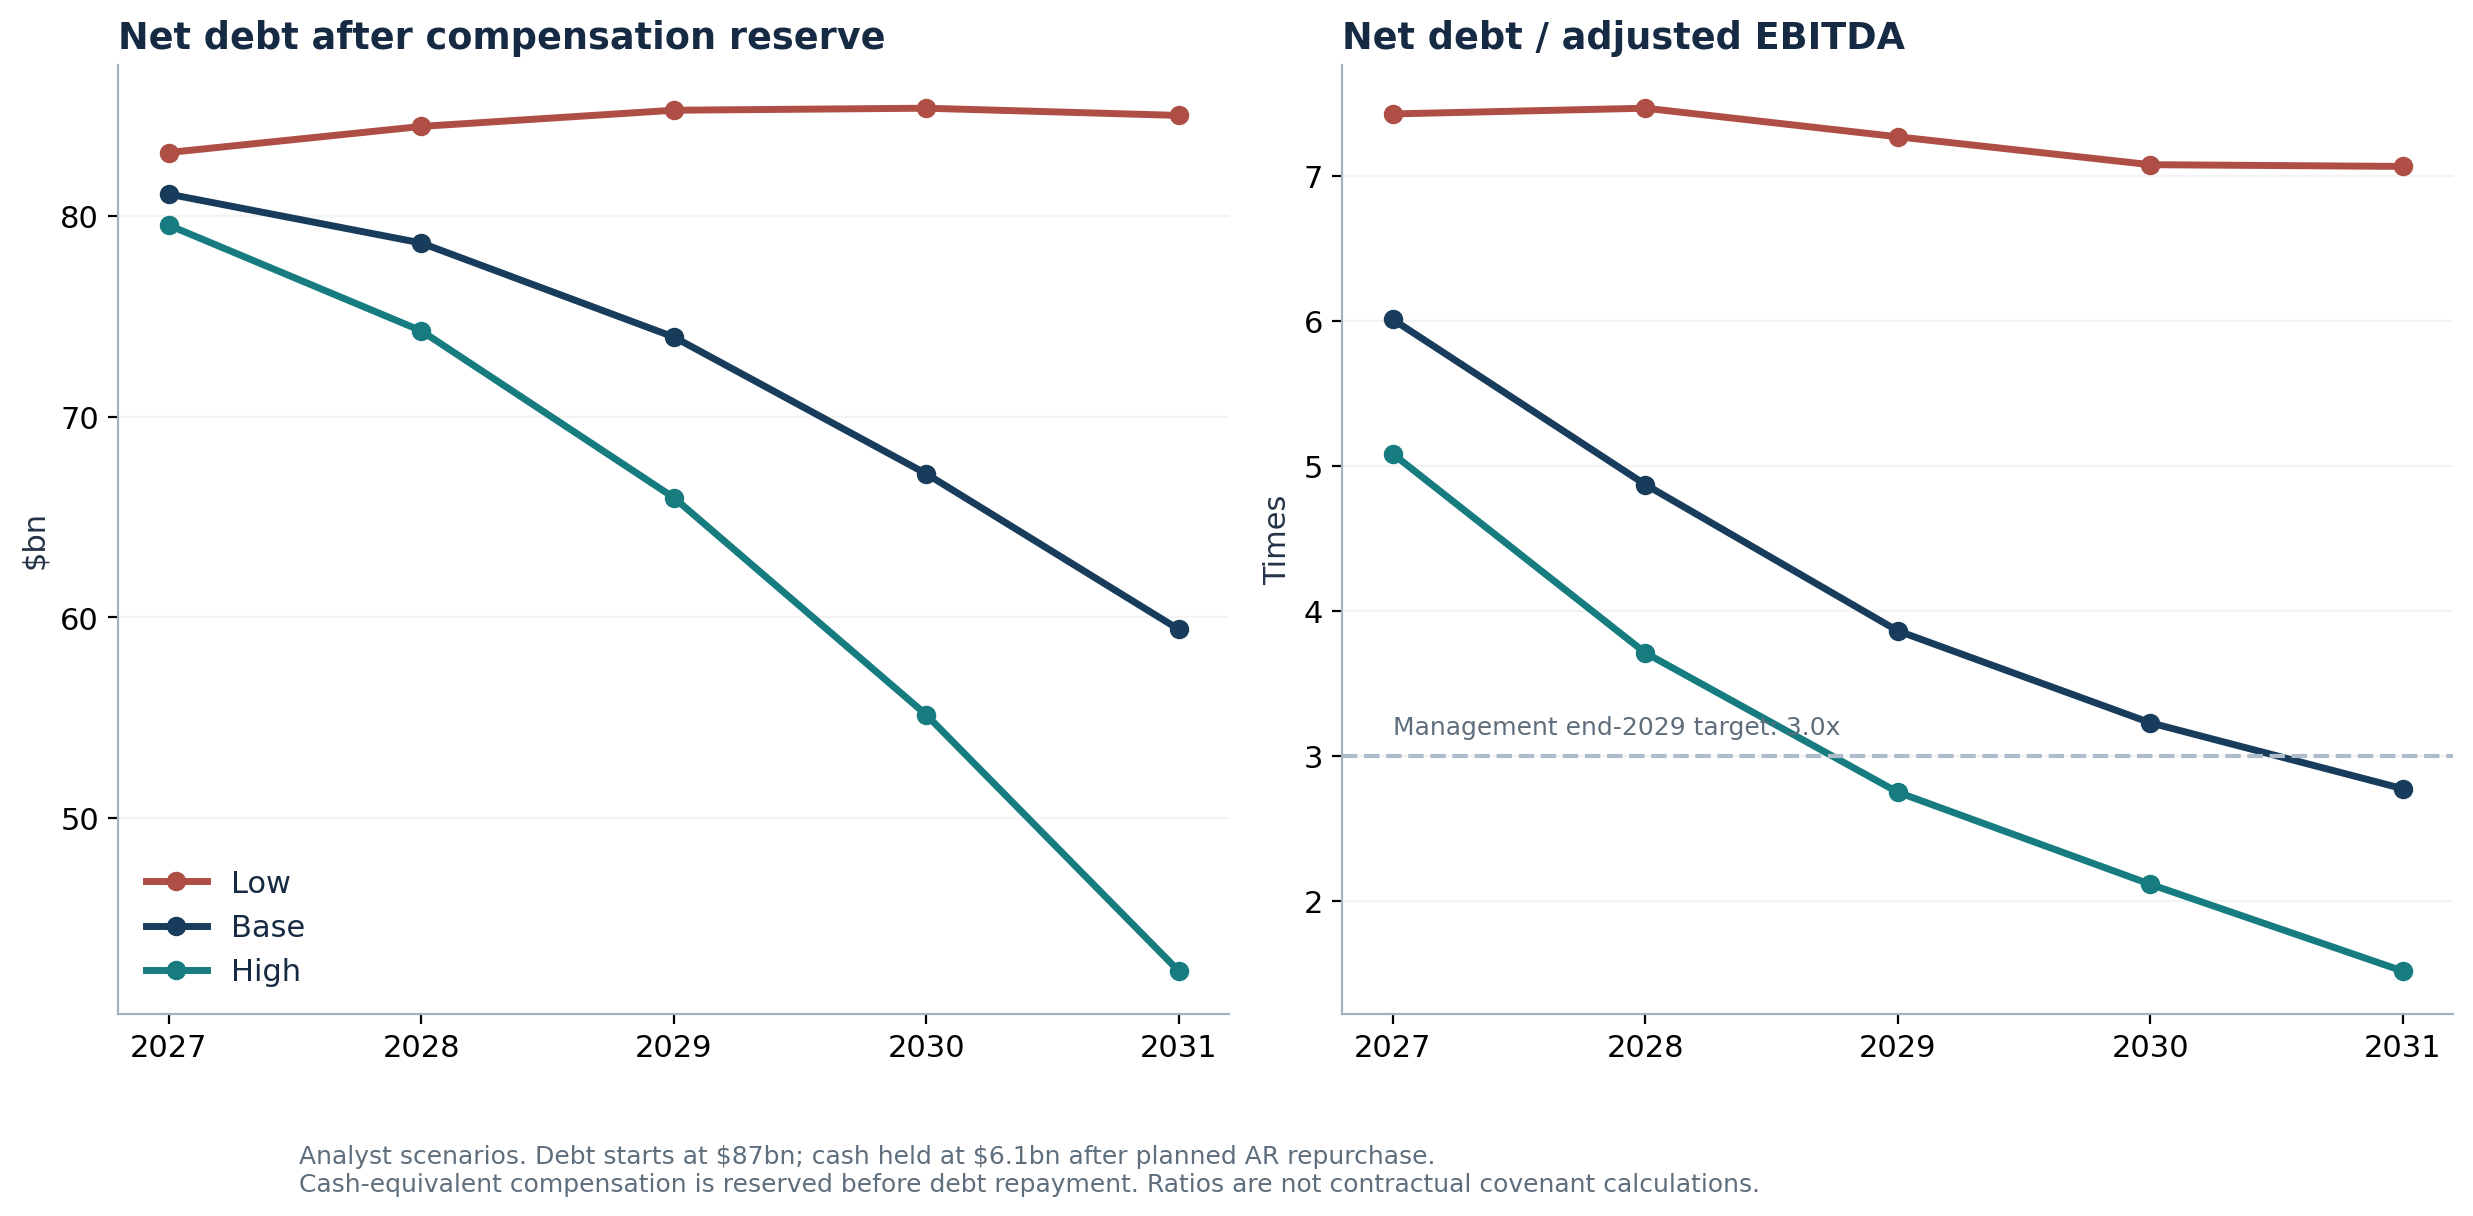
Management’s approximately $87 billion debt and $10 billion cash description gives rounded post-closing balances. WBD’s receivables-financing exit requires approximately $3.9 billion cash to repurchase receivables. It restores an asset; it does not retire $3.9 billion of the stated bond-and-loan debt. The model consequently uses $6.1 billion cash and starts with $80.9 billion net debt. The 2027 opening model holds these rounded post-closing balances constant after the receivables adjustment. The bridge excludes fourth-quarter cash generation and other payments.S13, S14, S16
Employee awards add an unresolved issue. The $1.951 billion purchase-consideration figure combines vested awards already paid and the pre-combination portion of unvested awards. The current filing does not disclose their split. A further approximately $1.18 billion relates to post-combination service over up to three years. The model assumes those service payments fit within its annual compensation cash reserve; deducting them again would double count.S13
A $0/$0.6/$1.951 billion reserve sensitivity tests the unresolved pre-combination component. The $0.6 billion illustration is anchored to a historical pro forma liability estimate of $614 million. The upper amount is a mathematical ceiling on the unresolved component. Base 2029 leverage moves from 3.86× to 3.89× or 3.96×. Legacy obligations could still reduce the $6.1 billion cash balance used in the model.
The cash-flow and EPS model
Paramount standalone 2026 adjusted EBITDA guidance of $3.9 billion supplies the buyer starting point. Estimated standalone growth is −5%/3%/6% across cases. For cash flow, the model deducts a compensation cash reserve, cash interest, taxes, capex, net additional content spending, working-capital changes and integration cash from adjusted EBITDA. Physical depreciation reduces taxable operating earnings and economic EPS but is not a second cash outflow. It assumes a continued $0.20 annual dividend per basic share. Positive cash after dividends repays debt; deficits add borrowing.
| Base analyst forecast | 2027 | 2028 | 2029 | 2030 | 2031 |
|---|---|---|---|---|---|
| Combined adjusted EBITDA | 13.50 | 16.15 | 19.15 | 20.80 | 21.42 |
| FCF after compensation reserve | 0.81 | 3.45 | 5.69 | 7.83 | 8.76 |
| FCF before that reserve | 1.93 | 4.60 | 6.88 | 9.03 | 10.00 |
| Ending net debt | 81.10 | 78.67 | 73.98 | 67.16 | 59.41 |
| Net debt / adjusted EBITDA | 6.01× | 4.87× | 3.86× | 3.23× | 2.77× |
| Adjusted EBITDA / cash interest | 2.25× | 2.69× | 3.28× | 3.77× | 4.24× |
| Economic diluted EPS | $0.73 | $1.11 | $1.56 | $1.84 | $1.99 |
| Economic EPS accretion / dilution | −51% | −29% | −5% | +7% | +11% |
Management targets 3× net leverage by year-end 2029 and more than $10 billion FCF in 2030. The base case misses both. The closest comparison to issuer-style FCF is $9.03 billion before the compensation reserve. After the reserve, base free cash flow is $7.83 billion. Even that comparison remains approximate because tax, content timing and integration classifications may differ.S14
The range is wide. In 2029, low/base/high net leverage is 7.27×/3.86×/2.75×. In 2030, FCF after compensation reserve is $0.91/$7.83/$11.84 billion, and economic EPS $0.51/$1.84/$2.60. Only the high case achieves the leverage objective on schedule.
EPS uses 5.044 billion reported basic shares plus treasury-stock dilution for 470.7 million $12-strike warrants. Assumed SKYD prices of $10/$16/$22 determine dilution; they are not price forecasts. Base diluted shares are 5.162 billion. Accretion compares with modeled standalone Paramount earnings on the inferred legacy share base.S13 (analyst calculations)
Economic EPS excludes acquired-intangible amortization and one-off integration accounting. Subtracting an illustrative $8 billion annual total omitted amortization, after 25% tax, reduces base 2030 EPS from $1.84 to about $0.68. The sensitivity applies the assumed amortization mechanically. A GAAP calculation would require final purchase accounting, tax treatment and loss-period antidilution rules. Annualizing the buyer’s pre-acquisition third-quarter adjusted EPS would be especially misleading because the quarter included a substantial derivative gain and did not include WBD operations.S13, S16
The model assumes maturities can be refinanced at the initial average cash-interest rate, approximately 6/87 or 6.9%. The filing reports $20.29 billion of debt falling due during the five years after the October 6, 2026 closing, excluding finance leases. Operating cash swept to principal can fund part of that amount; the model assumes remaining maturities refinance. This rolling five-year window is not the total for calendar 2027–2031. A 100-basis-point increase on approximately $14.5 billion floating debt costs about $145 million annually before tax, or roughly $0.02 base diluted EPS. Ordinary net-debt ratios are not contractual covenant calculations: the credit agreement permits substantial defined EBITDA adjustments.S13, S17
7. Synergies: the amount is only half the question
The November plan identifies at least $6 billion annual savings: $2.2 billion corporate/real estate, $1.0 billion marketing, $1.4 billion technology and $1.4 billion procurement. Against the indicated $26 billion addressable cost base, the target is approximately 23%. It is incremental to Paramount’s existing standalone efficiency program, so that earlier program must not be counted again.S14
Management describes 30% realization in year one and 70% through year two of its three-year run-rate program. The base model treats these as end-of-period run-rates, maps them onto calendar 2027–2029, and assumes linear realization from zero, producing average-year savings of 15%, 50% and 85%, then 100%. Treating year-end run-rates as full-year cash would overstate early benefit. Base integration cash is $4 billion, including $1.75 billion in 2027; low-case implementation costs are higher.
The persistence assumption dominates the valuation:
| Base savings treatment | Present value |
|---|---|
| Full $6bn annual savings maintained indefinitely after 2031 | 34.92 |
| Savings decay 5% annually after 2031 | 24.68 |
| Savings end after 2036 | 17.57 |
The full acquisition economics across cases are:
| Analyst acquisition value | Low | Base | High |
|---|---|---|---|
| Standalone WBD EV plus net synergy PV | 37.09 | 96.91 | 154.54 |
| Value less $110bn announced enterprise value | (72.91) | (13.09) | 44.54 |
| Value less $112.8bn if the $2.8bn Netflix fee is incremental | (75.71) | (15.89) | 41.74 |
All three include modeled integration spending, taxes and quantified annual remedy costs. The first grants a large permanence benefit. Real estate consolidation can persist; marketing cuts may need reinvestment; technology savings can be competed away; procurement savings can be offset by content inflation. A single synergy total conceals those differences.
Disney/Fox and the 2022 WBD combination
Disney’s 2018 revised Fox agreement announced $71.3 billion equity value, $85.1 billion EV and at least $2 billion annual cost savings by 2021, with second-year EPS accretion before purchase accounting. Closing accounting in March 2019 recorded $69.5 billion consideration: $35.7 billion cash and $33.8 billion stock. Different measurement dates and stock consideration affect the comparison.S28, S29
Disney’s CFO stated in November 2020 that the company had exceeded the $2 billion synergy target, with $1.7 billion cumulative Fox restructuring costs. It would be inaccurate to use Fox as proof that promised savings never materialized. Disney also reported Star India impairments of $1.545 billion in 2024 and $75 million in 2025. Its broader linear-network impairments cannot all be assigned to Fox. The public segment structure, disposals and pandemic effects prevent a clean isolated Fox acquisition IRR.S30, S31
The 2021 announcement behind the 2022 WBD merger projected approximately $52 billion 2023 revenue, $14 billion adjusted EBITDA and about 60% FCF conversion, alongside at least $3 billion annual cost synergies. Reported 2023 revenue was $41.321 billion, EBITDA $10.200 billion and FCF $6.161 billion: revenue and EBITDA were approximately 20.5% and 27.1% below the original projections.S12, S25
That comparison does not mean no savings occurred. WBD’s 2025 proxy credited $1.8 billion of cost savings and integration synergies in 2024, although that compensation narrative is not an audited reconciliation against the original run-rate target. Meanwhile, pro forma 2022 Networks EBITDA of $10.051 billion fell to $6.412 billion in 2025, while Streaming improved from a $2.063 billion loss to $1.370 billion profit.S11, S26, S27
Inference: successful cost extraction can coexist with disappointing acquisition returns. The new transaction must overcome both its financing burden and continuing linear erosion; achieving a savings headline is necessary evidence, but insufficient proof of value creation.
8. The loser’s opportunity cost
Netflix received the $2.8 billion termination fee and recognized approximately $85 million financing-cost amortization associated with terminating the WBD arrangements. The simple difference is $2.715 billion before tax, advisory costs and other unisolated expenses. It is not a complete profit calculation. The acquisition facilities were terminated undrawn.S32
Netflix gave up Studios/HBO ownership, content-control options and its announced $2–3 billion synergy expectation. It also avoided the $82.7 billion enterprise-value commitment and the execution burden of a corporate split. An illustrative 8%–10% capital charge on that EV is $6.6–$8.3 billion annually. The annual amount applies the assumed return hurdle to enterprise value.
The alternative use of capital is observable only in part. Netflix’s nine-month 2026 cash-flow statement shows approximately $10.8 billion of share repurchases and $10.2 billion operating cash flow, with the latter including the fee. Removing the $2.8 billion receipt gives roughly $7.4 billion before associated tax and cost adjustments. The April authorization permitted up to $25 billion in repurchases. The data leave open how much the withdrawal affected repurchases.S32
For an analyst, the right comparison is incremental value from acquiring WBD versus organic investment, licensing and repurchases at the prices paid. Public data cannot isolate the proprietary revenue uplift Netflix expected or the counterfactual repurchase return. Calling withdrawal a strategic defeat or a financial triumph goes beyond the evidence.
9. What WBD holders earned since 2022
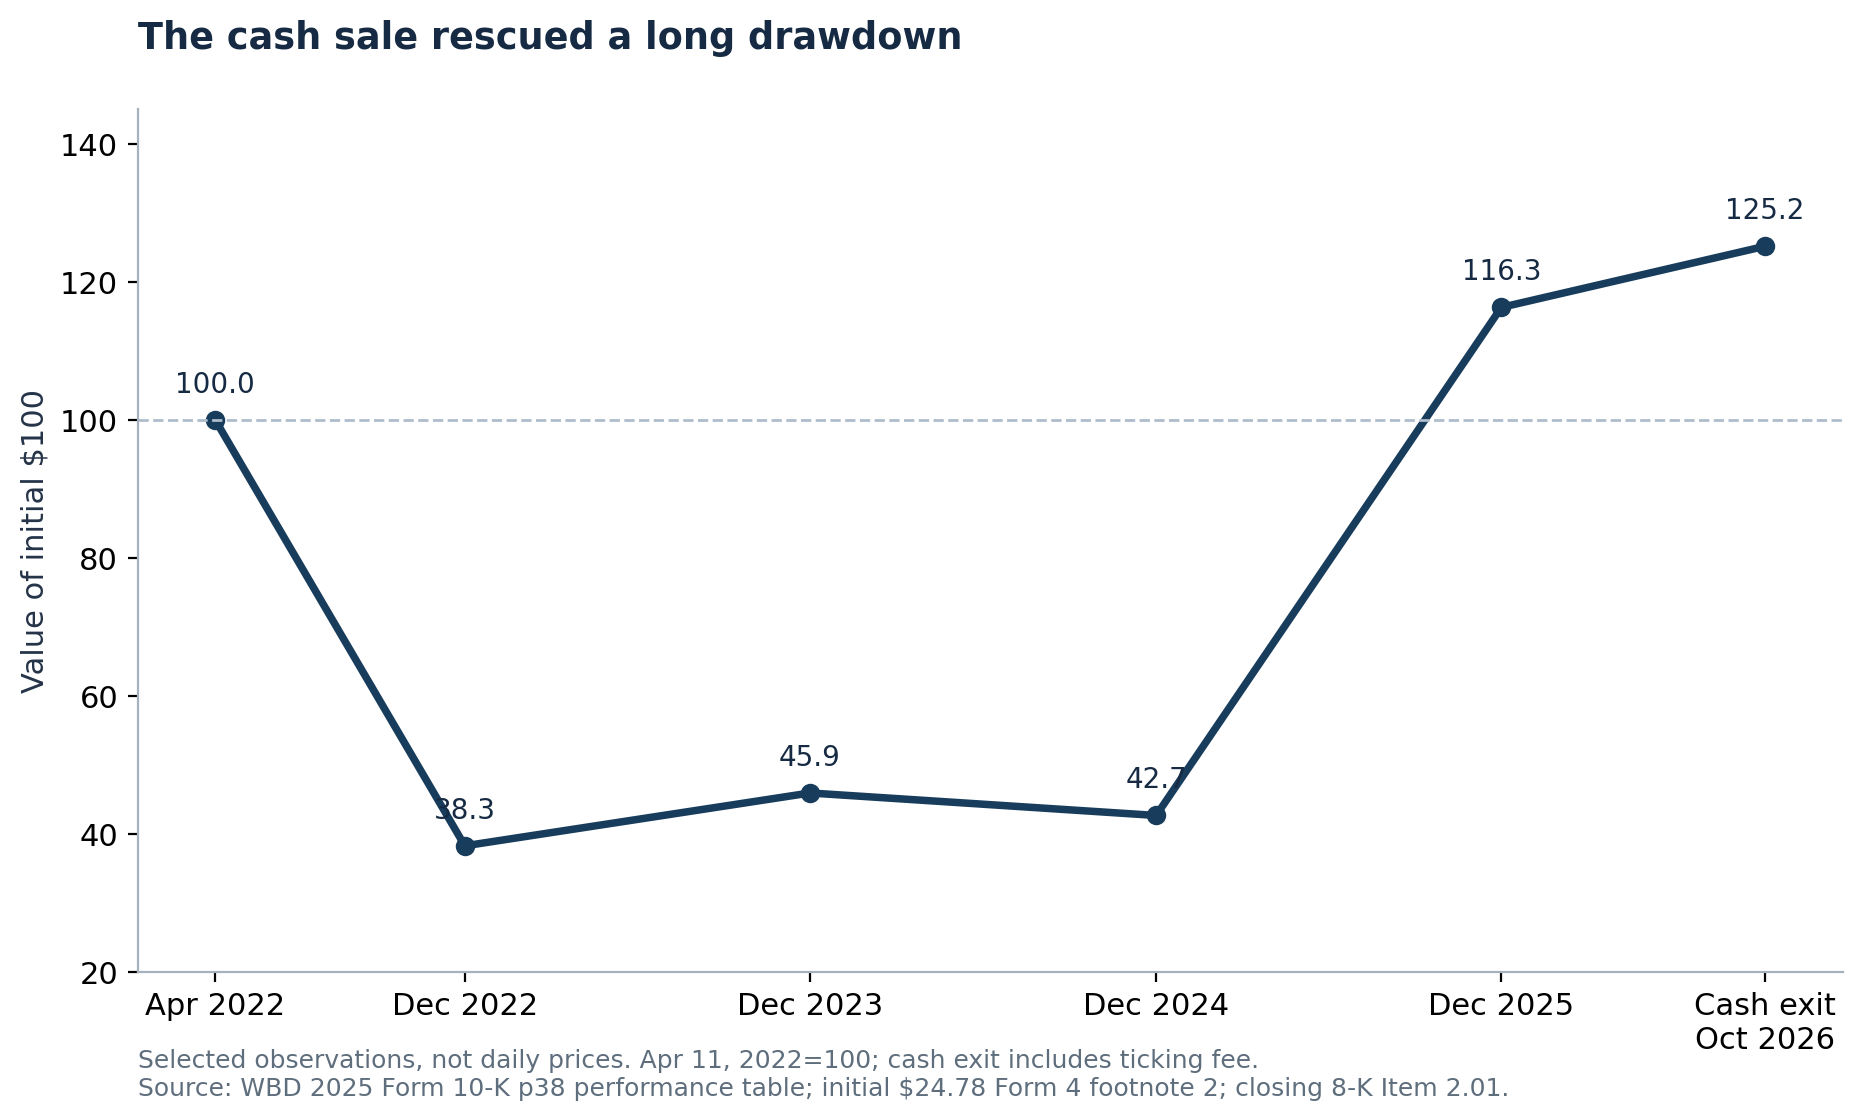
A contemporaneous SEC Form 4 identifies a $24.78 market value per WBD share on April 11, 2022, the first regular trading day after the combination. Using that anchor and the final $31.01666668 cash payment gives 25.17% nominal pretax appreciation, approximately 5.13% annualized over 1,639 days. The calculation tracks the WBD holding from distribution through closing.S01, S33
WBD’s issuer performance table, normalized to 100 on April 11, shows 38.26 at year-end 2022, 45.92 in 2023, 42.66 in 2024 and 116.30 in 2025. The cash exit is 125.17 on the same scale. These observations show a prolonged drawdown. The maximum daily drawdown is unknown.S11
For a properly aligned comparison available in the issuer table, the S&P 500 returned approximately 63.97% from April 11, 2022 through year-end 2025, against WBD’s 16.30%. A verified October 2026 benchmark total-return series was not obtained here, so the report does not extrapolate that comparison to closing.
The auction rescued value relative to the depressed intervening prices. It did not turn the entire 2022–2026 holding period into an exceptional compounded return.
10. Regulators changed the timing and the operating freedom
The deal closed 221 days after signing. DOJ’s June decision was not the end of the process.
| Date in 2026 | Action | Economic or timing consequence |
|---|---|---|
| June 12 | DOJ closed its investigation after an eight-month review | Removed the federal antitrust investigation barrier; closing still 116 days away. |
| July 13–24 | States sued; no-close agreement followed | Agreement restricted closing until June 1, 2027 or the specified period after decision, absent further relief. |
| July 22 | European Commission conditional clearance | UIP divestiture and distribution restrictions; 76 days before closing. |
| August 6 | CMA clearance and DCMS assurances | UK competition clearance and enforceable public-interest commitments; 61 days before closing. |
| September 17 | FCC foreign-ownership declaratory ruling | Approved foreign-equity arrangements subject to conditions; 19 days before closing. |
| September 30 | Court entered states’ decree and dissolved no-close order | Final settlement enabled closing six days later. |
| October 5–6 | Supreme Court denied consumer injunction application; deal closed | Closing occurred with ongoing compliance duties. |
The first review began before the February definitive agreement, so eight months of DOJ review and 221 days from signing measure different intervals. The court order entering the decree matters because the attached decree’s cover still contains “proposed.” September 30's operative order expressly granted entry and dissolved the no-close order.S18, S19, S20, S21, S22, S23, S24
The EU remedy requires exit from UIP’s EEA operations within 13 months after closing and restricts certain co-distribution arrangements involving Universal or other distributors for ten years. The FCC action addressed foreign ownership. Conditions protect against specified foreign influence and access to nonpublic U.S.-person data. UK commitments address matters including news independence, children’s programming and archives.S19, S20, S21, S22
The states’ decree imposes tangible obligations for 2027–2031: 30 theatrical films annually in 2027–2028, rising to 32 in 2029–2031; 45-day theatrical exclusivity and a 90-day subscription-streaming holdback; $300 million additional annual U.S. production spending against the combined 2025 baseline; $9.5 million annual workforce/community investment; and $5 million annually for an independent-film fund. It also addresses independent basic-cable carriage negotiations, studio properties and news governance. Output failures can trigger payments and, if uncured, divestiture obligations.S23
The model deducts $314.5 million annually for five years for those quantified commitments. This is conservative: relocating existing production to the United States could satisfy part of the production requirement without increasing consolidated spending dollar-for-dollar. Conversely, the model cannot quantify lost bargaining flexibility or every contingent enforcement cost. States’ legal/economic fees can reach $40 million. A WGA settlement provides $17.5 million to the health fund and up to $6 million legal costs, plus a specified CBS News Broadcast represented-employee floor—not a companywide employment guarantee.S23, S24
The company said the settlements should not materially impair its synergy and leverage targets. Its subsequent risk disclosure also acknowledged that remedies could limit savings. Both statements belong in the analysis. The deal closed with compliance obligations, ongoing litigation risk and economic costs from the concessions.S13, S24
11. Sensitivities, falsifiers and the next evidence
The workbook includes a live two-variable sensitivity. Around the base case, shifting all three WACCs and terminal-growth rates by one percentage point produces this standalone common value:
| WACC shift / terminal-growth shift | −1 percentage point | Unchanged | +1 percentage point |
|---|---|---|---|
| −1 percentage point | $13.68 | $16.43 | $20.16 |
| Unchanged | $10.81 | $12.85 | $15.50 |
| +1 percentage point | $8.52 | $10.09 | $12.06 |
The case for the acquisition would strengthen if combined disclosures show durable cash conversion near the high case, subscriber growth with stable geographic ARPU, content investment consistent with the modeled margins, and debt reduction that survives the receivables exit and employee settlements. Evidence of $6 billion annual savings with little reinvestment leakage would support the full-persistence valuation. A credible recurring revenue benefit could close part of the remaining gap.
The case would weaken if cable revenue falls faster than 9% annually without offsetting cost flexibility, streaming growth requires materially lower ARPU, Studios profits miss the proxy trajectory, or refinancing resets the debt burden upward. Management’s November warning that fourth-quarter Warner Bros. film profit could be up to $200 million below its previous forecast is a reason to monitor slate volatility; it is not evidence that every subsequent forecast year must fall by that amount.S14
Three independent checks support the central findings:
- Completion and payout: target closing filing, buyer closing filing and Nasdaq action agree; base price plus six daily ticking increments reproduces the payment.
- Dilution and financing: closing share issuance reconciles to subscription proceeds; the latest 10-Q independently reports the capital structure and transaction accounting. The model keeps undrawn commitments out of issued debt.
- Valuation and leverage: an independent recalculation matches 78 key workbook outputs and all nine sensitivity points; a DCF of management’s disclosed cash forecasts independently places combined standalone value near $63 billion.
The remaining material gaps are precise: final purchase-price allocation and tax shields; a complete closing funds-flow statement; the paid/unpaid split and timing of pre-combination employee awards; combined post-acquisition operating results; current streaming subscriber/ARPU detail; segment cash-content and capex schedules; final funding amounts by investor; and the private counterfactual benefits each losing bidder expected. The model marks these as estimates or unknowns.
Editorial conclusion: WBD holders received a verified cash exit above the report’s base standalone value. The buyer paid for an operating transformation whose value depends on both growth and the persistence of savings. The next decisive evidence is combined cash generation and debt retirement per share—not another statement of gross synergy ambition.
Sources
Dollar amounts are in U.S. dollars. Financial tables use billions unless stated otherwise. Historical figures and transaction terms are reported facts. Forecasts, allocation rules, valuation ranges and investment judgments are explicitly analyst estimates. The valuations apply to the transaction itself.
All sources below were accessed November 12, 2026. Page references are printed document pages where available; otherwise the named SEC item, note or regulator paragraph is the locator. The accompanying source_manifest.csv and raw ledgers preserve per-observation periods, source URLs and status. Model outputs are estimates dated November 12, 2026; forecasts cover 2027–2031 unless stated otherwise.
Companion files
wbd_auction_model.xlsx contains sheets for inputs, assumptions, calculations, outputs and audit, with case and allocation controls, live formulas and a native two-variable sensitivity table. The accompanying CSV collection contains the source and scenario tables. The four PNG charts label modeled estimates and identify their source tables.
- WBD closing 8-K, Items 2.01/3.01. Oct. 6, 2026 ↩
- Buyer closing 8-K, Items 2.01/3.02, p9. Oct. 6, 2026 ↩
- Nasdaq ECA2026-710, consideration/last-trade table. Oct. 2026 ↩
- Final WBD merger proxy, pp39–62, 80–81, 128–129. Auction; 2026–2030 forecasts ↩
- WBD Schedule 14D-9, Item 4, pp20–63. Sep.–Dec. 2025 ↩
- Paramount tender offer, funding/background/Annex A. Dec. 8, 2025 ↩
- Tender amendment 7, Items 1–9/11. Dec. 22, 2025 ↩
- Tender amendment 19, amended terms/Annex C. Feb. 10, 2026 ↩
- Netflix-transaction WBD proxy, merger consideration/separation/Annex A §6.30(j). Feb. 17, 2026; projected DG debt ↩
- Netflix definitive announcement, transaction terms/collar. Dec. 5, 2025 ↩
- WBD 2025 10-K, p38; pp43–45; cash flow p68; Notes 20/23 pp113, 122–124. FY2023–2025; subscriber metrics ↩
- WBD 2025 earnings release and shareholder letter, financial tables/outlook. FY2025; 2026 targets ↩
- Skydance Q3 2026 10-Q, cover; Notes 2/6/8/11; MD&A p95; risks p108. Sep. 30 period; Oct. closing subsequent event ↩
- Skydance November 9 letter, pp9–10, 12–13. 2026 outlook; synergy/debt targets ↩
- WBD Q2 2026 10-Q, balance sheet p6; Note 8 p18/liquidity p47; Q2 earnings release, p11 footnote 7 for finance leases. Six months/June 30, 2026 ↩
- Closing pro forma financials, Notes 4/8(d) and statement adjustments. Illustrative June 30/H1 2026 ↩
- Closing credit agreement, §5.14 and EBITDA definitions. Oct. 6, 2026 ↩
- DOJ closing statement, release 26-652. June 12, 2026 ↩
- European Commission IP/26/1663, pp1–2. July 22, 2026 ↩
- CMA case record, timetable/clearance. August 6, 2026 ↩
- DCMS public-interest statement, assurances/duration. August 2026 ↩
- FCC DA 26-1001, ¶¶1–7, 29–32. September 17, 2026 ↩
- Entered states’ decree, Dkt267, pp3, 5–13, and entry order Dkt266, p4. Sept. 30, 2026; obligations 2027–2031 ↩
- States/WGA settlement 8-K, Item 1.01; Supreme Court docket 26A455; California no-close statement. July–October 2026 ↩
- AT&T/Discovery announcement, financial projections. May 17, 2021; 2023 targets ↩
- WBD 2022 earnings release, full-year pro forma tables. FY2022 ↩
- WBD 2025 proxy, p64, CFO accomplishments. FY2024 ↩
- Disney amended Fox agreement announcement, transaction terms/benefits. June 20, 2018 ↩
- Disney 2019 10-K, Notes 4/9. March 2019 acquisition; FY2019 ↩
- Disney Q4 2020 transcript, p18. November 12, 2020 ↩
- Disney 2025 10-K, Note 18, p120. FY2023–2025 impairments ↩
- Netflix Q3 2026 10-Q, cash flows; Notes 7/9; interest MD&A. Nine months ended Sept. 30, 2026 ↩
- Pascal Desroches Form 4, footnote F2. April 11, 2022 market value ↩
- Definitive Paramount agreement 8-K, Item 1.01 and financing agreements. February 27, 2026 ↩
Supporting material
- Excel model ↗Sourced inputs, live calculations and reported outputs.
- Source and model data (CSV collection) ↗Data tables, source references and calculation exports.
- Source manifest ↗Download as CSV.