Financial systems
What Tesla’s share price requires
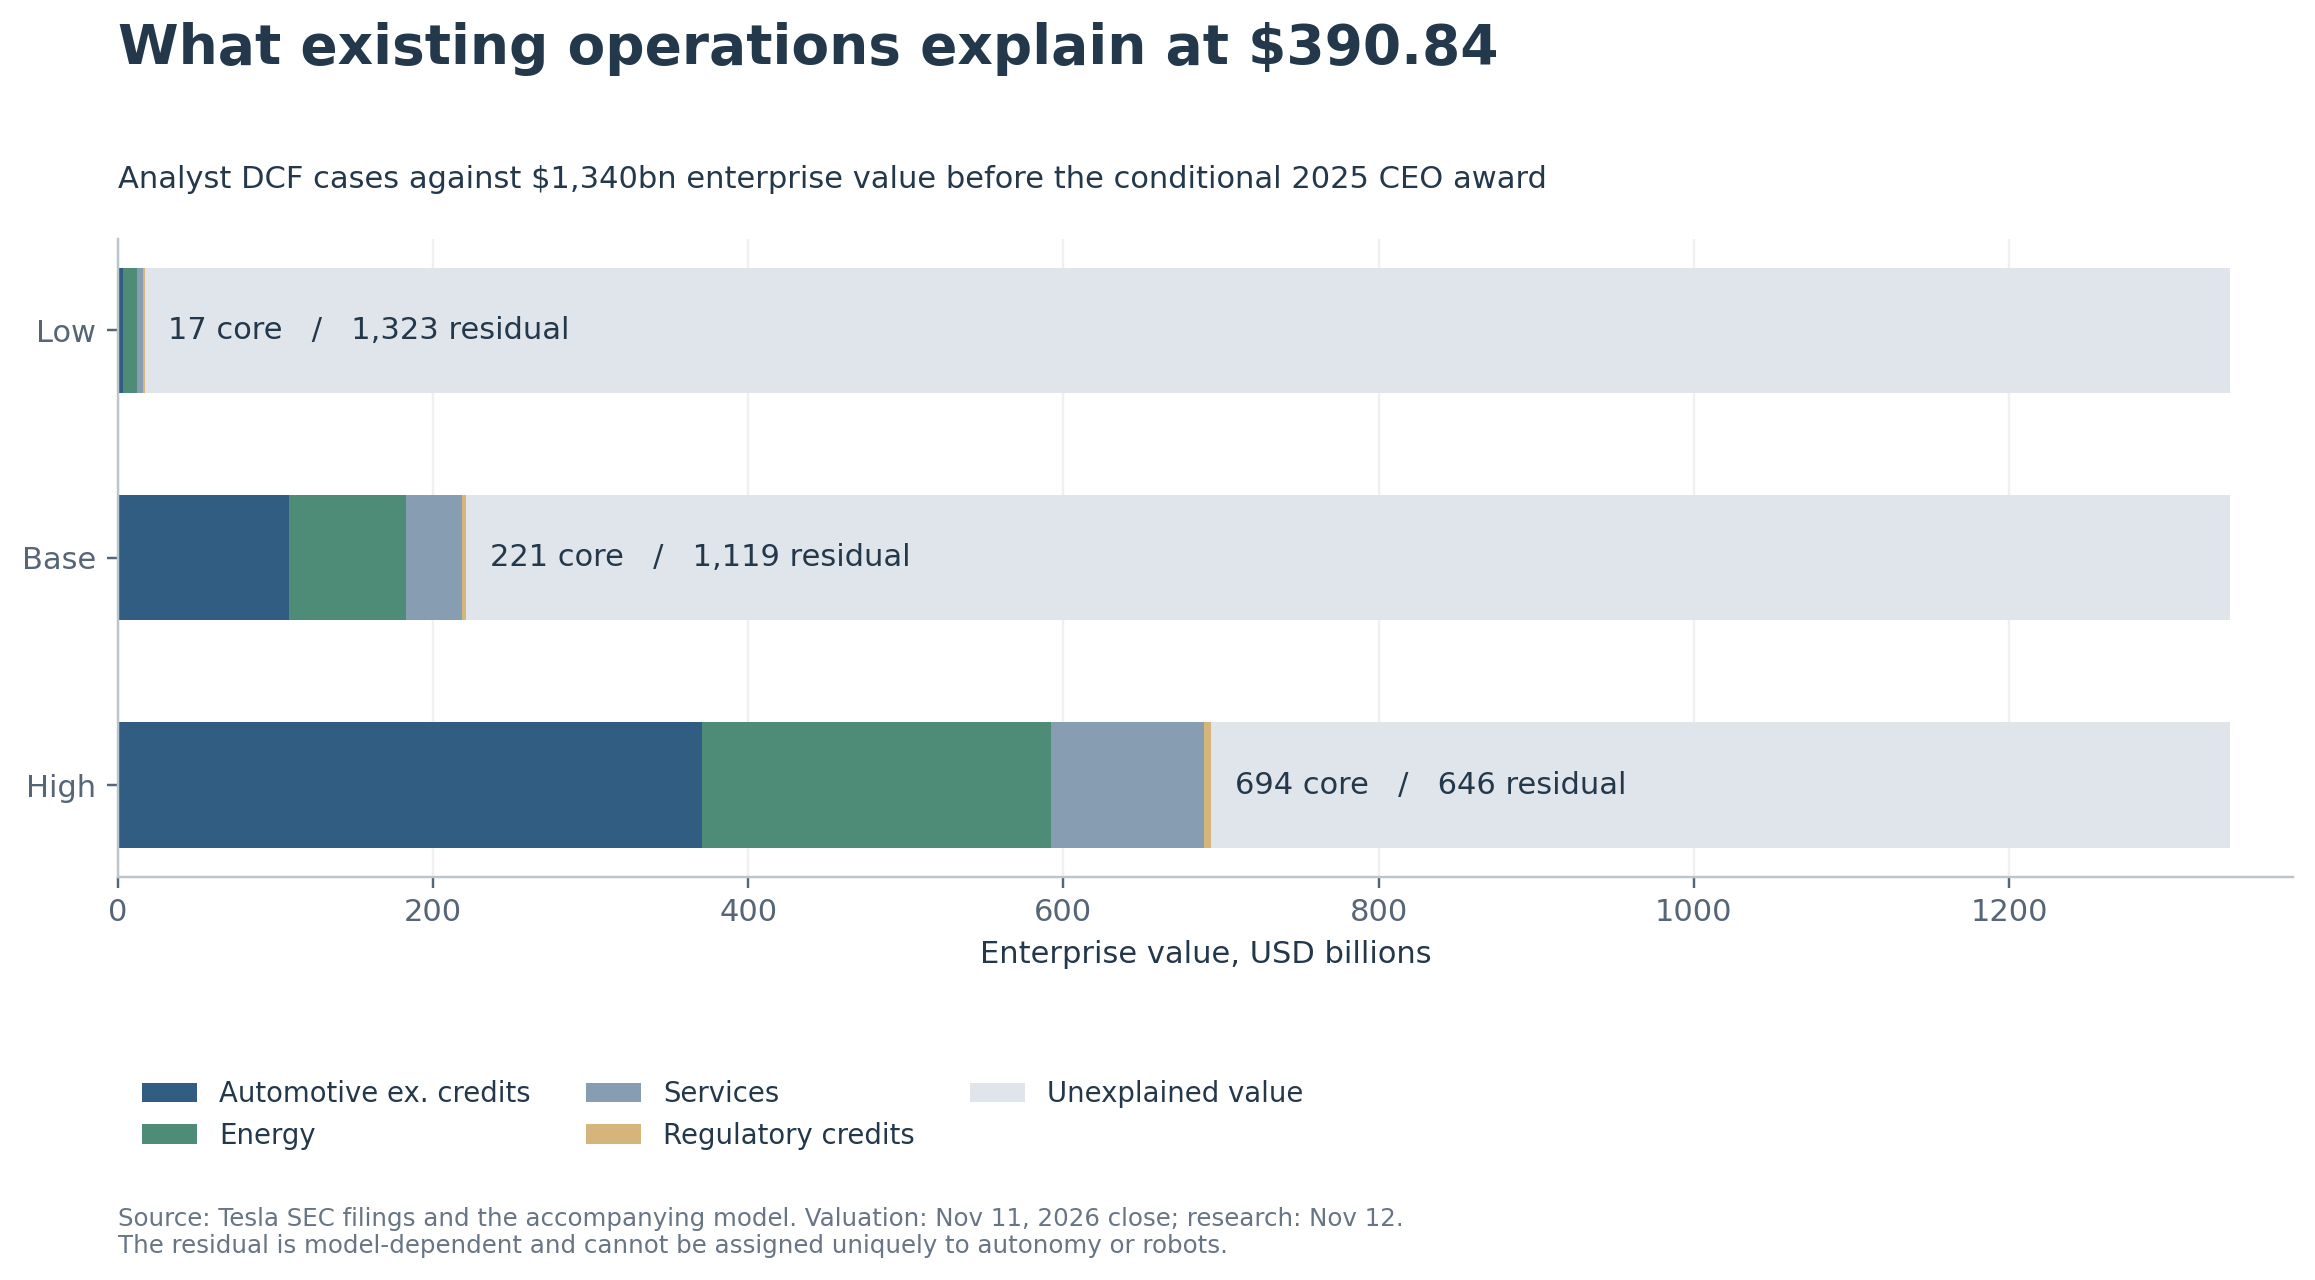
Tesla’s existing operations explain $221 billion of a $1.34 trillion enterprise value in the base case.
At $390.84 a share, how much of Tesla’s value can its existing businesses explain? My base-case discounted cash-flow model values automotive operations, energy, services and regulatory credits at $221 billion of enterprise value. That leaves $1.119 trillion, or 83.5%, unexplained using a deliberately favorable share-count case in which none of the conditional 2025 CEO award is ultimately earned. Using every legally outstanding share before the award’s offset and forfeiture provisions, the unexplained amount is $1.285 trillion, or 85.3%.price, q26, proxy26
The figures come from the model. Investors’ reasons for paying the current price remain unobserved. The residual could reflect autonomy, humanoid robots, licensing, other growth, transaction expectations, a lower required return, or an error in the operating valuation. Tesla has also disclosed a special committee exploring a deeper relationship with SpaceX, potentially including a business combination. No transaction terms are assumed here.q26
The operating hurdle is substantial. At a 12% discount rate, the base residual would require approximately 812 billion paid robotaxi miles annually by 2035 under the favorable platform economics specified below. An alternative subscription-only route requires approximately 345 million additional average paying accounts at $99 per month. An explicit owned-fleet calculation raises the miles requirement to approximately 893 billion because the vehicles must be funded. These are alternative ways to explain the same value. Adding their outcomes would count that value twice.
The answer changes with the assumptions. Existing-business enterprise value ranges from $17 billion to $694 billion across the low and high cases. At half today’s share price, the aggressive high case can explain the economic valuation without incremental autonomy or robot profits. At the current price, even that case leaves approximately $646 billion unexplained before the conditional award.
One premise must be corrected at the outset: self-driving is already in Tesla’s accounts. Supervised FSD contributes to automotive revenue. Robotaxi service is operating, and Tesla reports that Optimus production has begun. What the records do not provide is a clean, dedicated revenue, margin and cash-flow history for robotaxi, third-party self-driving licensing or external humanoid sales. The valuation distinguishes the economics we can reconstruct today from new profit streams the filings do not quantify.q26, d26
1. Fix the valuation date and the share count first
“Today’s price” means $390.84, Nasdaq’s November 11, 2026 regular-session close. The research began before the November 12 trading session. The historical-price API response is preserved with the data; an independent second retrieval returned the same close.price
The latest financial statements available were the September 30, 2026 10-Q, filed October 22. Its cover reports 3,952,757,946 shares outstanding on October 15. The balance sheet, share count and price therefore have different observation dates. This report does not invent a cash or share bridge for the intervening weeks.q26
The share count includes 423,743,904 restricted shares issued under the performance award approved in November 2025. They are conditional and carry a $334.09-per-share economic offset upon vesting. Adding those shares again would overstate dilution. Treating their gross legal issuance as an unconditional economic interest would also conceal the award’s conditions.proxy25, proxy26
The two reference calculations are:
| Reference, USD billions unless stated | No 2025 award earned | All legal shares, before offset |
|---|---|---|
| Shares used (billions) | 3.529014042 | 3.952757946 |
| Equity capitalization | 1,379.280 | 1,544.896 |
| Less net financial assets | 39.151 | 39.151 |
| Enterprise value | 1,340.129 | 1,505.745 |
| Less base existing-business value | 221.152 | 221.152 |
| Unexplained value | 1,118.977 | 1,284.593 |
| Unexplained share of reference EV | 83.5% | 85.3% |
The $39.151 billion net-financial-asset adjustment comprises $45.447 billion of cash and short-term investments, $0.962 billion of digital assets and a $2.865 billion SpaceX investment, less $9.523 billion of debt and finance leases and $0.600 billion of noncontrolling interests. The investment values come from the latest filing, before the stock-price date.q26
Operating-lease liabilities of $6.922 billion are not added to debt here because operating lease costs remain in operating expenses. Adding the liability without adjusting the cash flows would mix valuation conventions. Restricted cash is not treated as freely distributable excess cash. The SpaceX stake has a value outside Tesla’s operating businesses; a potential combination with SpaceX is not the same asset as the existing minority investment.
The award-excluded reference sets an optimistic dilution floor. Vesting depends on the award conditions. Successful autonomy at the scale required later in this report could help satisfy award milestones. The zero-, six- and twelve-tranche cases below show the conditional burden explicitly. None is a probability-weighted award valuation.
2. What five years of filings show
The supporting data reconstruct FY2021–FY2025 and all 23 quarters from 2021Q1 through 2026Q3. Annual and quarterly revenues, costs, capital spending and stock compensation tie to filing facts. Operational volumes come from Tesla’s own updates. Each input carries its document, period, units, URL, access date and an XBRL fact/tag/context or table locator.k23, k25, d25, d23
The trailing twelve months, or TTM, means October 2025 through September 2026. It is calculated as FY2025 plus the first nine months of 2026 minus the first nine months of 2025. Ratios are recalculated from the resulting amounts; quarterly or annual percentages are never added.
Cars: revenue per delivery and margin are different questions
| Period | Deliveries | Auto revenue/delivery, ex credits | GM incl. credits | GM ex credits | Credit revenue, $bn |
|---|---|---|---|---|---|
| 2021 | 936,222 | $48,885 | 29.3% | 27.0% | 1.465 |
| 2022 | 1,313,851 | $53,039 | 28.5% | 26.7% | 1.776 |
| 2023 | 1,808,581 | $44,581 | 19.4% | 17.7% | 1.790 |
| 2024 | 1,789,226 | $41,530 | 18.4% | 15.4% | 2.763 |
| 2025 | 1,636,129 | $41,276 | 17.8% | 15.4% | 1.993 |
| TTM Sep 2026 | 1,742,908 | $42,356 | 19.1% | 17.8% | 1.181 |
Money in the final column is USD billions. Revenue per delivery excludes regulatory-credit revenue but includes automotive leasing and embedded software revenue. It is not a reported new-car transaction price.
The calculation is:
Automotive revenue per delivery =(automotive revenue-regulatory credits) / (vehicles delivered).
It consistently measures revenue generated alongside vehicle volume. It is imperfect as an average selling price because revenue from older lease cohorts and software recognition does not map one-for-one to this period’s delivered vehicles. Product mix, geography, currency, price changes, financing incentives and revenue-recognition timing can all move it.
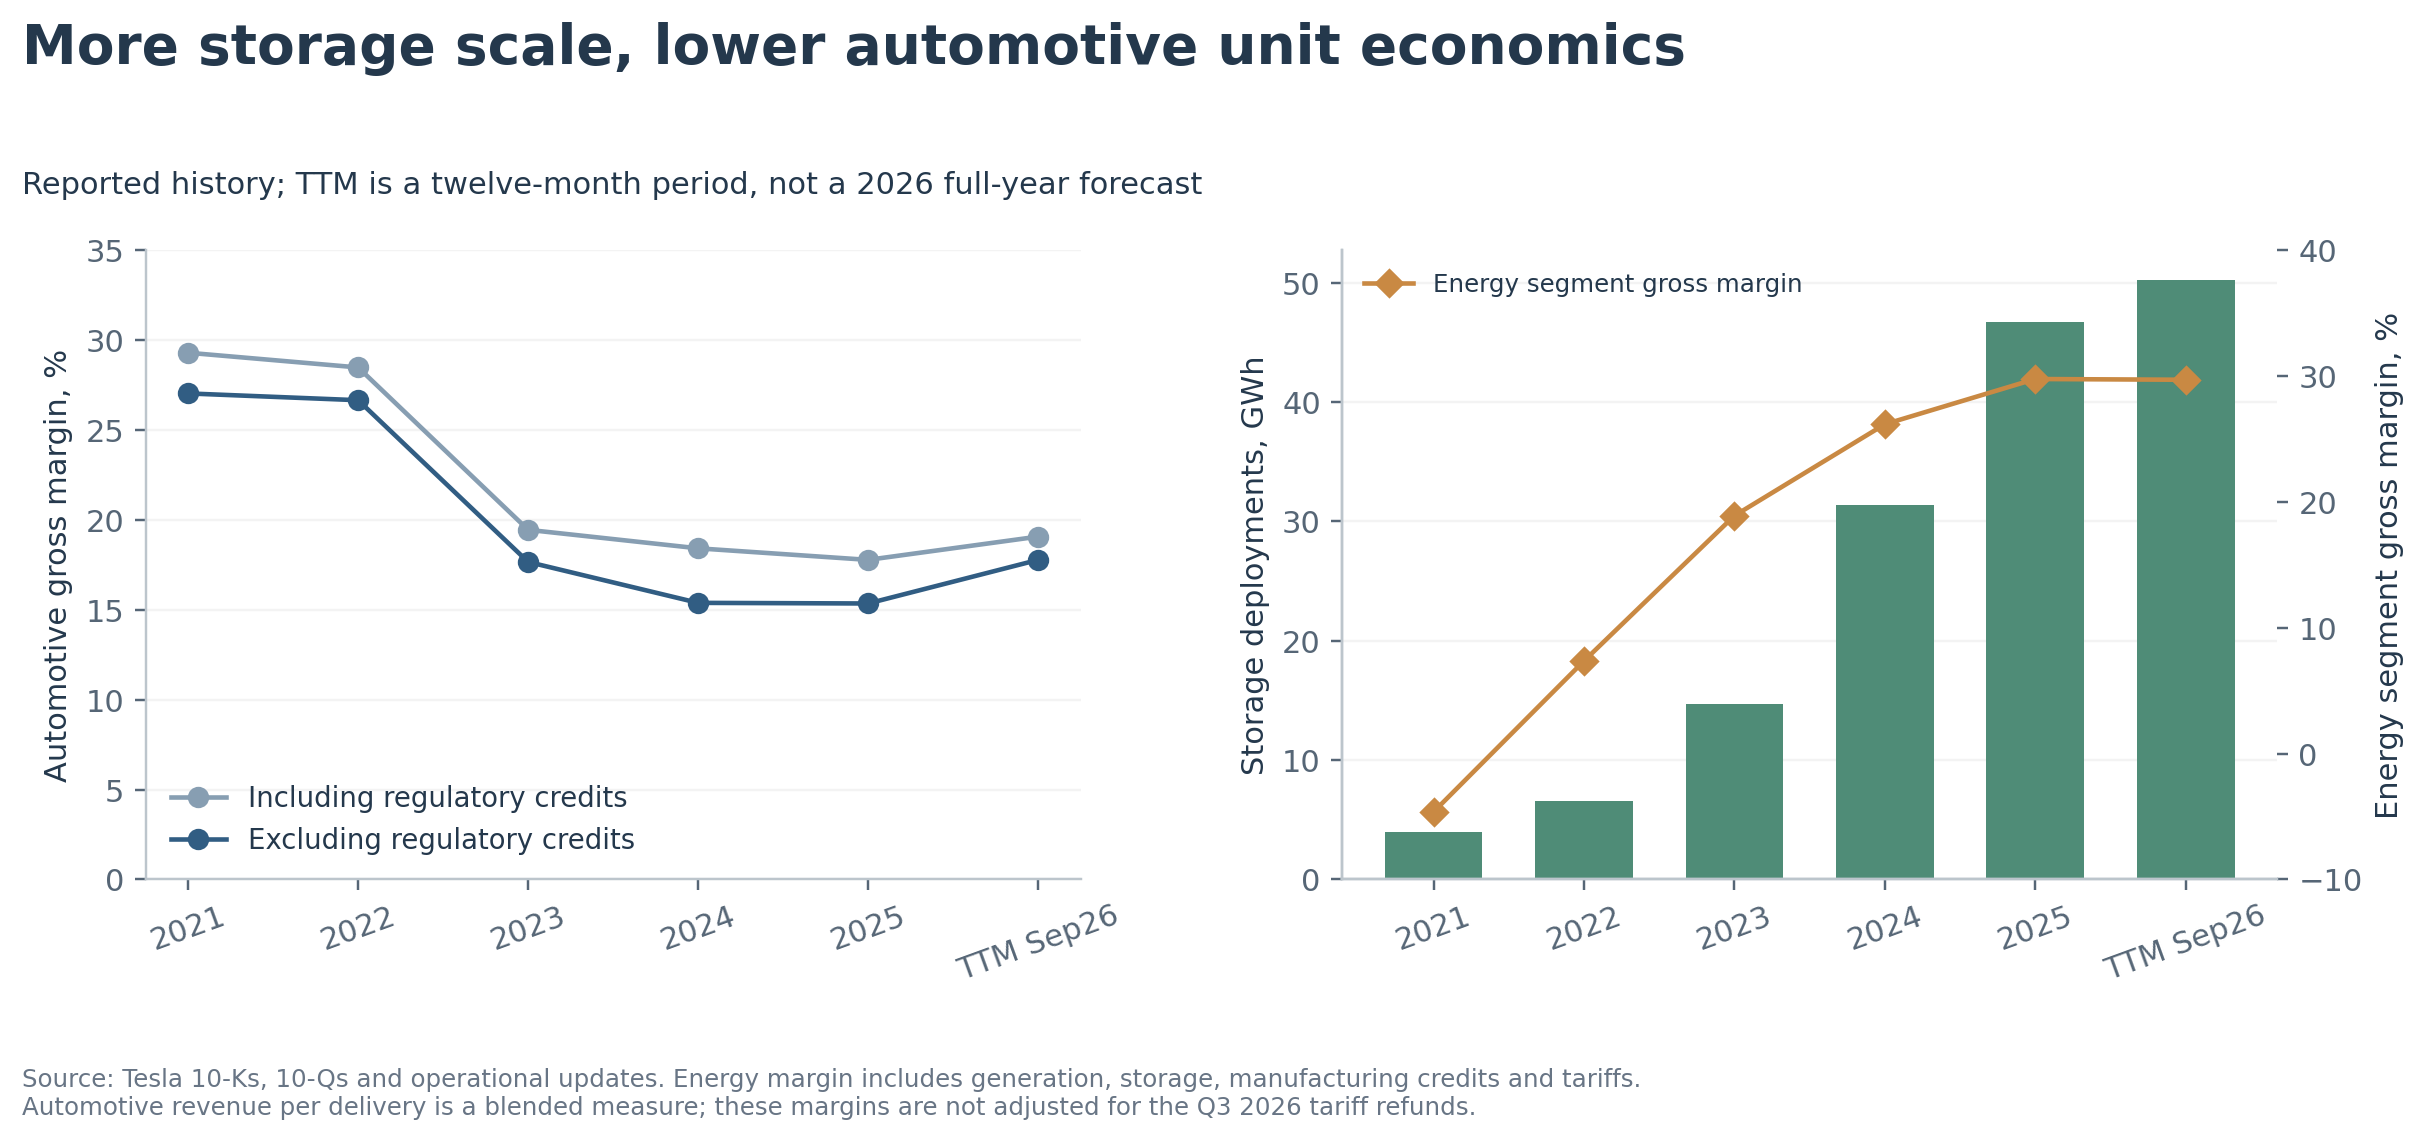
The broad history is nevertheless clear. Revenue per delivery fell from approximately $53,039 in 2022 to $42,356 in the latest TTM. Automotive gross margin excluding regulatory credits fell from 26.7% to 17.8% over the same comparison. Volume growth alone does not restore the earlier economics.
Regulatory credits are kept outside the car business in every historical and forecast period. The ex-credit gross-margin formula removes credit revenue from both gross profit and revenue:
GM_(auto, excredits) =(AutoRevenue-Credits-AutoCOGS) / (AutoRevenue-Credits).
Tesla says these credits have negligible incremental costs. The model therefore treats credit revenue as gross profit before charging tax on it; any unreported incremental cost is not independently estimated.k25 Simply subtracting credit revenue from gross profit while leaving it in the denominator produces a margin on a different revenue base.
Energy: a stronger business, with an important measurement limit
| Period | Storage MWh | Energy revenue, $bn | Energy GM | Blended $/kWh | Services revenue, $bn | Services GM |
|---|---|---|---|---|---|---|
| 2021 | 3,992 | 2.789 | -4.6% | $698.6 | 3.802 | -2.7% |
| 2022 | 6,541 | 3.909 | 7.4% | $597.6 | 6.091 | 3.5% |
| 2023 | 14,724 | 6.035 | 18.9% | $409.9 | 8.319 | 5.9% |
| 2024 | 31,400 | 10.086 | 26.2% | $321.2 | 10.534 | 5.8% |
| 2025 | 46,700 | 12.771 | 29.8% | $273.5 | 12.530 | 7.4% |
| TTM Sep 2026 | 50,200 | 12.265 | 29.7% | $244.3 | 16.302 | 12.4% |
Storage deployments are MWh. Money is USD billions. Later deployment disclosures are rounded to 0.1 GWh; converting them to MWh does not create additional precision.
The energy business expanded sharply: storage deployments rose from 3,992 MWh in 2021 to approximately 46,700 MWh in 2025. The energy segment’s reported gross margin improved from a loss to 29.8%. Services and other also became a meaningful gross-profit contributor.d23, d25, k25
But Tesla does not disclose a storage-only revenue and cost statement. Energy includes generation, storage, leasing and related activities. Dividing total energy revenue by storage deployments yields a blended segment revenue-per-kWh proxy. It averages across the energy segment and leaves the Megapack and Powerwall selling prices unknown. Energy leasing alone contributed approximately $495 million in the latest TTM; the energy sales line still does not isolate storage from generation.k25, q26
The energy DCF therefore models the whole existing energy segment using deployments and this explicitly labeled revenue-yield proxy. It does not add a second solar valuation on top. A more precise storage-only DCF would require a revenue split, product mix, installation timing and storage-only costs that Tesla has not supplied.
The latest margin improvement has an ordinary accounting explanation
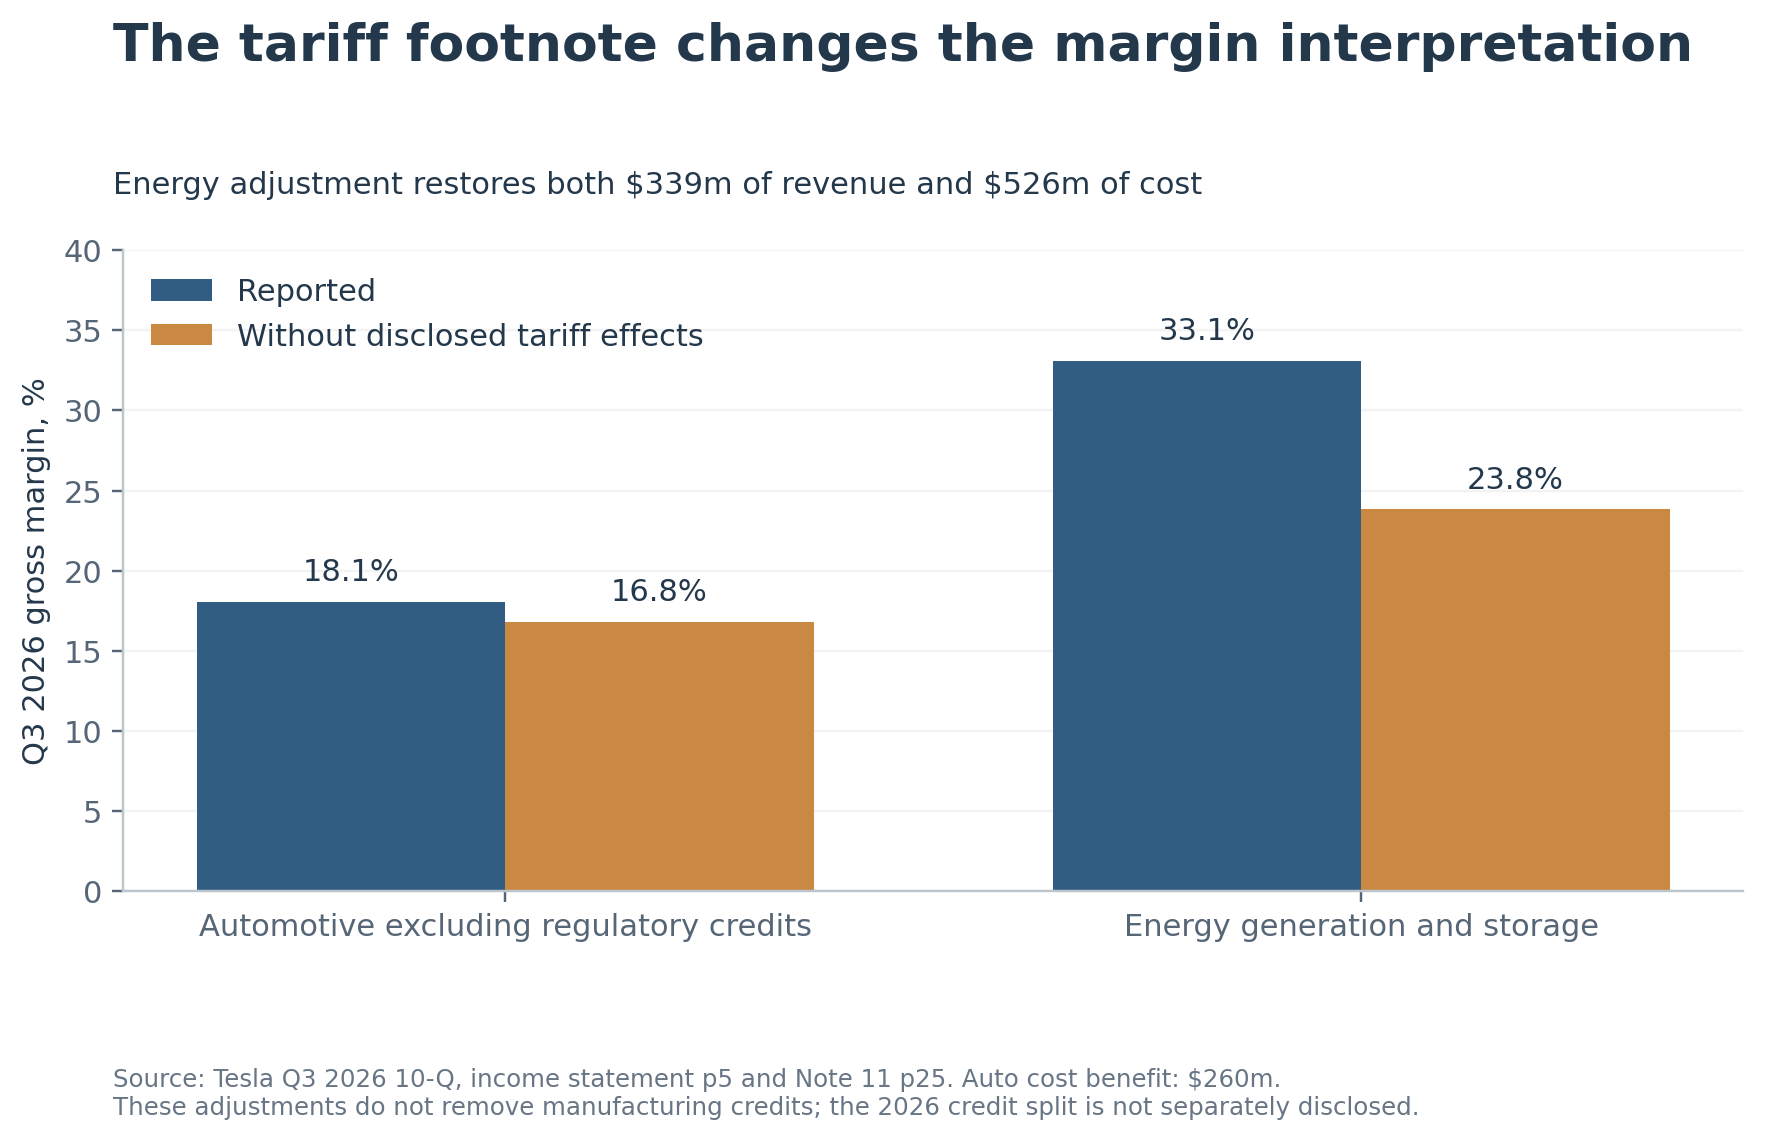
The most consequential normalization in this exercise is in Note 11 of the Q3 2026 10-Q. Tesla recognized $260 million of tariff refunds as a reduction of automotive sales cost and $526 million as a reduction of energy cost. It also reduced energy revenue by $339 million for refunds contractually owed to customers.tariffs
The energy effect is a net $187 million gross-profit benefit, but correcting the margin requires restoring both sides of the income statement:
((2,881+339)-(1,927+526)) / (2,881+339) =23.82%.
That compares with 33.11% reported energy gross margin in Q3. Automotive Q3 margin excluding regulatory credits falls from 18.06% to 16.79% after removing its tariff benefit. The chart shows both views.
This adjustment does not tell us that the operating businesses failed to improve. It identifies how much of one quarter’s result came from the disclosed refund, which won’t recur as part of ordinary production. Tesla also identifies ordinary influences such as product mix, currency, FSD subscription growth, used-car activity, repairs and paid charging in its discussion of results.q26
Manufacturing credits lower costs. The automotive calculation removes regulatory-credit revenue. In FY2025, disclosed manufacturing credits were $565 million for automotive and approximately $1.12 billion for energy. Removing the energy amount would reduce FY2025 energy gross margin from 29.8% to approximately 21.0%. The 2026 split was not quantified in the reviewed filing, so the split remains unknown.manufacturing
Cash generation and stock compensation
| Period | Operating cash flow | Cash capex | CFO less capex | SBC |
|---|---|---|---|---|
| 2021 | 11.497 | 6.514 | 4.983 | 2.121 |
| 2022 | 14.724 | 7.163 | 7.561 | 1.560 |
| 2023 | 13.256 | 8.899 | 4.357 | 1.812 |
| 2024 | 14.923 | 11.342 | 3.581 | 1.999 |
| 2025 | 14.747 | 8.527 | 6.220 | 2.825 |
| TTM Sep 2026 | 18.710 | 15.407 | 3.303 | 4.300 |
USD billions. Cash capex includes purchases of energy generation/storage systems, consistent with Tesla’s revised presentation. CFO means cash flow from operations.
TTM operating cash flow was $18.710 billion, capex $15.407 billion, and the difference $3.303 billion. Stock compensation was $4.300 billion, including $0.964 billion for the 2025 CEO performance award. The cash-flow statement adds back noncash compensation. An investor assessing the economic cost of paying employees in shares should not read the resulting cash total as costless to owners.q26, d26cash
For illustration, CFO less capex less total SBC is negative $0.997 billion, before any alternative tax treatment. That is not a replacement GAAP cash-flow measure. It demonstrates why a valuation must handle compensation consistently. This DCF keeps ordinary employee SBC as an expense and does not add it back. The special CEO award is handled through its share economics instead.
Tesla’s latest outlook calls for more than $20 billion of 2026 capital spending. The TTM figure is not that forecast. The remaining-2026 DCF stub uses the $20 billion floor, subtracts $13.014 billion already spent through September, and assumes the remaining quarter’s spending occurs evenly. Higher spending would lower value further.capex
3. Value the existing operations without assuming a new autonomy profit pool
The DCF is a sum of four businesses: automotive excluding regulatory credits, energy, services and a finite regulatory-credit stream. Existing supervised FSD remains embedded in automotive revenue and margins. The model does not assign that same profit to the autonomy residual a second time.
For each operating business:
FCFF=EBIT-CashTaxes+D A-Capex-Δ WorkingCapital.
FCFF is unlevered free cash flow available to all capital providers. EBIT is operating profit before financing and taxes. D&A is depreciation and amortization. The historical starting proxy is Tesla’s combined depreciation, amortization and impairment cash-flow line; forecast D&A ratios are analyst assumptions. The tax assumption is 21% of positive operating profit; the model gives no immediate cash tax benefit to losses.
The decisive allocation assumption
Tesla reports automotive and energy segment gross profit. It leaves operating profit and cash flow unallocated across cars, energy and services. Services is included within the automotive reportable segment even though its revenue and cost lines support a standalone analysis. Any standalone valuation must make an allocation assumption.q26segments
The latest TTM contains $8.861 billion of R&D and $7.485 billion of SG&A. Removing $0.964 billion of special CEO-award expense leaves $15.382 billion. I allocate 75% to automotive, 15% to energy and 10% to services. The historical capital-spending and D&A starting points are allocated 80%, 15% and 5%. The model supplies these assumptions.
This treatment leaves all current shared development spending in the existing-business valuation, including spending that may support future autonomy or robots. It is a conservative allocation to the core. To avoid counting that spending twice, the reverse-DCF margins later in the report are defined after incremental costs beyond those already included here. The startup allowances are also incremental. A clean project-level split would improve the analysis, but it cannot be reconstructed from the published statements.
After regulatory credits, tariff effects, restructuring and the CEO award modeled outside operating expenses are treated consistently, normalized TTM operating income for the three operating businesses is $2.964 billion. Under the allocation above, automotive contributes $1.327 billion. This allocation estimates car operating profit from the available totals.
Operating assumptions that produce the valuation
The base case reaches the following endpoints. Volumes interpolate geometrically between the current starting point, 2030 and 2035; prices and margins interpolate linearly. All endpoint inputs are editable.
| Driver | Normalized TTM start | 2030 assumption | 2035 assumption |
|---|---|---|---|
| Annual vehicle deliveries, million | 1.74 | 2.50 | 4.00 |
| Automotive revenue per delivery, USD | $42,356 | $40,500 | $38,000 |
| Automotive gross margin, ex credits | 17.4% | 20.0% | 22.0% |
| Automotive allocated opex / revenue | 15.6% | 10.0% | 8.0% |
| Storage deployments, GWh | 50.2 | 150.0 | 350.0 |
| Blended energy revenue per kWh, USD | $251.1 | $190.0 | $150.0 |
| Energy gross margin | 27.4% | 30.0% | 30.0% |
| Energy allocated opex / revenue | 18.3% | 8.0% | 6.0% |
| Services revenue, USD bn | 16.3 | 27.0 | 45.0 |
| Services gross margin | 12.4% | 18.0% | 20.0% |
| Services allocated opex / revenue | 9.4% | 8.0% | 7.0% |
| Regulatory-credit revenue, USD bn | 1.181 | 0.500 | 0.100 |
Automotive revenue is deliveries multiplied by blended revenue per vehicle. Energy revenue is deployed MWh multiplied by the blended dollars-per-kWh input, divided by 1,000 to produce USD millions. Services has an independent revenue forecast. Regulatory credits follow their own path, declining to $500 million in 2030 and $100 million in 2035 in the base case, with no terminal value.
Working-capital investment is 5% of the change in automotive revenue, 10% for energy and 3% for services. By 2035, base capex/D&A ratios are 5%/4% for automotive, 5%/3% for energy and 3%/2.5% for services. These assumptions allow expansion without pretending that gross margin is distributable cash.
The base operating discount rate is 10%. Terminal growth is 2% for automotive, 3% for energy and 2.5% for services. Cash flows are discounted from their calendar year-end using calendar days divided by 365.25. A 50-day 2026 stub precedes the nine full forecast years. Terminal working-capital needs are recalculated at terminal growth so the final high-growth year’s investment does not carry forward unchanged.
| Scenario driver, 2030 / 2035 | Low | Base | High |
|---|---|---|---|
| Auto deliveries, million | 1.6 / 1.6 | 2.5 / 4.0 | 4.0 / 7.0 |
| Auto gross margin | 16.0% / 16.0% | 20.0% / 22.0% | 24.0% / 25.0% |
| Storage deployments, GWh | 80 / 130 | 150 / 350 | 225 / 650 |
| Energy gross margin | 22.0% / 22.0% | 30.0% / 30.0% | 34.0% / 34.0% |
| Services revenue, USD bn | 20 / 24 | 27 / 45 | 35 / 70 |
| Services gross margin | 12.0% / 12.0% | 18.0% / 20.0% | 22.0% / 25.0% |
| Core discount rate | 12% | 10% | 9% |
| Enterprise value, USD bn | Low | Base | High |
|---|---|---|---|
| Automotive, ex credits | 3.5 | 108.5 | 370.8 |
| Energy | 8.9 | 74.3 | 221.5 |
| Services | 3.5 | 35.7 | 97.2 |
| Regulatory credits | 1.3 | 2.6 | 4.4 |
| Total existing businesses | 17.2 | 221.2 | 693.9 |
Approximately 72% of base existing-business value comes from the terminal value. Even the $221 billion figure is a value that requires improved future economics. A liquidation or current cash-flow basis would be different. The high case assumes seven million annual vehicle deliveries and 650 GWh of annual storage deployments in 2035, favorable margins and a 9% discount rate. Those assumptions explain why its value is much higher.
What the trading comparables can and cannot show
The peer exercise uses primary market prices and company filings, with financial subsidiaries treated independently where possible. It avoids putting an automaker’s entire financing-company debt against industrial operating profit.
| Peer | Observed calculation | Multiple | Interpretation |
|---|---|---|---|
| GM | Industrial EV / adjusted automotive EBIT | 4.18× | Finance equity removed at 1× book; USD.gm |
| Ferrari | Industrial-net-cash-adjusted group value / group EBIT | 29.42× | Proxy includes racing/lifestyle; EUR.race |
| NVIDIA | Cash/debt EV / GAAP EBIT | 21.07× | Premium-growth anchor, different industry; USD.nvda |
| Toyota | Group equity value / parent net income | 9.25× | P/E, including finance/associates; not EV/EBIT.toyota |
GM’s industrial calculation assumes its finance common equity is worth one times book. Changing that assumption to 0.5–1.5 times book gives approximately 4.79–3.56 times trailing adjusted automotive EBIT. GM’s denominator is adjusted; it is not directly comparable with Tesla’s GAAP operating result. Ferrari’s group includes racing and lifestyle economics. NVIDIA earns its margins in a different market, with a different revenue mix and fiscal calendar.gm, race, nvda
I use 4–8 times EBIT as a conventional automotive sensitivity and 20–30 times as a premium-growth sensitivity. The peer figures inform these selected ranges.
Applied to the allocated TTM automotive EBIT, they produce only $5–11 billion and $27–40 billion, respectively. Applied instead to the base case’s much stronger 2030 automotive EBIT, then discounted back with intervening cash flows included, the ranges become approximately $28–55 billion and $137–205 billion. The automotive DCF of $109 billion already anticipates a large improvement from current profit. A premium label alone does not supply the earnings needed to justify a premium valuation.
4. Translate the remainder into operating requirements
Subtracting the base existing-business value from the favorable, award-excluded EV gives:
$1,340.129bn-$221.152bn=$1,118.977bn.
There is no unique business plan implied by that number. A reverse DCF asks what a particular operating path would have to deliver. Here the new business grows to its 2035 revenue level on a stated annual ramp: 1%, 3%, 8%, 20%, 35%, 50%, 67%, 84%, and 100% during 2027–2035. It grows 3% thereafter.
The platform-equivalent robotaxi case
The model assumes Tesla keeps $1.25 per paid mile in 2030, declining to $1.00 in 2035. For a third-party fleet, this means revenue after payments to the vehicle owner. It is not the fare paid by the passenger. A $4 passenger fare and a 25% platform take would produce $1 of net revenue; both are illustrative assumptions. If the net amount is $0.50, the miles requirement doubles.
Operating margin rises from 0% in 2027 to 30% in 2030 and 35% from 2031 onward. This is margin after relevant operating expenses, including depreciation where applicable, ordinary compensation and incremental support costs. Cash tax is 21%. Net reinvestment—capex minus depreciation plus working-capital investment—is assumed to be 3% of revenue. The resulting 2035 free-cash-flow margin is:
35% × (1-21%)-3%=24.65%.
An additional $5 billion is spent in each of 2027 and 2028. At a 12% discount rate, those startup allowances have a present value of $8.320 billion. Solving for the 2035 revenue that covers the residual and those outlays gives the following path:
| Year | Tesla net revenue, $bn | Net $ / paid mile | Paid miles, bn | EBIT margin | Unlevered FCF, $bn |
|---|---|---|---|---|---|
| 2027 | 8.1 | $1.25 | 6.5 | 0% | -5.2 |
| 2028 | 24.4 | $1.25 | 19.5 | 10% | -3.8 |
| 2029 | 64.9 | $1.25 | 51.9 | 20% | 8.3 |
| 2030 | 162.3 | $1.25 | 129.9 | 30% | 33.6 |
| 2031 | 284.1 | $1.20 | 236.7 | 35% | 70.0 |
| 2032 | 405.9 | $1.15 | 352.9 | 35% | 100.0 |
| 2033 | 543.8 | $1.10 | 494.4 | 35% | 134.1 |
| 2034 | 681.8 | $1.05 | 649.4 | 35% | 168.1 |
| 2035 | 811.7 | $1.00 | 811.7 | 35% | 200.1 |
USD billions except price and margin. Paid miles count the miles that earn passenger revenue. Total vehicle miles also include unpaid travel. This is one conditional path; Tesla has not reported these economics.
At 60,000 paid miles per productive vehicle annually, the 2035 requirement corresponds to approximately 13.53 million vehicles. The model assumes this level of utilization. Empty repositioning, charging, cleaning, downtime and maintenance would consume additional vehicle capacity and money.
About 73% of the residual’s value comes from cash flow after 2035 in this platform case. The model therefore requires more than reaching the displayed scale once. It requires profitable activity to persist at the assumed margins and reinvestment rate.
Owning the fleet makes the capital requirement visible
A company-owned fleet cannot be valued by combining gross fares with capital-light software margins. The companion calculation assumes $30,000 per vehicle, 60,000 paid miles per year and a four-year useful life. Replacement capex equals economic depreciation; growth capex is the cost of additional productive vehicles. It replaces the flat 3% reinvestment assumption, with no additional working-capital charge in this favorable version.
This sensitivity holds Tesla-recognized revenue per mile and the operating-margin path fixed to isolate funding; it does not compare the two structures at an identical passenger fare.
That raises required 2035 paid miles to 893 billion, equivalent to 14.88 million productive vehicles. The model requires approximately $89 billion of growth-fleet capex in 2035, in addition to normalized replacement spending. At these assumptions, vehicle depreciation alone is $0.125 per paid mile. A 35% EBIT margin at $1 of recognized revenue per mile therefore implies a much higher pre-depreciation margin while still paying other operating costs.
This calculation also exposes a terminal-value weakness. When fleet growth falls to 3% after 2035, growth capex falls sharply, increasing annual cash flow. Approximately 85% of this owned-fleet residual value is terminal value. A slower transition to mature investment needs, more infrastructure, or lower utilization would increase the required scale. Keeping another 3% of revenue for other net investment on top of fleet expansion raises the requirement to approximately $1.033 trillion of 2035 revenue.
The self-driving subscription alternative
Tesla’s current U.S. FSD subscription price is $99 per month. The alternative model keeps that price, applies a 65% mature operating margin, 21% cash tax and 3% net reinvestment, and uses the same revenue ramp and startup allowance. It requires approximately 345 million additional annual-average paying account equivalents by 2035.fsd
“Additional” matters: the automotive valuation already contains today’s supervised-FSD economics and the ordinary growth embedded in its blended revenue assumptions. The subscription case represents new economics beyond that base. It is not a second valuation of all existing FSD customers.
Tesla’s latest operational table reports 1.74 million Active FSD Subscriptions, but its footnote includes customers who paid upfront as well as monthly subscribers and excludes free trials. The company also reports attachment above 75% of new North American deliveries. That is a new-delivery, regional attachment measure. It leaves the global share of installed vehicles on a monthly paid plan unknown. Neither disclosure supports multiplying 1.74 million by $99 to claim current recurring revenue.d26
The subscription-only route also fails a simple fleet check under the base car forecast. The model adds about 25.5 million vehicle deliveries during 2027–2035, against roughly ten million cumulative deliveries today. Even before allowing for scrappage, a Tesla-only fleet on that path is far smaller than 345 million paying accounts. Explaining the residual through subscriptions would therefore require extensive third-party licensing, much higher revenue per vehicle, or a very different production path. Disclosure of third-party licensing revenue remains unavailable.
What humanoids would have to contribute
There is no verified humanoid price, external shipment history or unit cash margin in the financial records used here. For scale only, assume a $20,000 unit selling price and 15% free-cash-flow margin after all costs, taxes and reinvestment. Using the same revenue ramp, 12% discount rate and 3% terminal growth, covering the whole residual requires approximately 65.8 million robots sold per year in 2035. Covering one-quarter of the residual, while keeping the full startup allowance, requires approximately 16.8 million annual robot sales.
These are modeled annual sales equivalents. The calculation does not take the robotaxi EBIT margin and silently apply it to robots. A leasing or service-fee model would need different pricing, replacement and capital assumptions.
5. Compare the required scale with the evidence available today
| Observation | Latest usable primary figure | What it shows—and what remains unknown |
|---|---|---|
| Tesla FSD, Q3 2026 | 1.74m active entitlements; >75% new North American attachment | Includes upfront and monthly access. Global monthly-paying take rate UNKNOWN.d26 |
| Texas Tesla Robotaxi authorization | 1,303 authorized VINs at November 12 retrieval | Authorized roster. Daily active paid-service fleet size is unavailable. City assignment and measured service area UNKNOWN.texas |
| California DMV | Tesla on drivered-testing list; absent from driverless-testing/deployment lists | No DMV-listed driverless authorization found. Drivered fleet size and commercial geofence UNKNOWN.cadmv |
| California CPUC | Tesla absent from autonomous passenger-service permit table | Safety-driver charter service is not an AV permit. Autonomous service area unknown.cpuc, d26q2 |
| Tesla Robotaxi, Q3 2026 update | Nearly 2m cumulative unsupervised miles | Company cumulative metric; annual paid passenger miles and paid utilization UNKNOWN.d26 |
| Waymo, September 15, 2026 | More than 500,000 paid trips per week | Disclosed commercial run-rate benchmark; not a measured full-year total.waymo |
The Texas count comes from the public TxDMV service, paginated through all records: 1,303 rows and 1,303 unique VINs, accessed at 00:52:37 Central Time on November 12. Tesla Robotaxi LLC’s authorization is active. The roster does not identify daily active vehicles, occupied miles, utilization or city assignments. It therefore cannot show that 1,303 vehicles are simultaneously carrying paying passengers.texas
The old claim that Texas has no applicable authorization requirement is out of date; TxDMV says the new program’s authorization requirement became enforceable in May 2026. The retrieved regulator records did not supply a measured Tesla service-area polygon or square-mile total. That input remains unknown; a press estimate would not resolve it.txprogram
California’s DMV lists Tesla for testing with a driver, but not on the current driverless-testing or deployment lists. Tesla is also absent from the CPUC autonomous passenger-service permit table. Its previously disclosed Bay Area service uses a charter-party framework and a safety driver. This does not mean Tesla has no paid California rides. It means that paid, human-driven service should not be described as verified commercial driverless deployment.cadmv, cpuc, d26q2
Waymo provides a commercial benchmark. The latest explicit paid-trip disclosure located for this review is its September 15 announcement, which says it serves more than 500,000 paid trips per week. At the lower-bound weekly count, that annualizes to 26 million trips. Applying Waymo’s approximate 4.4-mile trip length gives 114.4 million paid miles per year as an illustrative annualization.waymo, waymomiles
The model’s 812 billion Tesla miles are thousands of times that illustrative present-day benchmark. Waymo’s reported activity gives a sense of scale for Tesla’s modeled 2035 requirement. Tesla’s latest disclosure of nearly two million cumulative unsupervised Robotaxi miles uses a different metric. It cannot be substituted for annual paid passenger miles, and it should not be silently joined to earlier disclosures labeled paid miles.d26
Production milestones, permit lists and active entitlements show progress. None substitutes for net revenue per occupied mile, contribution after all operating costs, fleet replacement spending and customer retention. Those are the measurements that would turn the reverse DCF from a requirements exercise into an operating valuation.
6. The CEO award changes the economics, but not by issuing the same shares twice
The 2025 award contains twelve equal tranches of 35,311,992 shares. Their market-capitalization thresholds are $2.0, $2.5, $3.0, $3.5, $4.0, $4.5, $5.0, $5.5, $6.0, $6.5, $7.5 and $8.5 trillion. Both six-month and 30-day averages must meet the relevant threshold; a one-day stock price is insufficient.proxy25
Each tranche also needs one unused operating milestone, which need not match the row order of the capitalization targets. The operating set comprises 20 million cumulative vehicles; ten million qualifying FSD access entitlements; one million humanoid deliveries; one million robotaxis in commercial operation; and adjusted-EBITDA targets of $50, $80, $130, $210, $300 and $400 billion, with the final $400 billion level required in three nonoverlapping four-quarter periods. Final tranches add succession conditions. Adjusted EBITDA is not free cash flow.proxy25
The FSD milestone also includes qualifying one-time purchases and licensing access. It must not be rewritten as ten million recurring monthly subscribers. The precise definitions, measurement periods and exceptions are preserved in the milestone CSV, with links to Annex C.
Shares earned by September 3, 2030 generally vest on March 3, 2033; later-earned shares generally vest on September 3, 2035. Continued eligible service is required. Unearned shares are forfeited at expiry. The holding requirement runs for five years after earning and at least until vesting. The model assumes a single late-vesting bucket for its main economic comparison.proxy25, proxy26
For each earned share, $334.09 is paid in cash or satisfied by returning an equivalent number of shares. Under the cash alternative:
EV_(required)=P × (N_0+kT)-PV(kT × 334.09)-NetFinancialAssets,
where N_0 is 3.529014042 billion shares excluding this award, T is 35.311992 million shares per tranche, and k is the number earned. The full nominal offset is $141.569 billion, paid at vesting, which puts receipt in the future.
| Tranches earned | Gross final shares | Nominal cash offset, $bn | PV offset, $bn | Net shares at $2,500 settlement | Residual at current price, $bn |
|---|---|---|---|---|---|
| 0 | 3,529,014,042 | 0.000 | 0.000 | 3,529,014,042 | 1,119.0 |
| 6 | 3,740,885,994 | 70.784 | 26.080 | 3,712,572,273 | 1,175.7 |
| 12 | 3,952,757,946 | 141.569 | 52.160 | 3,896,130,505 | 1,232.4 |
The $2,500 net-settlement column illustrates a future share count. The cash-offset valuation already accounts for dilution on its own terms. Offset shares are rounded up as required. Other future dilution is excluded; ordinary SBC is already counted as an economic expense.
The 2018 award’s exercised shares are already included in current outstanding shares. The 96-million-share interim award was forfeited in April 2026. Neither is added again. This reconciliation uses the filing’s account of the award status; it makes no inference about misconduct from the compensation dispute.q26award, proxy26
At the current price, the six-tranche cash-offset case raises the unexplained value to approximately $1.176 trillion; twelve tranches raise it to $1.232 trillion. The raw legal-share calculation, before offsets or forfeiture, gives $1.285 trillion. These are different conventions answering different questions. The market’s probability distribution over award outcomes is not disclosed.
7. What must be true at half, current and double the price
The next table holds the base existing-business DCF and reverse operating assumptions constant. It uses the favorable zero-tranche reference. The robotaxi and FSD columns are alternatives, each asked to support the whole residual.
| Price case | Price | Residual, $bn | 2030 paid miles, bn | 2035 paid miles, bn | 2030 FSD accounts, m | 2035 FSD accounts, m |
|---|---|---|---|---|---|---|
| Half | $195.42 | 429.3 | 50.4 | 315.1 | 26.8 | 134.1 |
| Current | $390.84 | 1,119.0 | 129.9 | 811.7 | 69.1 | 345.5 |
| Double | $781.68 | 2,498.3 | 288.8 | 1,804.9 | 153.6 | 768.1 |
For robotaxi, 2030 assumes $1.25 net revenue per paid mile and 30% EBIT margin; 2035 assumes $1.00 and 35%. FSD assumes $99 monthly and operating margins of 60% in 2030 and 65% in 2035. Taxes, reinvestment and timing remain as specified above. The supporting files contain all nine price-by-award combinations.
Two conclusions survive ordinary changes in presentation. First, halving the share price does not eliminate the requirement for new economics under the base existing-business assumptions: approximately $429 billion remains. Second, that is not true under every operating forecast. At half price, the high existing-business DCF of $694 billion exceeds the $650 billion award-excluded EV. In that combination, no incremental autonomy or robot profit is required. The high growth, margins and lower discount rate are what produce that result.
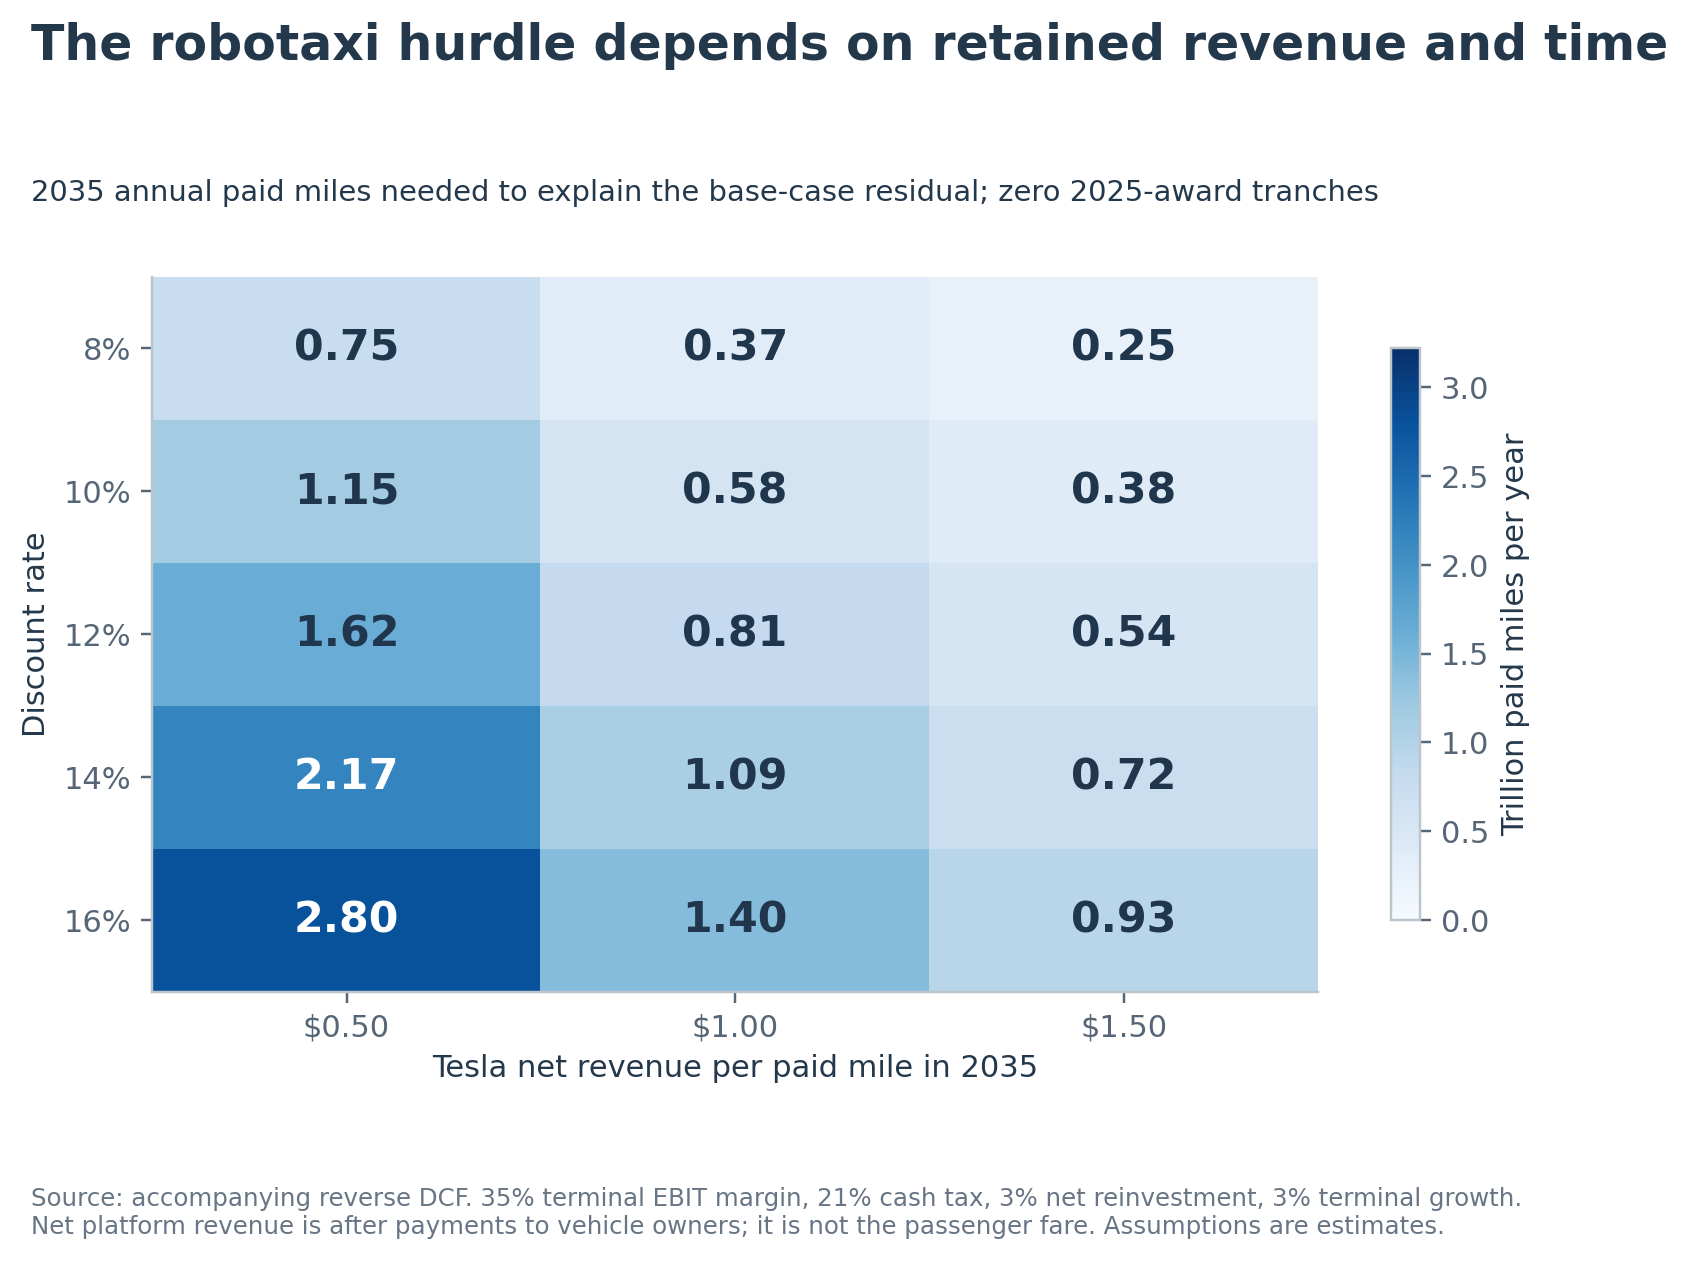
Discount-rate and net-revenue sensitivity
| New-business discount rate | $0.50 net / mile | $1.00 net / mile | $1.50 net / mile |
|---|---|---|---|
| 8% | 747.9 | 374.0 | 249.3 |
| 10% | 1,151.4 | 575.7 | 383.8 |
| 12% | 1,623.4 | 811.7 | 541.1 |
| 14% | 2,170.2 | 1,085.1 | 723.4 |
| 16% | 2,798.2 | 1,399.1 | 932.7 |
Required annual paid miles in 2035, billions. Base existing-business value, current price, zero 2025-award tranches. Each cell recalculates discounting; it is not a scaled headline pasted into a grid.
A lower discount rate gives distant cash flows more value. A higher net take reduces the required miles. A technology demonstration reveals neither input. A delay matters because it shifts the same possible cash flows further away and may require additional funding before they arrive.
8. Evidence that would change the conclusion
Better disclosure of costs and cash flow would narrow the range by reducing reliance on allocations and terminal assumptions.
For the existing businesses, sustained automotive gross margin after identifying credit and tariff effects would change the operating base. Energy needs a clearer storage/generation revenue split and disclosure of manufacturing-credit dependence. Recurring service profit and the cash cost of scaling would help distinguish an improving installed-base business from revenue growth with limited distributable cash.
For robotaxi, the critical series is paid occupied miles, gross rider payments, revenue recognized by Tesla, active productive fleet, empty-mile ratio, operating costs, replacement spending and incremental growth capital. Consistent reporting across quarters matters more than a single cumulative milestone. A regulator-authorized roster, a company service map and an active commercial fleet measure different things.
For FSD, monthly-paying accounts should be counted apart from legacy upfront purchases and trials. Churn, realized subscription price, recognition timing and signed third-party licensing economics would make the subscriber alternative testable. The existing disclosure of regional new-delivery attachment shows recent uptake, but it does not resolve those questions.
For humanoids, third-party deliveries, realized price, warranty/service costs, customer productivity and repeat orders would support a revenue and cash-flow model. Production-quality hardware alone does not show the volume or margin required by the valuation.
For shareholders, an announced SpaceX transaction with an exchange ratio, asset perimeter and funding terms would require a new capital-structure analysis. So would material changes to the performance award or financing. A review committee without agreed terms is a reason to keep the residual’s interpretation open. The model leaves any acquisition value unspecified.
At the current price, the base operating valuation explains a minority of Tesla’s enterprise value. The remainder requires a very large profitable business, a much stronger outcome in the existing operations, materially cheaper capital, or some combination. The question for an investor is whether the emerging evidence supports those particular quantities, margins and funding needs—and at what probability—not simply whether autonomy and robots are possible.
Appendix A. How to rebuild the figures
The XLSX organizes sourced inputs, assumptions, calculations and outputs. Actuals preserves the filing observations; History builds annual and TTM ratios; Core DCF, Reverse DCF and Award own the valuation calculations; Summary links to their results. Peer checks contains the source inputs and arithmetic for the trading anchors. Evidence preserves the operational and regulator observations, including unknowns.
Blue cells are editable inputs. Change the case selector to Low, Base or High. The same operating build recalculates. Native two-variable Excel data tables provide simultaneous case/price and discount/net-revenue comparisons. Use automatic calculation including data tables, and Calculate All after edits. The model deliberately shows negative raw residuals when core value exceeds enterprise value; the required new-business scale is then zero.
The CSVs provide the raw source ledger, annual/TTM history, forecast assumptions, complete cash-flow schedules, price/award cases, regulator evidence and peer inputs. The accompanying PNG charts show the valuation and operating sensitivities. The XLSX and CSVs contain the inputs and arithmetic.
Three primary-document checks
- Valuation bridge. Nasdaq’s $390.84 close multiplied by 3,952,757,946 SEC cover shares gives $1,544.896 billion of gross legal equity capitalization. Subtracting the independently extracted $39.151 billion net-financial-asset balance gives $1,505.745 billion EV. Excluding 423,743,904 conditional shares gives $1,340.129 billion before an economic award allowance.
- Automotive TTM margin. Automotive revenue of $75.003 billion less $1.181 billion credits gives $73.822 billion. Subtracting $60.699 billion of cost gives $13.123 billion gross profit and 17.7765% margin. Removing $0.260 billion of tariff benefit gives 17.4243%.
- Energy Q3 normalization. Restore reported revenue of $2.881 billion by $0.339 billion and reported cost of $1.927 billion by $0.526 billion. Gross profit becomes $0.767 billion on $3.220 billion of revenue: 23.8199%, compared with 33.1135% reported.
The independent extraction checks include annual-to-quarter, revenue, gross-profit and operational-volume reconciliations. The workbook reproduces the existing-business value, residual, paid miles and subscriber requirements. The source ledger lists the primary documents and locators.
Appendix B. Scope and remaining unknowns
This model is in nominal U.S. dollars. Peer multiples are calculated in each company’s reporting currency where possible; Toyota’s group P/E uses a disclosed yen/dollar timing approximation. Enterprise value and equity value are never used interchangeably. Fleet is a stock; deliveries, paid miles and revenue are period flows. A cumulative milestone is not an annual run rate.
The segment disclosures leave storage-only revenue and costs, operating-expense and capital allocations, and the 2026 manufacturing-credit split unknown. For autonomy, Tesla has yet to disclose monthly-paying FSD accounts, robotaxi unit economics and the active paid-service fleet. Regulator-defined Tesla service-area acreage and the economics of selling humanoids externally also remain unknown. They are not filled with zero or a news estimate. Future endpoint assumptions are analytical scenarios; neither their precision nor the spreadsheet’s formulas turns them into reported facts.
The report models standalone Tesla and its currently reported financial assets. It includes no unagreed merger, no general employee-share expansion on top of already-expensed SBC, and no tax-withholding windfall from the CEO award. The all-earned scenarios remain subject to operating, market-capitalization, service and other award conditions.
Sources
I accessed the cited Tesla and peer disclosures on November 12, 2026. The input CSV provides the more granular figure-to-document mapping. SEC page references refer to printed document pages where available; HTML fact IDs and contexts provide exact locators even when pagination differs.
- Nasdaq, TSLA historical market-data response,
data.tradesTable.rows, date11/11/2026,close=$390.84. Public response preserved; re-fetched for verification. Nasdaq historical page. ↩ - Tesla, Q3 2026 Form 10-Q, cover; balance sheet p 4; operations p 5; cash flows p 9; revenue recognition pp10–11; related parties Note 13; MD&A; Item 5 p 41. Tags include
dei:EntityCommonStockSharesOutstanding,us-gaap:CashAndCashEquivalentsAtCarryingValueand filing-specific revenue contexts. See raw ledger for each fact ID. ↩ - Tesla, same Q3 2026 10-Q, Note 14, Segment Reporting and Information about Geographic Areas, and consolidated operating-expense lines. ↩
- Tesla, same Q3 2026 10-Q, Note 11, “Tariffs,” p 25. Source for the $526m cost, $260m cost and $339m revenue adjustments; not an independently asserted account of a court ruling. ↩
- Tesla, same Q3 2026 10-Q, MD&A, Cash Flow and Capital Expenditure Trends and Material Cash Requirements. The guidance specifies spending “in excess of” $20bn. ↩
- Tesla, same Q3 2026 10-Q, Note 9, pp21–23, award status, interim forfeiture, 2018 award implementation and $802m nine-month 2025-award expense. ↩
- Tesla, 2023 Form 10-K, consolidated statements and revenue-recognition note; comparative FY2021–FY2023 data. Context-specific
RevenueFromContractWithCustomerExcludingAssessedTax,CostOfRevenue, cash-flow and SBC facts are identified individually inhistorical_inputs.csv. ↩ - Tesla, 2025 Form 10-K, operations p 50, cash flows p 53, revenue recognition pp55–59, SBC/CEO award pp82–83; comparative FY2023–FY2025 data. ↩
- Tesla, same 2025 10-K, Note 2, manufacturing-credit discussion p 59. Approximately $1.12bn energy credit reflects the source’s rounding. ↩
- Tesla, Q4 and FY2023 Update, operational summary p 8; original annual MWh figures for 2021–2023. Exact URL also preserved in the source registry. ↩
- Tesla, Q4 and FY2025 Update, Financial Summary and Operational Summary; five-year delivery, deployment and comparable-capex tables. ↩
- Tesla, Q3 2026 Update, highlights p 3; operational summary p 5 and FSD footnote 3; manufacturing p 6; autonomy discussion p 8. Tesla’s own disclosures about technical performance. ↩
- Tesla, same Q3 2026 Update, non-GAAP reconciliation p 31, TTM CFO, capex, SBC and D&A series. Footnote1 describes the comparable capex definition. ↩
- Tesla, 2025 definitive proxy, pp65–68 and Annex C, especially Sections I–III and XI. Exact tranches, operating definitions, offset, vesting and exceptions are mapped in the award CSVs. ↩
- Tesla, 2026 definitive proxy, pp43–45; ownership footnote 2; p 78 issuance/voting FAQ. None of the 2025 award shares had become earned at that proxy. ↩
- Tesla Support, Full Self-Driving (Supervised), FAQ on monthly price and subscription availability. Subscription support. Current features require active driver supervision. ↩
- TxDMV, Tesla Robotaxi LLC public vehicle roster and its public API, all fourteen pages,
total=1303; authorizationAV8313426653583, May 14, 2026. Raw paginated receipt and unique-VIN reconciliation preserved. ↩ - TxDMV, Automated Vehicles Regulatory Program, authorization requirements and May 28, 2026 enforcement date. ↩
- California DMV, Autonomous Vehicle Permit Holders, drivered testing list dated October 23 and driverless/deployment lists updated November 5, 2026. ↩
- California Public Utilities Commission, Autonomous Vehicle Program Permits Issued, carrier/permit/ODD table. ↩
- Tesla, Q2 2026 SEC shareholder-update exhibit, Bay Area safety-driver service and charter-party permit
TCP0046782-A. ↩ - Waymo, Building Waymo’s Risk and Insurance Foundation in Europe with Allianz Partners, September 15, 2026, opening paid-trip disclosure. ↩
- Waymo, Sustainability, methodology footnote 1, approximate 4.4-mile trip. The report’s annualization combines this estimate with the lower-bound weekly paid-trip disclosure. ↩
- GM, Q3 2026 earnings release, combining balance sheet p 7 and adjusted-EBIT bridge p 11; Q4 2025 release, p 3; Q3 10-Q, cover; Nasdaq historical API close November 11. Formula and every input are in
peer_inputs.csv. ↩ - Ferrari, Borsa Italiana reference price, November 11; Q3 results, pp9/12; interim report, Note 20; November 9 buyback release; 2025 20-F. ↩
- NVIDIA, July 26, 2026 10-Q, cover, operations p 3 and balance sheet p 5; fiscal 2026 10-K, operating-income facts. Fiscal2026 ended January 25, 2026. Nasdaq November 11 historical price; share count is the latest rounded filing observation. ↩
- Toyota, latest half-year summary, PDF pp2–3; FY2026 summary, PDF p 2; 2026 20-F, ADS ratio; Bank of Japan November 11 exchange rate, 17:00 JST midpoint. The FX observation precedes the U.S. equity close. ↩
Supporting material
- Excel model ↗Sourced inputs, live calculations and reported outputs.
- Source and model data (CSV collection) ↗Data tables, source references and calculation exports.
- Material figure map ↗Download as CSV.