Financial systems
How much of SpaceX’s value is Starlink?
The base case puts the connectivity business at $245 billion, against $1.85 trillion of enterprise value for the enlarged SpaceX.

Starlink is already a substantial operating business. The model estimates positive operating income for core launch before most Starship development spending. The reported Space segment is losing money while it builds Starship. Neither should be valued using the entire stock-market value of today’s enlarged SpaceX.
SpaceX is now public, trading as SPCX. It completed its IPO in June 2026, after acquiring xAI in February. The company also contains X and, since August, Cursor. Its roughly $1.898 trillion equity value and $1.847 trillion enterprise value therefore price much more than rockets and satellite broadband.1, 2, 4
Operating income is the best earnings measure available for the two space businesses. The company doesn’t disclose segment-level net income or complete segment cash-flow statements.
| Business | Revenue, 12 months ended September 2026 | Operating income, same period | Base enterprise value in this report |
|---|---|---|---|
| Connectivity: Starlink, mobile and Starshield | $16.024bn | $6.487bn | $244.9bn |
| Space: launch, Dragon, development and Starship | $4.157bn | −$1.687bn | $18.7bn |
Historical amounts are calculated from filed annual and interim results. I estimate each value from the inputs described below.1, 2, m
The $18.7 billion Space value comprises $28.1 billion for core launch and existing development, less $9.4 billion for the modeled incremental Starship spending path. That split is an analytical allocation within an integrated company. Starship also enables lower future deployment costs in the Connectivity valuation.
The decisive assumptions are 70 million consumer service lines by the end of 2035, blended monthly consumer revenue of $54.51 per line, successful commercial and government expansion, and permanent satellite replacement spending. Together, the base space businesses are worth $263.6 billion in this model. The remaining $1.583 trillion of current group enterprise value must be supported by Superintelligence and other expectations. That residual is insufficient evidence that the whole company is overvalued: this report does not appraise the enlarged AI business.m
1. The business perimeter
The old description of SpaceX as a private company is obsolete. The IPO sold 638.9 million shares, including the underwriters’ option, at $135; filed net proceeds were $85.675 billion. Trading began on 12 June, and the offering closed on 15 June 2026.1, 2, 23
The combination history matters just as much as listing status. SpaceX acquired xAI on 2 February 2026. xAI had acquired X on 28 March 2025. The common-control accounting retrospectively includes those operations in earlier consolidated results. A historical group revenue chart can therefore mislead if it is treated as the history of the original launch-and-Starlink company. The filed segment tables provide a comparison on the same basis.1
Cursor joined on 14 August 2026. Its contractual implied equity value of $60 billion and acquisition-accounting consideration of $42.474 billion describe different measurements; neither is a current independent valuation of Superintelligence. A possible Tesla combination was under evaluation, with no agreed transaction in the latest reviewed disclosure. Tesla is excluded here.2
Reconstructing the current market value
| Market bridge | Amount | Measurement |
|---|---|---|
| Economic shares outstanding | 13.581064bn | Class A plus Class B, 15 October |
| Closing price | $139.75/share | 11 November |
| Equity value | $1,897.954bn | Shares × price |
| Debt principal and finance leases | +$38.989bn | 30 September |
| Cash and short-term securities | −$89.855bn | 30 September |
| Enterprise value | $1,847.088bn | Latest reported balance-sheet proxy |
The balance-sheet date is deliberately explicit: this is not a claim to know cash and debt on 12 November. EPS weighted-average shares are unsuitable for current market capitalization. Nor should every award excluded from diluted EPS simply be added again: a large block of restricted shares was already issued. Future options, RSUs and grants still create dilution risk.1, 2
An outside dated market-cap table reports $1,897.95 billion, independently matching the share-price calculation to rounding. The equity-to-enterprise bridge then uses the balances in the filing, whose basis is disclosed.4
Subsequent commitments belong in the analysis without being mistaken for funded September debt. The October Apollo agreement covers approximately $40 billion of GPU finance leases, expected to close later, with equipment delivery in 2027. It is a future funding commitment of the enlarged group. It is not cash available for distribution, and its full principal is not inserted into the current debt figure.5
The reported Superintelligence segment generated $10.939 billion of revenue and a $3.295 billion operating loss in the first nine months of 2026, while investing $39.995 billion in capital expenditure. The results cover the enlarged segment after the combination. They demonstrate why the group’s cash and financing cannot be treated as unused Starlink surplus.2
This defines the valuation perimeter: calculate the space activities, identify their capital requirements, and show the residual for the remaining group. An old private-market transaction price cannot answer that question.
2. What Starlink and launch earn
The registration statement replaces much of the guesswork previously required to estimate SpaceX’s accounts. The latest 10-Q extends that history through September 2026.
| $bn, except margins | 2023 | 2024 | 2025 | TTM September 2026 |
|---|---|---|---|---|
| Connectivity revenue | 3.869 | 7.599 | 11.387 | 16.024 |
| Connectivity operating income | 0.469 | 2.006 | 4.423 | 6.487 |
| Connectivity operating margin | 12.1% | 26.4% | 38.8% | 40.5% |
| Connectivity capital expenditure | 2.455 | 3.498 | 4.178 | 5.469 |
| Space revenue | 3.557 | 3.796 | 4.086 | 4.157 |
| Space operating income | −0.001 | 0.021 | −0.657 | −1.687 |
| Space capital expenditure | 1.497 | 2.032 | 3.832 | 4.846 |
Source: final prospectus and September 10-Q. TTM = full-year 2025 + nine months 2026 − nine months 2025; no quarterly annualization.1, 2, m
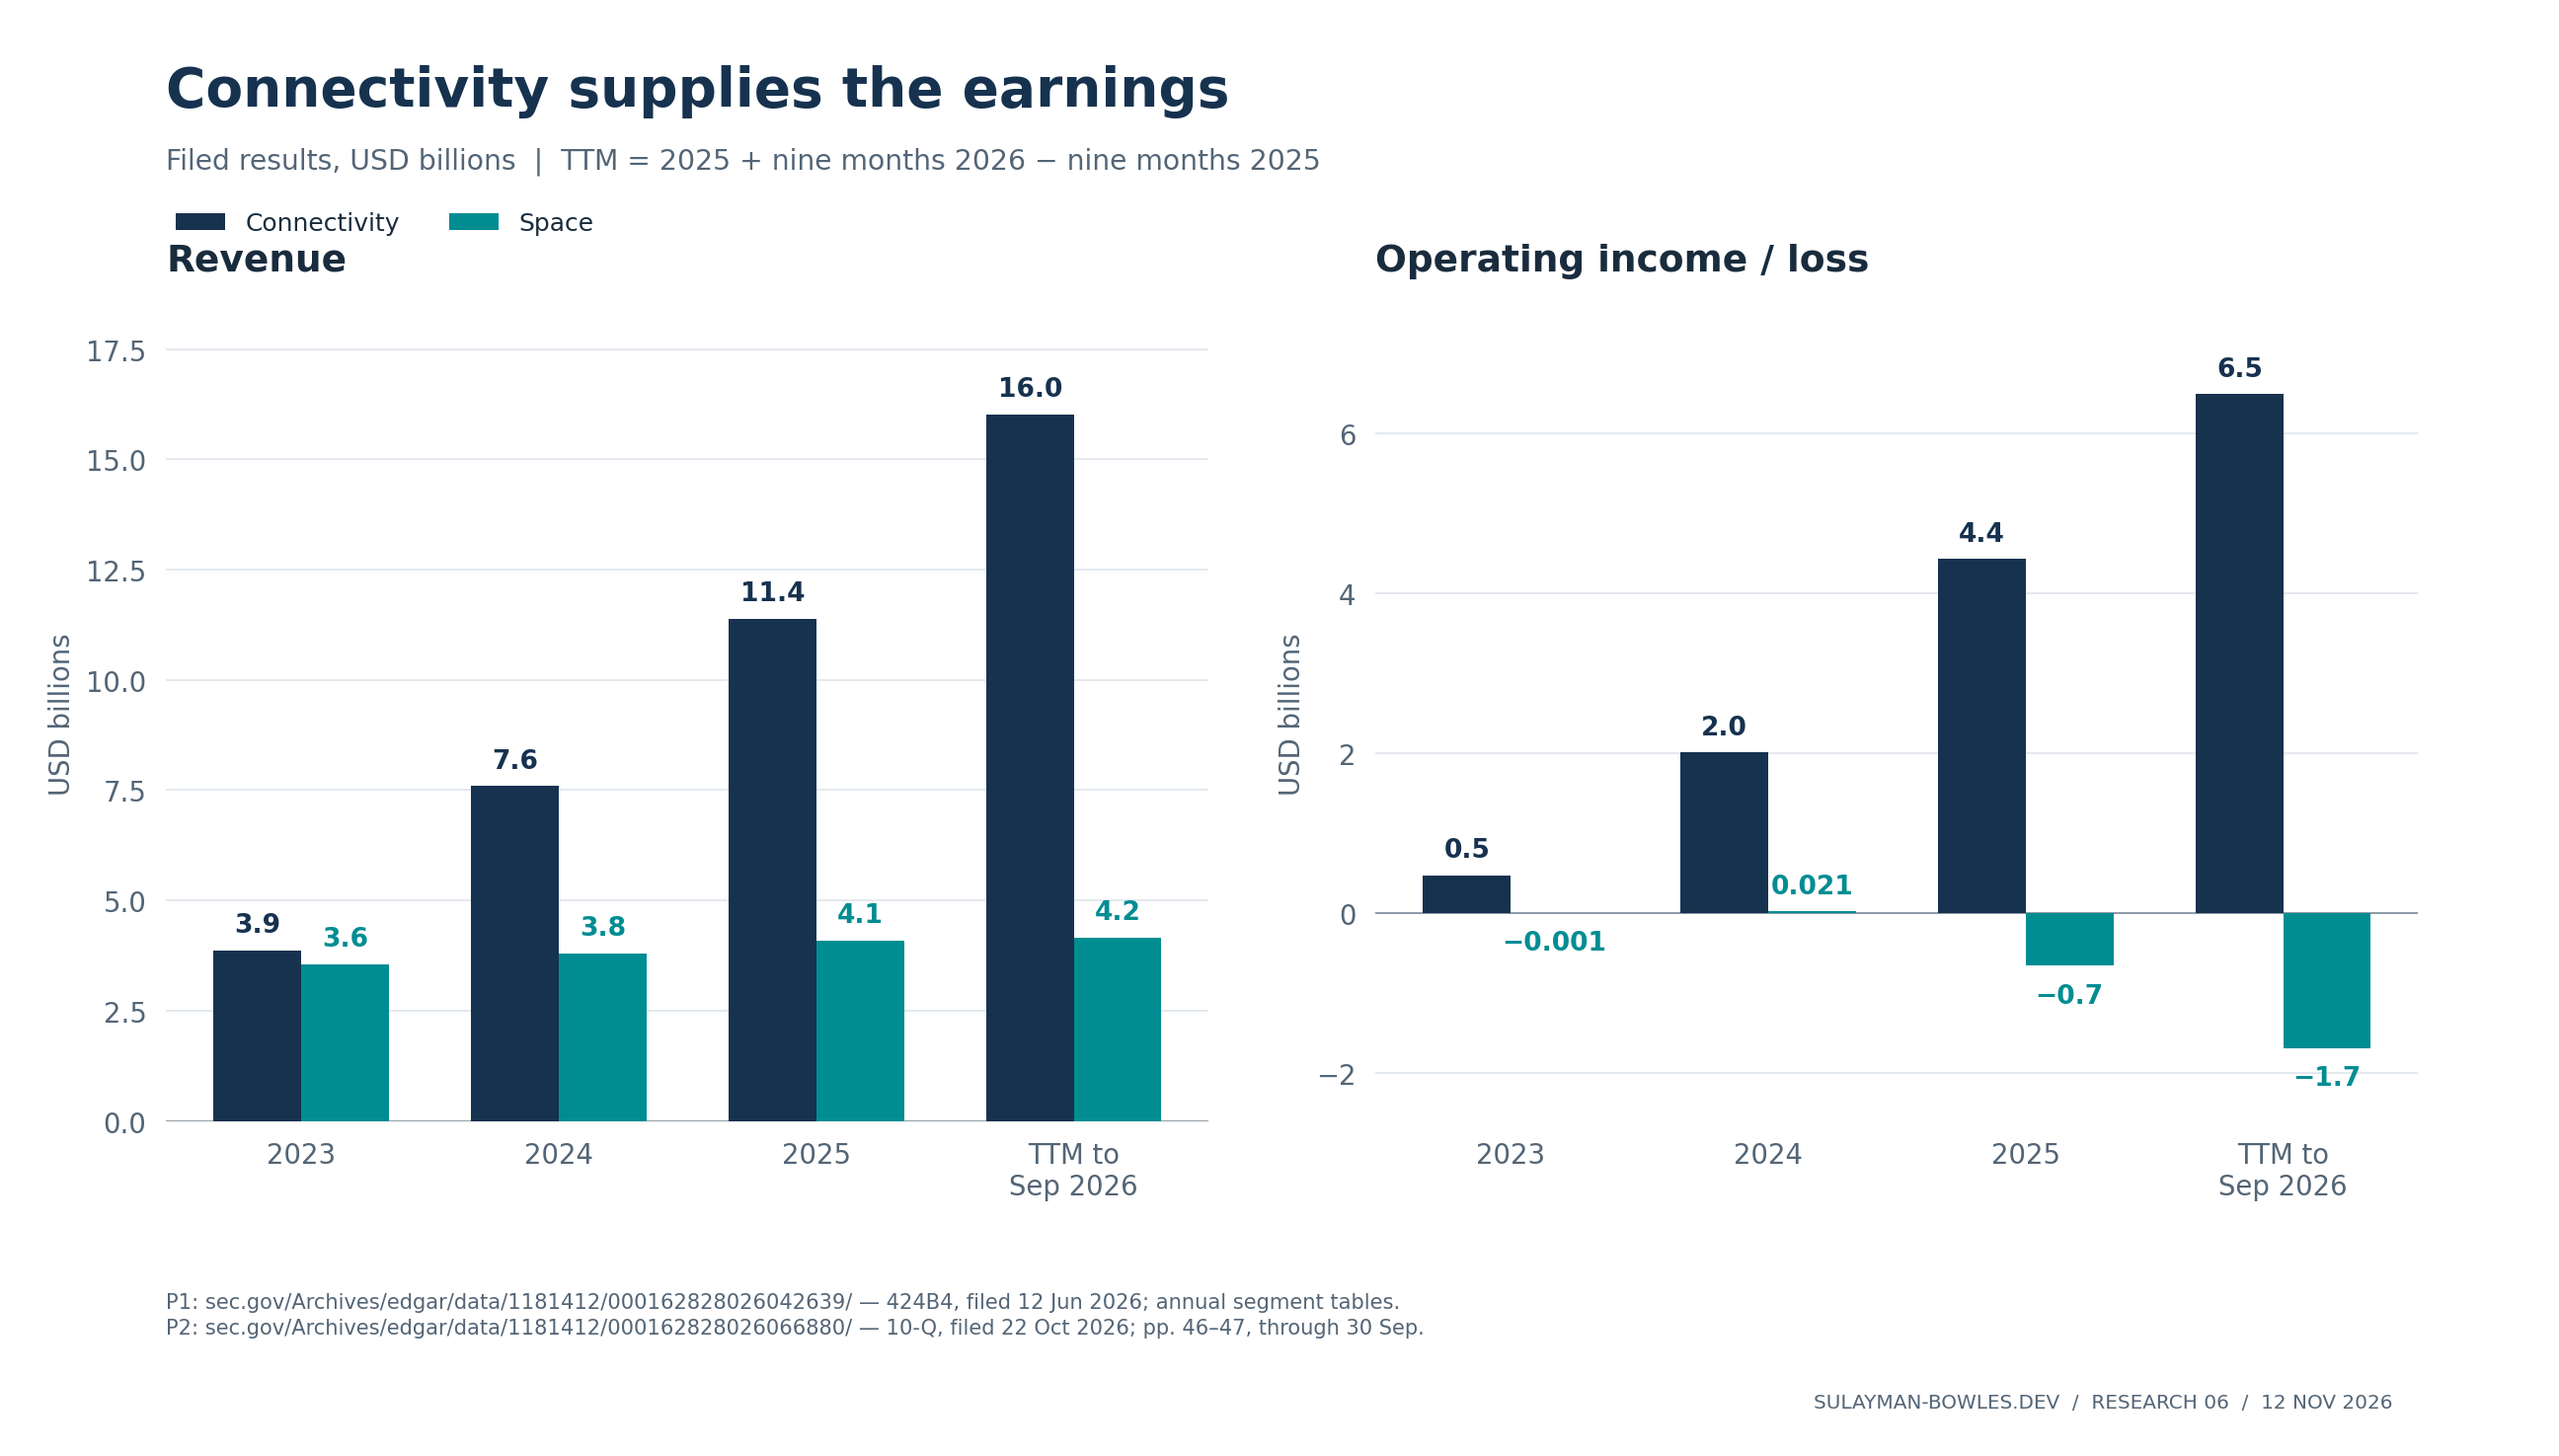
Figure 1. Connectivity supplies the growing operating profit; reported Space earnings include development costs. Annual and TTM periods are labeled. Sources and exact plotted values accompany the chart.
Operating profit is not cash available to owners. Connectivity’s 2025 adjusted EBITDA was $7.168 billion, but capital expenditure was $4.178 billion. Adjusted EBITDA also adds back stock compensation. Treating both that compensation and the constellation as free would materially overstate shareholder economics.1
A transparent cash proxy is:
Operating income × (1 − normalized tax rate) + depreciation − capital expenditure.
At a modeled 23% tax rate, the calculation is $1.604 billion for 2025 and $2.770 billion for the trailing year. The latter equals $6.487bn × 77% + $3.244bn − $5.469bn. These are estimated cash flows before working-capital changes. Tax allocation, customer advances and segment working capital remain unknown.m
Connectivity’s reported categories also need careful handling. In 2025, consumer revenue of $7.208 billion and enterprise/government revenue of $4.179 billion sum to $11.387 billion. Reported product revenue is already inside those categories. Adding terminal sales again would overstate the business.1
The Space loss requires a different interpretation. In 2025 it incurred $3.004 billion of R&D. Removing every dollar of that expense produces $2.347 billion of operating income before R&D, but that is not a sustainable Falcon profit measure. Keeping an estimated $300–600 million of annual engineering gives a $1.747–2.047 billion normalized operating-income range before the rest of the Starship program. This allocates program costs to estimate Falcon economics. Falcon has no audited standalone result here.1, m
The filed accounts therefore support two conclusions at once. Starlink has become a large profit center. Space has an existing revenue base but is committing enough to development and facilities that its current reported and cash earnings are much lower than a simple launch-margin story implies.
3. Consumer growth: more lines, lower regional revenue
The September filing reports 13.6 million consumer subscribers, but its definition is service lines. It includes residential, roam and self-serve priority business services. It excludes negotiated enterprise and government contracts. A person can have multiple lines; a vessel may buy a retail plan. These distinctions prevent double counting.2, 3
Filed consumer monthly ARPU fell from $99 in 2023 to $91 in 2024 and $81 in 2025. It was $67 for the first nine months of 2026, versus $69 in the third quarter alone. ARPU refers to service revenue; consumer revenue includes hardware. Multiplying year-end subscribers by the latest ARPU therefore does not reproduce annual reported revenue.1, 2
There is an independent regional growth check. Australia’s competition regulator reported 375,000 Starlink subscriptions in June 2025 and 552,000 in December. That supports rapid expansion in a particular market; it does not independently audit the global subscriber total.8
Advertised prices across countries
| Market | Advertised residential monthly prices | Evidence date |
|---|---|---|
| United States | $55 / $85 / $130 | Retrieved 12 November |
| United Kingdom | £40 / £60 / £80 | Retrieved 12 November |
| Australia | A$75 / A$110 / A$150 | Retrieved 12 November |
| Brazil | R$189 / R$249 | Retrieved 12 November |
| Philippines | ₱4,099 | Retrieved 12 November |
Official indexed plan pages; address eligibility, local promotions and taxes vary. Native prices stay in their original currencies. These are advertised prices. Address-specific quotes and realized ARPU may differ.9
The forecast uses region-specific mixes and net dollar ARPUs, calibrated to the global filed measure. The regional allocation itself is unknown and is therefore explicitly assumed:
| Home/roam region | 2026 assumed line mix | 2026 assumed ARPU/month | 2035 base mix | 2035 base ARPU/month |
|---|---|---|---|---|
| North America, Europe, Australia | 55% | $84 | 35% | $82 |
| Latin America | 25% | $45 | 30% | $42 |
| Asia and other markets | 15% | $40 | 25% | $34 |
| Africa | 5% | $28 | 10% | $24 |
Within the reported consumer definition, 96% of lines are allocated to home/roam and 4% to self-serve business. The latter earns an assumed $115 monthly in 2026 and $110 in the 2035 base case. These weights produce $66.86 blended consumer ARPU in 2026 and $54.51 in 2035. They are not currency conversions of selected tariffs.m
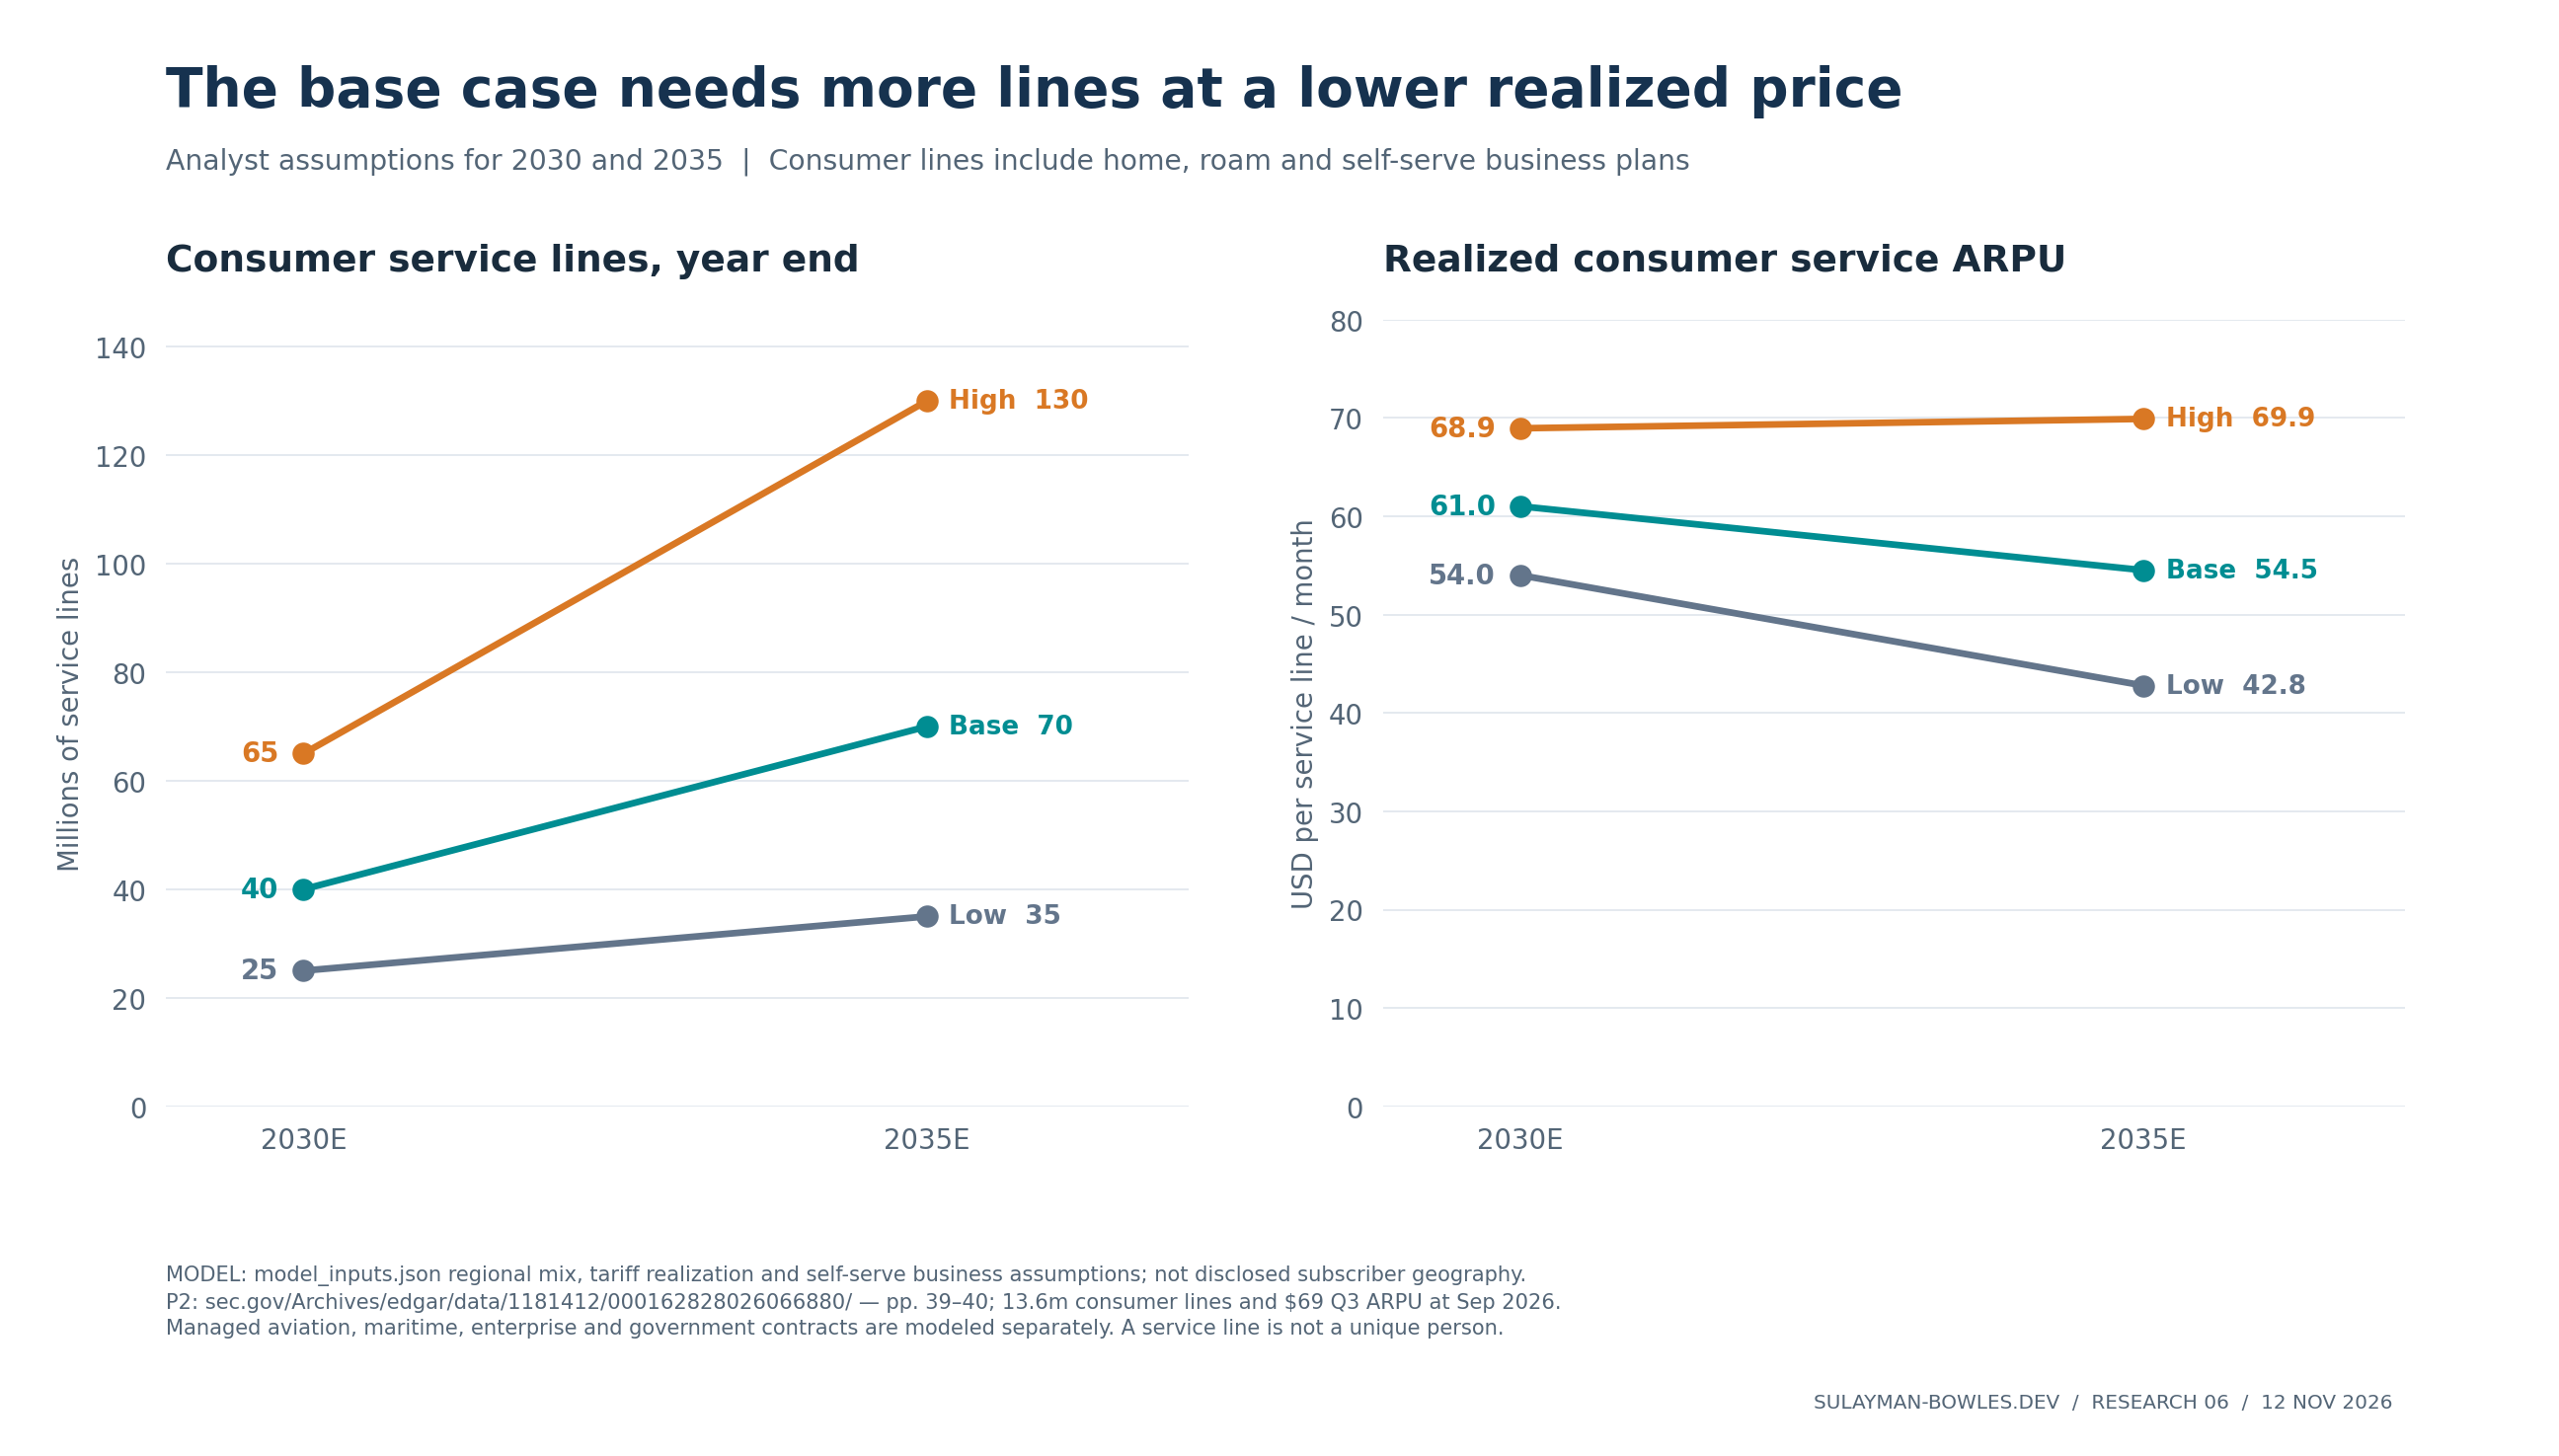
Figure 2. Growth can coexist with falling ARPU. Forecasts are analyst scenarios anchored to filed consumer metrics; exact scenario data are supplied with the chart.
The base case reaches 40 million year-end consumer lines in 2030 and 70 million in 2035. Annual revenue uses average opening and closing lines: 35.7 million and 66.3 million in those two years. The low case reaches 25 million and 35 million; the high case reaches 65 million and 130 million.m
The commercial challenge is not simply finding more households. Lower-priced regions can add users while reducing revenue per line, and a network must supply capacity where demand is concentrated. A global satellite count cannot determine the capacity of a particular beam over a crowded region. This report does not claim an engineering validation of those subscriber paths.
Terminals remain a real acquisition cost
The prospectus describes a 59% reduction in terminal manufacturing cost since 2022 through March 2026. It does not disclose a current absolute unit cost. An advertised free terminal is also not a zero-cost terminal.1
The model assumes $330 cost and $230 realized sale proceeds per consumer terminal in 2026, falling to $220 and $180 in 2035 in the base case. Terminal demand includes net additions, replacement customers associated with 8% annual churn, and a 2% hardware-replacement allowance. Churn is unknown; these are economic assumptions.
That produces a $719 million terminal subsidy in 2026 and $547 million in 2035. The subsidy is inside operating cash costs and is not deducted a second time from capital expenditure. The high case eventually earns a modest hardware margin; the low case assumes a larger subsidy. Growth quality depends on service contribution left after this acquisition cost. Activations show volume without measuring that contribution.m
4. Maritime, aviation, enterprise and government need their own models
A residential-only model misses important revenue, but inserting every connected phone, boat and aircraft into one subscriber total is equally misleading. The forecast distinguishes managed contracts from retail service lines and models Starshield projects apart from recurring government broadband.
Disclosed installations help anchor the counts. Starlink’s 2025 progress report described more than 150,000 vessels. Its third-quarter release reported more than 3,800 equipped aircraft at September-end. United reported more than 640 aircraft on 20 October; Qatar announced 150 on 20 August. Those customer statements corroborate substantial deployment, at different dates, without independently confirming the worldwide total or contract revenue.3, 12
Business-aviation tariffs range from $4,000 to $20,000 monthly across published plans. Maritime Global Priority plans include $650 for 500GB, $1,150 for 1TB and $2,150 for 2TB monthly. Negotiated airline and fleet realization is unknown. The published business-jet prices inform a range. Commercial aircraft rates remain undisclosed.10, 11
Base-case vertical build
| Revenue stream | 2035 activity assumption | Realized price assumption | 2035 revenue |
|---|---|---|---|
| Home/roam service | 63.642m average lines | $52.20/month | $39.865bn |
| Self-serve business service | 2.652m average lines | $110/month | $3.500bn |
| Managed aviation | 32,000 average aircraft | $15,000/month | $5.760bn |
| Managed maritime | 400,000 average vessels | $1,000/month | $4.800bn |
| Negotiated enterprise | 1.8m average lines | $350/month | $7.560bn |
| Government broadband | 300,000 average lines | $1,200/month | $4.320bn |
| Starshield projects | Contract/program revenue | Not a subscriber calculation | $6.000bn |
| Mobile wholesale | 350m paid-equivalent lines | $2.50/month | $10.500bn |
| Consumer and managed hardware | Sales/installation | Dedicated cost model | $3.661bn |
| Total Connectivity | $85.967bn |
All vertical allocations and forecasts are estimates. Managed maritime excludes retail roam boats already included in consumer lines. Government service excludes Starshield project revenue.m
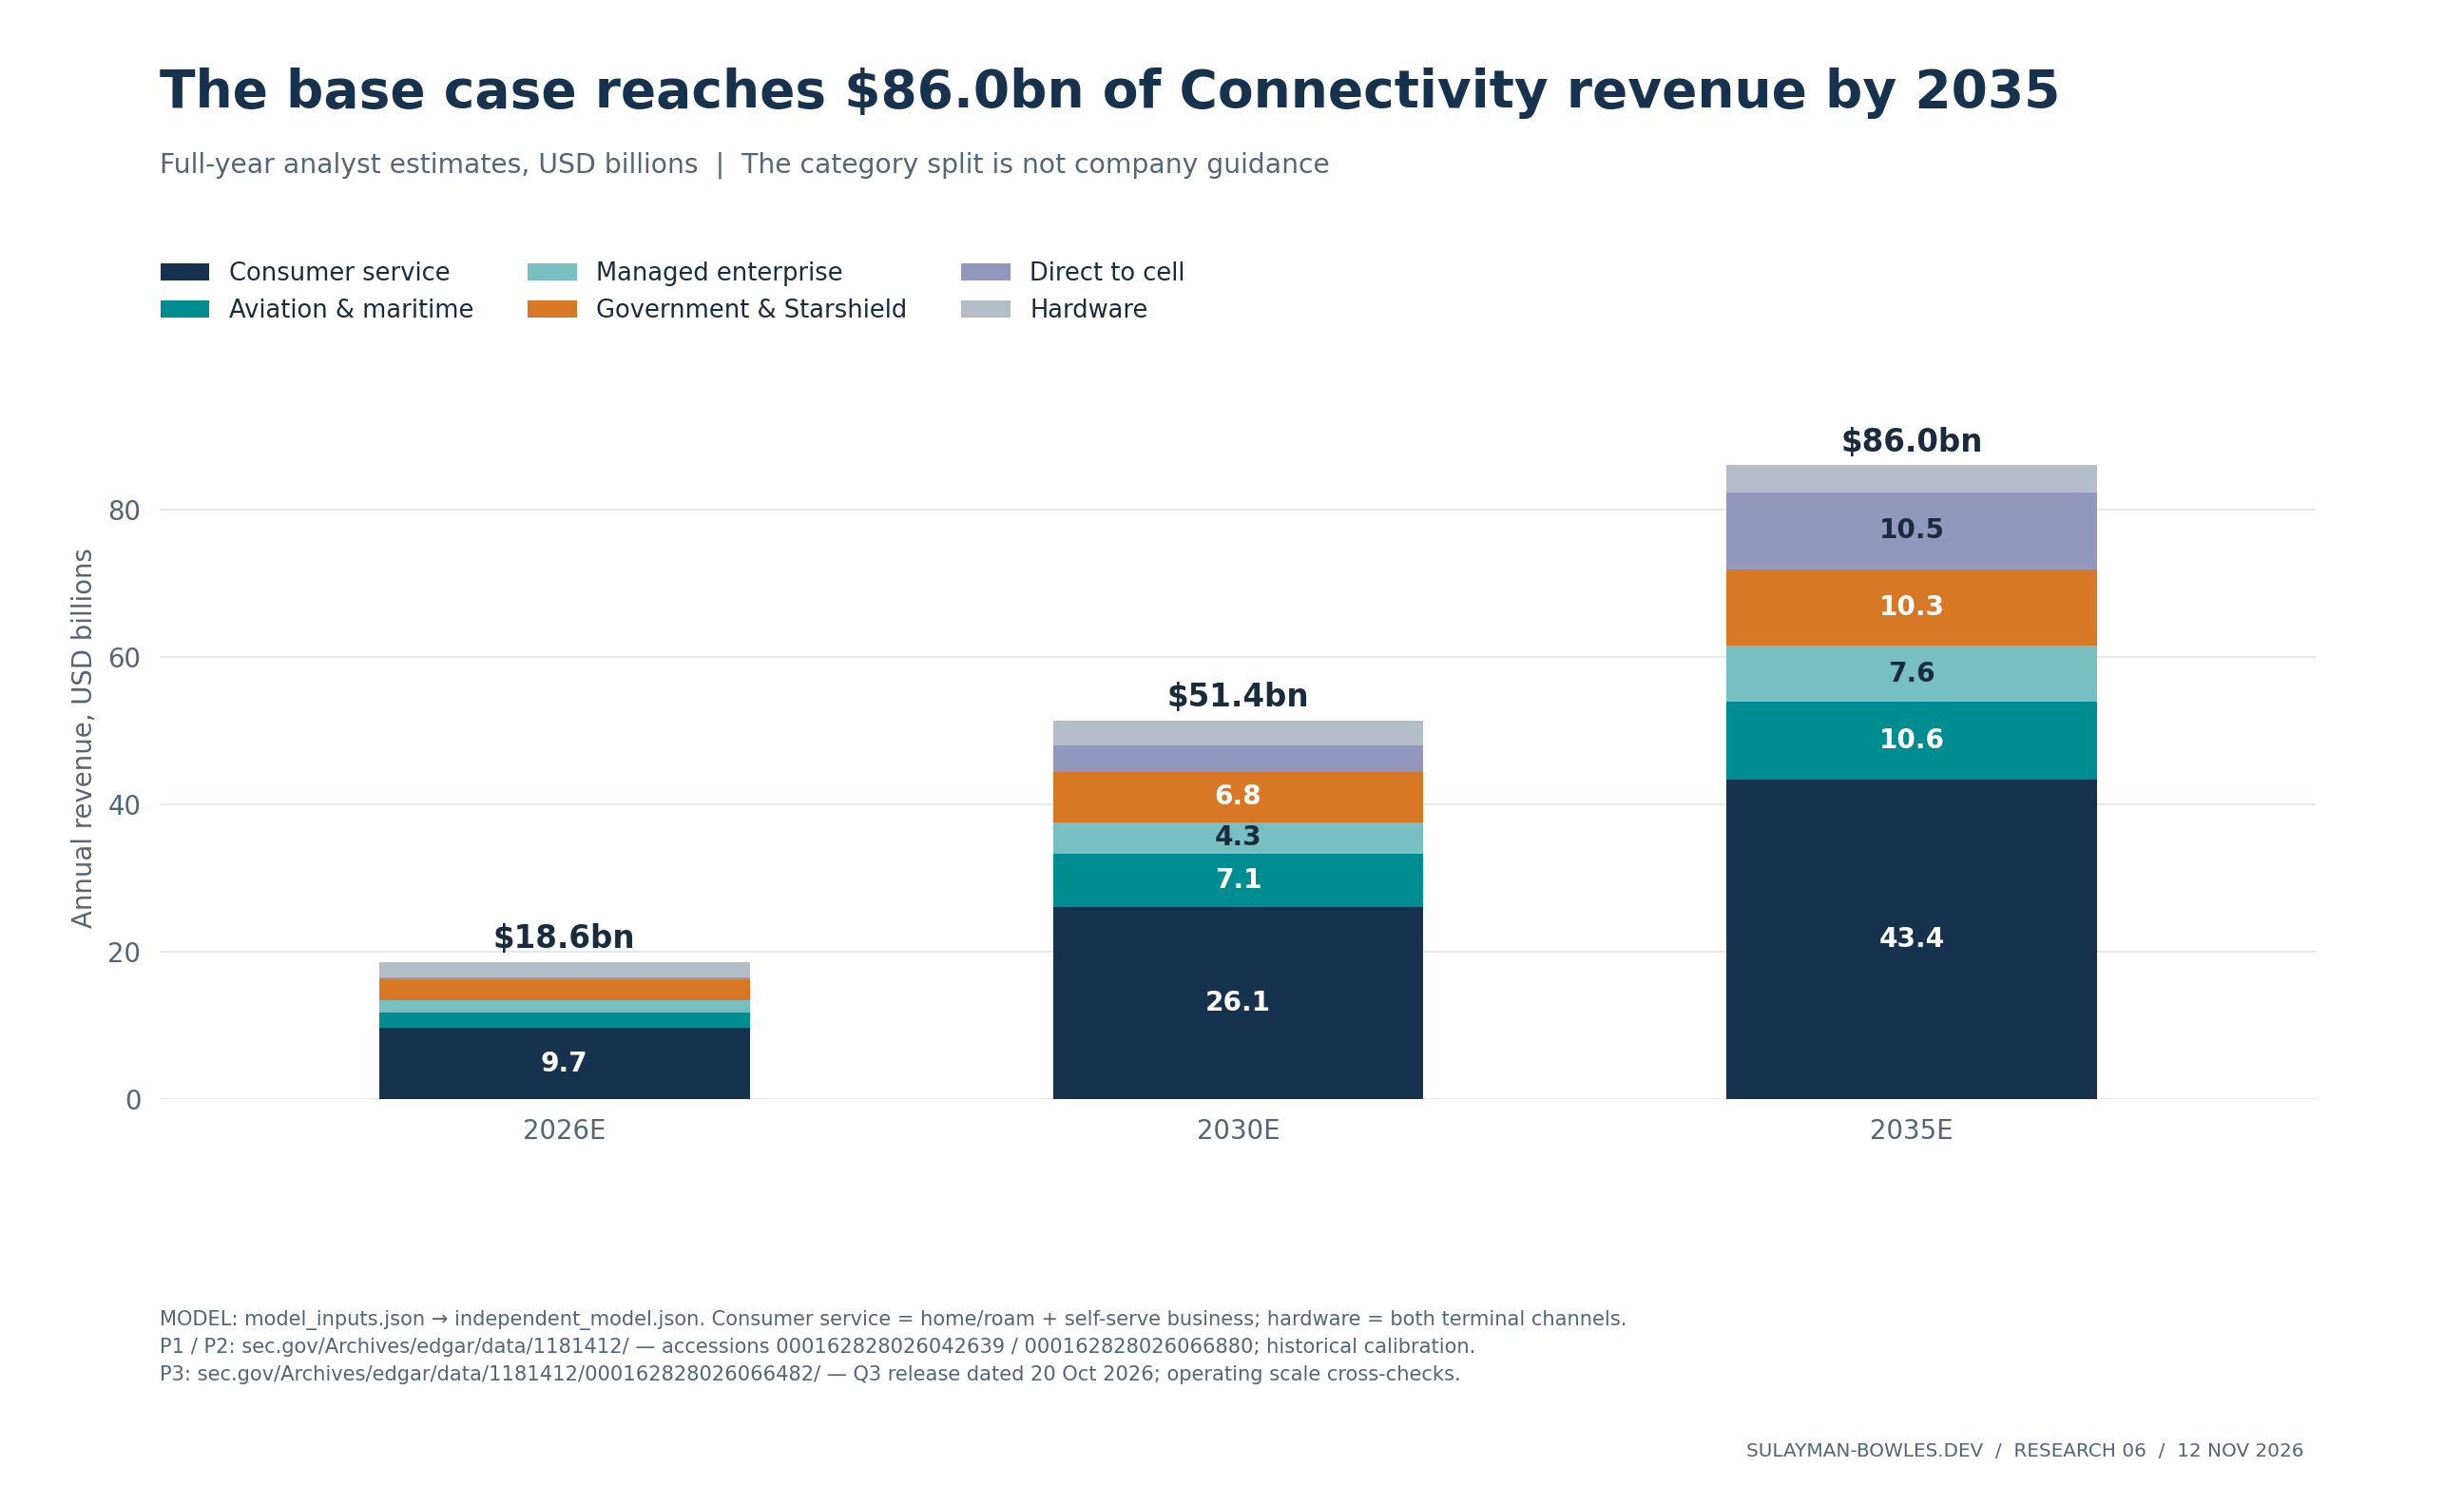
Figure 3. The base case increasingly depends on managed services, government and mobile. Company filings disclose the broad consumer/enterprise split; the detailed allocation is the analyst model.
The table makes the burden of proof visible. Aviation requires installations, certifications and recurring airline adoption. Maritime requires contracts with enough vessels that use the service heavily. A terminal installation alone doesn’t tell us whether a vessel meets that test. Enterprise and government require renewals and service economics that public aggregate revenue cannot reveal.
Starshield is especially important to distinguish. Some revenue is recognized over time using project progress. It is not recurring broadband ARPU multiplied by a secret subscriber count. The base model assigns 50% of Starshield revenue to direct program delivery costs, versus 23% for the general service-cost pool in 2035, before common overhead and depreciation. This assumes different program economics. SpaceX leaves the program margin undisclosed.1, m
Mobile also needs its own denominator. A phone capable of connecting is not necessarily a paying Starlink subscription. The model uses paid equivalents: wholesale revenue divided by the assumed monthly wholesale yield. Retail revenue the carrier keeps is excluded.
The base case’s $2.50 mobile yield is demanding. At 350 million paid equivalents it produces $10.5 billion annually, while the assumed mobile fleet eventually needs $6.667 billion of annual replacement investment before growth. Lower wholesale monetization can leave a large mobile constellation with unattractive economics. The low case therefore assumes a smaller messaging fleet; it does not expand indefinitely into a loss-making network.m
5. Launch: distinguish customer missions, internal flights and development
Falcon cadence measures productive capacity, but most recent flights have served the internal network.
| Falcon missions | 2023 | 2024 | 2025 | Nine months 2026 |
|---|---|---|---|---|
| External customer | 33 | 45 | 43 | 29 |
| Internal | 63 | 89 | 122 | 81 |
| Total | 96 | 134 | 165 | 110 |
Starship flights are excluded. The filing classifies missions by their primary payload and objectives. Internal flights chiefly support Starlink.1, 2
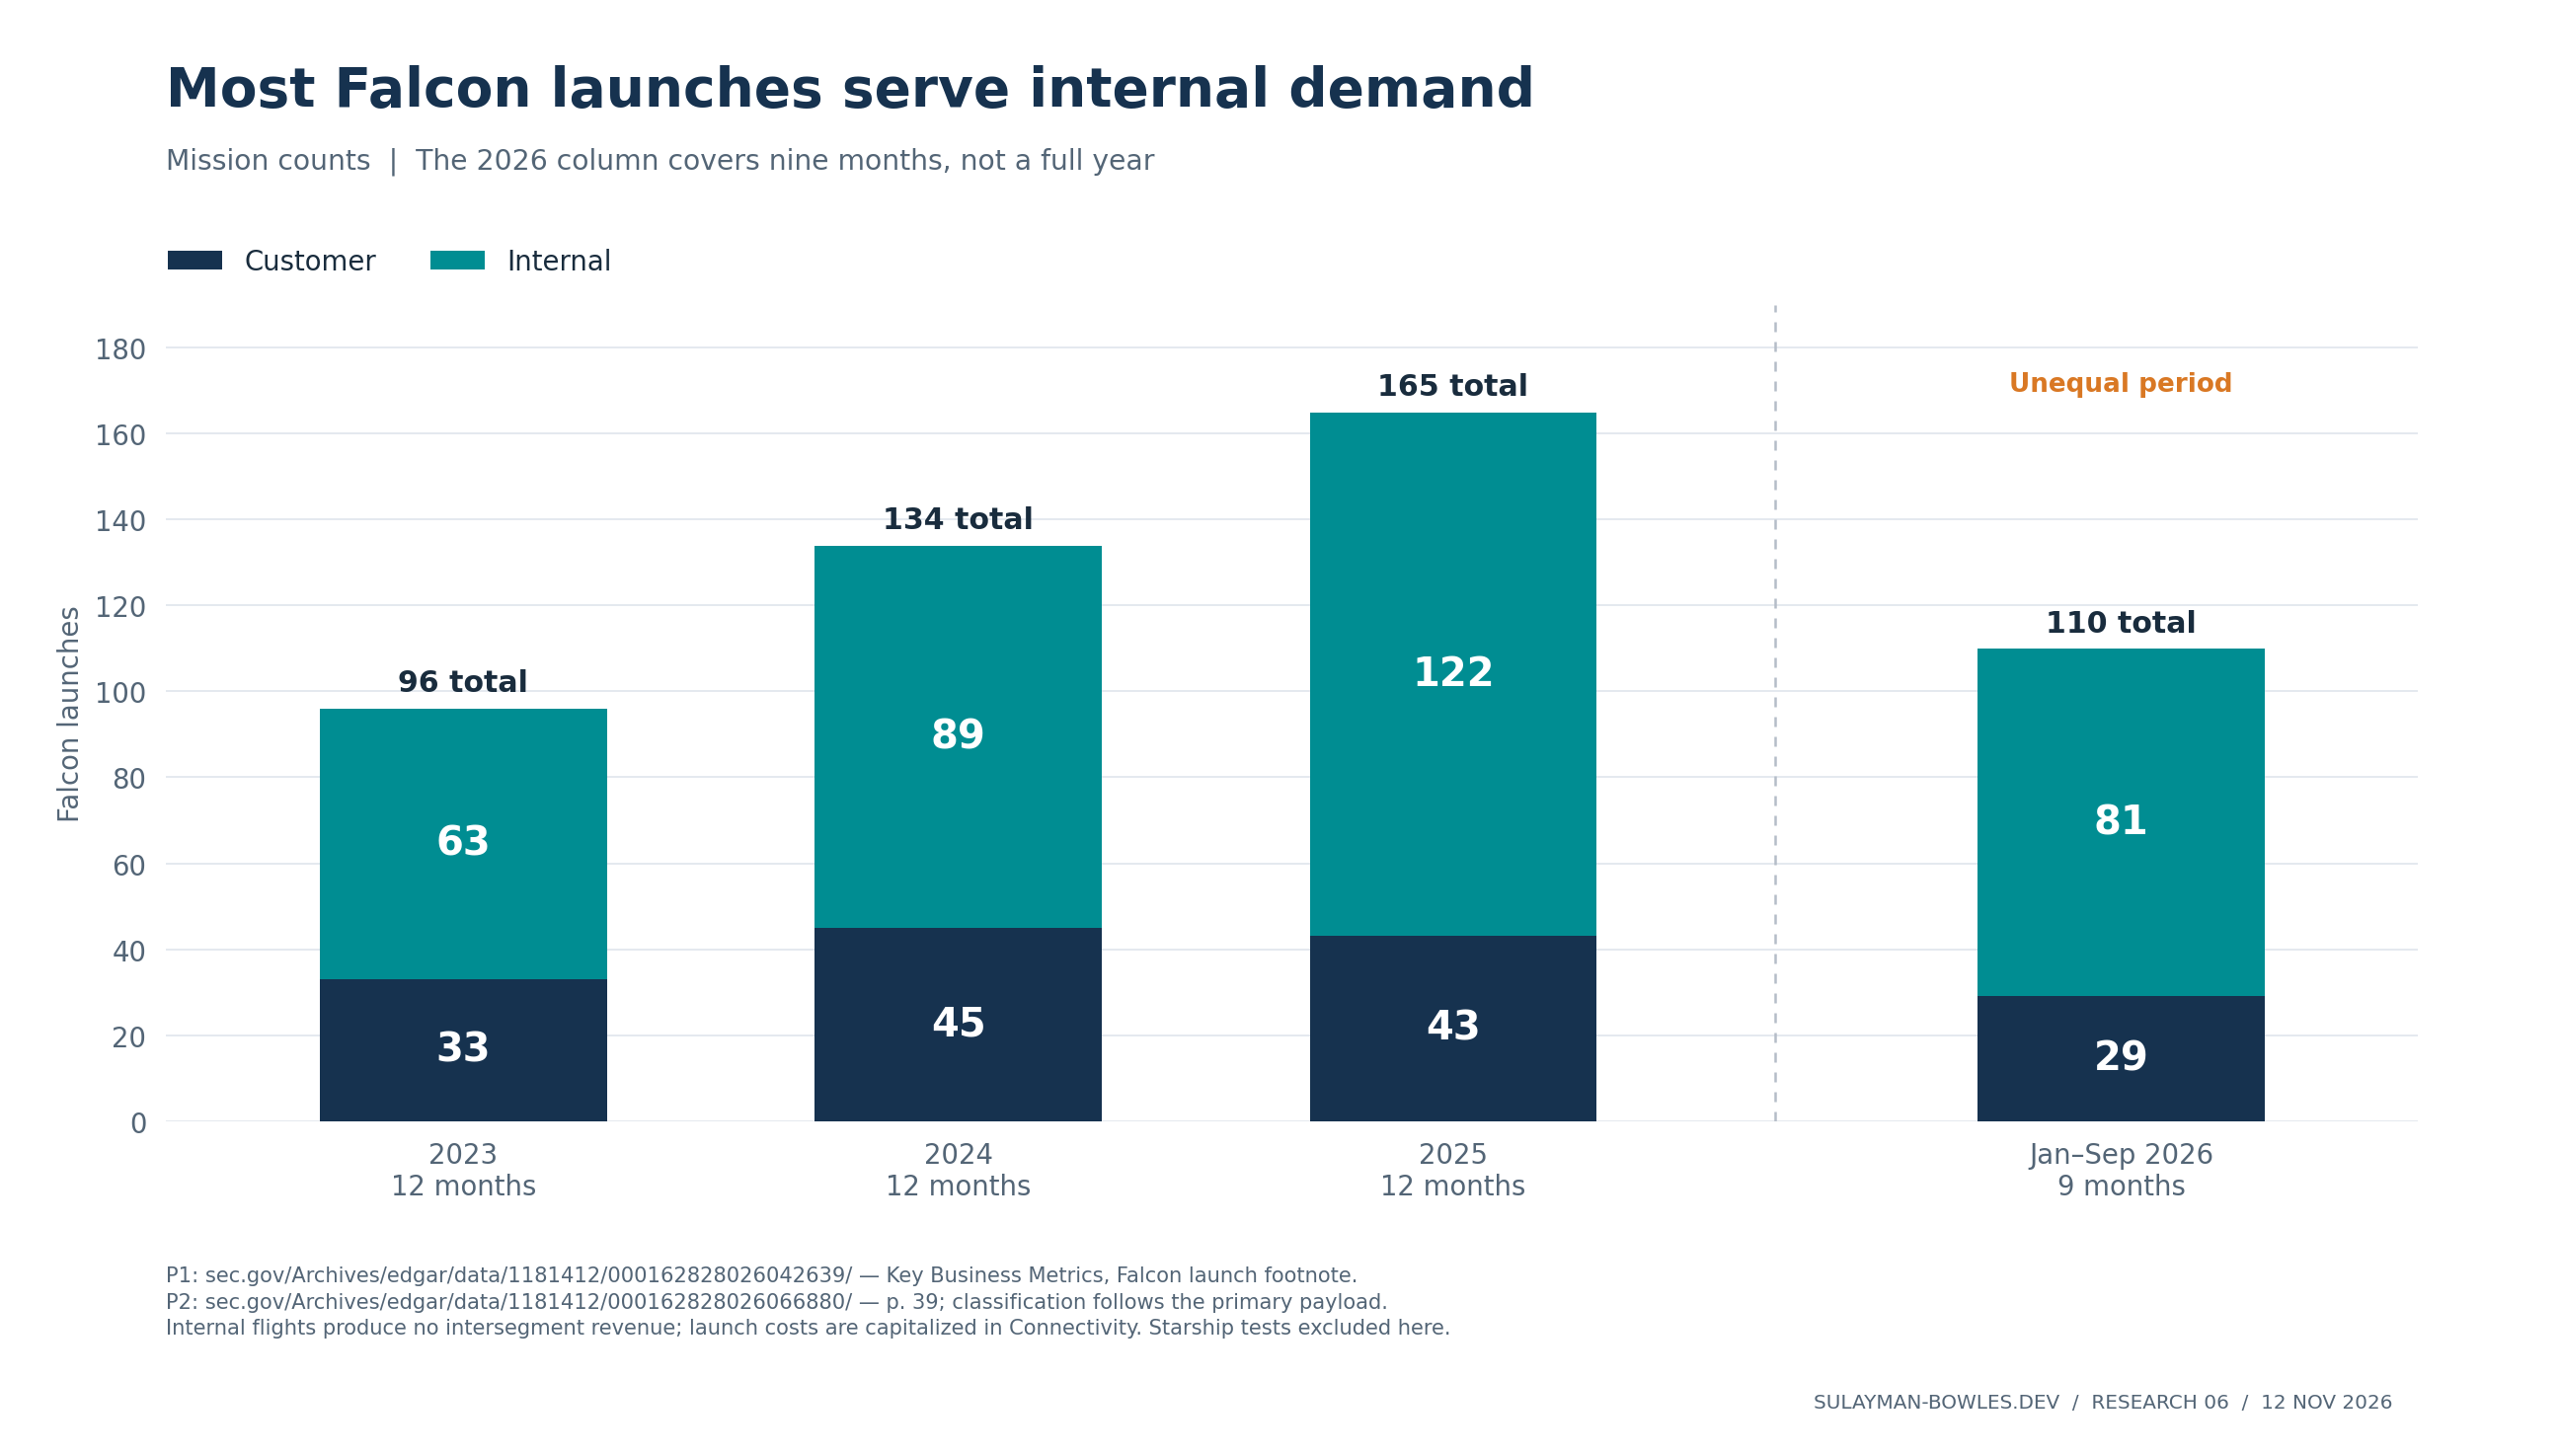
Figure 4. Internal deployment dominates flight counts. The 2026 column covers nine months and is not directly an annual cadence comparison. NASA independently corroborates the 2024 and 2025 total counts.13
The accounting treatment is consequential. Internal launches produce no intersegment revenue. Their incremental mission costs and allocated vehicle depreciation are capitalized into Connectivity’s satellite assets. Charging an imagined retail launch price to Starlink and recognizing that as outside launch profit creates value only on paper unless the internal transaction is eliminated.1, 18
For analysis, the model uses an assumed $22.5 million internal mission resource cost in 2026, with a $15–30 million judgment range. Current fully allocated Falcon cost is unknown. At 122 missions, a genuine $5 million cost difference changes annual resource use by $610 million. Changing only an accounting markup does not change consolidated cash flow.m
Public awards provide better price checks than a single list price
| Award | Published amount | What the amount covers |
|---|---|---|
| NASA NEO Surveyor, February 2025 | About $100m | Falcon 9 launch and related services |
| NASA Dragonfly, November 2024 | $256.6m | Falcon Heavy launch and related costs |
| Three additional NASA crew missions, September 2026 | $946m | Dragon missions and associated operations; $315.3m per mission arithmetically |
| SSC sensing/targeting order, July 2026 | $1.6bn for 18 launches | Bundled order; about $88.9m per flight arithmetically |
Award values are not revenue for the announcement year. Crew missions are not comparable to a bare Falcon launch.14, 15, 16
USASpending supplies another check on scope and funding. The HLS award showed $3.229 billion obligated, $4.404 billion current/exercised value, and $5.849 billion potential value, with an October 2026 modification. A selected NROL-86 launch order showed $153.946 million obligated. These figures document commitments and funded work. Recognized profit remains unreported here.17
One public-data discrepancy should remain unresolved and excluded from backlog. SSC’s NSSL Phase 3 Lane 2 announcement anticipated approximately $5.924 billion for 28 SpaceX missions; the USASpending umbrella record showed an $11.847 billion potential ceiling and zero direct umbrella obligations. The reviewed evidence does not explain the difference. The model uses neither ceiling as annual revenue and never sums parent agreements and child orders as if they were independent contracts.16, 17
The base core forecast uses 55 external customer missions at $75 million in 2030, rising to 65 at $75 million in 2035, plus $2.8 billion and $4.0 billion of existing-type launch/development services. Contract renewals and replacement awards are required; the model is not a run-off schedule of funded backlog.m
Starship must earn its continuing investment
The model also adds external Starship revenue beyond the existing development baseline: $3 billion in 2030 and $15 billion in 2035 in the base case. These are substantial commercial assumptions. At an illustrative $100 million of revenue per mission, $15 billion represents 150 mission-equivalents; it shows the scale of the assumed missions. Actual pricing and the manifest remain unknown.
The base case still spends $3 billion each on Starship R&D and capital expenditure in 2030, declining to $2 billion each in 2035. Internal satellite launches do not create extra revenue here. Dedicated development spending remains in Space even when Connectivity benefits from cheaper deployment.
The resulting −$9.4 billion incremental Starship DCF describes that specified spending and revenue path. It does not prove that the right to stop, delay or redesign the program has negative value. Equally, removing Starship costs while keeping its deployment benefits and associated development revenue would overstate the combined businesses. The full $18.7 billion Space value is the more meaningful integrated result.m
6. Five-year satellites mean permanent capital expenditure
The five-year premise is supported by the registration statement: broadband satellites have a five-year accounting life, while first-generation mobile satellites have three years. The SEC comment response explains the engineering and replacement rationale. An FCC deadline to dispose of a satellite after its service ends is a different concept.1, 18
Independent orbital data provide a physical cross-check. Jonathan McDowell’s 9 November catalog listed 11,204 satellites in orbit, 11,190 working, and 9,704 in operational orbit, from 13,096 launched. Those categories are not interchangeable. Satellites ascending or moving between orbits may still provide service; an operational-orbit count should not be treated as the only revenue-producing fleet.19
The issuer also changed its in-orbit reporting definition to include satellites approved for deorbit; the earlier convention would have excluded approximately 400 at September-end. A larger reported count can therefore reflect both deployment and measurement changes.3
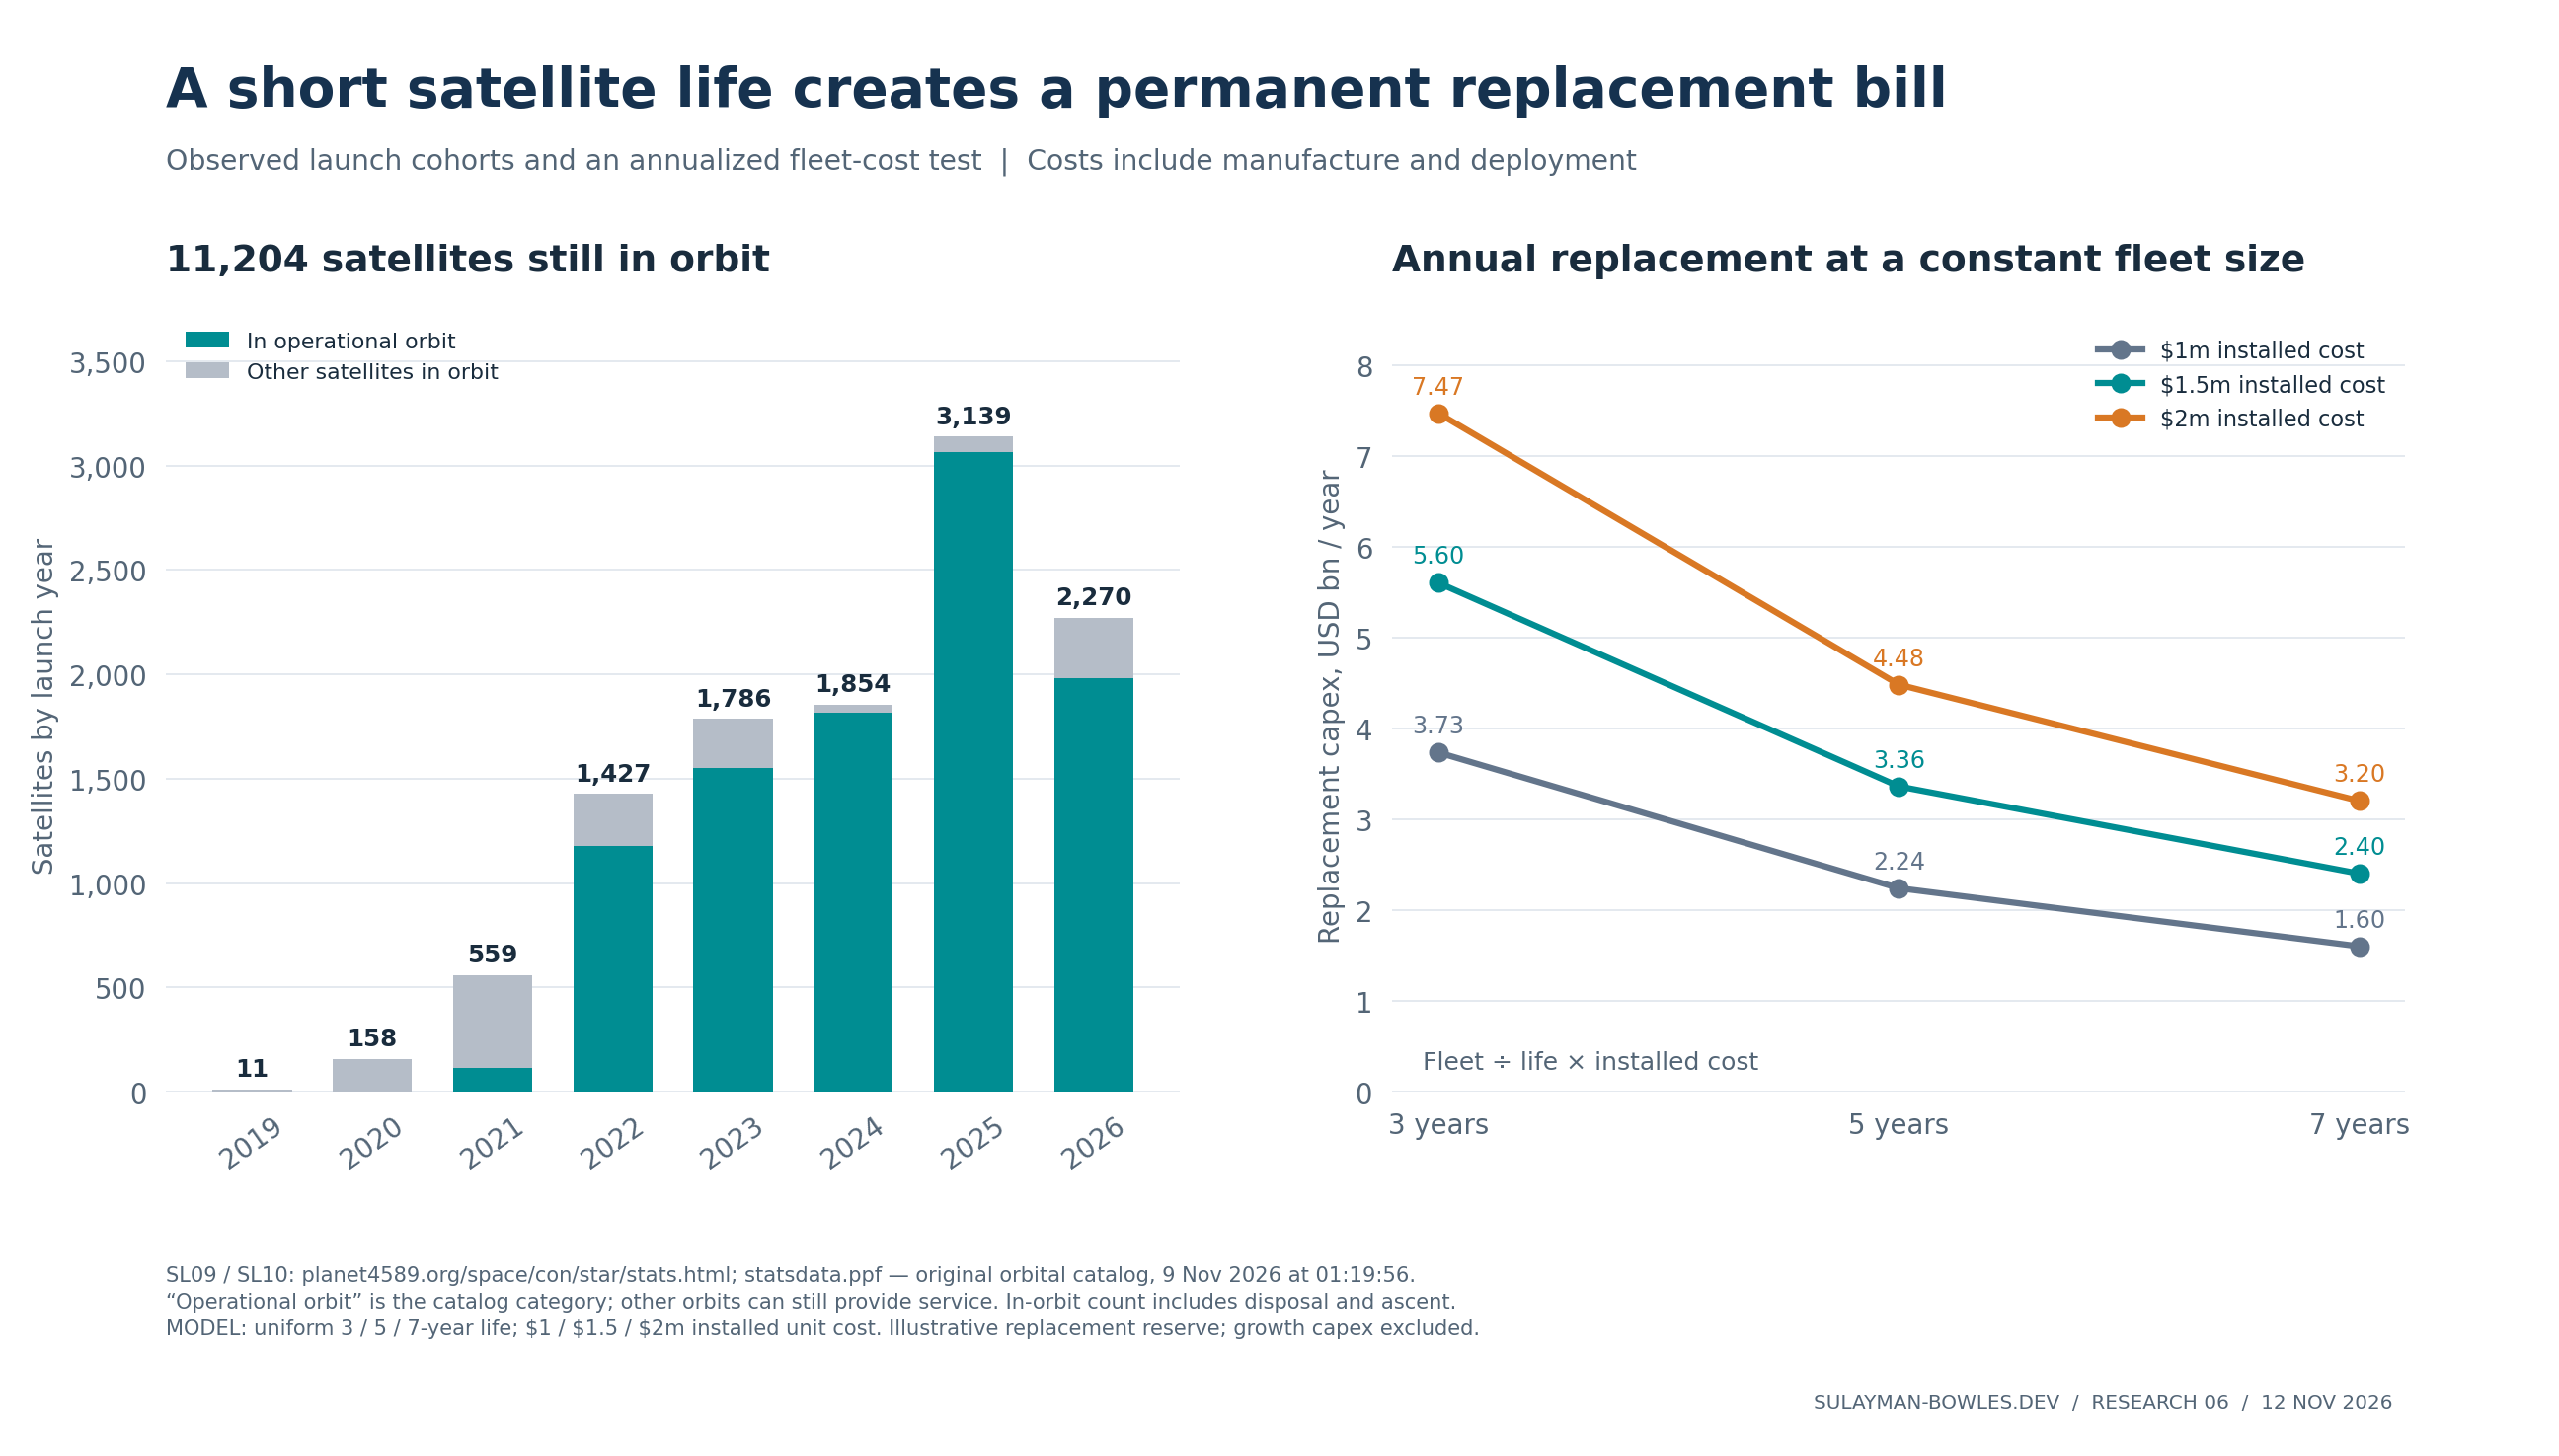
Figure 5. Approximately 65% of the satellites in orbit in the catalog were launched during 2024–2026. The matrix estimates replacement spending in steady state. Individual satellite retirement dates may be uneven.19, m
A compact replacement equation is:
Annual replacement spending = fleet ÷ economic life × fully deployed replacement cost.
For 11,204 satellites, a five-year life and assumed $1–2 million fully deployed cost imply $2.241–4.482 billion annually merely to sustain that fleet. Expansion, ground systems and spectrum come on top. The next-year cash schedule can differ because the fleet is young and launches occur in cohorts.
Gross satellite property of $14.738 billion divided by 11,204 satellites gives approximately $1.315 million per in-orbit satellite. That is a rough historical installed-asset cross-check with mismatched dates and mixed generations. It is not a current manufacturing quote.2, 19, m
The forecast therefore models manufacturing and launch as distinct items. In the 2035 base case, a broadband satellite costs $1.1 million to manufacture, plus $40 million per internal mission divided among 60 satellites, or $1.767 million fully deployed. All three cost/loading inputs are estimates. The first orbital Starship deployment carried 26 V3 satellites; 60 remains a target for routine loading.3, m
Lower cost per gigabit does not necessarily mean lower cost per spacecraft. Larger satellites can be more expensive individually while delivering much more capacity. Applying a claimed V3 cost-per-capacity reduction directly to the old satellite manufacturing price would confuse two different denominators.1
The base fleet reaches 24,000 broadband and 8,000 mobile satellites in 2035. The mobile model assumes a three-year replacement life for future generations; their economic lives are unknown. The terminal-year cash calculation permanently keeps:
| Annual terminal requirement, base case | Amount |
|---|---|
| Broadband replacement | $8.480bn |
| Mobile replacement | $6.667bn |
| Additional orbital investment for 3% growth | $1.872bn |
| Ground investment | $2.369bn |
This is the steady terminal calculation. The explicit 2035 forecast uses opening-fleet replacement and therefore has a different replacement total.m
Regulatory permission remains a condition of expansion. FCC disclosures describe 15,000 authorized Gen2 satellites after the January action and an October mobile authorization. They do not grant unrestricted permission for every future fleet in this report. Detailed conditions in inaccessible order text are not inferred; the base and high long-run broadband scenarios require further approvals.20
Spectrum is another capital bill
EchoStar’s counterpart filing confirms the spectrum transaction and trust structure. The model includes $8.5 billion acquisition cash plus $828 million interim support in 2027, and discounts the estimated $385 million remaining 2026 support on its own line. Existing payments are not charged again. Final acquisition was targeted for November 2027.2, 6
The model assumes about 261.8 million future shares, subject to closing and adjustments. At the current price these represent an illustrative $36.587 billion of dilution; they are not a cash expense. The reverse valuation includes that future share claim, while the operating DCF already includes the future cash consideration.2, 6, m
Grain’s October agreement adds another spectrum portfolio, but its price is undisclosed. The model excludes that unknown purchase cost and unquantified additional terrestrial buildout. This omission biases value upward if material spending is required. A disclosed cash schedule would be deducted at present value, outside the generic operating margin.7, m
7. DCF results, peer checks and sensitivities
The valuation discounts unlevered cash flow: operating cash earnings after economic compensation, tax, working capital, terminals, satellite deployment, ground investment and specified spectrum payments. Full-year 2026 is a calibration forecast; operating cash flows from 2027–2035 are discounted to the November 11 close using a 50-day year-end stub. Residual 2026 operating cash flow is omitted, with the estimated remaining 2026 spectrum payment, based on the September disclosure, outside the operating valuation.m
This choice is transparent but not perfectly precise. Segment cash for the remaining weeks is not disclosed. The model also uses normalized replacement-cost depreciation. A tax-book cohort schedule would require asset-level records. It assigns no added value to tax-loss carryforwards and no cross-segment loss offset.
| Decisive assumption/output | Low | Base | High |
|---|---|---|---|
| Consumer lines, 2030 year end | 25m | 40m | 65m |
| Consumer lines, 2035 year end | 35m | 70m | 130m |
| Consumer ARPU/month, 2035 | $42.78 | $54.51 | $69.90 |
| Connectivity revenue, 2035 | $31.754bn | $85.967bn | $197.953bn |
| Connectivity operating income, 2035 | $6.244bn | $41.348bn | $127.560bn |
| Connectivity free cash flow, 2035 | $3.350bn | $27.270bn | $89.999bn |
| Broadband / mobile fleet, 2035 | 16,000 / 800 | 24,000 / 8,000 | 45,000 / 15,000 |
| Broadband deployed unit cost, 2035 | $2.900m | $1.767m | $1.133m |
| Discount rate / terminal growth | 12% / 2% | 10% / 3% | 9% / 3.5% |
| Connectivity enterprise value | $21.1bn | $244.9bn | $1,016.0bn |
| Core launch and existing development | $6.3bn | $28.1bn | $84.7bn |
| Space including Starship strategy | −$43.1bn | $18.7bn | $214.5bn |
| Combined modeled space activities | −$22.0bn | $263.6bn | $1,230.5bn |
Analyst scenarios. The negative low-case result applies to the Space operations under continued spending. Group equity value also reflects the other businesses. No value is assigned to an abandonment or restructuring option.m
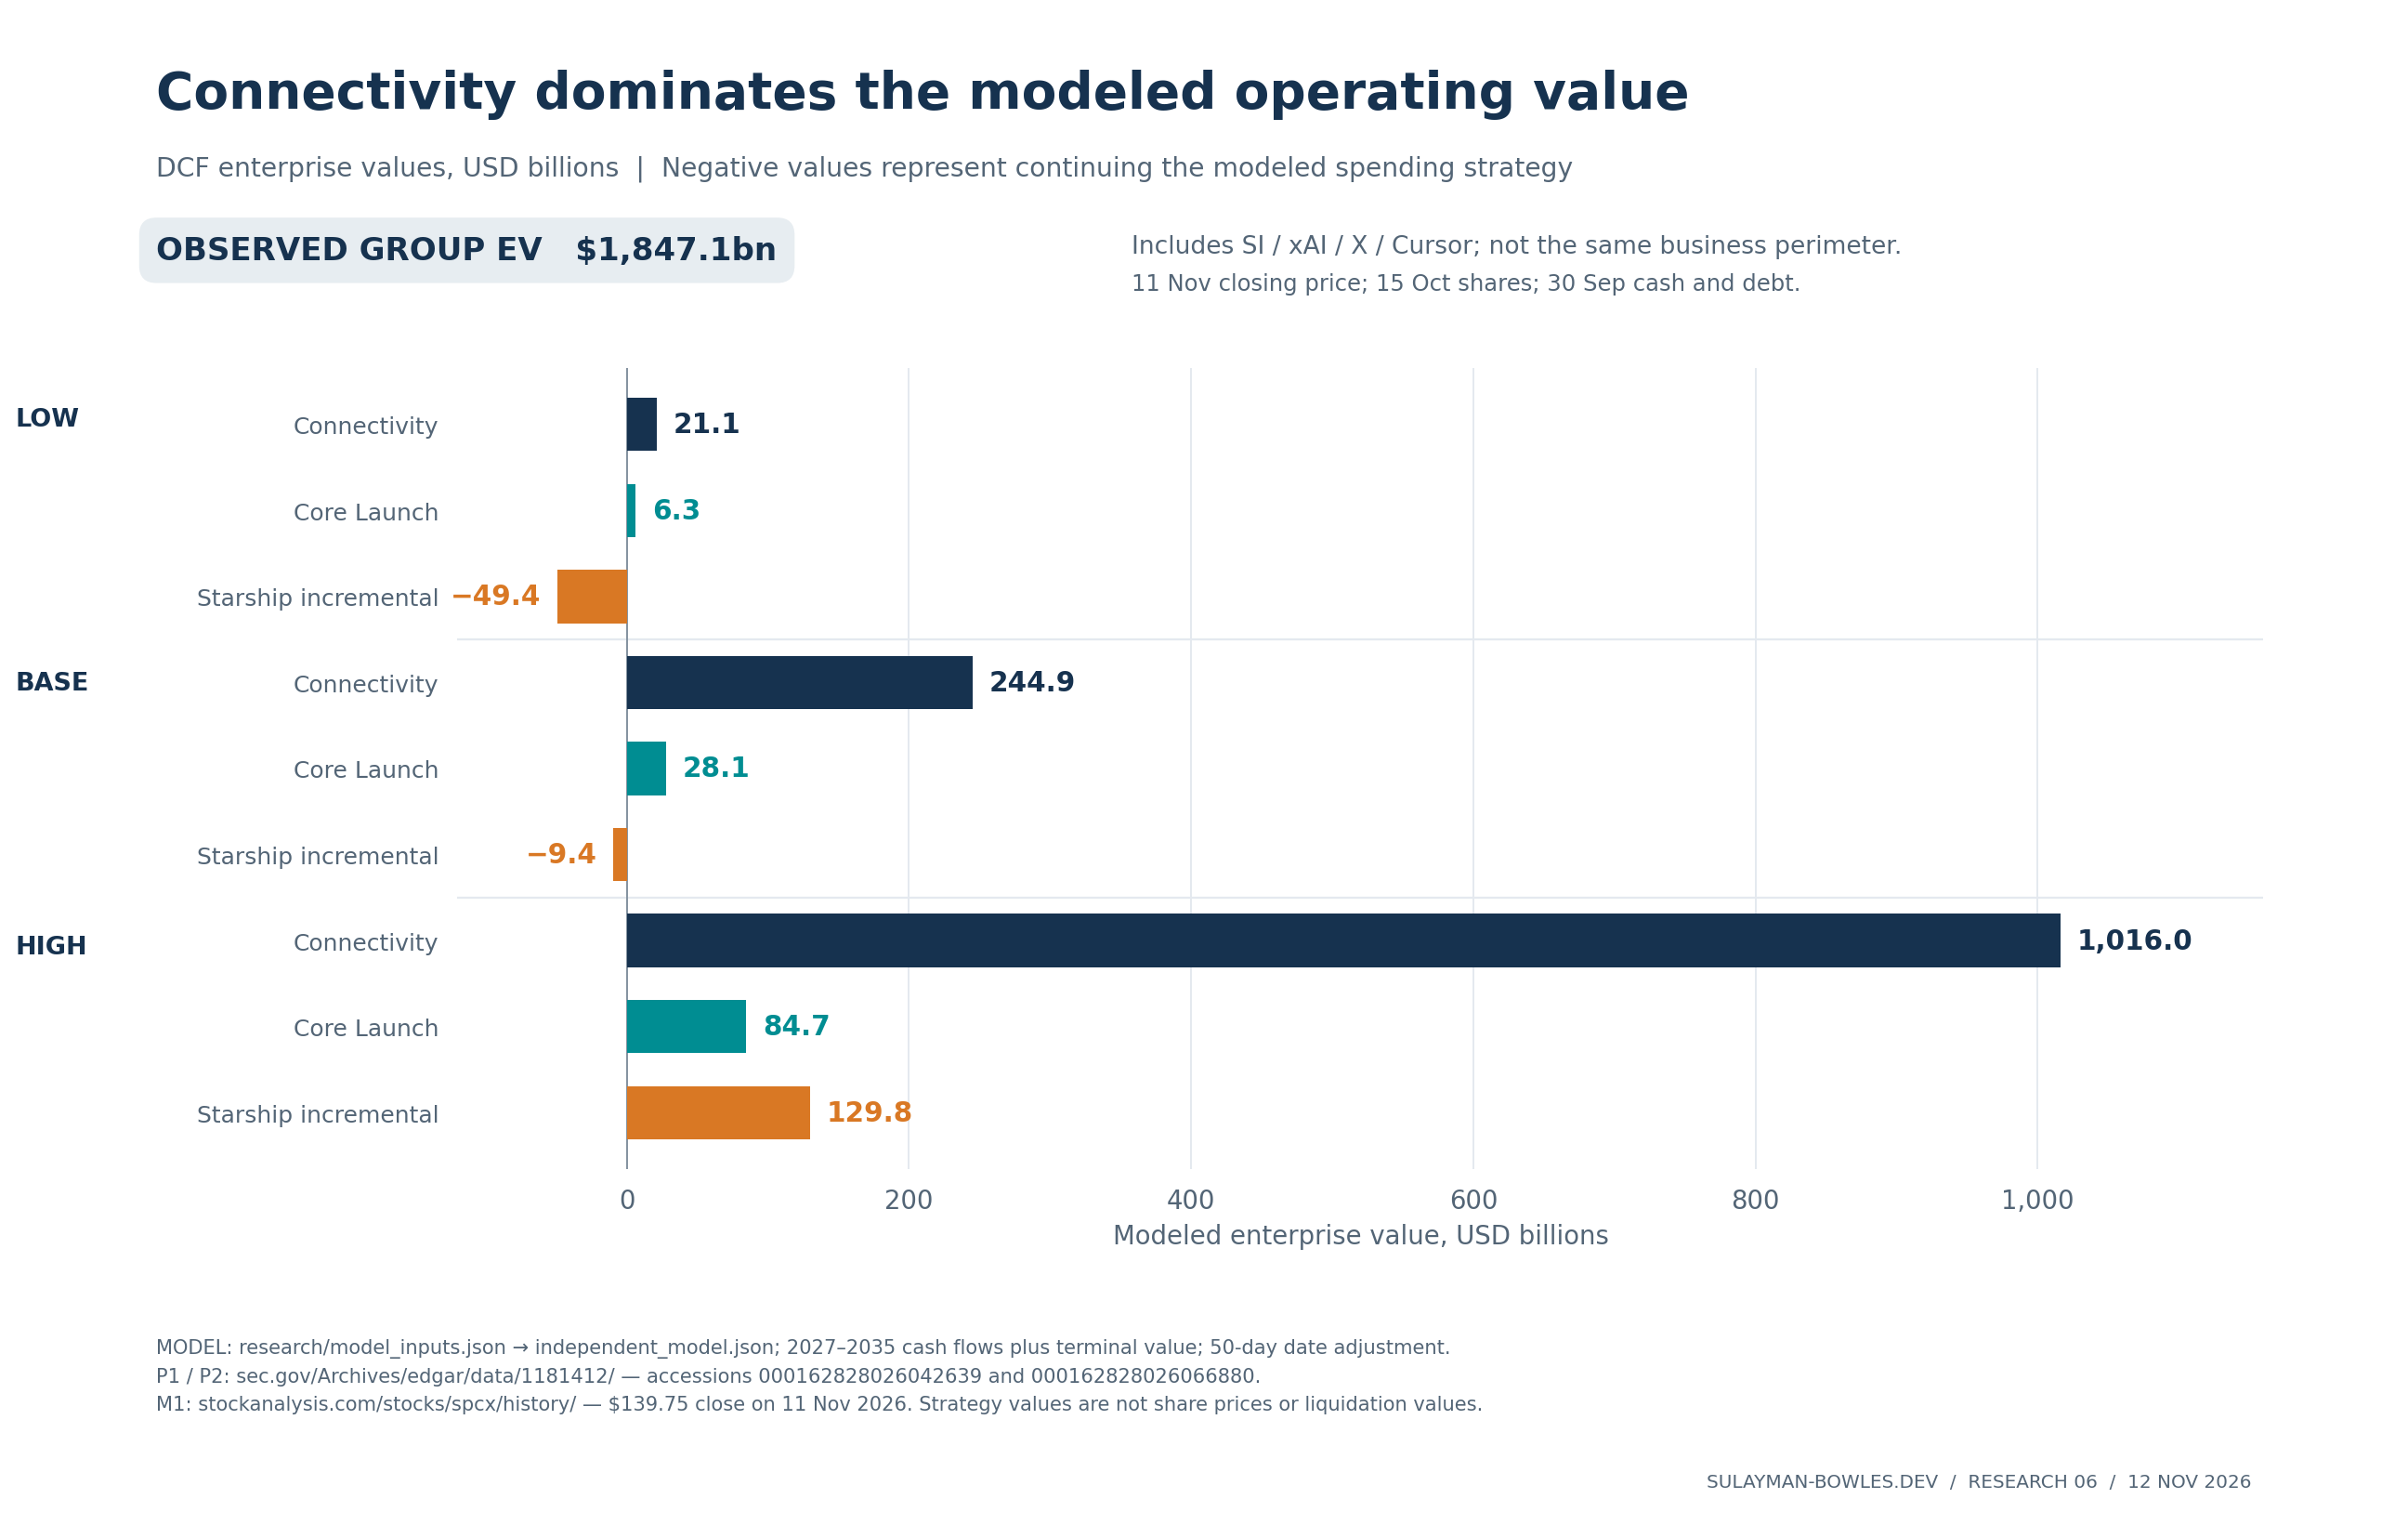
Figure 6. The spread reflects changes in subscribers, prices, capital efficiency, program spending and discount rates together. It is not a statistical confidence interval.
The high case demands more than rapid customer growth. It requires strong realized pricing, very low deployment cost, substantial mobile monetization and a 2035 Connectivity operating margin of approximately 64.4%. The base margin is 48.1%. These outcomes require the stated cost and revenue conditions to hold at scale.m
Terminal value is the principal valuation risk. In the base case, explicit Connectivity cash flows contribute $65.621 billion of present value and the terminal business contributes $179.678 billion, less $0.380 billion of remaining spectrum-support present value. Approximately 73% of value comes after 2035. Replacement, growth investment and recurring compensation remain charged in that terminal period.m
Public peers provide checks with different limitations
| Peer | Enterprise-value proxy | EV / trailing revenue | Profit multiple and denominator |
|---|---|---|---|
| T-Mobile | $260.4bn | 2.78× | 7.07× Core Adjusted EBITDA |
| Viasat | $15.3bn | 3.27× | 10.12× Adjusted EBITDA |
| Iridium | $7.1bn | 7.82× | 14.52× Operational EBITDA |
| Lockheed Martin | $155.5bn | 1.96× | 16.69× GAAP operating profit |
| Rocket Lab | $39.8bn | 45.15× | Not meaningful: loss |
Prices at 11 November close; latest disclosed shares and balances; trailing financials reconstructed from filings. Debt and profit definitions differ.21
T-Mobile illustrates mature telecom economics, Viasat and Iridium satellite economics, Lockheed contracted defense earnings, and Rocket Lab the market price of a growing space business. Each comparison reflects the economics of its own business. Rocket Lab also has a space-systems business. Its roughly 45× sales multiple cannot show a floor for profitable launch operations.
Rocket Lab’s pending acquisition of Iridium further complicates both quotes. Their prices reflect transaction expectations while the financial table remains standalone. The deal had been announced and remained open at the cutoff.22
Applying the three telecom/satellite profit multiples to modeled 2030 Connectivity EBITDA of $33.923 billion, discounting the exit and adding interim cash flows, yields $173.5 billion using T-Mobile, $243.2 billion using Viasat, and $343.9 billion using Iridium. The $244.9 billion DCF sits near the Viasat check.m
This valuation method uses the same subscriber assumptions. Subscriber growth remains uncertain. Definitions are imperfect: peer adjusted earnings treat compensation and other costs differently. Adding T-Mobile’s identified finance leases and tower financing raises its multiple from 7.07× to approximately 7.22×, illustrating the effect of financing conventions.
For core launch and existing development, applying Lockheed’s 16.69× operating-profit multiple to modeled 2030 EBIT, then discounting and adding interim cash, gives $38.3 billion, compared with the $28.1 billion DCF. Neither is a quote for a separable Falcon company. The Space total still carries Starship investment and shared operating dependencies.m
What the sensitivity tests change
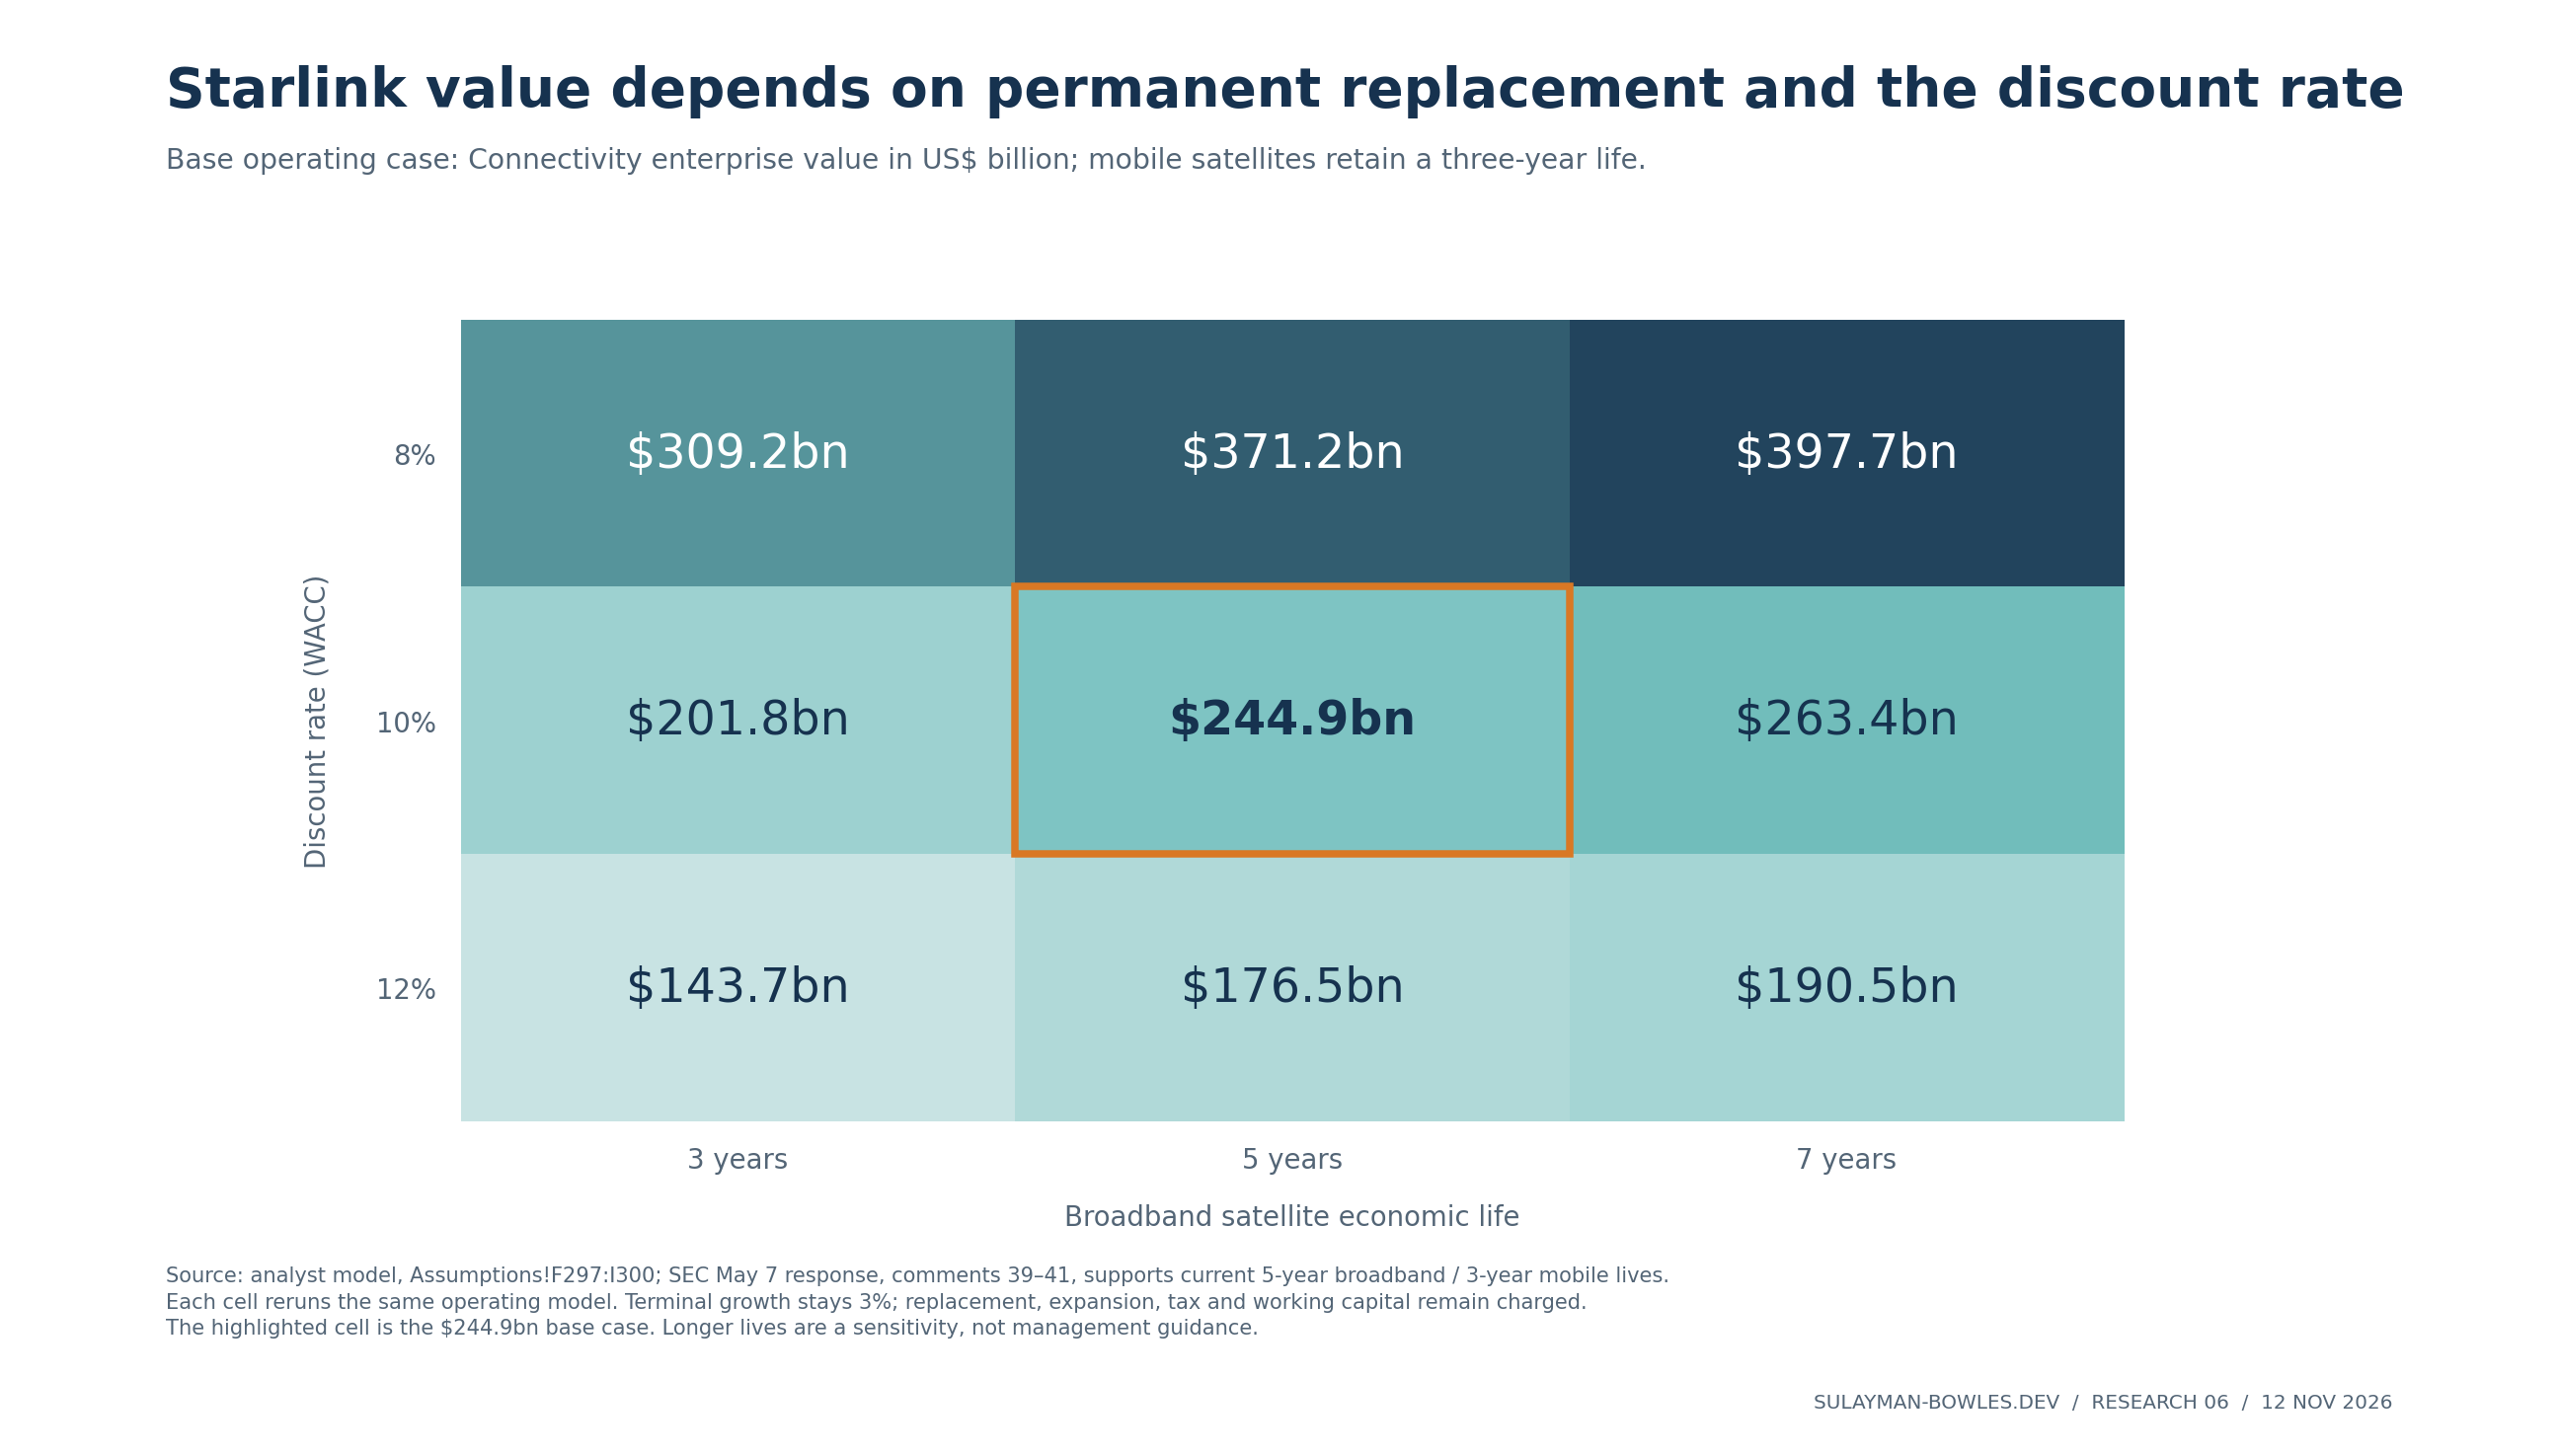
Figure 7. The same operating model is recalculated for each discount rate and broadband life. Mobile life remains three years; terminal growth remains 3%.
At a 10% discount rate, moving broadband life from five to three years reduces Connectivity value from $244.9 billion to $201.8 billion. Seven years raises it to $263.4 billion. With a five-year life, an 8% discount rate produces $371.2 billion, while 12% produces $176.5 billion.m
Launch loading is another material variable. Holding base costs and other assumptions fixed, a constant 26 satellites per internal mission produces $203.2 billion of Connectivity value; 40 produces $230.1 billion, and 60 produces $246.8 billion. The normal base path ramps from 28 to 60, explaining why its value differs slightly from the constant-60 sensitivity.
For Space, reducing the Starship R&D/capex path by 20%, with revenue unchanged, raises value to $29.6 billion; raising spending by 20% lowers it to $7.7 billion. The sensitivity reduces spending while holding technical progress fixed.m
8. What the current valuation requires in 2030 or 2035
There is no unique subscriber count implied by SPCX’s price because the value of Superintelligence is unknown. The reverse model must show that allocation explicitly. Any assigned AI value must itself account for its future funding requirements.
Start with $1,847.088 billion current group EV, add $36.587 billion illustrative future EchoStar shares, subtract $18.689 billion Space value, then subtract an assumed current enterprise value for Superintelligence. The resulting Connectivity hurdle is supported by base interim cash flows and a terminal cash stream beginning after the selected target year. Future spectrum cash is already inside the forecast and is not added again.m
The reverse model keeps base non-consumer service revenue, assumes hardware breaks even, and varies the cash margin on service revenue after tax, replacement, working capital and continuing investment. It uses $61.01 monthly consumer ARPU in 2030 and $54.51 in 2035.
| Assumed current Superintelligence EV | Consumer-line equivalents at the 2030 valuation date, 30% cash margin | Consumer-line equivalents at the 2035 valuation date, 30% cash margin |
|---|---|---|
| $0 | 821m | 1,429m |
| $500bn | 591m | 1,016m |
| $1,000bn | 362m | 602m |
| Base operating forecast, for comparison | 35.7m | 66.3m |
Conditional terminal run rates. Target-year average sales and feasible satellite capacity can differ.m
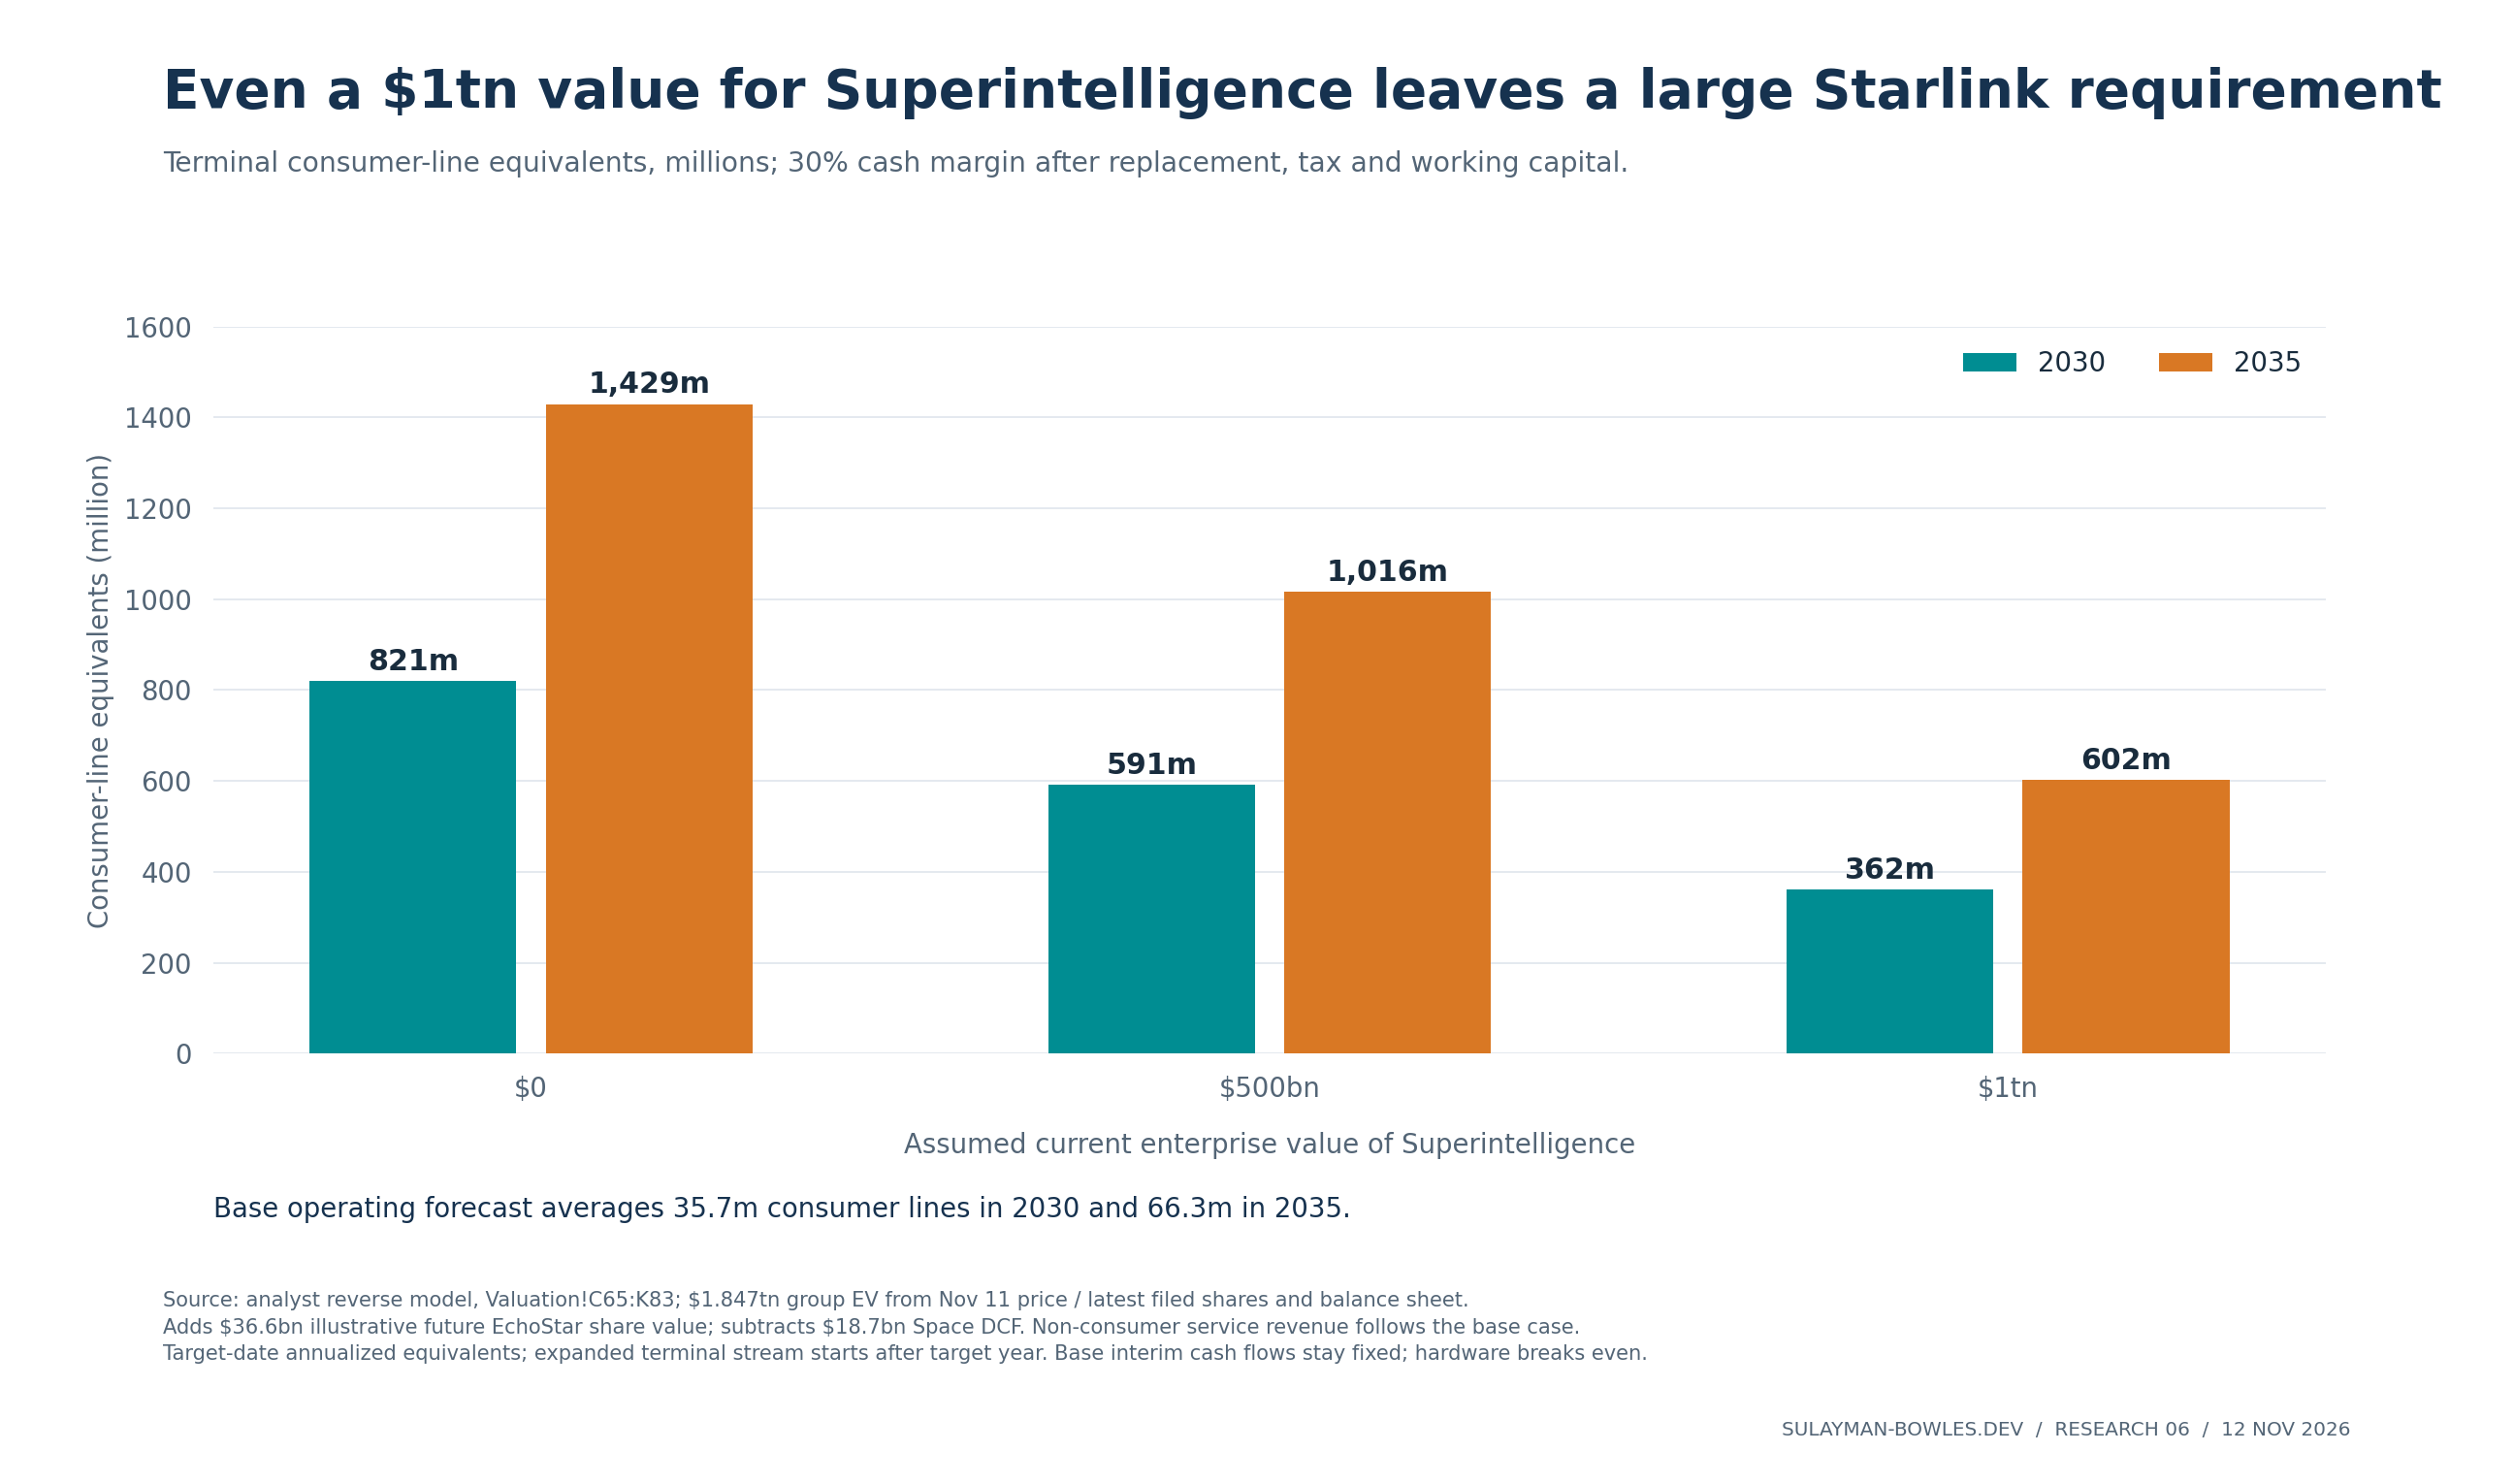
Figure 8. Assigning substantial value to the AI businesses reduces the Starlink burden but does not remove it under these assumptions. Later realization requires a larger cash stream because of discounting and the assumed lower ARPU.
Even with $1 trillion assigned to Superintelligence, the remaining hurdle requires an annualized cash-flow run rate of $86.0 billion at the 2030 valuation date, or $129.8 billion at the 2035 valuation date, supporting the cash stream after that date. At a 30% margin, that translates into the 362 million and 602 million consumer-line equivalents above.
The margin test is revealing. With the same $1 trillion AI allocation, a 40% cash margin lowers required lines to 264 million in 2030 or 437 million in 2035. A 20% margin raises them to 557 million or 933 million. A 40% cash margin must survive permanent replacement spending; it cannot be substituted with an EBITDA margin.m
These are deliberately conditional calculations. The required counts describe the annualized revenue base supporting the post-target terminal stream. They hold the base interim cash-flow path fixed without introducing a second accelerated adoption trajectory. A faster build could generate more interim revenue, but would also require more terminals, spacecraft and capacity. Nor are the lines unique people: the model’s definition remains consumer service subscriptions, excluding mobile paid equivalents.
The economic reading is therefore precise. Current group value cannot be justified by extrapolating today’s residential ARPU across a modestly larger constellation alone. It requires a substantial contribution from the AI group, much greater space-business earnings than the base case, or some combination. The high space scenario reaches $1.230 trillion, still approximately $617 billion below current group EV before treating future spectrum dilution consistently.m
9. Evidence that would change the conclusion
The investment question is whether revenue can grow faster than the recurring cost of acquiring customers, supplying capacity and renewing the network. The following evidence would change the model directly:
| Evidence | Upward implication | Downward implication |
|---|---|---|
| Regional service revenue and average lines | Better retention and realized ARPU than assumed | Growth concentrated in lower-yield areas; greater discounting |
| Terminal cost, net proceeds and churn | Smaller subsidy with durable customer lives | Subsidy or replacement demand stays high |
| Airline and maritime contracted revenue | Pricing and installed-unit growth validate the vertical model | Announced equipment fails to become high-value recurring service |
| Starshield program margin and cash conversion | Profitable contracted work with manageable working capital | Milestone revenue requires larger delivery spending or cash advances reverse |
| V3 cost, usable capacity, loading and observed life | More capacity per dollar and reliable high launch loading | Shorter lives, fewer satellites per flight or slower commissioning |
| Mobile wholesale receipts and paid equivalents | Revenue covers the dedicated replacement fleet and spectrum | Capable phones produce little attributable wholesale revenue |
| Starship external contracts and capital budgets | Revenue arrives while development intensity declines | Spending remains high without corresponding outside sales |
| Spectrum closing cash and required buildout | Costs fall within the modeled schedule | Grain consideration or other infrastructure adds a material cash bill |
| AI funding and operating evidence | A substantiated value explains more of the market residual | Funding needs or dilution consume more of the group claim |
Each of the three central valuation figures has a cross-check. $244.9 billion Connectivity value is independently recomputed and checked against telecom/satellite exit multiples. $18.7 billion Space value is independently recomputed, with a defense-multiple check on its core component. $1.847 trillion current group EV is reconstructed from filed shares and balances, with a dated market-cap check. None of those checks transforms an estimate of future earnings into a fact.
The documented conclusion is that Starlink already earns substantial operating profit, while its durable cash earnings remain sensitive to replacement and expansion. Launch is an important integrated capability with a smaller direct financial value in the base case. The present stock price requires a much broader success story than those two activities alone support.
Model and evidence notes
The workbook organizes Inputs/Actuals/Evidence, Assumptions, operating formulas, Valuation/Peers, and Summary/Checks. The active case is selected in Assumptions!E4; broadband life, Starship spending, payload loading and discount-rate adjustments are independently editable. Scenario tables rerun that same model. Blue values are inputs; forecast inputs are estimates even where calibrated to reported history.
Historical figures are tied to filed segment tables. Full-year and interim periods each have their own entries. Terminal replacements, ground spending, compensation and working capital continue after 2035. Forecasts are in nominal dollars. No additional spectrum asset value is added when its earning power is already inside Connectivity cash flow. The supplied CSVs preserve exact values and source locators; charts use those model outputs instead of manually entered rounded numbers.
Footnotes and free primary documents
- Space Exploration Technologies Corp., final IPO prospectus, Form 424B4, dated 11 June and filed 12 June 2026. Note 1, pp. F-11–F-12: combinations/common control; Note 2, pp. F-14–F-15: satellite lives and internal launch capitalization; Note 3, p. F-23: revenue categories; Note 19, pp. F-58–F-59: segment reconciliation; MD&A, “Key Business Metrics” and segment results; Business p. 190: terminal cost; V3 cost-per-capacity discussion. Exact historical inputs are reproduced in the workbook and historical CSV. ↩
- SpaceX, Form 10-Q for 30 September 2026, filed 22 October 2026. Cover: 15 October shares; balance sheet p. 4: cash/securities; Note 3, pp. 12–13: revenue; Note 5, p. 14: satellite PP&E; Note 6, pp. 15–16: spectrum; Note 9, p. 17: debt/finance leases; Note 18, pp. 32–34: current-quarter/current-nine-month/prior-nine-month segments; acquisition note; MD&A “Key Business Metrics,” Space and Connectivity results, and Tesla discussion. Interim values are unaudited company disclosures. ↩
- SpaceX, Q3 2026 earnings release, Exhibit 99.1, 20 October 2026, Space/Connectivity discussion and operating metrics; aircraft discussion p. 5; satellite definition, note 2, p. 8. Company disclosure. ↩
- StockAnalysis SPCX historical prices, 11 November 2026 closing row; Yahoo Finance historical prices, same date; Wall Street Numbers market-cap history, dated 11 November row. Retrieved 12 November. Market-data checks; shares and balance-sheet inputs remain SEC-sourced. ↩
- SpaceX, Form 8-K, 26 October 2026, Item 8.01; Apollo counterparty announcement, same date. Binding commitment dated 24 October; future finance-lease delivery/closing conditions. ↩
- EchoStar, September 2026 Form 10-Q, filed 3 November 2026, Note 1, pp. 7–9 and MD&A pp. 83–85. Counterparty evidence for spectrum, trust transfer, final closing target and support schedule; cross-checked against SpaceX Note 6. The different reported interim paid/received balances are not assumed reconciled. ↩
- Grain Management, definitive agreement to sell nationwide 800MHz portfolio to SpaceX, 8 October 2026, opening transaction description and closing conditions. Purchase price undisclosed. ↩
- ACCC, CommsDay Summit address, 2 June 2026, “Low earth orbit satellites — opportunity and challenge.” Independent regulator figures for Australian subscriptions, June and December 2025. ↩
- Starlink official US service plans, UK plans, Australian plans, Brazil residential, and Philippines residential. Indexed official price tables retrieved 12 November 2026; some direct page views require JavaScript. The raw price CSV preserves native currency, plan and retrieval date. ↩
- Starlink, Business Aviation Plans, price table effective from 7 July 2026, retrieved 12 November. Published business-aviation tiers; negotiated commercial-airline rates unknown. ↩
- Starlink, business service plans, Global Priority table, retrieved 12 November 2026. Data allowances and monthly prices; fleet realization unknown. ↩
- Starlink, 2025 progress report, pp. 29, 33–34, year-end 2025; exact upload date unknown. United, Q3 2026 release, 20 October 2026, p. 1, installed aircraft described as “now.” Qatar Airways, 150 equipped aircraft announcement, 20 August 2026, headline/opening paragraphs. ↩
- NASA Aerospace Safety Advisory Panel, 2025 annual report, cover letter 15 February 2026, printed p. 23 / PDF p. 33. Confirms 134 Falcon launches in 2024 and 165 in 2025; does not independently verify segment revenue or customer/internal classification. ↩
- NASA, three additional crew flights award, 18 September 2026, contract value and mission-services paragraphs. ↩
- NASA, NEO Surveyor launch award, 21 February 2025; Dragonfly launch award, 25 November 2024. Contract-value paragraphs; includes related services. ↩
- Space Systems Command, NSSL Phase 3 Lane 2 award, 4 April 2025; GAO, GAO-25-107228, Table 3; SSC, 18-launch order, 29 July 2026. The last official release was available through indexed text; direct retrieval returned 403. ↩
- USASpending API, retrieved 12 November 2026: HLS award, fields
total_obligation,base_exercised_options,base_and_all_options; NSSL umbrella; NROL-86 order. The accompanying CSVs show the normalized award fields and modification dates. Obligations, outlays, ceilings and accounting revenue are different measures. ↩ - SpaceX, response to SEC comments, 7 May 2026, responses 39–41, pp. 22–24. Company explanation of useful lives, retirement rationale and capitalized internal-launch costs. Final prospectus Note 2 supplies the operative accounting policy. ↩
- Jonathan McDowell, Starlink Statistics, catalog timestamp 9 November 2026 01:19:56; summary and launch-status tables. Original independent orbital data. Cohort CSVs sum the in-orbit columns by launch year; orbital status is not a revenue audit. ↩
- FCC, Gen2 authorization release, 9 January 2026; mobile order DA 26-1078, 6 October 2026. Indexed primary disclosures; full technical orders were not accessible in this session. No undisclosed approval conditions are assumed satisfied. ↩
- Latest primary peer filings: T-Mobile September 10-Q, 28 October 2026; Viasat September 10-Q, 6 November; Iridium September 10-Q, 20 October; Lockheed September 10-Q, 22 October; Rocket Lab September 10-Q, 9 November. Cover shares, balance sheets and income statements; earnings releases supply non-GAAP reconciliations.
peer_inputs_long.csvandpeer_sources.csvidentify each denominator, prior-period source, publication date and page/table. ↩ - Rocket Lab, Iridium acquisition announcement, 29 June 2026; Iridium September 10-Q, merger discussion. Announced consideration and pending approvals; standalone historical multiples are transaction-affected. ↩
- SpaceX, IPO closing announcement, 15 June 2026, opening two paragraphs: trading began 12 June and the offering closed 15 June. Share count, offer price and net proceeds are taken from the SEC filings. ↩
- Author’s model, 12 November 2026,
spacex_starlink_model.xlsx. Historical reconstruction:Actuals; unit economics:Assumptions,Connectivity,Constellation,Space; DCF:Valuation!F40:F59; reverse valuation:Valuation!C65:K83; sensitivity tables:Assumptions!F279:I309; market/peer checks:Inputs,Peers, and the supplied independent-check CSV. All forecast and valuation numbers are estimates or conditional calculations.forecast_calculations.csvpreserves unrounded outputs; raw inputs, source registers and chart CSVs accompany the manuscript. ↩
Supporting material
- Excel model ↗Sourced inputs, live calculations and reported outputs.
- Source and model data (CSV collection) ↗Data tables, source references and calculation exports.