Financial systems
Texas Instruments and the price of filling its fabs
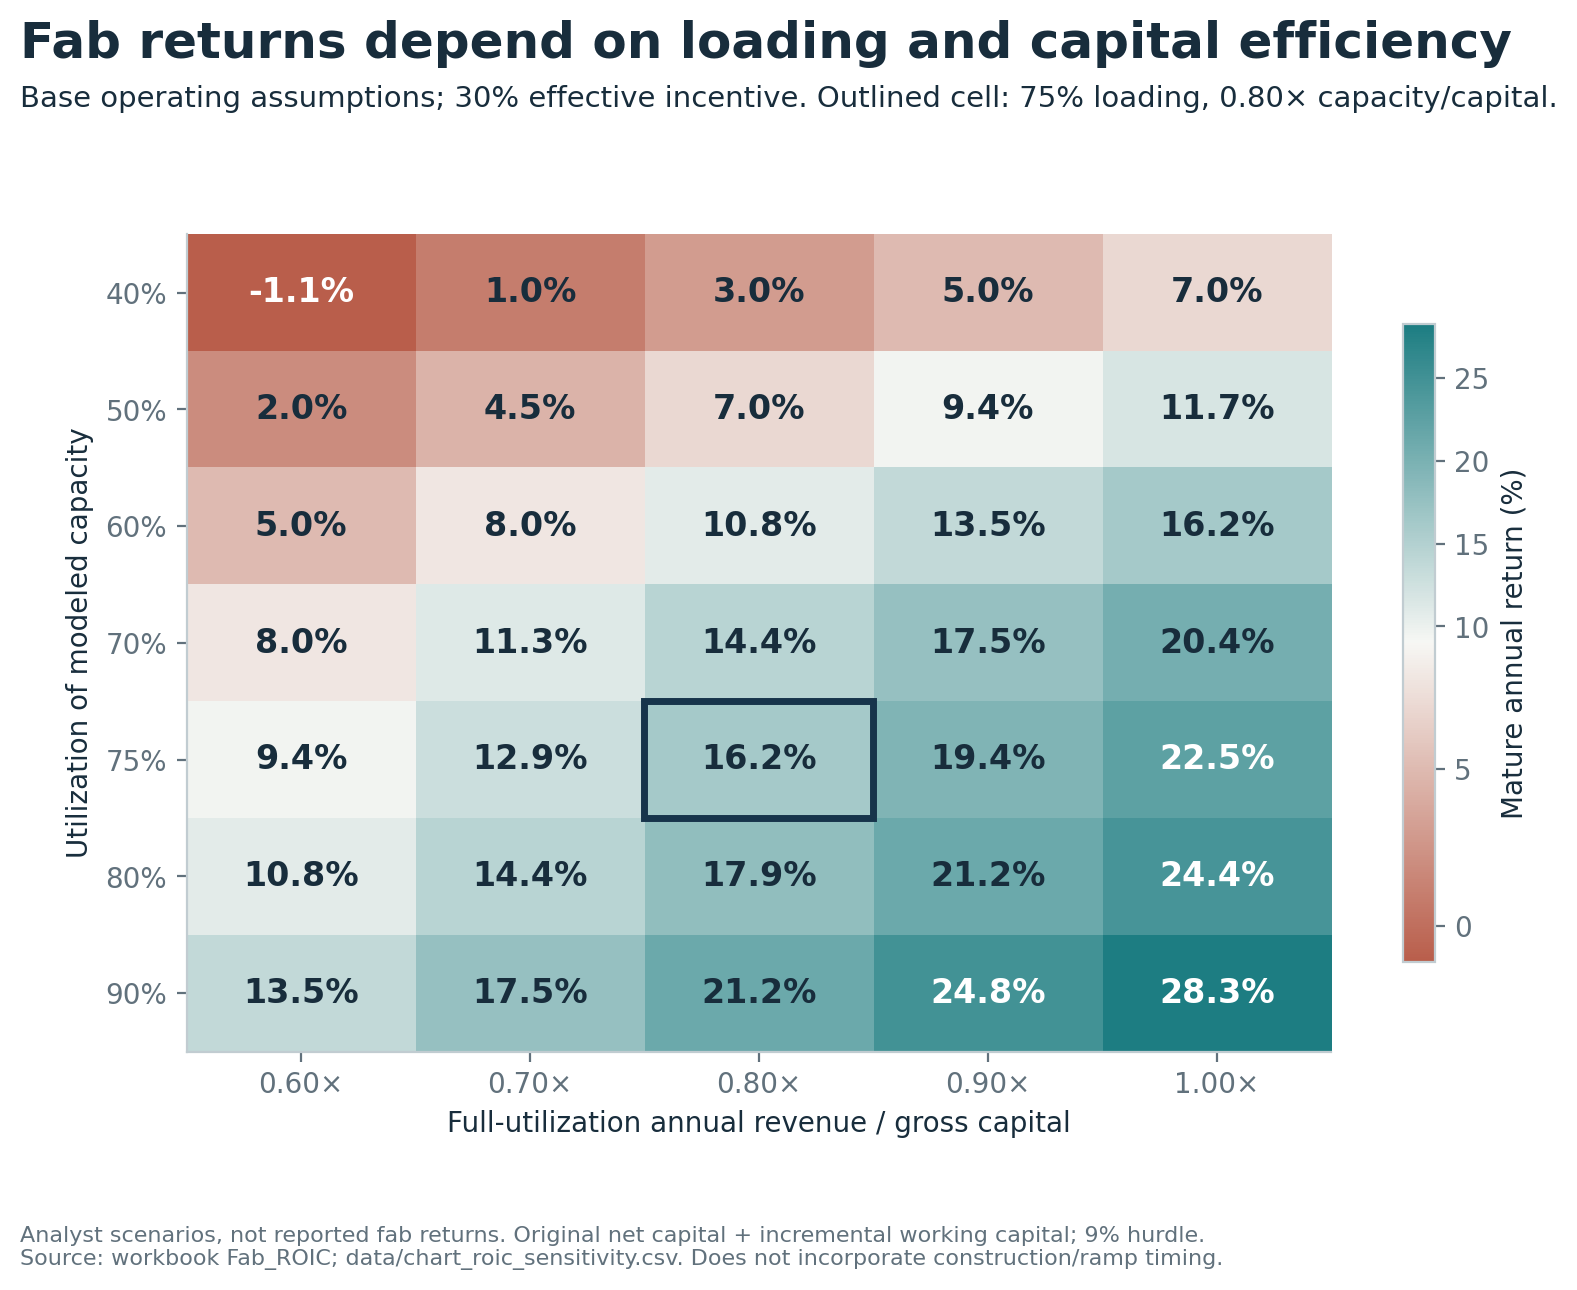
The new fabs earn 16.2% after incentives in the base case. The November 11 share price requires more cash flow than the model produces.
Question: Will Texas Instruments’ new 300mm factories earn their cost of capital, and how much success does the share price already require?
Answer: The factories can create value at sensible utilization, especially after government support. That does not make the shares inexpensive. In the explicit operating case developed here, a new factory investment earns a mature annual return of 16.2% after incentives, versus 9.9% without them. Both figures use original invested capital plus working capital, so depreciation doesn’t shrink the denominator. The unsubsidized result only narrowly exceeds the illustrative 9% cost of capital.
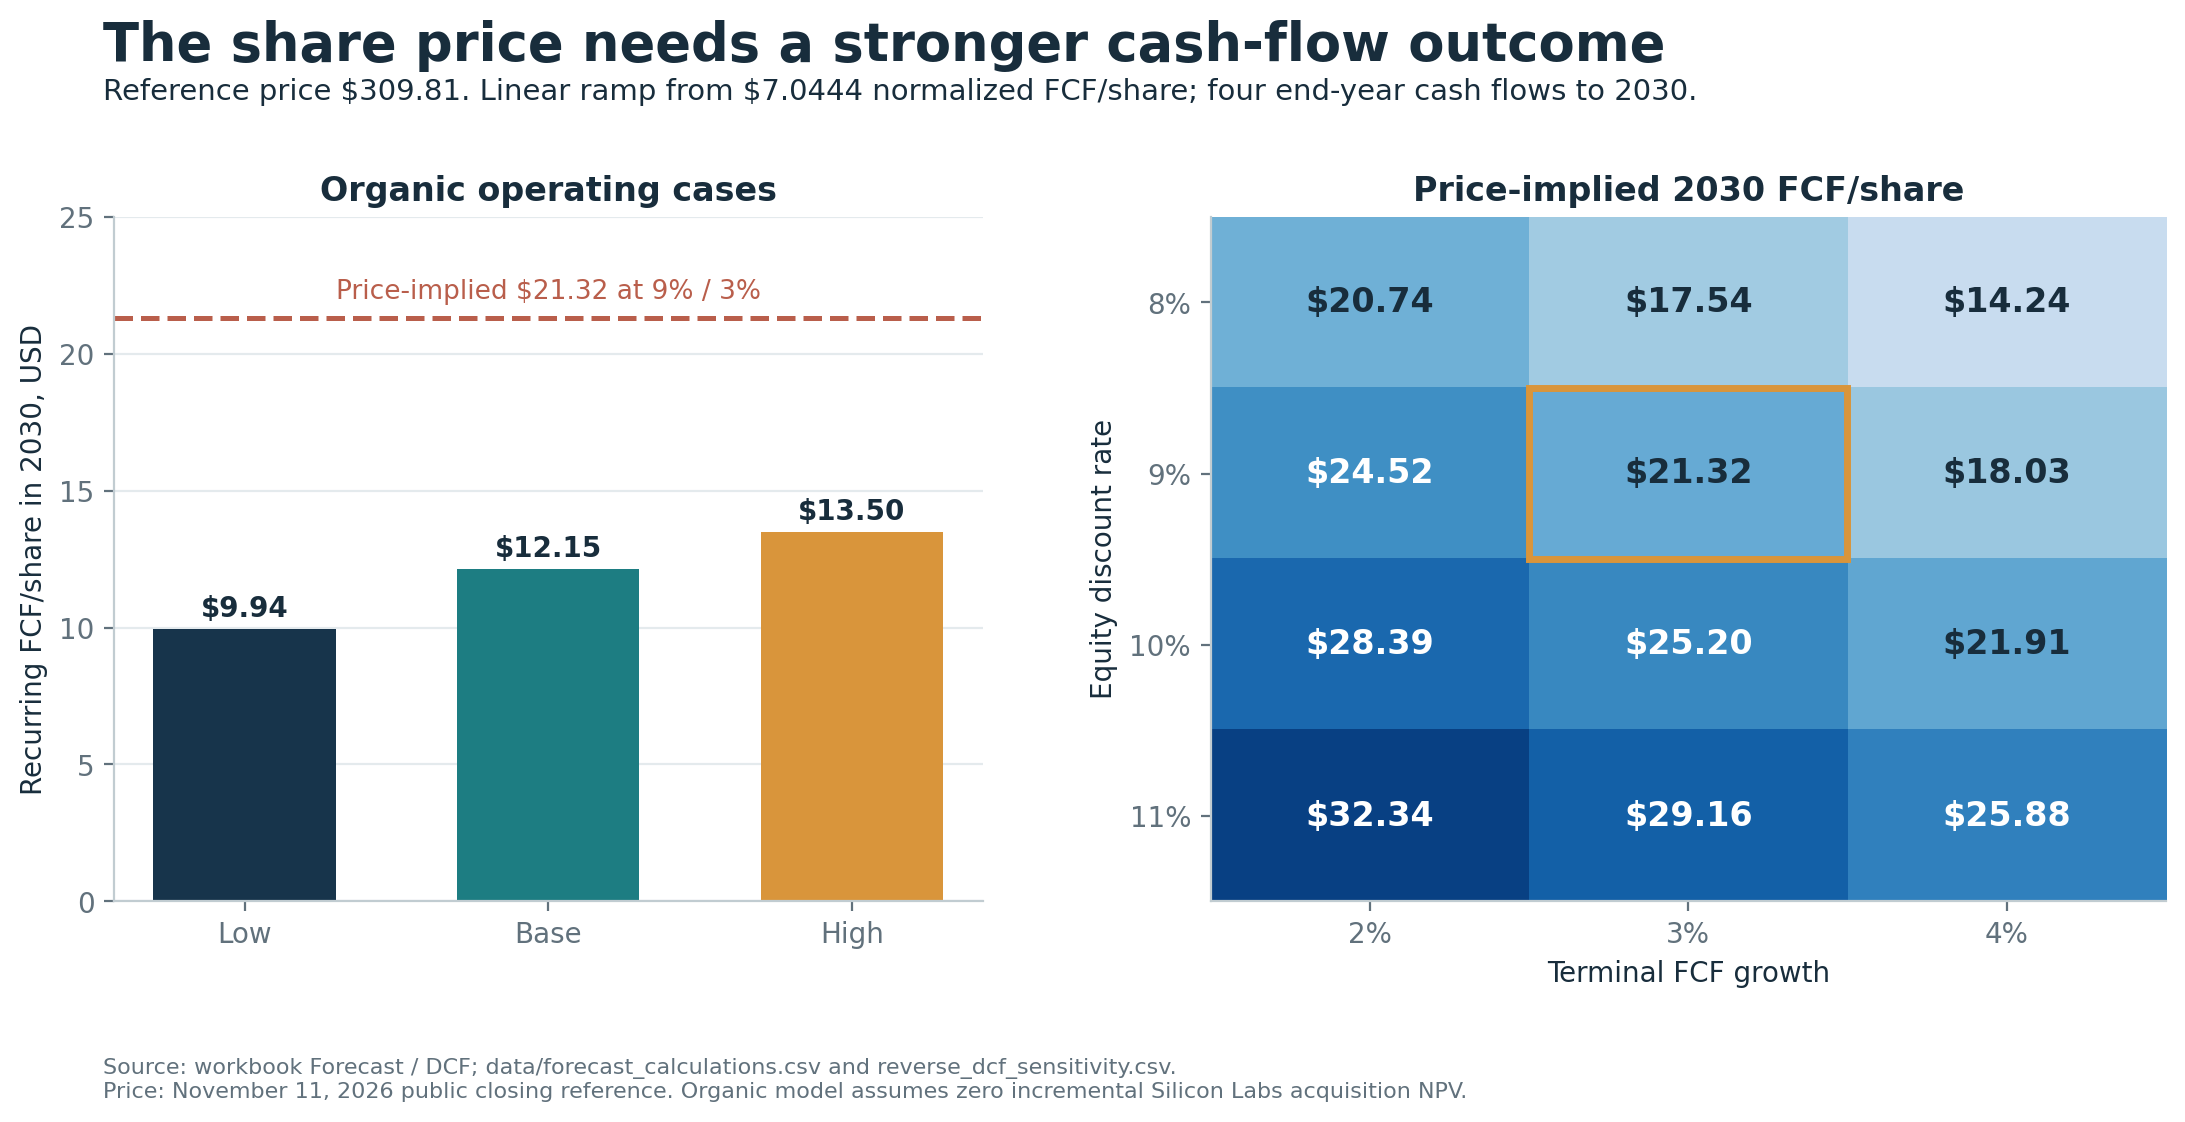
At the $309.81 November 11 closing price, a reverse equity DCF requires $21.32 of recurring free cash flow per share in 2030 at a 9% discount rate and 3% terminal growth. That is approximately $19.5 billion of annual owner cash flow. The organic operating cases in this report produce $9.94–$13.50 per share, with a base case of $12.15. The price therefore requires a stronger combination of growth, margins, reinvestment efficiency and valuation assumptions than the central operating case.
The answer depends on the assumptions below. Public filings omit fab-level sales, invested capital by vintage, utilization, operating profit or a dedicated construction-in-progress balance. The model identifies the conditions that make the investment work and the evidence needed to distinguish them.
Three current facts materially improve the position relative to the debate of 2024. Spending has moderated: the current 2026 capital budget is $2–3 billion. Operating conditions have recovered: third-quarter revenue was $6.055 billion, up 28% from a year earlier, and gross margin reached 64.2%. The investment tax-credit rate for qualifying property placed in service after 2025 is now 35%. These are substantial improvements, but none turns a capacity ceiling into contracted sales.q3, irs
What is being measured
Unless stated otherwise, financial amounts are millions of U.S. dollars, years are calendar years, and percentages are calculated from unrounded reported amounts. Historical financials cover 2013–2025, with 2012 used only for opening inventory. Latest operating records are the September 30, 2026 10-Q and October 21 earnings release. The November 9 debt issuance appears in its own financing analysis.
The price is the November 11 closing reference supplied by public market-data services and checked against a contemporaneous quote. An official exchange closing-auction price was not retrievable. It remains editable as the share price changes.price
Four definitions prevent most of the analytical errors in this subject:
- Gross capex: cash spent on property, plant and equipment.
- TI’s reported-definition FCF: operating cash flow minus gross capex plus CHIPS cash proceeds classified in investing activities. Tax credits used against taxes payable are already in operating cash flow.
- Recurring owner FCF: the report’s analytical measure, removing all CHIPS cash benefits and reserving an amount equal to stock-compensation expense to support a constant-share assumption.
- Incremental fab return: annual incremental net operating profit after tax, divided by original factory investment after assumed incentives plus incremental working capital. It is a steady-state profitability test. A project IRR would require the timing and amounts of the cash flows.
1. The spending surge is real, and so is the cash recovery
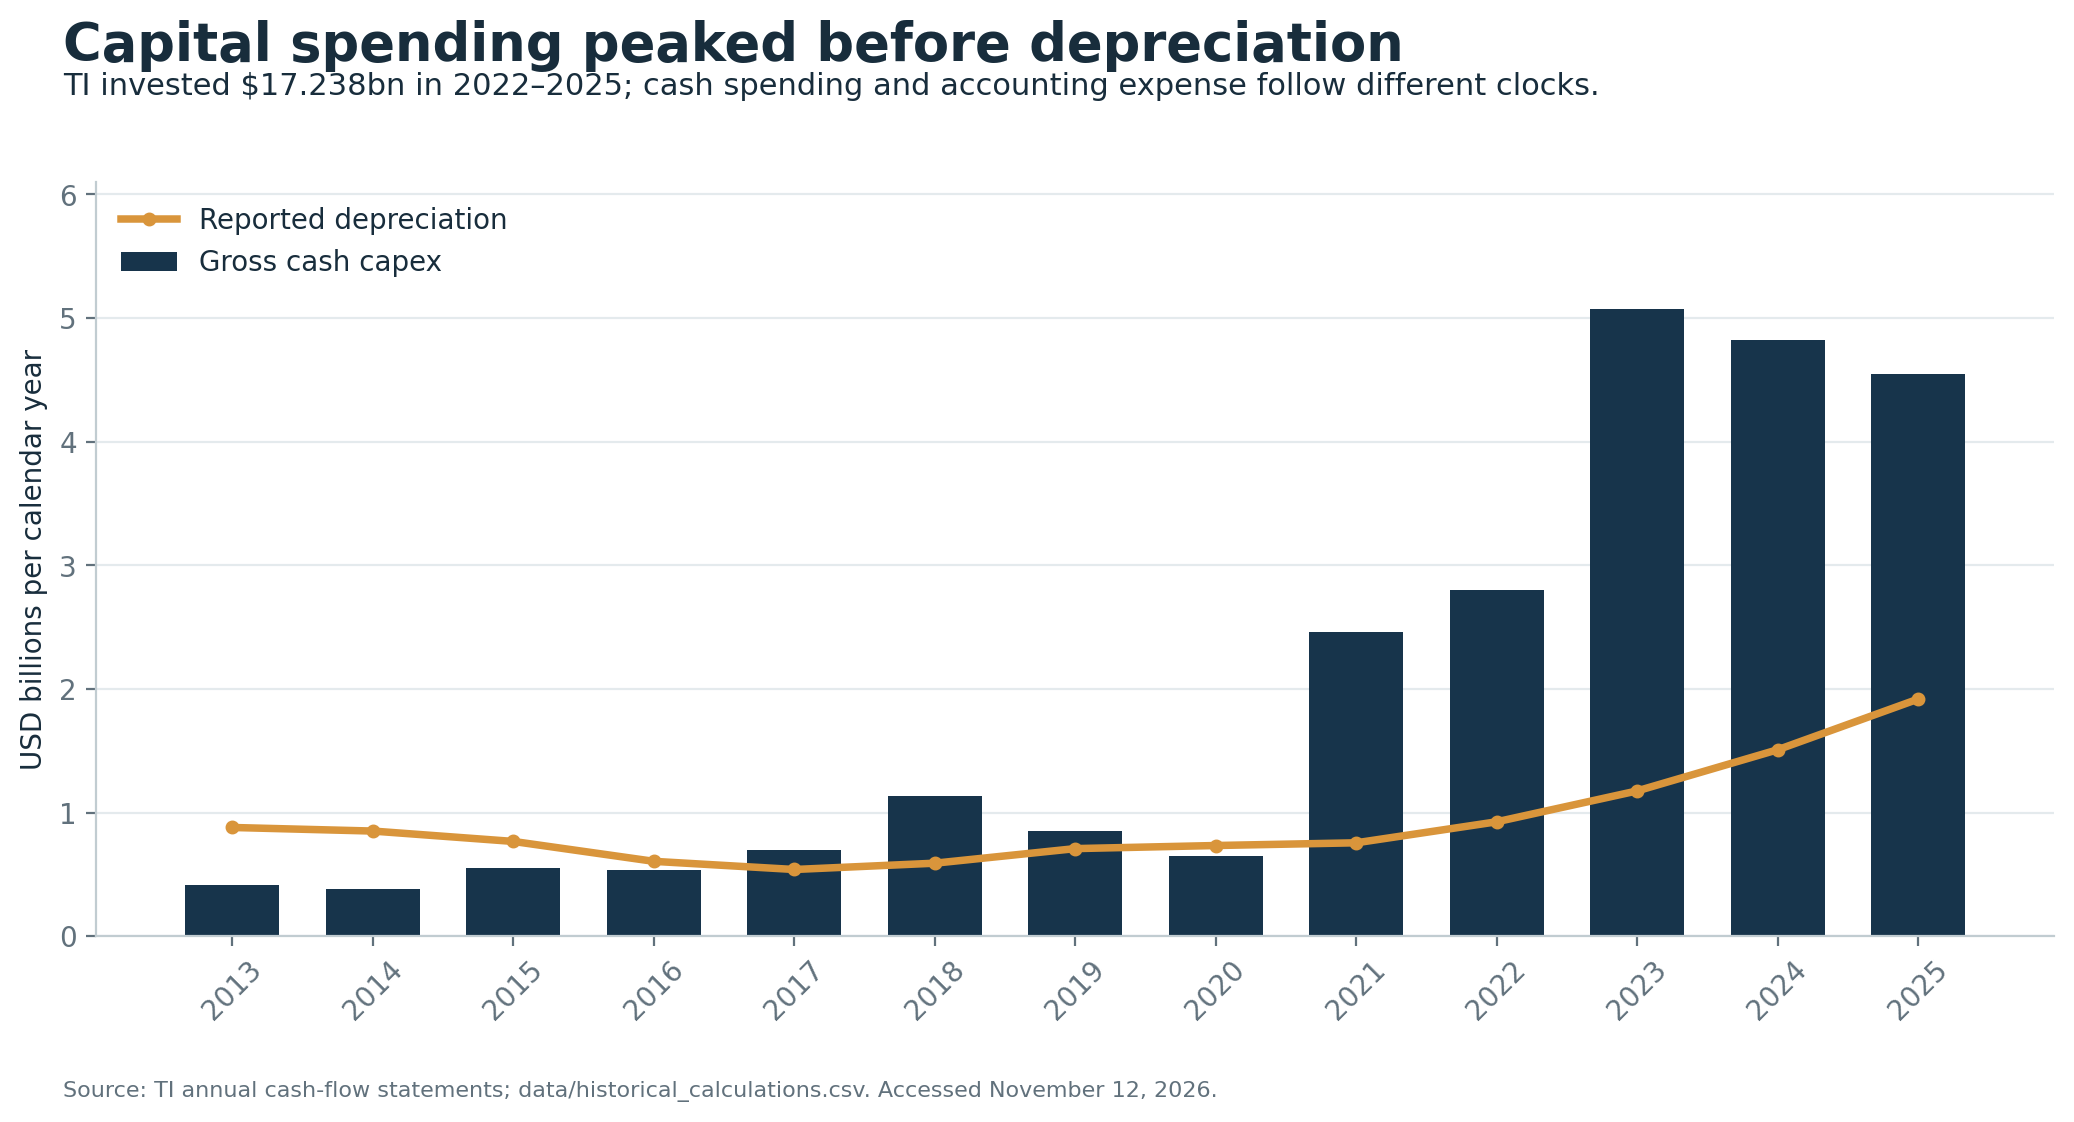
TI spent $17.238 billion during 2022–2025 and $19.700 billion including 2021. The latter already includes the Lehi property acquisition: the 2021 filing identifies $893 million of consideration. Adding that acquisition again to reported capex would double count it.capex, lehi
The thirteen-year record shows a company moving from modest capital requirements into a prolonged construction and equipment cycle.
| Year | Revenue | Analog | Embedded | Capex | Depreciation | Gross margin | DOI | FCF/basic share ($) |
|---|---|---|---|---|---|---|---|---|
| 2013 | 12,205 | 7,194 | 2,450 | 412 | 879 | 52.4% | 112 | 2.83 |
| 2014 | 13,045 | 8,104 | 2,740 | 385 | 850 | 57.1% | 117 | 3.45 |
| 2015 | 13,000 | 8,339 | 2,787 | 551 | 766 | 58.3% | 115 | 3.73 |
| 2016 | 13,370 | 8,536 | 3,023 | 531 | 605 | 61.8% | 126 | 4.07 |
| 2017 | 14,961 | 9,900 | 3,498 | 695 | 539 | 64.3% | 134 | 4.71 |
| 2018 | 15,784 | 10,801 | 3,554 | 1,131 | 590 | 65.1% | 152 | 6.25 |
| 2019 | 14,383 | 10,223 | 2,943 | 847 | 708 | 63.7% | 144 | 6.20 |
| 2020 | 14,461 | 10,886 | 2,570 | 649 | 733 | 64.1% | 123 | 5.96 |
| 2021 | 18,344 | 14,050 | 3,049 | 2,462 | 755 | 67.5% | 116 | 6.82 |
| 2022 | 20,028 | 15,359 | 3,261 | 2,797 | 925 | 68.8% | 157 | 6.47 |
| 2023 | 17,519 | 13,040 | 3,368 | 5,071 | 1,175 | 62.9% | 219 | 1.49 |
| 2024 | 15,641 | 12,161 | 2,533 | 4,820 | 1,508 | 58.1% | 241 | 1.64 |
| 2025 | 17,682 | 14,006 | 2,697 | 4,550 | 1,918 | 57.0% | 222 | 3.23 |
Sources: annual filings and later comparative disclosures; figure-level page/tag references are in the accompanying historical source CSV and workbook Evidence sheet. FCF/share uses weighted average basic shares, matching management’s convention. “DOI” is TI’s reported period-end days of inventory. Gross margins cover the consolidated company.history
The old cash-generation pattern was unusually favorable. In 2013, capex was $412 million against $879 million of depreciation. By 2020, revenue was $14.461 billion and capex remained only $649 million. Factories, product design and distribution were generating cash while the company spent comparatively little on replacement and expansion.
That pattern should not be projected indefinitely. From 2021 through 2025, cash capex exceeded depreciation by $13.419 billion, calculated as $19.700 billion minus $6.281 billion. This difference is not the increase in net PP&E: subsidies, disposals, noncash additions and other accounting movements also affect that balance. It does show the scale of cash investment relative to current depreciation.
The downturn then made absorption worse. Revenue fell from $20.028 billion in 2022 to $15.641 billion in 2024 while factories and tools continued to be built. Inventory rose, capex absorbed cash, and new depreciation arrived before the revenue needed to cover it. These are ordinary consequences of investing ahead of demand.
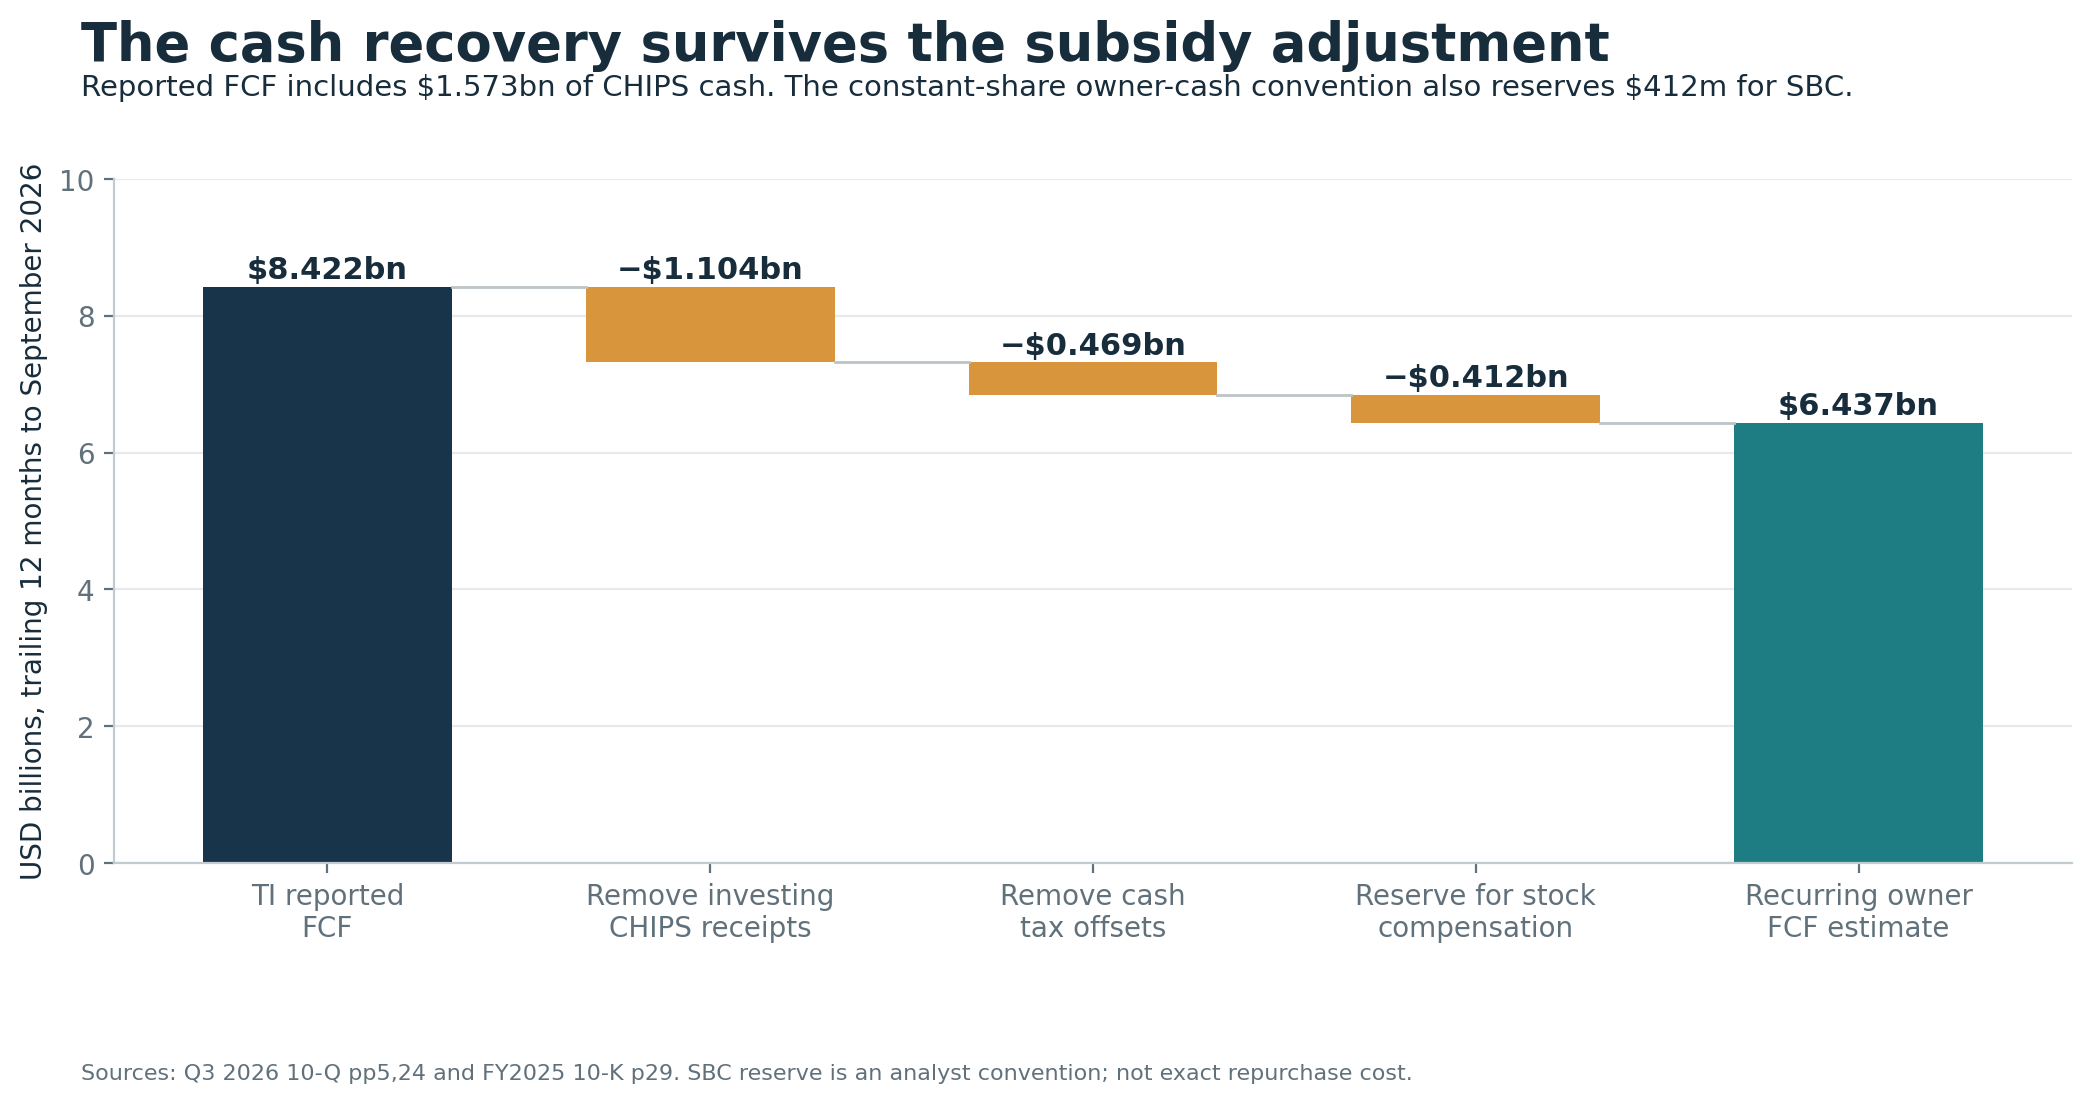
The latest recovery is visible even after removing incentives. Trailing operating cash flow was $9.896 billion at September 2026. Subtracting gross capex of $2.578 billion produces $7.318 billion; removing the $469 million cash tax-credit benefit already inside OCF leaves $6.849 billion before a stock-compensation reserve.fcfrecon
The timing matters. Government support explains part of the reported $8.422 billion FCF, but the recovery cannot reasonably be described as subsidy receipts alone.
Two historical comparability corrections
The source files use later recast comparatives. TI’s 2017 filing restated 2013 operating cash flow to $3.514 billion from $3.384 billion after an accounting change moved excess stock-tax benefits into operating cash flow. Another change moved non-service pension costs below operating profit, affecting historical gross and operating margins. Those changes did not improve manufacturing productivity.recast
Inventory days also need a consistent denominator. TI reported 222 days at year-end 2025. The annual-average measure, 365 multiplied by average beginning and ending inventory divided by annual cost of revenue, produces 224.1 days. The data include both. The report never splices annual-average ratios into TI’s period-end series.
The latest quarter’s 194 reported inventory days and $4.672 billion inventory balance represent an improvement, but inventory remains a major capital commitment. The forecast uses incremental trade working capital of 30% of added revenue, close to the current 31.08% ratio of receivables plus inventory minus payables to trailing revenue.q3
2. What management promised, and how it changed
The headline investment amount is not a near-term cash obligation. TI’s June 2025 announcement described more than $60 billion across seven U.S. fabs, including up to $40 billion for four Sherman factories. It is a multiyear full-build plan. Shell construction, equipment installation, initial production and full utilization are different stages.sixty
The sequence since 2022 is more informative than any single headline.
| Disclosure | Capital framework | What an analyst should keep |
|---|---|---|
| February 2022, subsequently confirmed on the April earnings call | About $3.5 billion average annual capex in 2022–2025 | An average across those years. Annual spending can vary. |
| February 2023 | About $5 billion annually in 2023–2026; later spending previously framed at 10–15% of revenue | The expansion accelerated. Historical capacity planning included roughly $30 billion revenue support in 2026 and $45 billion in 2030. |
| February 2024 | Reaffirmed the elevated-spending framework | The $45 billion number described capacity. |
| May 2024 Elliott letter | Requested dynamic equipment spending and at least $9 FCF/share in 2026 | An investor’s proposal and forecast. |
| August 2024, reaffirmed February 2025 | 2026 capex could range from $2 billion to $5 billion depending on revenue | Spending flexibility became explicit. The scenario FCF figures included ITC benefits and excluded direct grants. |
| February 2026 | $2–3 billion capex in 2026; depreciation $2.2–2.4 billion | Both spending and depreciation expectations were lower than older assumptions. |
| October 2026 | Kept $2–3 billion, aiming toward the upper end subject to tool delivery | Specific 2027 spending guidance was still to come. |
Primary sources: TI-hosted presentations and transcripts. The unavailable original August 2024 transcript is corroborated by the February 2025 company-hosted transcript, which explicitly attributes the flexible framework to that call.policy22, policy24, policy25, policy26, octcall
The February 2025 scenario table was specific enough to test:
| 2026 revenue scenario | Gross capex | FCF/share scenario |
|---|---|---|
| $20 billion | $2–3 billion | $8–9 |
| $22 billion | $2–3 billion | $9–10 |
| $24 billion | $3–4 billion | $10–11 |
| $26 billion | $4–5 billion | $11–12 |
Each outcome applied to a different set of conditions. The current nine-month revenue plus fourth-quarter guidance midpoint produces an analytical full-year reference of $22.393 billion, making the old $22 billion scenario a benchmark. The latest TTM FCF is not a final 2026 result, however, and the later inclusion of direct cash grants also affects comparisons.policy25, q3
Elliott’s argument was about timing
Elliott’s May 2024 letter argued that tools should follow demand more closely, preserving long-term capacity while restoring per-share cash flow. It proposed scenarios supporting at least $9 in 2026 FCF/share and a path above $11 in 2027, on Elliott’s diluted-share basis.elliott
That argument did not show that the new factories were intrinsically uneconomic. A cleanroom can remove future construction lead time while still allowing tools to be installed gradually. Conversely, ordering tools years before demand arrives commits cash and starts an expense cycle without immediately producing customer revenue.
Management’s subsequent framework addresses much of that timing question. The February 2026 call describes long-term gross capex/revenue of approximately 1.2 times revenue growth, with a roughly 4% no-growth floor. At 10% growth, the illustration is about 12% capital intensity. Adding another four percentage points would misread the framework.policy26
The 2026 deck emphasizes internal sourcing and 300mm production shares and no longer repeats the old $45 billion 2030 dollar-capacity point. A model should preserve that earlier statement as a dated plan, without presenting it as current revenue guidance.
3. CHIPS: follow the money through all three statements
The final Commerce award was up to $1.61 billion, including workforce support; TI describes up to $1.6 billion of direct manufacturing funding. Disbursement depends on project milestones. By September 2026, TI said it had received $630 million of direct funding. The statutory investment tax credit provides another form of support.award, q3
The IRS now specifies a 35% credit for qualifying property placed in service after December 31, 2025, versus 25% for the earlier eligible period. Qualification, construction timing and eligible basis still matter. A 35% statutory rate does not mean every dollar of TI’s worldwide capital spending receives a 35% subsidy.irs
The cash reconciliation is straightforward once the classification has its own line.
| Period | OCF | Gross capex | Tax offsets in OCF | Investing receipts | TI FCF | FCF ex CHIPS | Cash net capex |
|---|---|---|---|---|---|---|---|
| 2023 | 6,420 | 5,071 | 0 | 0 | 1,349 | 1,349 | 5,071 |
| 2024 | 6,318 | 4,820 | 588 | 0 | 1,498 | 910 | 4,232 |
| 2025 | 7,153 | 4,550 | 335 | 335 | 2,938 | 2,268 | 3,880 |
| 9M 2025 | 4,899 | 3,625 | 246 | 335 | 1,609 | 1,028 | 3,044 |
| 9M 2026 | 7,642 | 1,653 | 380 | 1,104 | 7,093 | 5,609 | 169 |
| TTM Sep 2026 | 9,896 | 2,578 | 469 | 1,104 | 8,422 | 6,849 | 1,005 |
USD millions. “Cash net capex” subtracts both forms of cash benefit from gross spending. Receipt cohorts need not match spending cohorts. It measures cash financing in the period. Equipment purchase cost follows the purchase and payment schedule.cashnotes, fcfrecon
For the latest twelve months:
TI FCF=9,896-2,578+1,104=8,422.
Total CHIPS cash=469+1,104=1,573.
FCF excluding CHIPS=8,422-1,573=6,849.
Cash net capex=2,578-1,573=1,005.
The tempting calculation “OCF minus net capex” is wrong if OCF has not first been adjusted. It would count the $469 million tax offset twice. The correct equivalent is:
(9,896-469)-(2,578-1,573)=8,422.
Recognition can precede cash
At the end of 2025, TI disclosed $4.51 billion of cumulative reductions to manufacturing-asset carrying amounts, including $1.37 billion recognized during 2025. Cash benefits in that year were only $670 million. The difference largely reflects receivables and recognition timing.incentives
The year-end bridge, in millions, is:
3,348 receivables+1,258 cumulative cash -95 deferred income=4,511.
That agrees with the rounded $4.51 billion asset-basis disclosure. It also explains why an accrued credit cannot be treated as a cash receipt in the FCF calculation.
Lower asset basis reduces future depreciation. TI states that cost of revenue benefited by $353 million in 2025, compared with $159 million in 2024 and $45 million in 2023. The 2025 amount mechanically supported gross margin by 2.00 percentage points: $353 million divided by $17.682 billion revenue. It is an accounting benefit from support recognized against assets. Cash flow reflects each payment once.incentives
September 2026 receivables total $2.136 billion, split between $1.100 billion current and $1.036 billion noncurrent. The interim filing does not update cumulative asset-basis reductions or deferred incentive income. Consequently, receivables plus cumulative cash do not determine a new exact asset-basis balance.receivables
The recurring valuation excludes future incentive collections. Existing receivables could add value, but their full undiscounted face amount is only $2.34 per current share, before taxes, timing and conditions. That sensitivity shows an upper bound on the adjustment. The 2025 tax footnote also identifies a $299 million CHIPS deferred tax liability; the latest corresponding detail is unavailable.incentives
4. Test capacity against older factories
The February 2025 footprint presentation provides these full-build estimates:
| Factory | Maximum annual revenue supported | Full-build capital spending | Interpretation |
|---|---|---|---|
| RFAB2, Richardson | About $6 billion | About $6 billion | Includes growth and transfers from 150mm production. |
| LFAB1, Lehi | About $4 billion | About $4 billion | Includes insourcing existing foundry production. |
| LFAB2, Lehi | About $11 billion | About $11 billion | Further modular expansion. |
| SM1, Sherman | About $9 billion | Not disclosed | Do not assign the entire Sherman site cost to this fab. |
| Four-fab Sherman complex | Not specified for the complex | About $30–40 billion | Capital figure covers all four fabs. |
Management estimates depend on mix and utilization. They are not contracted sales, realized returns or near-term cash-spending guidance.capacity
Three identifiable projects imply roughly one dollar of maximum annual revenue per dollar of full-build capex. The model discounts that to 0.80 in the base case and 0.60 in the low case. The haircut allows for mix, pricing, qualification and economic scope that a nameplate estimate does not settle.
The strongest historical cross-check is unusually concrete. In its April 2015 shareholder-meeting remarks, TI said RFAB produced $2 billion of Analog revenue during 2014, against $5 billion of annual revenue when filled. Realized revenue was therefore 40% of stated dollar capacity several years after initial production. This is not a reported 40% wafer-utilization rate: mix, prices, equipped tools and the denominator can change.oldfab
The same remarks described $8 billion of combined eventual capacity from RFAB and another Dallas 300mm fab. These statements show that the architecture had commercial substance. They do not show that an announced capacity number fills quickly.
The original factory’s cost history is also a poor direct proxy for current greenfield construction. TI’s 2010 call identified $173 million of initial Qimonda equipment, roughly $75 million of additional equipment and an undisclosed Spansion purchase. Those amounts are not the total cost of RFAB. Calculating a spectacular return by dividing billions of revenue by only those equipment purchases would omit the building, other tools and subsequent investment.oldcost
Forty percent cheaper is not forty points of margin
TI’s worked illustration shows a $1 part whose unpackaged chip cost falls from $0.20 to $0.12 on 300mm. Assembly, test and other costs stay at $0.20. Total cost consequently falls from $0.40 to $0.32, and gross margin rises from 60% to 68%.costexample
The example explains an economic mechanism. It does not show an eight-point gain for every product, nor disclose the cash-versus-depreciation split. It also does not remove the need to fund new equipment.
This report uses 8% of transferred revenue as a cash-savings scenario informed by that illustration. TI leaves that cash margin undisclosed. It varies the assumption from 5% to 12%, and also charges the new project’s depreciation. Existing TI sales moved into a new factory receive only their incremental savings; they are never counted again as wholly new company revenue.
5. Incremental ROIC: the factory can work, but the denominator matters
The project model is normalized to $1 billion of gross investment. It is not a claim that all $17.238 billion spent in 2022–2025 has the same asset mix, subsidy eligibility or revenue potential. Group capex also includes assembly, test and other facilities.
The base case assumes:
| Driver | Low | Base | High |
|---|---|---|---|
| Full-utilization revenue / gross capital | 0.60× | 0.80× | 1.00× |
| Utilization of modeled capacity | 55% | 75% | 90% |
| Share of supported sales genuinely incremental to TI | 50% | 75% | 90% |
| Contribution margin on new sales | 55% | 60% | 65% |
| Net cash savings on transferred existing sales | 5% | 8% | 12% |
| Effective incentive / gross capital | 20% | 30% | 35% |
| Working capital / incremental sales | 30% | 30% | 30% |
All cases also assume fixed incremental cash costs equal to 6% of gross investment, a normalized 15% tax rate, and a 35% building/65% equipment investment mix with respective lives of 40 and eight years. Buildings up to 40 years and equipment lives of five to ten years are disclosed accounting policies; the particular mix and eight-year life are assumptions.ppe
Contribution margin is after all variable fabrication, assembly/test and variable commercial-support costs. The fixed allowance includes incremental factory costs, engineering and commercial support. Transfer savings must be net of receiving-fab variable cash costs and stranded costs not already included in the fixed allowance. These definitions keep the project from receiving artificial profits through omitted costs or charging the same fixed costs twice.
Base case, step by step
Full-utilization capacity is $800 million annually. At 75% loading, the fab supports $600 million of sales. Three quarters, or $450 million, are assumed to be new company revenue; $150 million transfers existing production.
Incremental EBITDA =450(60%)+150(8%)-60 =$222 million.
The blended annual depreciation rate is:
d=35%/40+65%/8=9%.
With a 30% effective incentive, the modeled depreciable investment is $700 million, giving depreciation of $63 million. Uniform tax treatment is a modeling convention; book basis and tax basis need not be identical.
NOPAT=(222-63)(1-15%)=$135.15 million.
Working capital is 30% of $450 million incremental sales, or $135 million:
Original invested capital=700+135=$835 million.
Mature return=135.15/835=16.19%.
Without incentives, depreciation becomes $90 million and initial investment becomes $1 billion plus $135 million of working capital:
(222-90)(1-15%)/1,135=9.89%.
| Per $1bn gross investment | Low | Base | High |
|---|---|---|---|
| Supported annual revenue ($m) | 330.0 | 600.0 | 900.0 |
| Genuinely new TI revenue ($m) | 165.0 | 450.0 | 810.0 |
| Incremental EBITDA ($m) | 39.0 | 222.0 | 477.3 |
| NOPAT after incentives ($m) | -28.05 | 135.15 | 355.98 |
| Original net capital + working capital ($m) | 849.5 | 835.0 | 893.0 |
| Mature return after incentives | -3.3% | 16.2% | 39.9% |
| Mature return without incentives | -4.1% | 9.9% | 26.5% |
| Utilization for 9% return, after aid | 127.1% | 55.2% | 33.0% |
The range is intentionally wide. The high case combines good capital efficiency, high loading and a large share of genuinely new sales. The low case cannot earn the 9% hurdle even at full utilization without changing its other assumptions. Its modeled operating loss receives a tax benefit against TI’s other profits; a standalone project without usable tax losses would fare worse.
Holding the base assumptions constant, utilization must reach 55.2% after incentives or 71.7% before incentives to earn 9%. The workbook also allows the hurdle to be varied. Neither the 9% project WACC nor the 9% equity discount rate used for the stock is presented as an observed market fact.
These are returns on original capital. A mature factory can display a rising conventional accounting ROIC simply because accumulated depreciation reduces the denominator. That does not improve the return on the cash originally invested.
Nor is 16.2% a lifetime IRR. Construction, qualification, ramp losses and delayed incentive collections consume time. At 9%, moving an otherwise identical cash stream five years later reduces its present value by about 35%. Historical evidence that a fab eventually filled is insufficient without knowing when it filled and how much was spent along the way.
6. Depreciation is still rising after the spending peak
TI’s reported depreciation rose from $925 million in 2022 to $1.918 billion in 2025. The current guide is $2.2–2.4 billion for 2026. Cash spending can fall while depreciation rises because previously purchased assets enter service and first-year charges annualize.capex, policy26
The public data do not permit an exact construction-in-progress roll-forward. The PP&E footnote lists land, buildings/improvements and machinery/equipment without reporting a CIP figure. No fabricated balance is inserted to make the schedule look complete.
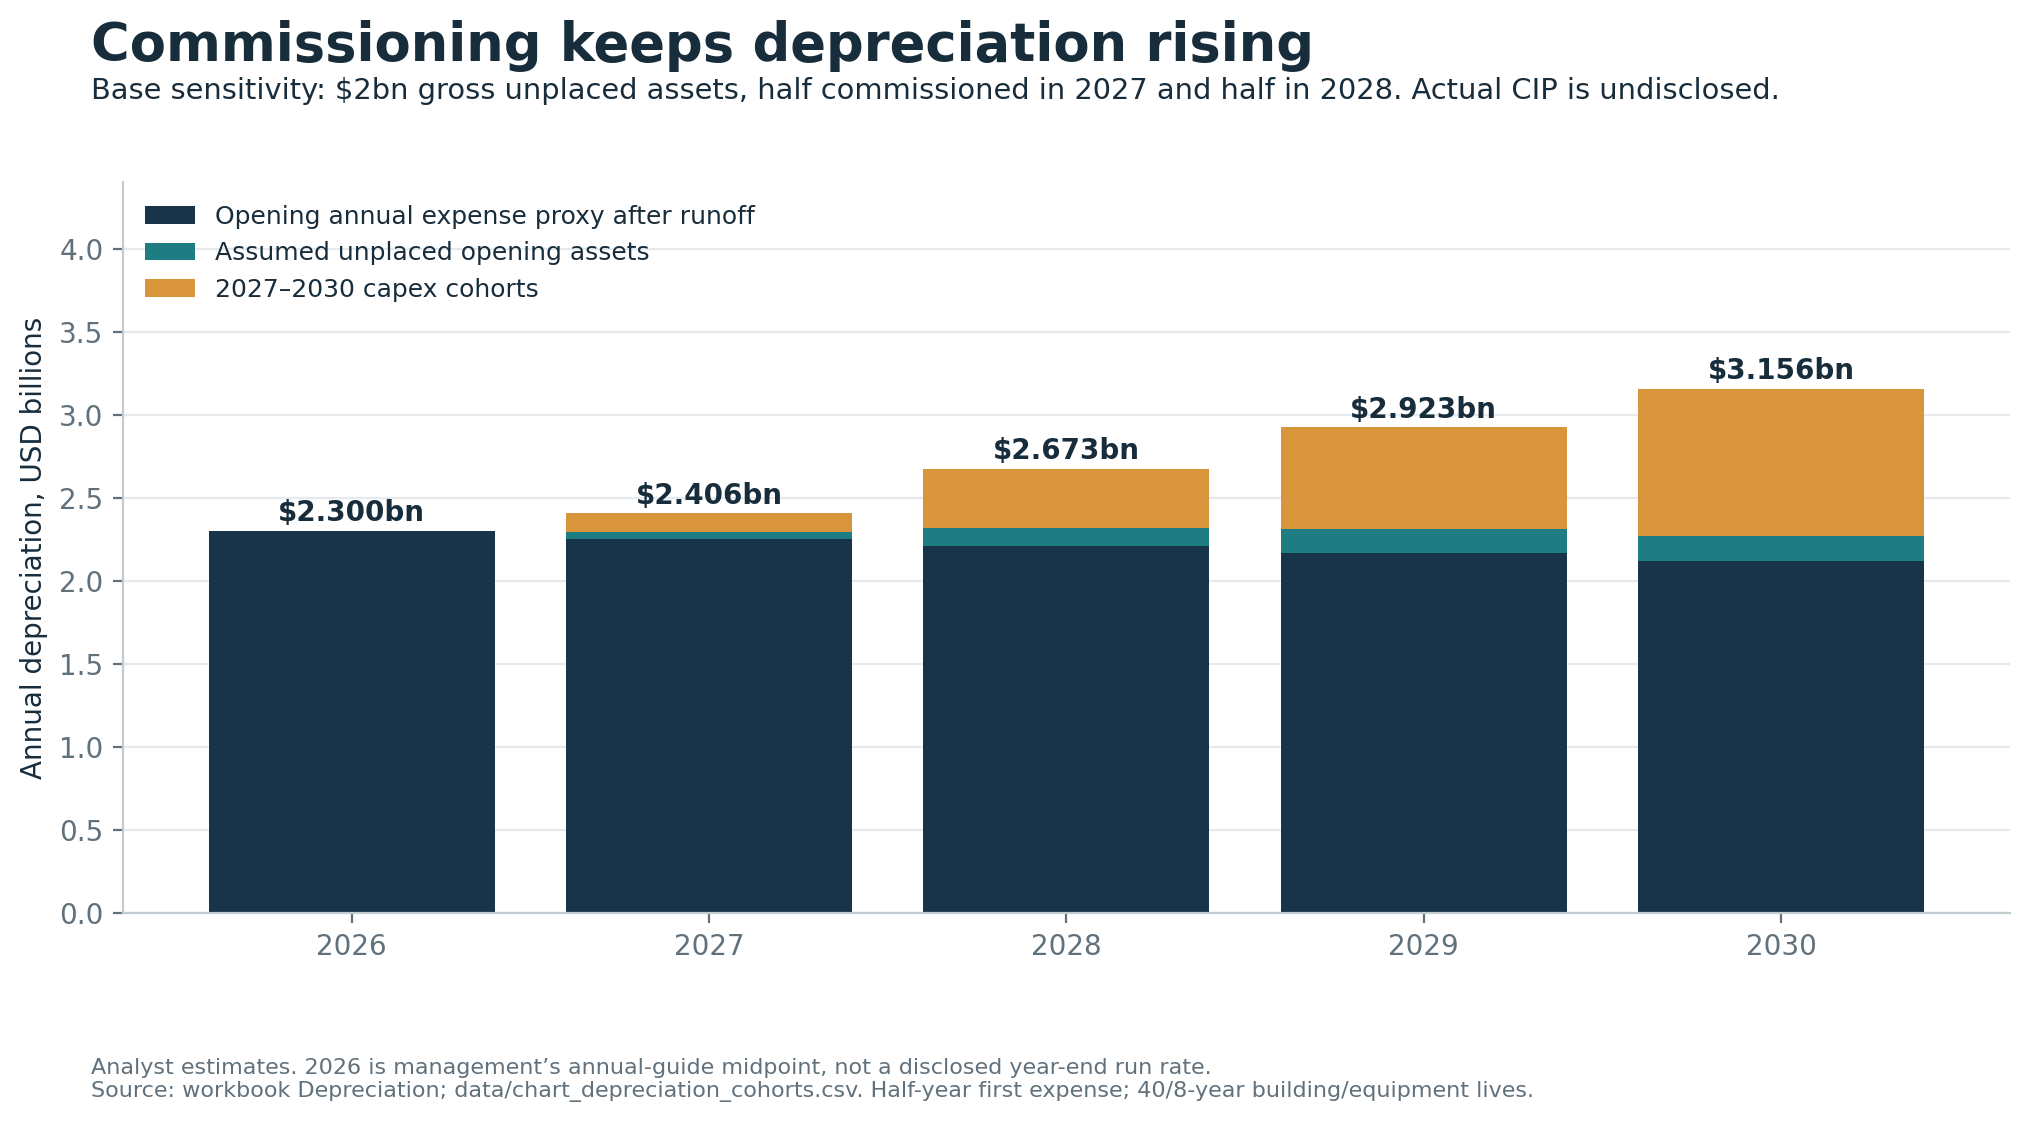
Instead, the workbook offers an explicit commissioning sensitivity. The base case assumes $2 billion of gross assets still unplaced at the end of 2026, with half commissioned during 2027 and half during 2028. The low/high assumptions are zero and $4 billion. These assets are inside opening PP&E; their activation is not another cash outflow.
The schedule uses:
- $2.3 billion, the midpoint of annual 2026 guidance, as an opening expense proxy;
- 2% annual runoff from the opening in-service depreciation base;
- Future spending allocated 20% to buildings and 80% to equipment, with 40-year building lives and eight-year equipment lives;
- half-year depreciation in the commissioning year;
- a 30% previously booked incentive against the assumed opening unplaced assets, and no newly assumed aid on future capex.
The $2.3 billion guide covers annual expense. The year-end run rate remains undisclosed. Treating it as an opening proxy can miss annualization of 2026 commissioning. Asset vintages and disposals are additional missing inputs.
| Depreciation estimate ($m) | 2027 | 2028 | 2029 | 2030 |
|---|---|---|---|---|
| Low | 2,302 | 2,355 | 2,412 | 2,472 |
| Base | 2,406 | 2,673 | 2,923 | 3,156 |
| High | 2,528 | 3,055 | 3,564 | 4,060 |
Base depreciation reaches $3.156 billion in 2030. The $856 million increase over a flat $2.3 billion expense baseline would reduce gross margin by at most 2.85 percentage points at $30 billion sales if all of it were charged to cost of revenue. That is not a forecast 2.85-point decline from 2026: depreciation/revenue rises only from about 10.27% of the 2026 revenue reference to 10.52% in 2030, or roughly 0.25 point.
This difference is economically important. Revenue absorption can offset a rising dollar depreciation charge. Conversely, a lower depreciation estimate may improve reported earnings without returning any of the construction cash.
7. How peer manufacturing models differ
The latest annual comparison is deliberately based on reported accounting measures. Infineon’s November 10 full-year release is newer than its available audited annual report, and its figures are euros. The other companies report dollars.
| Company / fiscal year | Currency | Revenue | Gross margin | Operating margin | PP&E capex | Capex / sales | Cash surplus |
|---|---|---|---|---|---|---|---|
| Analog Devices FY2025 | USD | 11,020 | 61.5% | 26.6% | 534 | 4.8% | 4,279 |
| Microchip FY2026 | USD | 4,713 | 57.7% | 10.4% | 91 | 1.9% | 871 |
| NXP FY2025 | USD | 12,269 | 54.7% | 24.8% | 397 | 3.2% | 2,423 |
| onsemi FY2025 | USD | 5,995 | 33.1% | 1.4% | 341 | 5.7% | 1,419 |
| Infineon FY2026 | EUR | 16,353 | 40.4% | 13.5% | 2,184 | 13.4% | 1,953 |
Amounts are millions of each issuer’s reporting currency. “Cash surplus” means CFO minus gross PP&E capex throughout the table. Inventory-day calculations and individual depreciation and D&A inputs are available in the workbook.adi, mchp, nxp, on, ifx
Four adjustments change the interpretation.
Outsourcing moves investment economics into other lines. ADI says more than half its wafers are externally sourced. Microchip attributes about 65% of fiscal-2026 sales to products made at external foundries. Foundry payments enter cost of sales; commitments and deposits can also support future production. Their lower PP&E capex does not demonstrate a lower total manufacturing cost.adi, mchp
NXP’s own capex line misses joint-venture factory funding. Its $397 million of PP&E purchases becomes $980 million, or 7.99% of revenue, after adding $491 million contributed to VSMC and approximately $92 million to ESMC. This broader cash measure captures JV contributions alongside reported capex.nxp
Infineon’s adjusted cash flow removes some investment that TI’s headline measure includes. Infineon reported €993 million FCF and €1.925 billion adjusted FCF. Its €4.137 billion continuing-operations CFO less €2.184 billion PP&E spending is €1.953 billion; subtracting another €383 million of intangible/development investment gives €1.570 billion before other investing flows. Comparing TI’s construction-burdened FCF with a peer measure that adds back major building spending is misleading.ifx
Charges can reveal the cost of excess capacity. onsemi’s fiscal-2025 operating margin was 1.4% under GAAP versus 18.6% adjusted. Its filing describes equipment impairments, accelerated depreciation and restructuring-related inventory charges. These are operating and accounting outcomes. An impairment lowers future book depreciation and invested capital without recovering the original cash.on
Acquisition amortization also distorts simple margin and D&A comparisons. ADI reported approximately $407 million PP&E depreciation against nearly $2.0 billion total depreciation and amortization. Infineon’s latest release supplies total D&A but not standalone PP&E depreciation; that input remains unavailable.
The current quarter panel prevents the annual trough from becoming a stale narrative:
| Company | Quarter ended | Currency | Revenue (m) | Gross margin | Operating margin |
|---|---|---|---|---|---|
| Analog Devices | 2026-08-01 | USD | 4,022 | 67.3% | 40.1% |
| Microchip | 2026-09-30 | USD | 1,622 | 65.9% | 28.6% |
| NXP | 2026-09-27 | USD | 3,786 | 57.8% | 32.4% |
| onsemi | 2026-10-02 | USD | 1,722 | 41.4% | 22.0% |
| Infineon | 2026-09-30 | EUR | 4,706 | 41.8% | 16.5% |
The recovery is broader than TI alone. That makes TI’s recent operating leverage more credible, while also cautioning against attributing the entire rebound to its new fabs.peerquarters
8. From factory returns to whole-company cash flow
The organic model starts from the $22.393 billion 2026 revenue reference and compounds to three 2030 sales outcomes. It holds debt principal and common shares constant and assumes no net borrowing. The 30% working-capital ratio applies to additional sales each year.
Its operating cash equation is:
FCFE=EBIT(1-t)+D-gross capex-Δ WC -after-tax net below-operating charge.
Here, “EBITDA” includes stock compensation as an expense. The cash build adds back depreciation but does not add stock compensation back. Small software amortization is left within operating costs without an additional cash addback.
Gross capex intensity is the greater of 4% or 1.2 times the modeled revenue-growth rate. This applies management’s long-term relationship to model one possible spending path for 2027. The net below-operating charge is held at the trailing $336 million, comprising $564 million interest/debt expense less $228 million other income/expense.q3, policy26
| 2030 operating outcome | Low | Base | High |
|---|---|---|---|
| Revenue ($bn) | 25.0 | 30.0 | 36.0 |
| Revenue CAGR, 2026 reference–2030 | 2.79% | 7.59% | 12.60% |
| EBITDA margin, SBC expensed | 48.0% | 56.0% | 61.0% |
| Depreciation ($bn) | 2.472 | 3.156 | 4.060 |
| Gross capex / revenue | 4.00% | 9.10% | 15.12% |
| Recurring equity FCF ($bn) | 9.082 | 11.103 | 12.336 |
| Recurring FCF/share ($) | 9.94 | 12.15 | 13.50 |
| Core equity value/share ($) | 152.31 | 182.44 | 198.76 |
The high case does not produce a proportionate FCF increase because faster growth also requires more equipment and working capital. Treating growth as free would make the model look much more attractive.
These are organic values at 9% cost of equity and 3% terminal FCF growth. They use four end-year cash flows from 2027 through 2030 and a year-end-2026 valuation convention. Comparing them with a November 11 quote leaves a short stub-period approximation.
The main terminal calculation grows 2030 FCF at 3%, keeping its 2030 reinvestment burden. This is conservative if capital intensity falls promptly as growth slows. A sensitivity test resets terminal capex to the 4% floor while holding the other cash assumptions fixed: it raises base value by $20.37 to $202.81 per share, and high value by $53.29 to $252.05. That favorable sensitivity holds the rest of the terminal asset and working-capital schedule fixed.
9. What $309.81 requires
Start with the trailing cash reconciliation:
8,422-1,104-469-412=$6,437 million.
The $412 million is trailing stock-compensation expense. Reserving that amount is an owner-cash convention intended to avoid giving shareholders both free stock compensation and a permanently fixed share count. It is not the exact future cash required to offset dilution.
The 10-Q cover reports 913.770316 million shares outstanding on October 14, so the normalized starting figure is:
f_0=6,437/913.770316=$7.04444.
Let FCF/share rise linearly from that starting point to an unknown 2030 value X. With four annual periods, equity discount rate r and terminal growth g:
P=Σ_(t=1)^(4) (f_0+(X-f_0)t/4) / ((1+r)^t) + (X(1+g)) / ((r-g)(1+r)^4).
The workbook solves this algebraically, with no goal-seek output hidden as a fixed input. At $309.81, 9% and 3%, it requires $21.3233 in 2030, or $19.4846 billion at constant shares. That represents about 31.9% annual growth from the normalized starting cash flow. Approximately 83.7% of the implied present value comes from the terminal value.
| Equity discount rate | 2% terminal growth | 3% terminal growth | 4% terminal growth |
|---|---|---|---|
| 8% | $20.74 | $17.54 | $14.24 |
| 9% | $24.52 | $21.32 | $18.03 |
| 10% | $28.39 | $25.20 | $21.91 |
| 11% | $32.34 | $29.16 | $25.88 |
These outcomes are sensitive to the required return. At 8% discount and 4% terminal growth, the required endpoint falls to $14.24, much closer to the high operating case. A lower required return can support the stock without assuming every factory fails or succeeds identically.
At the base operating case’s 2030 cash conversion, the $19.5 billion requirement corresponds mechanically to roughly $52.6 billion of sales. This sensitivity holds cash conversion fixed for the arithmetic. In practice, changes in sales also affect capex, working capital, margins and capacity. It nevertheless shows why the old $45 billion capacity statement does not, by itself, justify the share price.
The valuation also cannot uniquely allocate the price to fabs. Investors may assign value to stronger pricing, share gains, acquisitions, repurchases, a lower risk premium or better eventual cash conversion. The reverse DCF makes the total cash requirement visible; it does not identify which belief the market holds.
Silicon Labs and the latest borrowing
The analysis cannot stop at September’s balance sheet. TI agreed in February 2026 to acquire Silicon Labs for $231 per share in cash, with approximately $7.5 billion enterprise value and closing expected in the first half of 2027. Enterprise value is not the exact equity cash consideration. Management identified about $450 million annual manufacturing and operating synergies within three years of closing; that is not guaranteed FCF.slab
On November 9, TI issued $2 billion of notes in four $500 million tranches at coupons of 5.000%, 5.350%, 5.500% and 5.750%. The annual gross coupon is $108 million. The announced use is acquisition consideration and related fees.notes
Before fees and other cash movements, adding the issuance to September’s balance sheet increases both gross debt and cash/investments by $2 billion. It does not increase net debt by $2 billion. The workbook shows this financing bridge.
The organic valuation assumes zero incremental NPV from the acquisition, excluding the purchase/financing costs and acquired cash flows together. This is a neutral transaction assumption. The calculation leaves Silicon Labs’ earnings unchanged. A fully combined valuation would require a dedicated purchase-price, financing, synergy, integration and acquired-cash-flow model. Nor should an analyst simply add the promised synergies to the organic FCF while omitting their purchase cost.
Because the DCF discounts post-financing equity cash flow, it does not subtract net debt again. Cash and its associated other income remain in the modeled financing position; no surplus-cash premium is added.
10. What would change the conclusion
The favorable fab conclusion would weaken if full-utilization sales capacity per dollar invested were closer to 0.60 than 0.80, if the share of genuinely new sales were lower, or if equipment arrived substantially before demand. In the base margin framework, the 0.60 capital-efficiency case at 75% loading is close to the illustrative cost of capital even after incentives.
The valuation conclusion would improve with sustained evidence of organic sales and margins above the central forecast, especially if the capex/growth relationship delivers the promised flexibility. Strong quarterly revenue helps, but a more persuasive record would show several years of cash generation after equipment spending and working-capital requirements.
These disclosures would narrow the estimates:
- New-fab revenue or output, excluding transfers and foundry insourcing, alongside equipment loading and qualification progress against capacity claims.
- Capital additions and commissioning dates by asset class, including an identifiable CIP balance.
- CHIPS collections reconciled to receivables, deferred income, tax effects and asset-basis reductions.
- Recurring FCF after incentives, with the cost of dilution and growth reinvestment visible.
- The economics of the Silicon Labs transaction after financing and integration costs.
TI has demonstrated that 300mm analog manufacturing can support a competitive cost structure. The latest results also show that the spending cycle is beginning to release cash. The unresolved investment question is how much incremental profit the new capital produces after allowing for transferred revenue and time. The stock-market question is harder still: whether that profit becomes enough lasting per-share cash flow to meet a price that already anticipates a substantial expansion.
Appendix A. Three primary-document verifications
| Headline | Reconstruction | Primary verification |
|---|---|---|
| $17.238 billion capex, 2022–2025 | 2,797 + 5,071 + 4,820 + 4,550 | Original 2023 10-K cash-flow statement and FY2025 10-K p29; XBRL tag PaymentsToAcquirePropertyPlantAndEquipment. |
| $8.422 billion trailing TI FCF | 9,896 − 2,578 + 1,104 | Q3 2026 10-Q p24 and independent issuer FCF reconciliation. Components also rebuilt from FY2025 + 9M2026 − 9M2025 statements. |
| $1.573 billion trailing CHIPS cash benefit | 469 cash tax offsets + 1,104 investing receipts | 10-Q p24 footnote and p5 cash-flow supplement. Tax offsets also rebuild as 335 + 380 − 246. |
The current share denominator is additionally checked against the 10-Q cover tag dei:EntityCommonStockSharesOutstanding, context c-2, identifier f-24. The formula above reproduces the model’s $21.32 reverse-DCF result.
Appendix B. Rebuilding and limitations
The workbook has dedicated sheets for reported inputs, assumptions, calculations and outputs. The case selector changes one forecast and its depreciation schedule. The fab table compares three individually specified analytic endpoints. The reverse-DCF sensitivity is a live two-variable Excel data table.
The CSV collection includes historical and current inputs, with 352 historical figure-level source records and accounting-reclassification reconciliations. It also contains peer data, capital-management history and capacity disclosures, along with incentive reconciliations, scenario outputs and figure data. Source records include document, page or XBRL tag, URL, access date, units and whether a value is reported, inferred, estimated or unavailable.
All historical segment revenues reconcile to group revenue. Gross profit plus cost of revenue reconciles to revenue. Cash bridges, all scenarios and the reverse sensitivity were independently recomputed. The XLSX contains live formulas and cached calculated results. Formula recalculation and export were verified in the authoring engine; native desktop Excel behavior was not tested.
There is no reported fab-specific ROIC or exact CIP reconstruction. Earlier segment gross margins remain unavailable before the disclosed comparative expense tables. Company guidance, older capacity claims and this report’s assumptions carry their own labels. Public source links permit reconstruction without purchasing data; proprietary transcript files are not redistributed.
Sources and document locators
All sources accessed November 12, 2026. Printed filing pages are used unless a PDF-page index is explicitly stated. The raw source CSVs supply more granular metric-level mappings.
- TI Q3 2026 Form 10-Q, cover; pp 2, 4–7, 16, 20, 23–24. October 21 earnings release, earnings, quarterly cash flow and guidance. ↩
- TXN historical market data, November 11, 2026 closing reference $309.81; contemporaneous quote cross-check. TI’s issuer-hosted historical lookup exposed older observations but not the requested latest official close. ↩
- Original FY2023 10-K, cash-flow statement and non-GAAP reconciliation; FY2025 annual report, p29 cash flows. ↩
- FY2021 annual report, Note12 p52, Lehi asset purchase. ↩
- FY2017 annual report, selected financial data and financial statements; FY2019 report; FY2021 report; FY2023 and FY2025 filings above. Exact document URLs and tags for every historical input are in ti_history_sources.csv. ↩
- FY2017 annual report, selected financial data p15 and Note2 p34; ASU2016-09 and ASU2017-07 presentation changes. ↩
- TI Q3 2026 FCF reconciliation, p1, including tax-offset footnote; Q3 10-Q p24. ↩
- TI June 18, 2025 investment announcement, seven-fab and Sherman scope. ↩
- TI Q1 2022 call, pp 8–9, confirming the February framework. ↩
- February 2024 capital presentation, slides 6–7, 11, 17, including the preceding-year scorecard. The source timeline labels later attestations. ↩
- February 2025 capital presentation, slides 20–21, 29; company-hosted transcript, pp 4, 8, 11, attributing the flexible framework to August 2024. ↩
- February 24, 2026 presentation, slides 7, 16–21, 27; transcript, pp 16–19, capital intensity and depreciation. ↩
- October 21, 2026 call transcript, pp 4, 7, current spending range and tool timing. ↩
- Elliott’s original May 28, 2024 letter, investor-issued statement and scenario analysis. ↩
- Commerce/NIST final award announcement, December 20, 2024, award scope, milestone disbursements and workforce component. ↩
- IRS Advanced Manufacturing Investment Credit, current 25%/35% rules; Form3468 instructions, PartIV, qualification and construction conditions. ↩
- FY2025 10-K pp 22–23, 29, 36 and FY2024 annual report, pp 20–21, 27, 33; Q3 2026 10-Q pp 5, 24. ↩
- FY2025 10-K, Note2 p36 government incentives; tax footnote p42; supplemental asset tables pp 55–56. ↩
- Q3 2026 10-Q, Note9 p16. Tags GovernmentAssistanceAmountCumulativeCurrent and GovernmentAssistanceAmountCumulativeNoncurrent. ↩
- February 2025 capital presentation, slide20; differentiated full-build site scopes. Updated qualitative framework in February 2026 presentation. ↩
- April 16, 2015 shareholder-meeting remarks, p2, RFAB reported revenue and capacity. ↩
- TI Q2 2010 call, p13, equipment purchases; 2010 annual-report exhibit, manufacturing expansion context. ↩
- February 2025 capital presentation, slide18; repeated in February 2026, slide17. Illustration of the full chip cost. ↩
- FY2025 10-K Note2 p36 depreciation policy and Note11 p55 asset classes and lives. ↩
- Analog Devices FY2025 annual report, printed pp 8, 44, 46, 48; PDF pp 18, 54, 56, 58. ↩
- Microchip FY2026 10-K, F-4, F-5, F-7, F-29–30 and manufacturing discussion. ↩
- NXP FY2025 10-K, pp 8–9, 48, 64, 66–67, 86. ↩
- onsemi FY2025 10-K, pp 60–64, 80–83. ↩
- Infineon FY2026 results, November 10, 2026, pp 8, 13–15. Unaudited results release. ↩
- ADI Q3 FY2026; Microchip Q2 FY2027 exhibit; NXP Q3 2026; onsemi Q3 2026; Infineon release above. Detailed section locators in peers_latest_quarters.csv. ↩
- TI acquisition announcement; transaction presentation, slides 6, 8–9; Q3 2026 10-Q Note9 and p23. ↩
- November 9, 2026 8-K, Item8.01 p2; October 26 pricing announcement, stated use of proceeds. ↩
Supporting material
- Excel model ↗Sourced inputs, live calculations and reported outputs.
- Source and model data (CSV collection) ↗Data tables, source references and calculation exports.