Financial systems
Same loan, different price
Across 2,706 matched loan-quarter comparisons, the median difference between BDC marks was 0.251 points per $100 of face value.
BDCs usually report similar values for loans that can be matched on their disclosed terms. Across 2,706 cross-manager loan–quarter comparisons, the median difference between the highest and lowest mark is 0.251 points per $100 of face value. 47 comparisons, or 1.74%, exceed five points; 38 remain above five after allowing for the schedules’ displayed rounding.model
High marks can precede losses. Goldman Sachs Private Middle Market Credit II LLC valued the selected Pluralsight loan at 88.00 per $100 of face two quarters before the 2024 restructuring quarter, when it subsequently reported a $39.18 million borrower-level realized loss. Other cases were already marked substantially lower. The selected histories show that losses can follow high marks. Estimating how often that happens would require a broader sample of subsequent outcomes.pluralsight
The stock-market test is also inconclusive. Higher relative marks are associated with smaller discounts in the pooled observations, but that relationship largely disappears when Sixth Street is omitted. Estimates controlling for fund and quarter differences remain too imprecise to identify a reliable relationship.price
Public schedules often identify a loan’s borrower, lien, rate and maturity. The study matches loans with the same disclosed terms. The schedules may omit contractual rights or identifiers that would show whether two claims are legally identical.
1. Filings and loan coverage
The balanced window is March 31, 2023 through June 30, 2026: 14 quarter-ends. It contains 280 selected filings for 20 BDCs, with 138,762 principal-tagged XBRL records. Original schedule enrichment covers 15 BDCs and 103,961 positions. The final comparison file contains 18,037 holder–loan–quarters, including comparisons within one manager family. The cross-manager analysis uses 8,121 holder–loan–quarters, representing 13 funds, eight manager groups, 429 borrower keys and 941 disclosed-term instrument keys.coverage
The broad XBRL file records the tagged positions. The schedule file adds loan terms, units and footnotes. The matched file includes positions that passed the eligibility checks. Some raw records describe commitments or other investment types; some usable schedule rows were mis-tagged or absent from the straightforward principal extraction.
Some BDC schedules also contain syndicated or quoted debt. Level 3 identifies a valuation that uses significant unobservable inputs. BCRED’s November supplement expressly allows quoted and non-quoted investments within that category. The matched sample can therefore include quoted debt.bcredupdate
The SEC’s public BDC data page was updated October 31, 2026. It explicitly warns that extracted datasets can contain errors and are not substitutes for full filings. The collection uses those files as a discovery and extraction layer, then returns to original filings for terms and consequential exceptions.sec
The comparable quarterly statistics end in June 2026. Selected later checks include the September Equinox schedules and BCRED’s November 3 update. The evidence cutoff is November 12, 2026.
Coverage by holder
Every code below has 14 quarters in the broad XBRL collection. A dash indicates that the dataset lacks the corresponding enrichment or qualifying matches.
| Fund code | Enriched schedule positions | Cross-manager holder–loan–quarters | Quarters with such matches |
|---|---|---|---|
| ADS | — | — | — |
| ARCC | 12,628 | 600 | 14 |
| ASIF | 8,646 | 1,162 | 14 |
| BCRED | 13,075 | 1,291 | 14 |
| BCSF | — | — | — |
| BXSL | 6,325 | 276 | 14 |
| CGBD | 2,293 | 86 | 14 |
| FSK | 5,833 | 46 | 8 |
| GBDC | 18,762 | — | — |
| GSBD | — | — | — |
| GS_PRIVATE_II | — | — | — |
| HLEND | 8,147 | 1,048 | 14 |
| MAIN | 4,932 | — | — |
| OBDC | 4,551 | 458 | 14 |
| OCIC | 7,004 | 1,420 | 14 |
| OCSL | 3,837 | 355 | 14 |
| OTF | 2,820 | 443 | 14 |
| OTIC | 2,981 | 796 | 14 |
| TCPC | — | — | — |
| TSLX | 2,127 | 140 | 14 |
Source: filing catalog and coverage.csv. Counts show the positions captured by the extraction.
The listed cohort includes ARCC, FSK, OBDC, BXSL, GBDC and OCSL. It also includes TSLX, GSBD, MAIN, TCPC, CGBD and BCSF. The non-traded cohort comprises BCRED, Apollo Debt Solutions, HPS Corporate Lending Fund, Blue Owl Credit Income, Blue Owl Technology Income, Ares Strategic Income and Goldman Sachs Private Middle Market Credit II. Blue Owl Technology Finance, OTF, changes category during the window: its shares began trading June 12, 2025. Its earlier quarters do not receive a fabricated public share price.listing
GBDC and MAIN were enriched but produced no qualifying cross-manager comparisons under these rules. Five other collected funds were not brought into the full term-matched panel. Their absence reflects the dataset and the matching rules.
Aggregate financial coverage is also incomplete. The core file has 238 fund–quarters across 17 cohort funds, including 212 computed PIK-interest shares, 52 computed inclusive PIK shares, and 153 price/NAV observations. It contains 61 paired nonaccrual cost/FV percentages; a BCRED supplement adds 14 pairs, one with a fair-value upper bound. NAV-only supplements bring total net-asset coverage to 271 of 280 cohort fund–quarters. Thirteen additional financial-metric observations for another Goldman Sachs vehicle are supplied as supplemental data and excluded from these core totals.coverage
2. The matching decisions that determine the answer
Names first, instruments second
Names were normalized for punctuation and obvious formatting differences, with documented aliases used for supported name changes. A fuzzy screen generated 1,828 possible alias pairs; similarity alone did not authorize a merge. The top 500 borrower candidate groups, ranked by peak combined disclosed face, received name and identifier review. All 500 final top-ranked keys are covered by the saved review receipts. The review checked names and identifiers.review
Those reviewed names cover 321 of the 429 matched borrowers and 2,293 of 2,706 cross-manager loan–quarters. Eight reviewed groups carry warnings requiring legal-form or instrument guards. Smaller matched names outside the top 500 remain an explicit limitation; selected large-gap families also received additional source checks.
Instrument matching requires the same normalized borrower key and legal-form category, explicit lien, maturity month, benchmark family and spread—or fixed coupon—and disclosed positive PIK-rate signature. “Inc.” and “Corp.” are not silently treated as the same legal entity; “Corp.” and “Corporation” are formatting equivalents. Where both filings supply exact maturity days or rate floors, conflicting values reject the candidate group. A missing floor remains unknown.
The baseline uses USD face and USD fair value, positive principal, nonnegative fair value and at least $1 million of face per source position. Explicit foreign-currency indicators override misleading USD tags. Explicit revolvers, delayed-draw facilities, bonds, equity and structured finance do not enter the term-loan comparison. A unitranche label is not automatically translated into ordinary first-lien debt.
Records above 200 of fair value per 100 of face are withheld for unresolved scale or basis review. The cutoff screens for potential unit or denominator errors. The matching rules use 200 as the review threshold.
Rows with disclosed special priority or attached unfunded-commitment language are excluded conservatively. The language can refer to an associated commitment, so this screen can remove a funded holding. Before applying that filter, the model checks whether one fund reports multiple positions with the same proposed key whose marks differ by more than 0.25 points. It removes that fund’s ambiguous group; other holders can remain comparable if enough survive. It does not select whichever row gives a convenient comparison.
These choices address a real identification problem. A borrower can have two loans with the same spread and maturity but different collateral, payment priority, amendment rights or restructuring treatment. Reset conventions and optional PIK rights are not fully captured by the comparison key. The remaining pairs still require that qualification.
What a mark and a gap mean
For each holder, the model combines eligible source rows within each accepted instrument-quarter.
Mark = 100 × (total fair value in USD ÷ total face in USD)
A mark of 95 means $95 of reported fair value per $100 of current principal. It does not mean a five-percent lifetime investment loss. Cost, original principal, capitalized PIK, repayments and replacement securities can all differ from the denominator.
Dispersion is the maximum holder mark minus the minimum holder mark in that loan-quarter. The main distribution gives each loan-quarter one observation. The sample requires at least two manager groups. Funds with the same manager share a manager group.
The bounds use the figures’ displayed precision. A figure rounded to $0.1 million has a larger uncertainty interval than one rounded to $1,000. Conservative lower and upper mark bounds move face and fair value in opposite directions. A gap is “rounding-confirmed” only if the smallest possible high–low difference still exceeds five points. The bounds reflect rounding of the disclosed inputs.
Two source defects that changed the extraction
HPS’s March 2026 filing places many visibly monetary debt par amounts under InvestmentOwnedBalanceShares. Reading the main schedule’s debt sections, maturity, currency and note (1) supports recovering 639 additional USD debt rows. The correction preserves the original tag and share unit, records why the visible monetary interpretation prevails, and excludes true equity units and structured finance.hps
Goldman Sachs Private Middle Market Credit II’s March 2023 schedule displays principal in thousands while corresponding principal tags omit that scale. The correction receipt covers 270 original facts: 261 visibly USD rows and nine with CAD or GBP indicators despite USD-tagged units. It maps 269 broad-extraction records and also records an extra Diligent fact lost through a repeated identifier. This repair is material to the historical Sweep calculation, but the Goldman vehicle is not in the main term-matched comparison panel.gsscale
These are documented data defects and normalization decisions. They are not findings about a manager’s valuation intent.
3. Finding one: typical disagreement is small, with a persistent tail
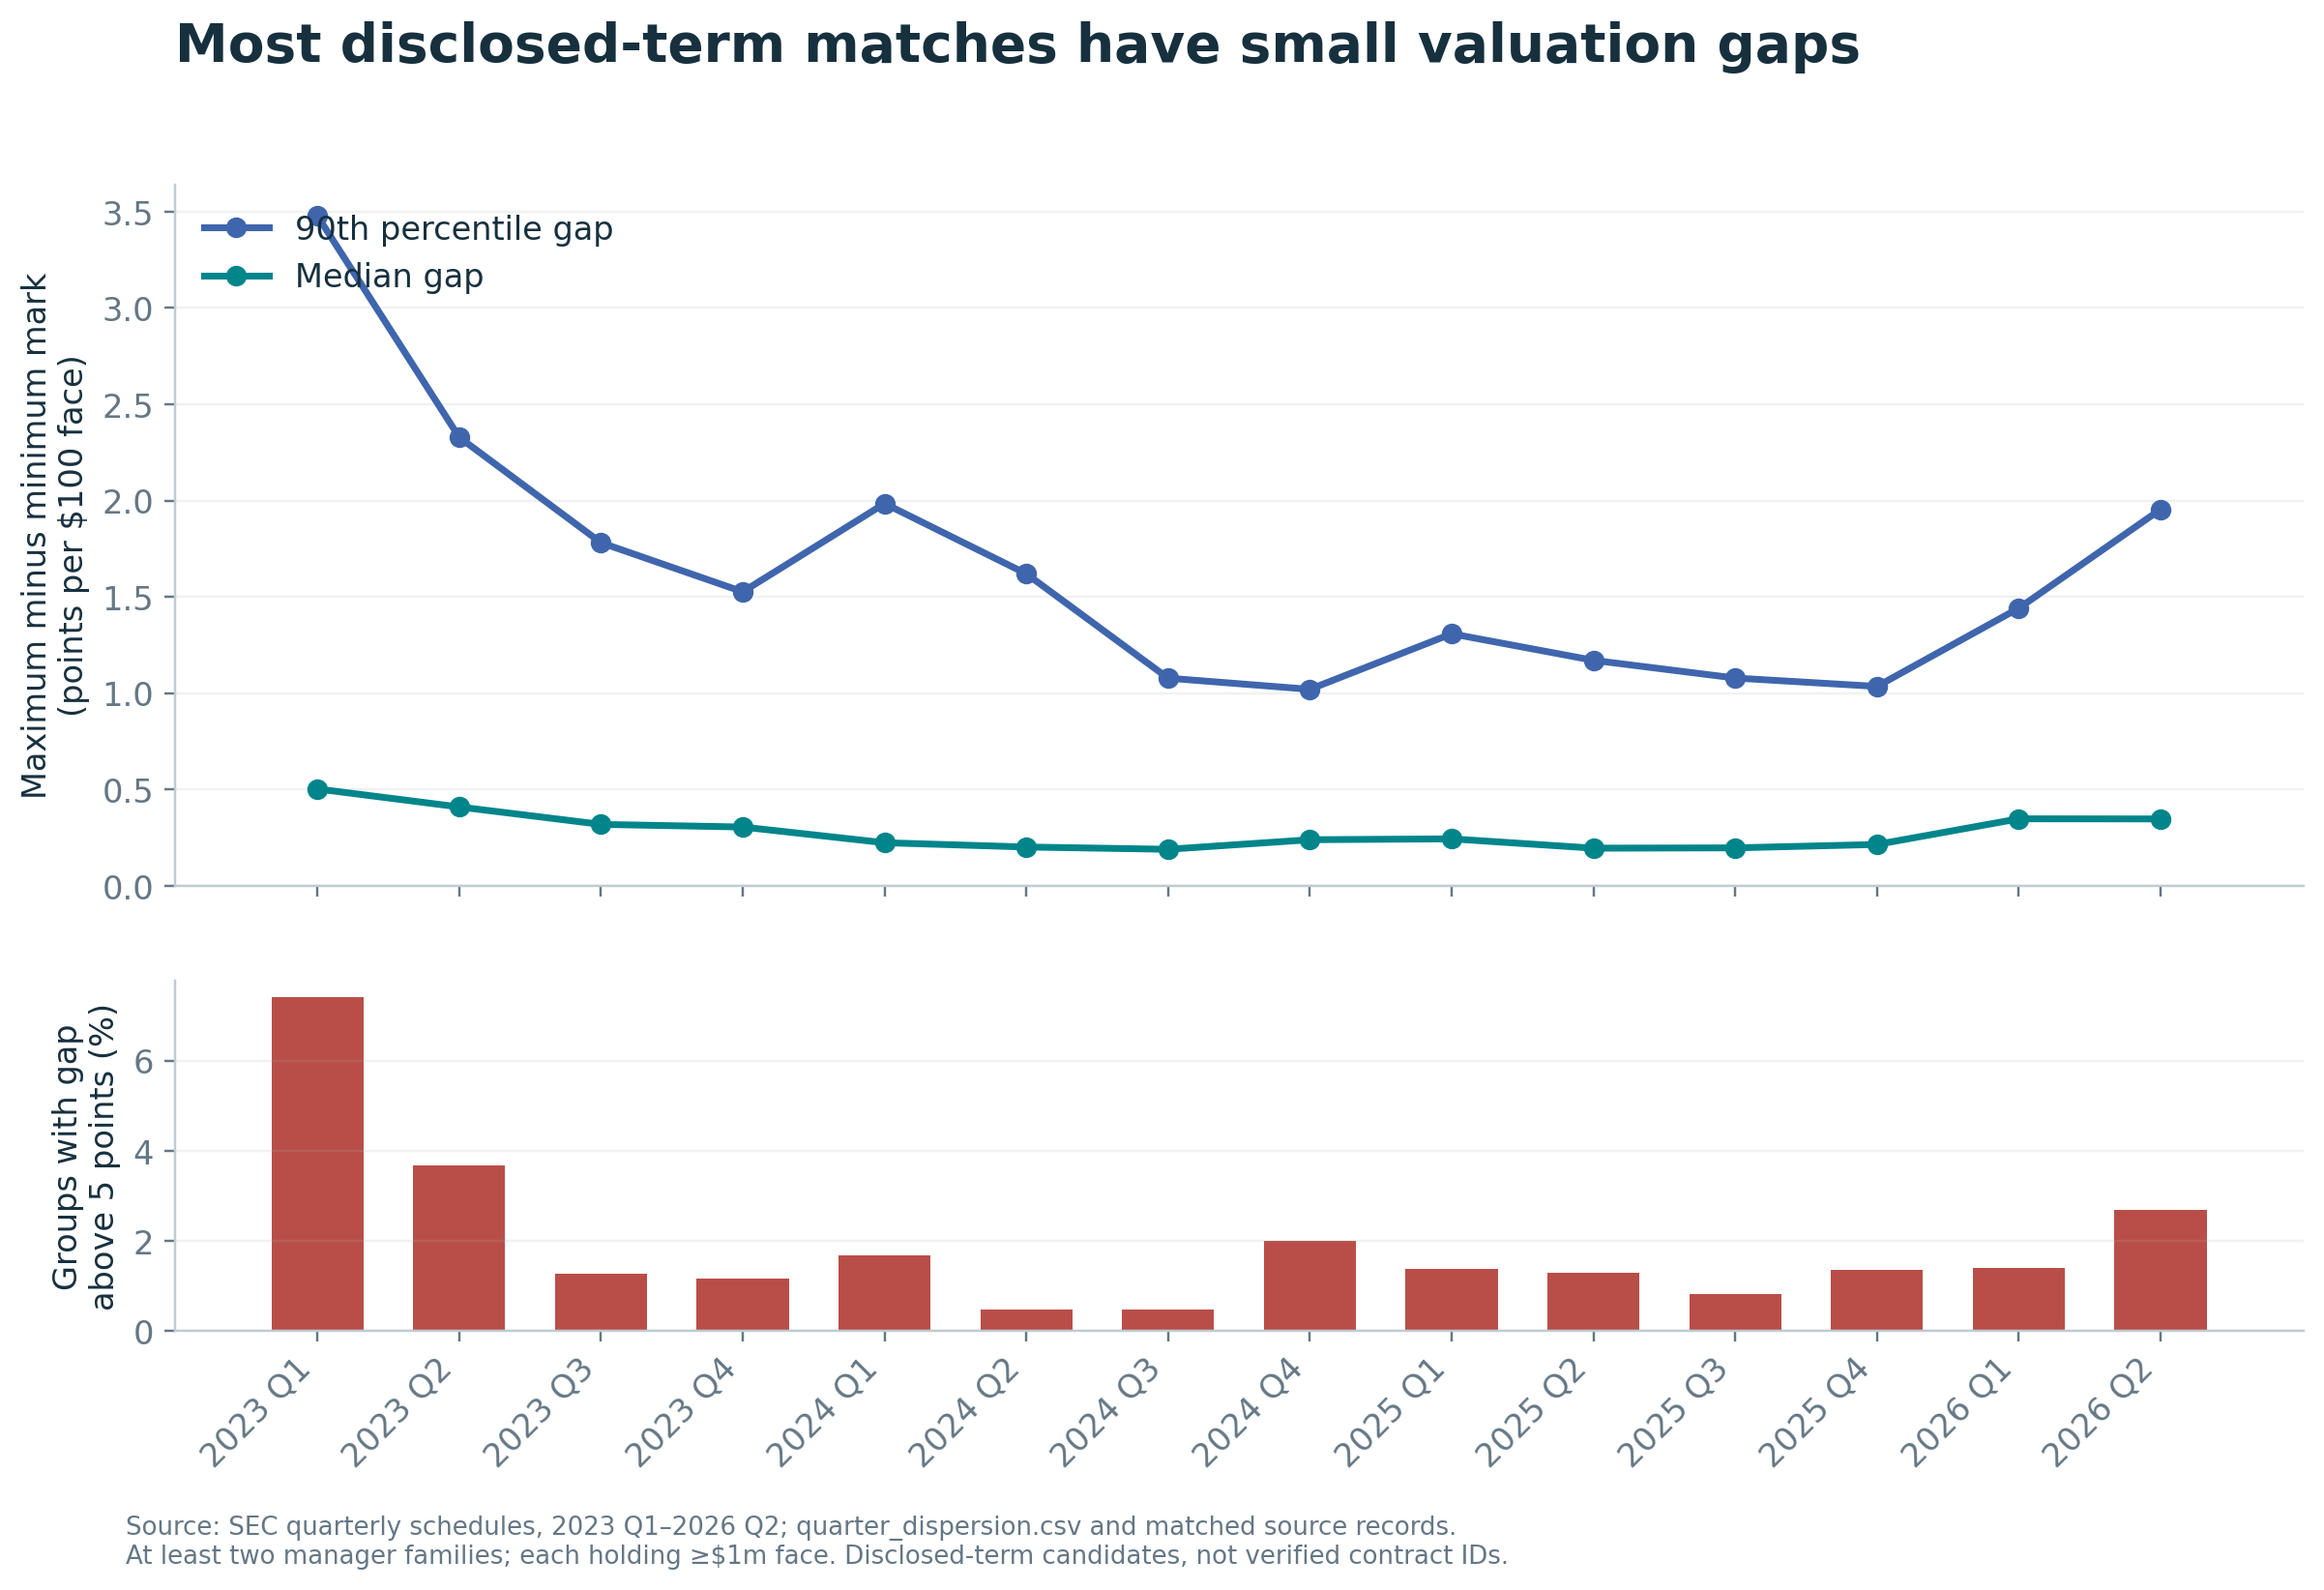
Across the baseline 2,706 cross-manager loan–quarters, the median gap is 0.251 points, the 90th percentile is 1.620 points, and 47 gaps exceed five points. The rounding-confirmed count is 38, or 1.40% of the full baseline. Nine gaps can fall to five points or below at the reported precision.model
There are also 4,510 loan–quarters involving only funds within one manager group. Their median gap is approximately 0.000426 points. Including them in the principal statistic would largely measure agreement within shared management arrangements. They remain in the downloadable dataset so the effect is visible.
Quarterly distributions change. The median gap is about 0.50 points in March 2023, 0.19 in September 2024 and 0.35 in June 2026. The proportion above five points is 7.41% in the first quarter and 2.69% in the last. These are changing matched samples, so the chart is not proof that the same fixed set of loans converged over time.
The conclusion survives reasonable size thresholds:
| Minimum face per source position | Cross-manager loan–quarters | Median gap, points | Gaps above five points | Share above five | Rounding-confirmed count |
|---|---|---|---|---|---|
| $0.1m | 2,774 | 0.251 | 47 | 1.69% | 38 |
| $1m | 2,706 | 0.251 | 47 | 1.74% | 38 |
| $5m | 2,307 | 0.251 | 35 | 1.52% | 32 |
Source: sensitivity.csv; matching is rebuilt at each threshold. All gaps are points per $100 of face.
Restricting the baseline to the manually reviewed borrower keys leaves 2,293 groups, a 0.262-point median gap, and 43 gaps above five points, or 1.88%. This does not eliminate instrument uncertainty, but it shows that the small typical gap is not created solely by the unreviewed smaller names.review
Agreement is not proof of accuracy. Several holders can use similar information and reach similar values that later prove too high or too low. This finding measures dispersion; it does not validate marks against a sale price or final recovery.
4. Finding two: surviving large gaps deserve contract-level investigation
Equinox: a real reported difference, with important unknowns
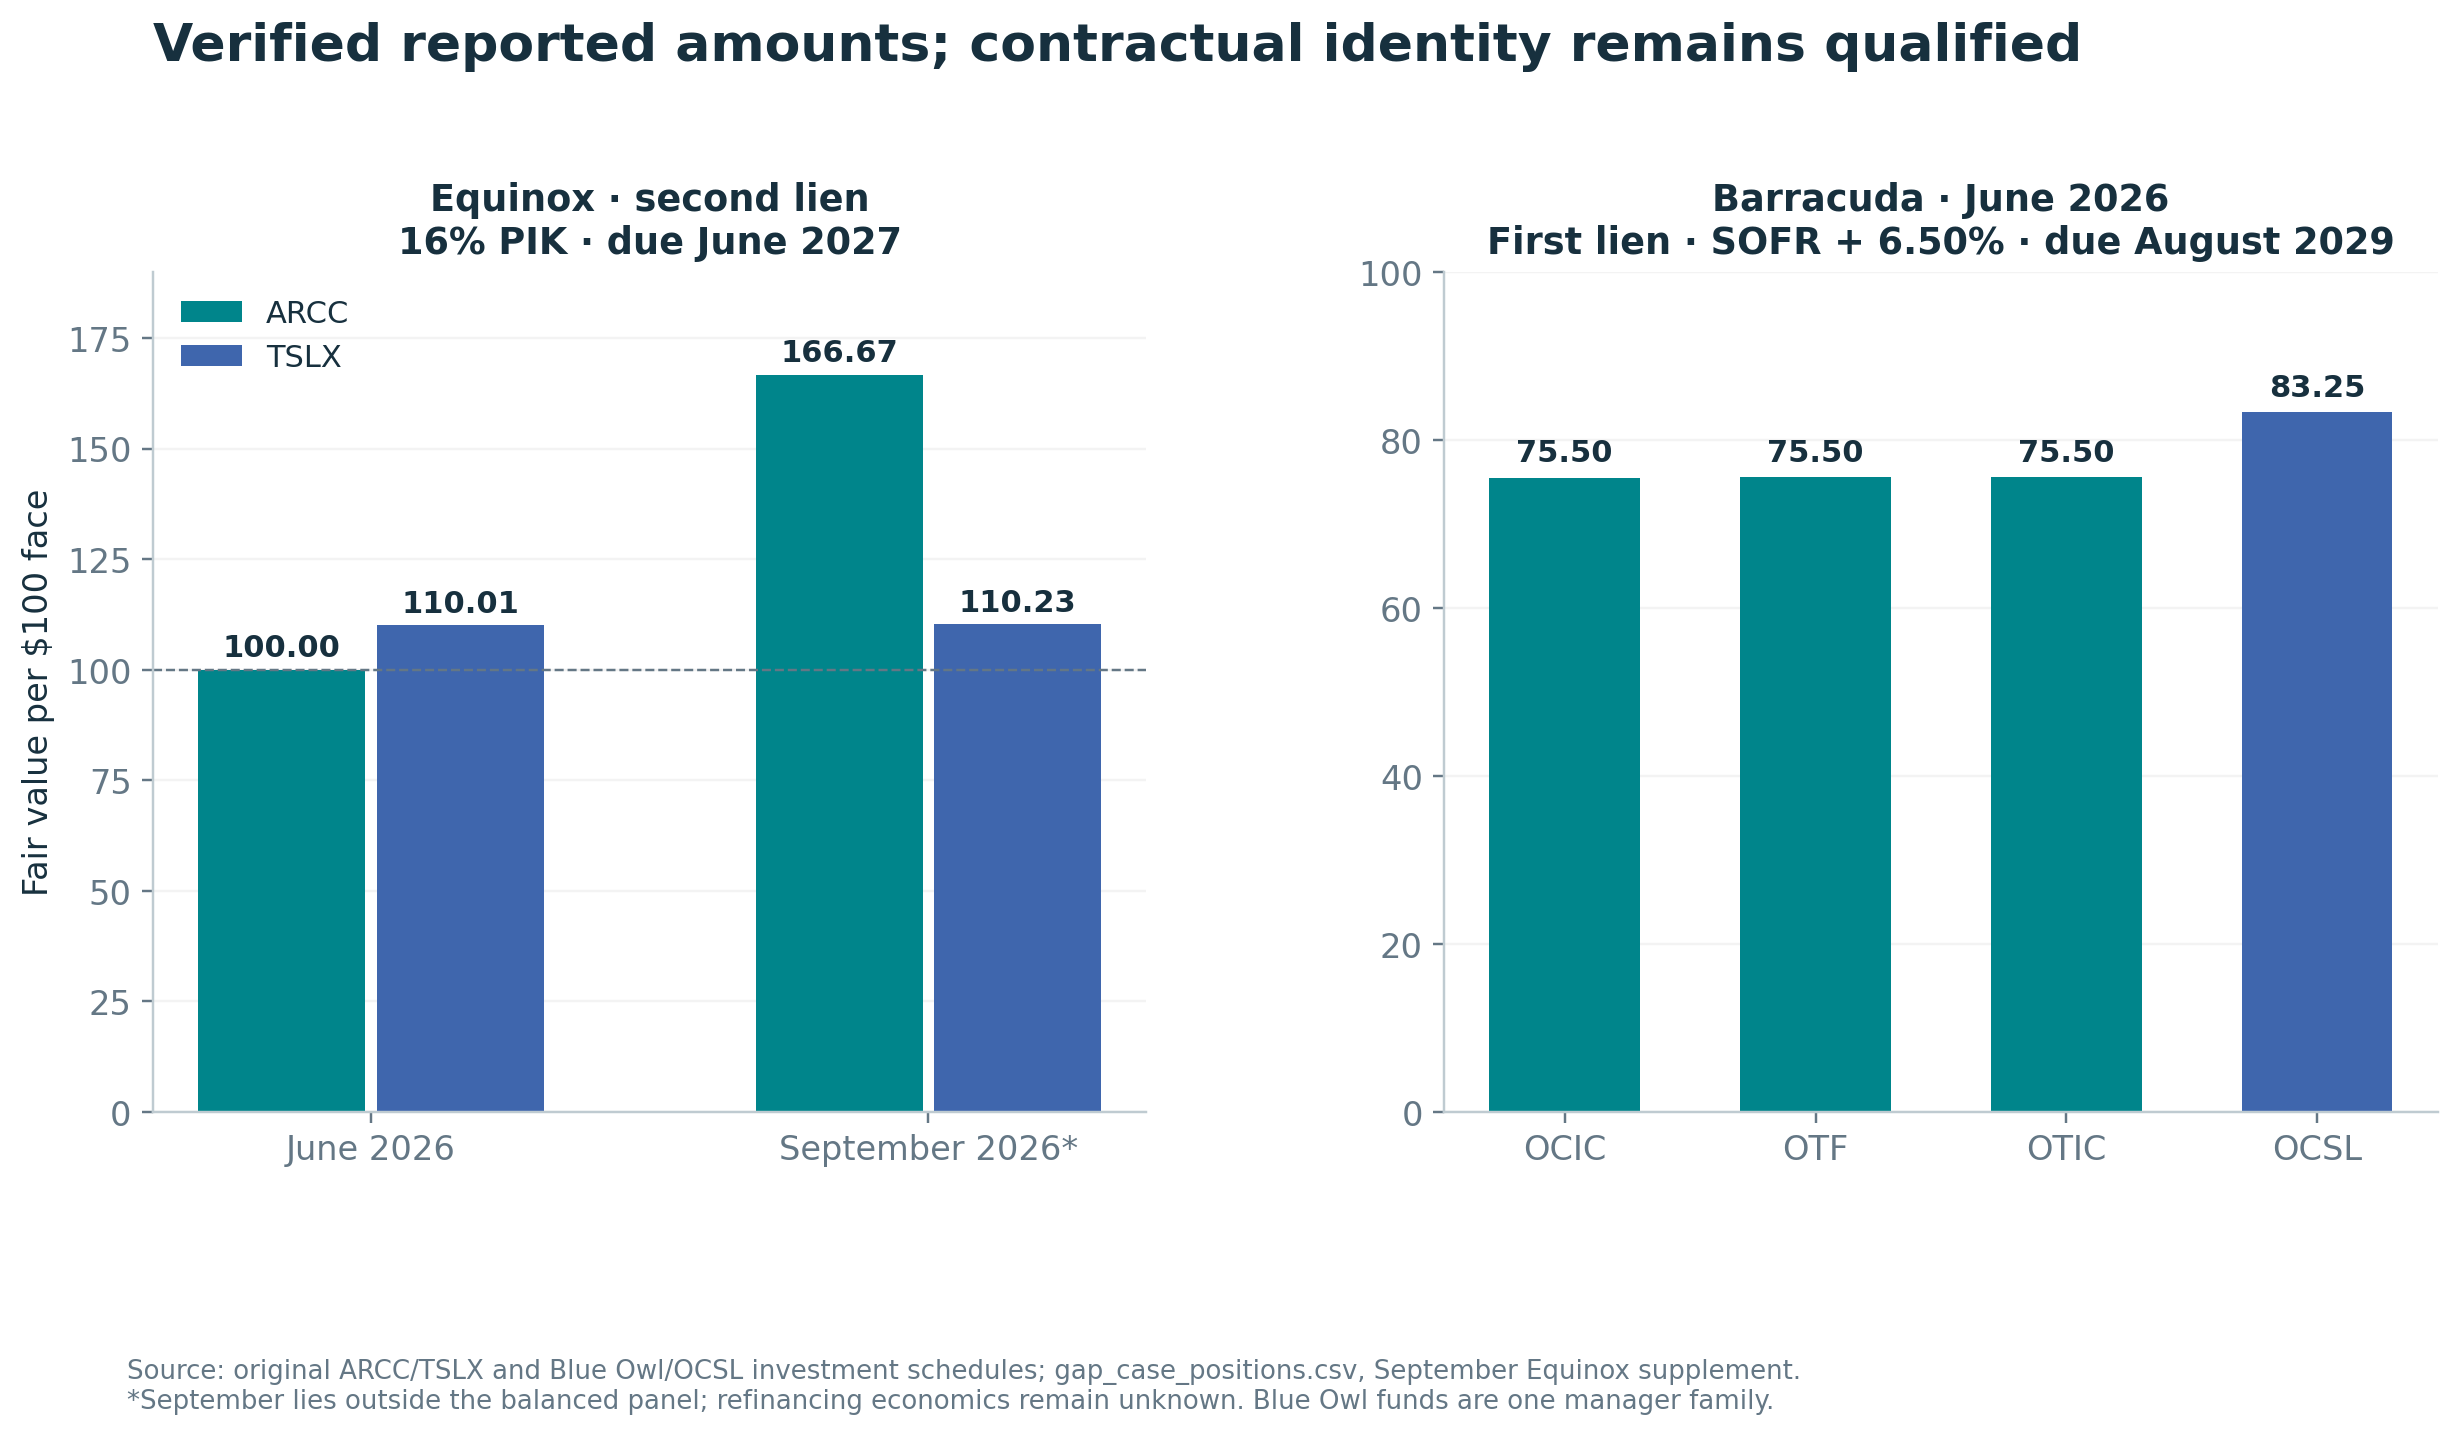
At June 30, 2026, ARCC reports an Equinox second-lien position with a 16% PIK rate and June 2027 maturity at $4.9 million face and $4.9 million fair value, or 100.00. TSLX reports the same published lien, rate and maturity at $2.968 million face and $3.265 million fair value, or 110.0067. The arithmetic gap is 10.0067 points; its conservative rounding minimum is approximately 7.91 points. These small positions disappear under the $5 million threshold, which is why that sensitivity matters.equinox
The newer September schedules make the comparison more striking, but do not settle its economics. ARCC reports $5.1 million face and $8.5 million fair value, or 166.67; TSLX reports $3.088 million face and $3.404 million fair value, or 110.23. That is a 56.43-point arithmetic difference outside the balanced panel. The original rendered rows, tags and ARCC borrower subtotal agree with those amounts.equinoxsep
A November 2 issuer announcement confirms a recent Equinox refinancing involving Ares and Sixth Street. It does not disclose the settlement value of each old claim, call economics or a complete bridge between these two reported holdings. Those facts remain unknown. The report therefore identifies an unresolved comparison; it does not describe a proven identical contract, a loss, or an erroneous valuation.equinoxnews
Barracuda: compare the correct spread
At June 2026, some Blue Owl Barracuda positions have SOFR plus 4.50%, while others have SOFR plus 6.50%. Comparing OBDC’s approximately 67.54 mark on the former with OCSL’s 83.25 on the latter would overstate same-term disagreement.
The valid disclosed-term candidate is the first-lien, SOFR-plus-6.50%, August 2029 group. OTF, OCIC and OTIC report marks near 75.50. OCSL reports 83.2470, from $12.860 million fair value divided by $15.448 million face. The surviving gap is approximately 7.75 points, with a conservative rounding minimum above 7.73. All positions exceed $5 million of face. The three Blue Owl funds represent one manager group.barracuda
Why some larger-looking comparisons were rejected
An apparent Newfold gap in December 2024 fails because visible floor footnotes differ: HPS reports 0.75%, while BCRED reports 1.00%. Certain Marcone comparisons similarly pair 1.75% with 0.75% floors. The reported floor differences exclude those cases from the matched sample.floors
A June 2024 Material Holdings comparison also fails. CGBD reports both a $1.688 million-face position with $0.677 million fair value and another $6.940 million position at par, alongside restructuring disclosure. The shared published rate and maturity do not identify which restructured claim corresponds to another holder’s position. The nonaccrual and commitment footnotes must be read separately. The model excludes this candidate because it cannot resolve the two CGBD rows.material
The practical decision is to investigate economic rights before explaining a wide gap. The reported numbers can be verified while the claim identity remains unresolved.
5. Finding three: manager differences exist within a limited comparison set
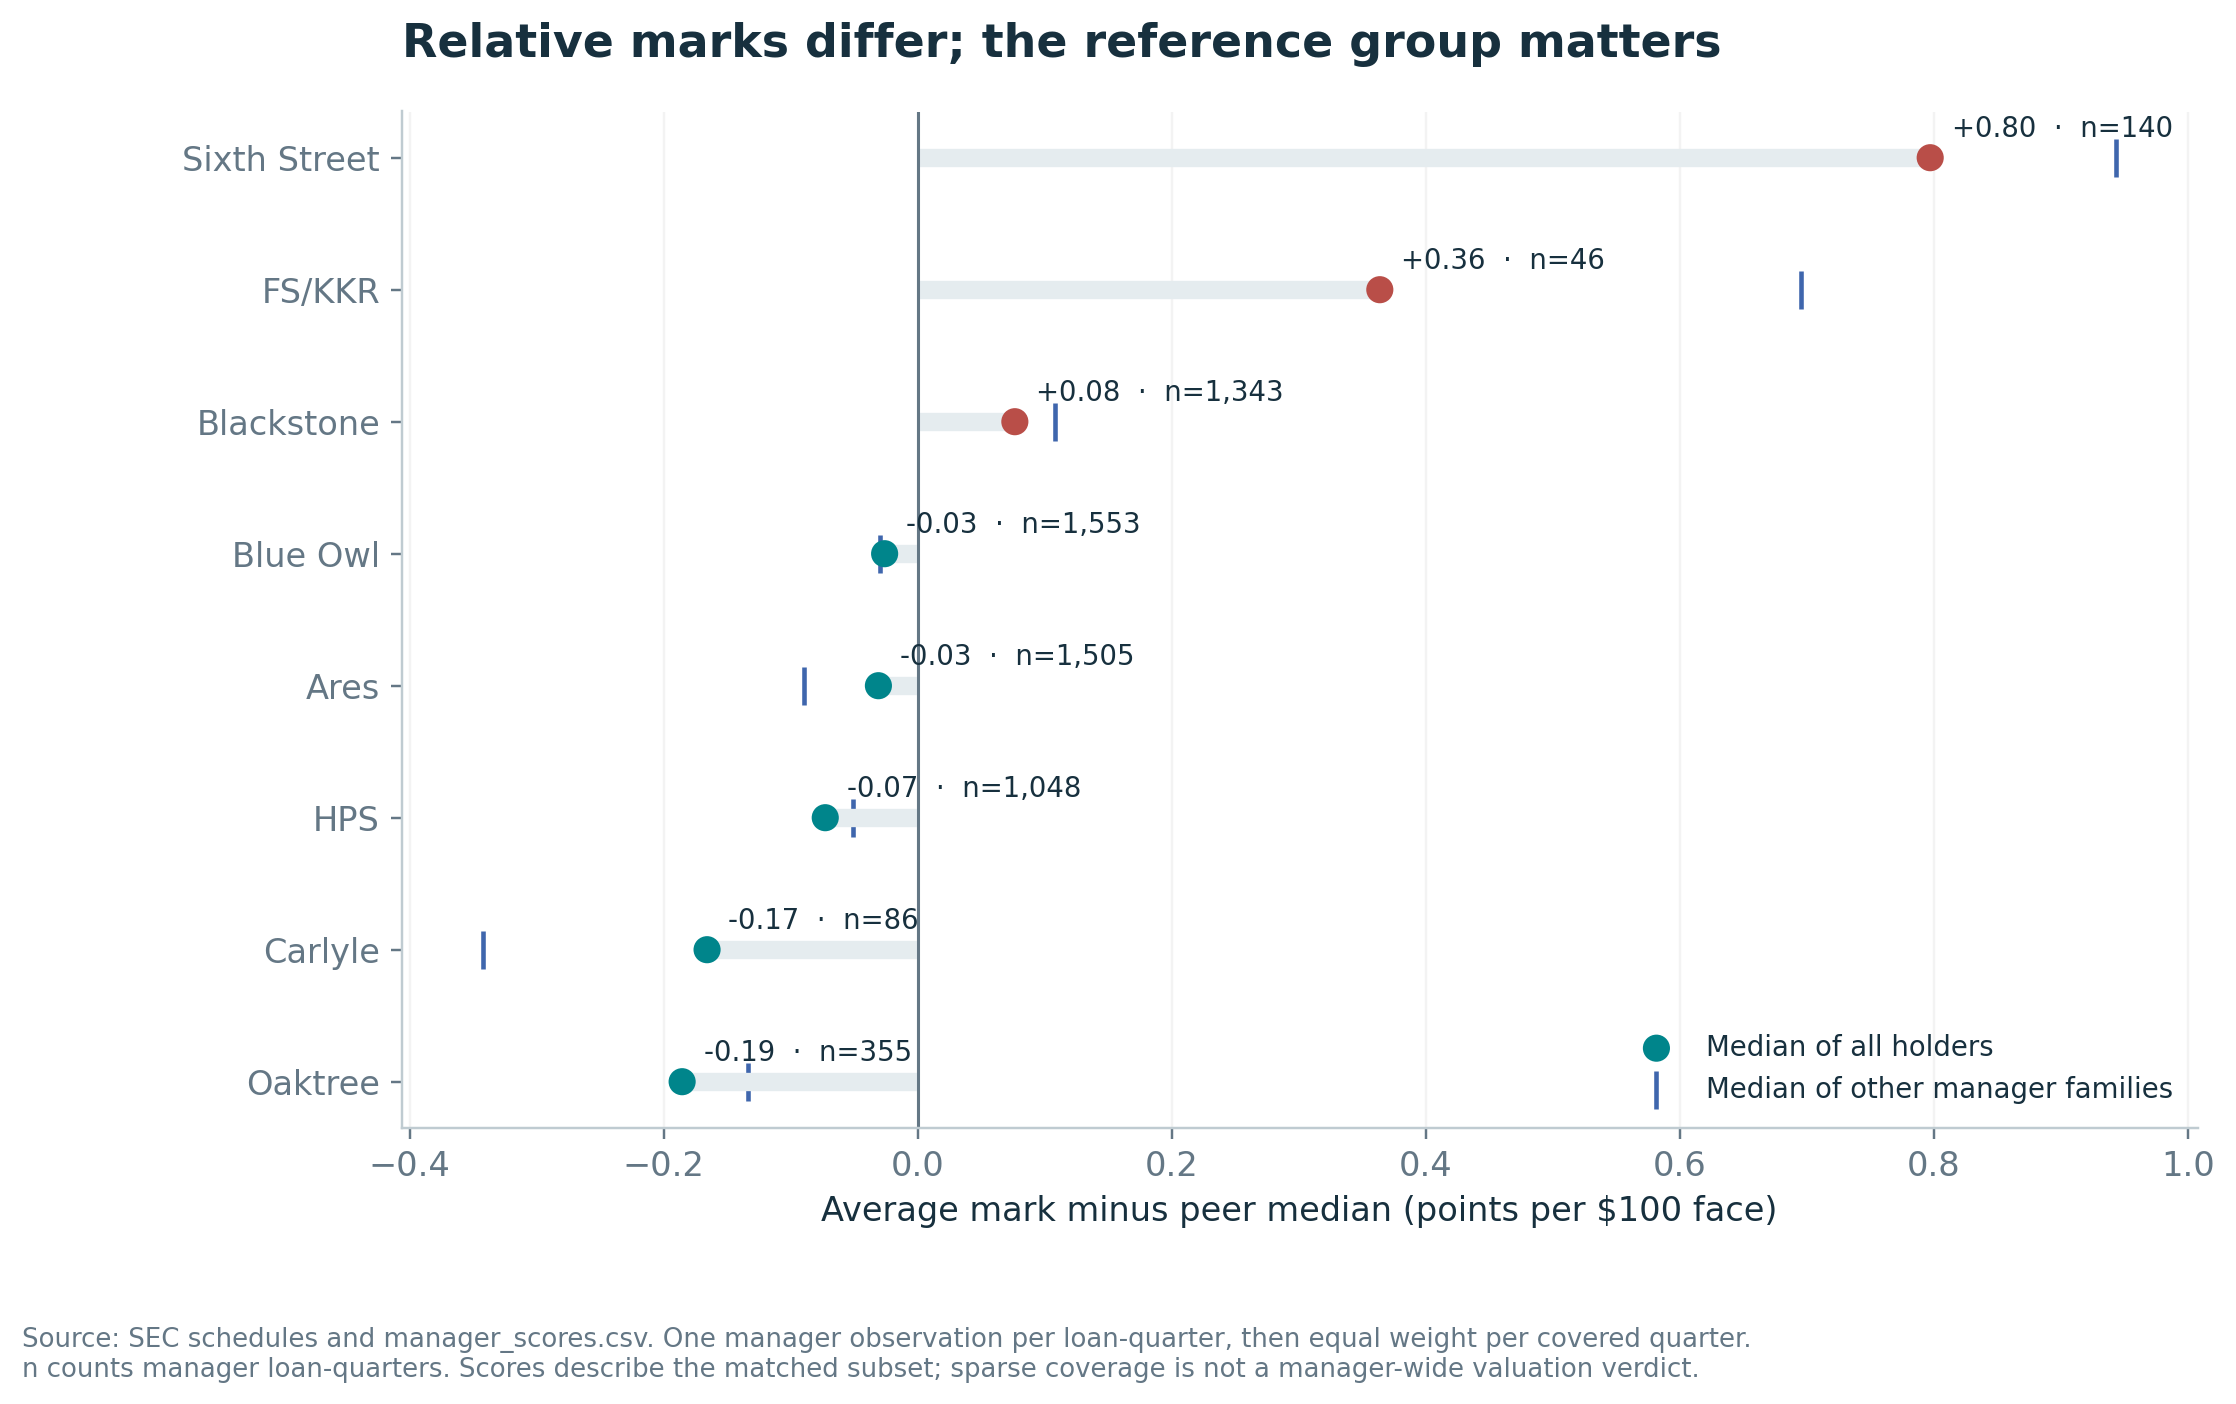
The principal manager score starts with each holder’s mark minus the median of all holders of the candidate loan in that quarter. Affiliated funds are averaged within manager–loan–quarter; loans are then averaged within each manager-quarter, followed by an equal average across covered quarters. This prevents an increase in a manager’s number of funds or late-period matches from mechanically dominating its score.model
| Manager group | Versus median holder, points | Versus other managers, points | Covered quarters | Manager–loan–quarters |
|---|---|---|---|---|
| Sixth Street | +0.797 | +0.944 | 14 | 140 |
| FS/KKR | +0.364 | +0.696 | 8 | 46 |
| Blackstone | +0.077 | +0.108 | 14 | 1,343 |
| Blue Owl | -0.026 | -0.029 | 14 | 1,553 |
| Ares | -0.031 | -0.089 | 14 | 1,505 |
| HPS | -0.073 | -0.051 | 14 | 1,048 |
| Carlyle | -0.166 | -0.342 | 14 | 86 |
| Oaktree | -0.185 | -0.134 | 14 | 355 |
Source: manager_scores.csv; positive values mean higher reported marks within the matched subset. “Other managers” first takes a median within each other manager group and excludes the manager being evaluated.
Sixth Street’s +0.797-point principal score is the largest in this sample, while Oaktree’s −0.185 is the lowest. The scores describe the holdings each manager contributed to the sample. Sixth Street has 140 manager–loan–quarters; FS/KKR has only 46 across eight quarters. The comparison portfolios differ considerably.
The alternative reference matters. FS/KKR’s score rises from +0.364 versus the median holder to +0.696 versus other managers; Sixth Street rises from +0.797 to +0.944. A holder median can be influenced by multiple funds from one family. Showing both definitions makes that influence explicit.
Comparing the accuracy of managers’ marks would require comparable claims and subsequent cash flows for a representative set of loans.
6. PIK income and nonaccrual
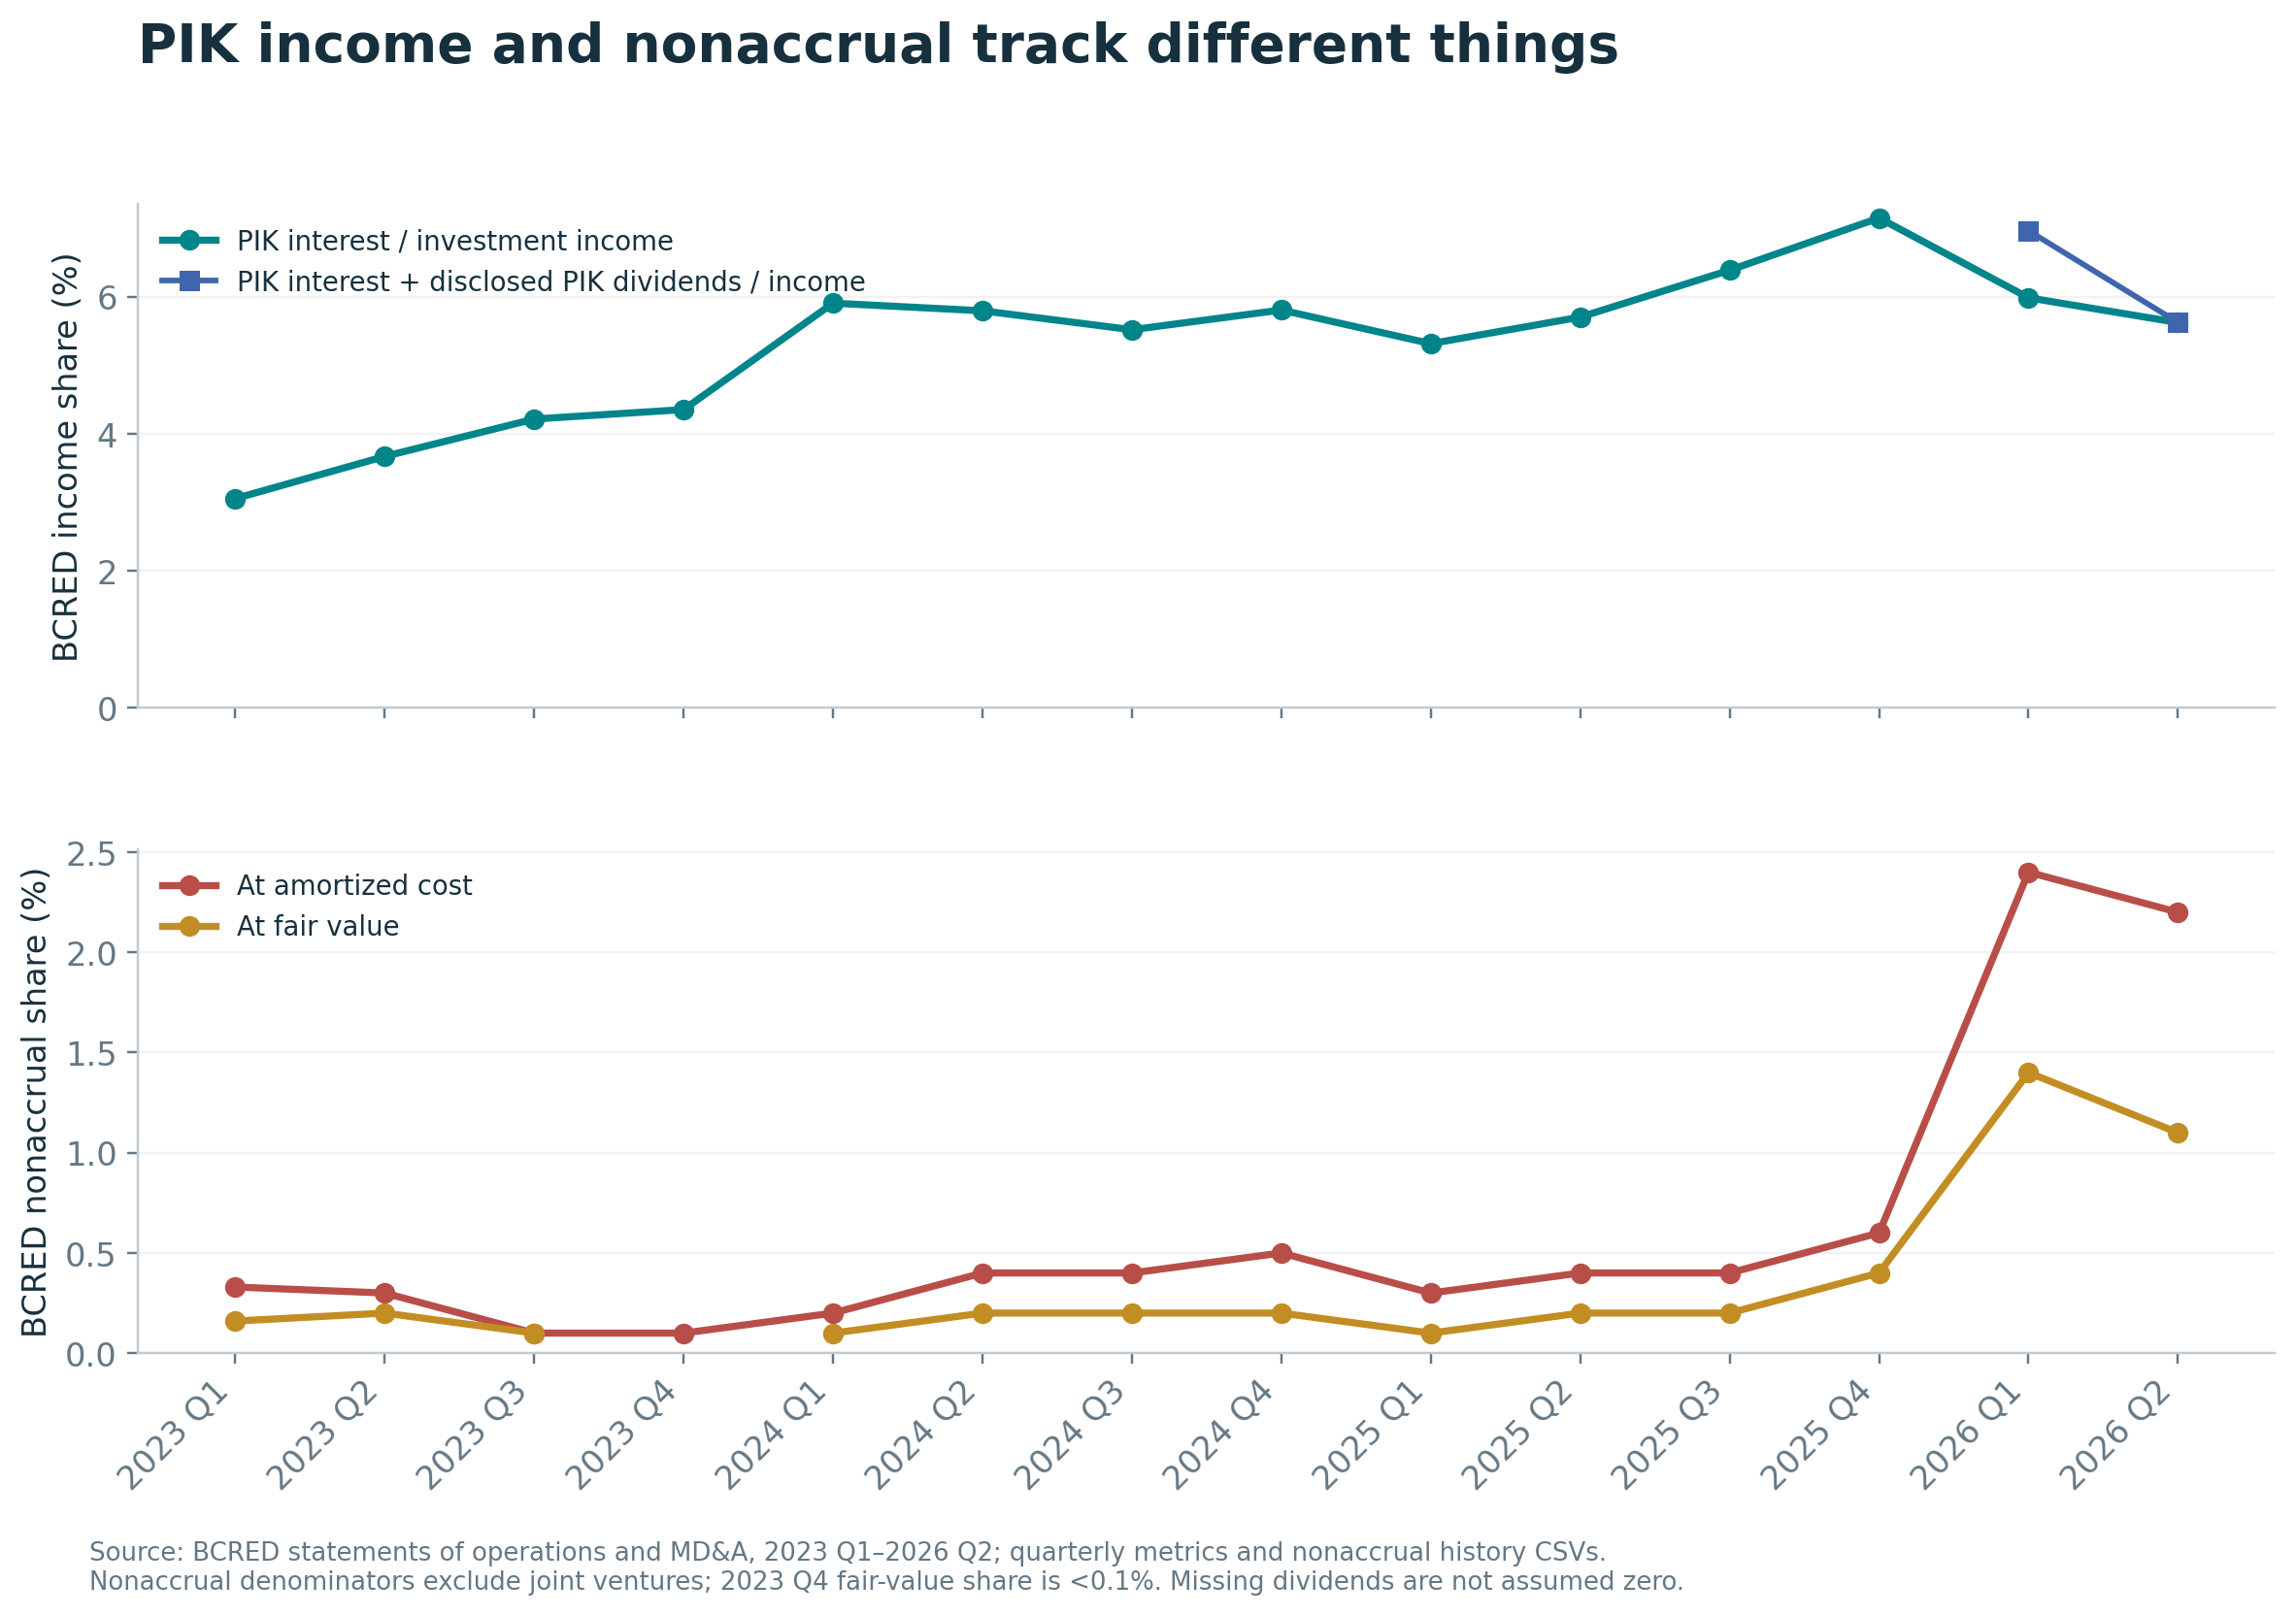
Payment-in-kind income is recognized income that is not received as current cash. The model uses income-statement PIK amounts, rather than treating a cash-flow-statement adjustment or capitalized principal movement as interchangeable income. Quarterly flows are taken directly where available; otherwise they are derived from fiscal year-to-date differences. A fourth quarter is full year minus nine months, with each issuer’s fiscal calendar respected.income
The study calculates two PIK ratios.
- PIK-interest share: recognized PIK interest divided by total investment income.
- Inclusive PIK share: recognized PIK interest plus PIK dividends where observed, divided by total investment income.
Missing dividends are not zero. Consequently, inclusive coverage is much narrower than interest-only coverage. The chart leaves the earlier inclusive BCRED series blank instead of drawing a continuous line based on assumed zeros.
For BCRED, interest-only PIK rises from $40.820 million / $1,335.742 million = 3.06% in 2023 Q1 to $140.766 million / $1,968.681 million = 7.15% in 2025 Q4, then falls to $102.974 million / $1,830.865 million = 5.62% in 2026 Q2. The Q4 calculation is independently reconstructed from annual and nine-month statements.bcredincome
BCRED’s November 2026 supplement reports 7.8% for 2025 Q4, using interest and dividends. The annual filing discloses $13.873 million of PIK dividends. The nine-month dividend figure needed to reconstruct Q4 remains unavailable. BCRED’s 7.8% uses interest and dividends, while the 7.15% calculation uses interest alone.bcredupdate, bcredincome
The dividend component can materially change the ratio elsewhere. ARCC’s June 2026 quarter has $58 million of PIK interest and $63 million of PIK dividends against $768 million of investment income. Interest alone is 7.55%; the inclusive ratio is 15.76%. The choice of numerator changes ARCC’s ratio by 8.21 percentage points.arccincome
Nonaccrual measures whether a fund continues to accrue interest. BCRED reports 0.6% at amortized cost and 0.4% at fair value at December 2025; 2.4% and 1.4% at March 2026; and 2.2% and 1.1% at June 2026, using portfolio denominators that exclude joint ventures. Its November update reports September figures of 2.7% and 1.7%, respectively, outside the balanced panel.bcrednonaccrual
The cost and fair-value measures should travel together. A distressed investment’s reduced fair value can make its contribution to the FV-based nonaccrual percentage much smaller than its contribution at cost. Neither ratio alone measures all troubled exposure. Conversely, PIK can be part of an original contract and can occur before or without a missed payment.
First appearances of PIK terms
The BCRED/BXSL transition screen finds 53 holder-instrument annotation onsets across 27 raw borrower labels: consecutive comparable rows move from no explicit PIK annotation to a positive one. It records both rows and their sources. These are not 53 unique or legally confirmed cash-to-PIK amendments. They can include the same borrower in both funds, use of an existing option, a refinancing or a disclosure change.transitions
Renovo supplies a concrete schedule example. A TCPC loan shows SOFR plus 9.65% without a PIK annotation in June 2025 and with a PIK annotation in September. That change is observed. Its contractual amendment date and mechanism remain unknown. This report does not turn a change in a schedule label into an invented amendment history.renovo
7. Finding five: later losses followed both high and already-reduced marks
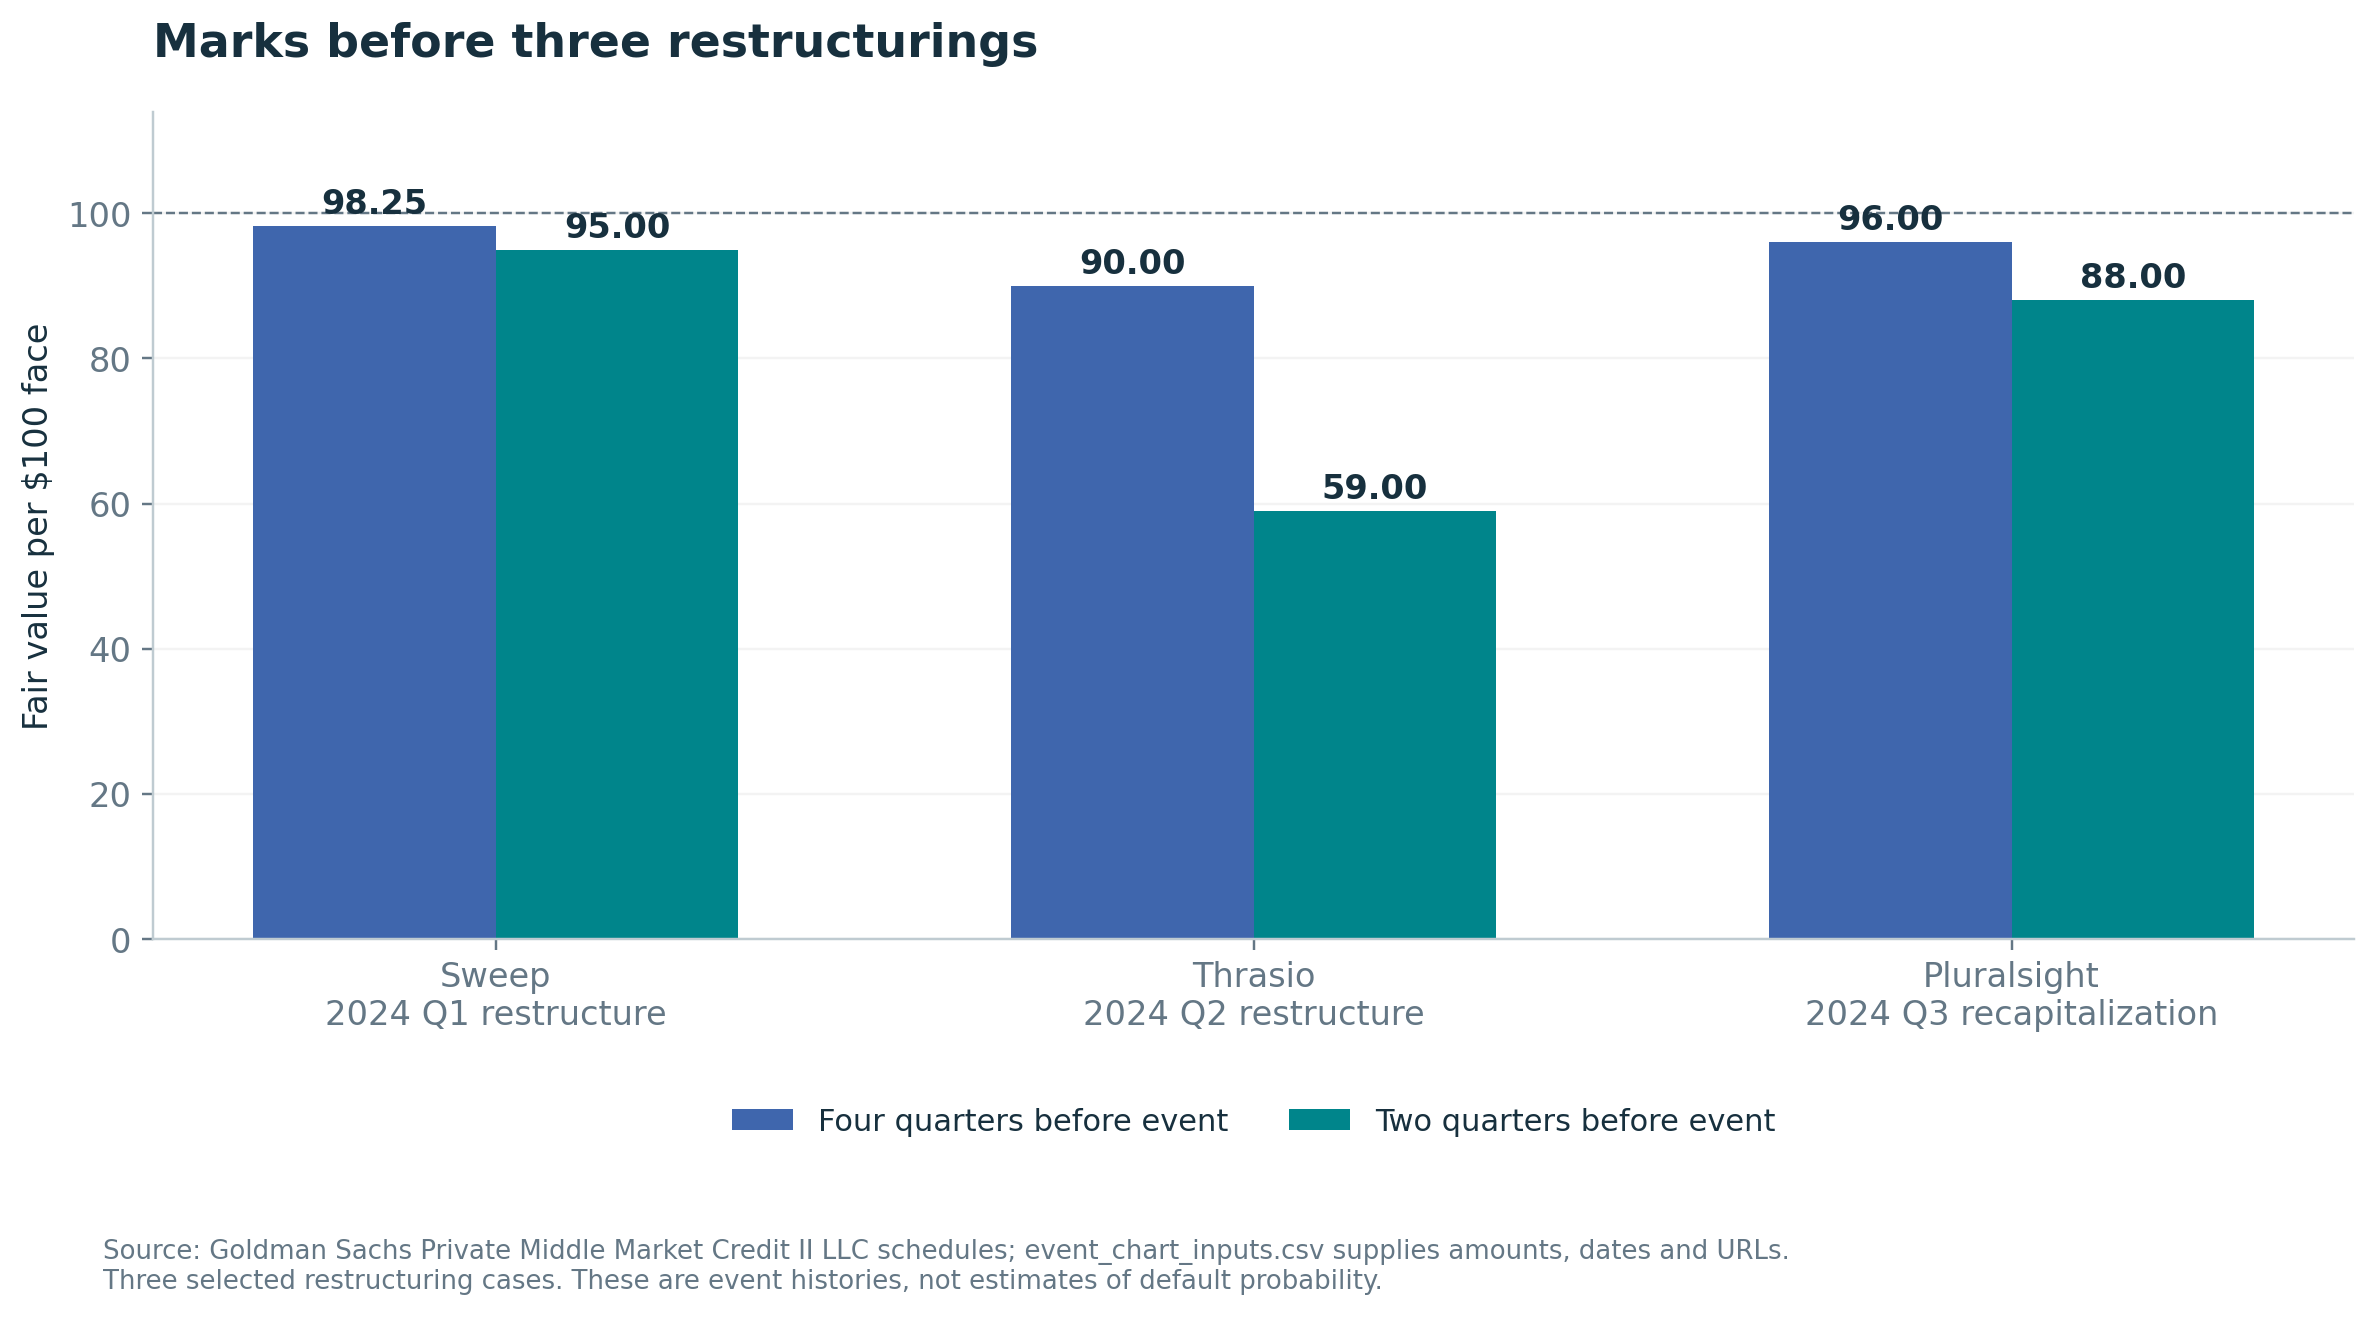
The selected case histories cover four borrower events and 19 historical schedule marks. The three restructuring histories below come from Goldman Sachs Private Middle Market Credit II LLC. The lookbacks use quarter-ends two and four calendar quarters before the event quarter.events
| Borrower; event quarter | Four quarters earlier: date / mark | Two quarters earlier: date / mark | Later borrower-level realized loss |
|---|---|---|---|
| Sweep Purchaser LLC; 2024Q1 | 2023-03-31 / 98.25 | 2023-09-30 / 95.00 | $15.74m |
| Thrasio; 2024Q2 | 2023-06-30 / 90.00 | 2023-12-31 / 59.00 | $24.56m |
| Pluralsight; 2024Q3 | 2023-09-30 / 96.00 | 2024-03-31 / 88.00 | $39.18m |
Marks are fair value per $100 of current face. The fund reports realized losses at the borrower level.
Sweep illustrates a high preceding mark: $24.516 million / $25.806 million = 95.00 two quarters before its March 2024 restructuring quarter. Its mark was approximately 75 one quarter before the event. The later $15.74 million realized loss does not imply that all of that loss first appeared in the restructuring quarter.sweep
Thrasio illustrates an earlier warning. The selected loan was already at 59.00 two quarters before the June 2024 restructuring quarter, and the schedule identifies nonaccrual by September 2023. Calling its eventual restructuring “unforeseen because the loan once stood near 90” would ignore subsequent disclosed deterioration.thrasio
Pluralsight stood at 96.00 four quarters before the September 2024 event quarter, 88.00 two quarters before, and approximately 46.00 at June 2024. Its later borrower-level realized loss was $39.18 million. The sequence shows substantial repricing before the loss became realized; the earliest mark would need to be evaluated using information available at the time.pluralsight
Renovo: do not join old debt to replacement debt
TCPC’s newer Renovo loans, originated in April 2025 following recapitalization, stood at par in June and September. The September debt lines total $11.620574 million of fair value; adding $0.931157 million of preferred equity gives $12.551731 million. The company subsequently disclosed that liquidation began November 3, 2025 and that it expected no recovery; the year-end filing reports zero value.renovo
The earlier 2024 loan was already heavily marked down, but it is not the same new April 2025 instrument. The new debt therefore has a two-quarter lookback at par before the Q4 event, while a four-quarter lookback for that instrument is unavailable. Splicing the old and new loans would manufacture a continuous valuation history across a restructuring boundary.
These cases support a limited answer: high absolute marks sometimes precede later credit losses. They do not supply the denominator needed for a predictive test. A representative study would need all comparable loans, including those repaid without loss, verified event dates, contract continuity and subsequent cash distributions. It would also need to distinguish a high absolute mark from a mark higher than other holders of the identical claim.
First missed-payment dates remain unknown in these case records. Recognized losses can reverse earlier unrealized depreciation, and a borrower-level loss cannot be divided by one selected loan’s face to produce a valid recovery rate. No default probability or manager loss-prediction ranking is estimated here.
8. Finding six: the market discount test does not validate the marks
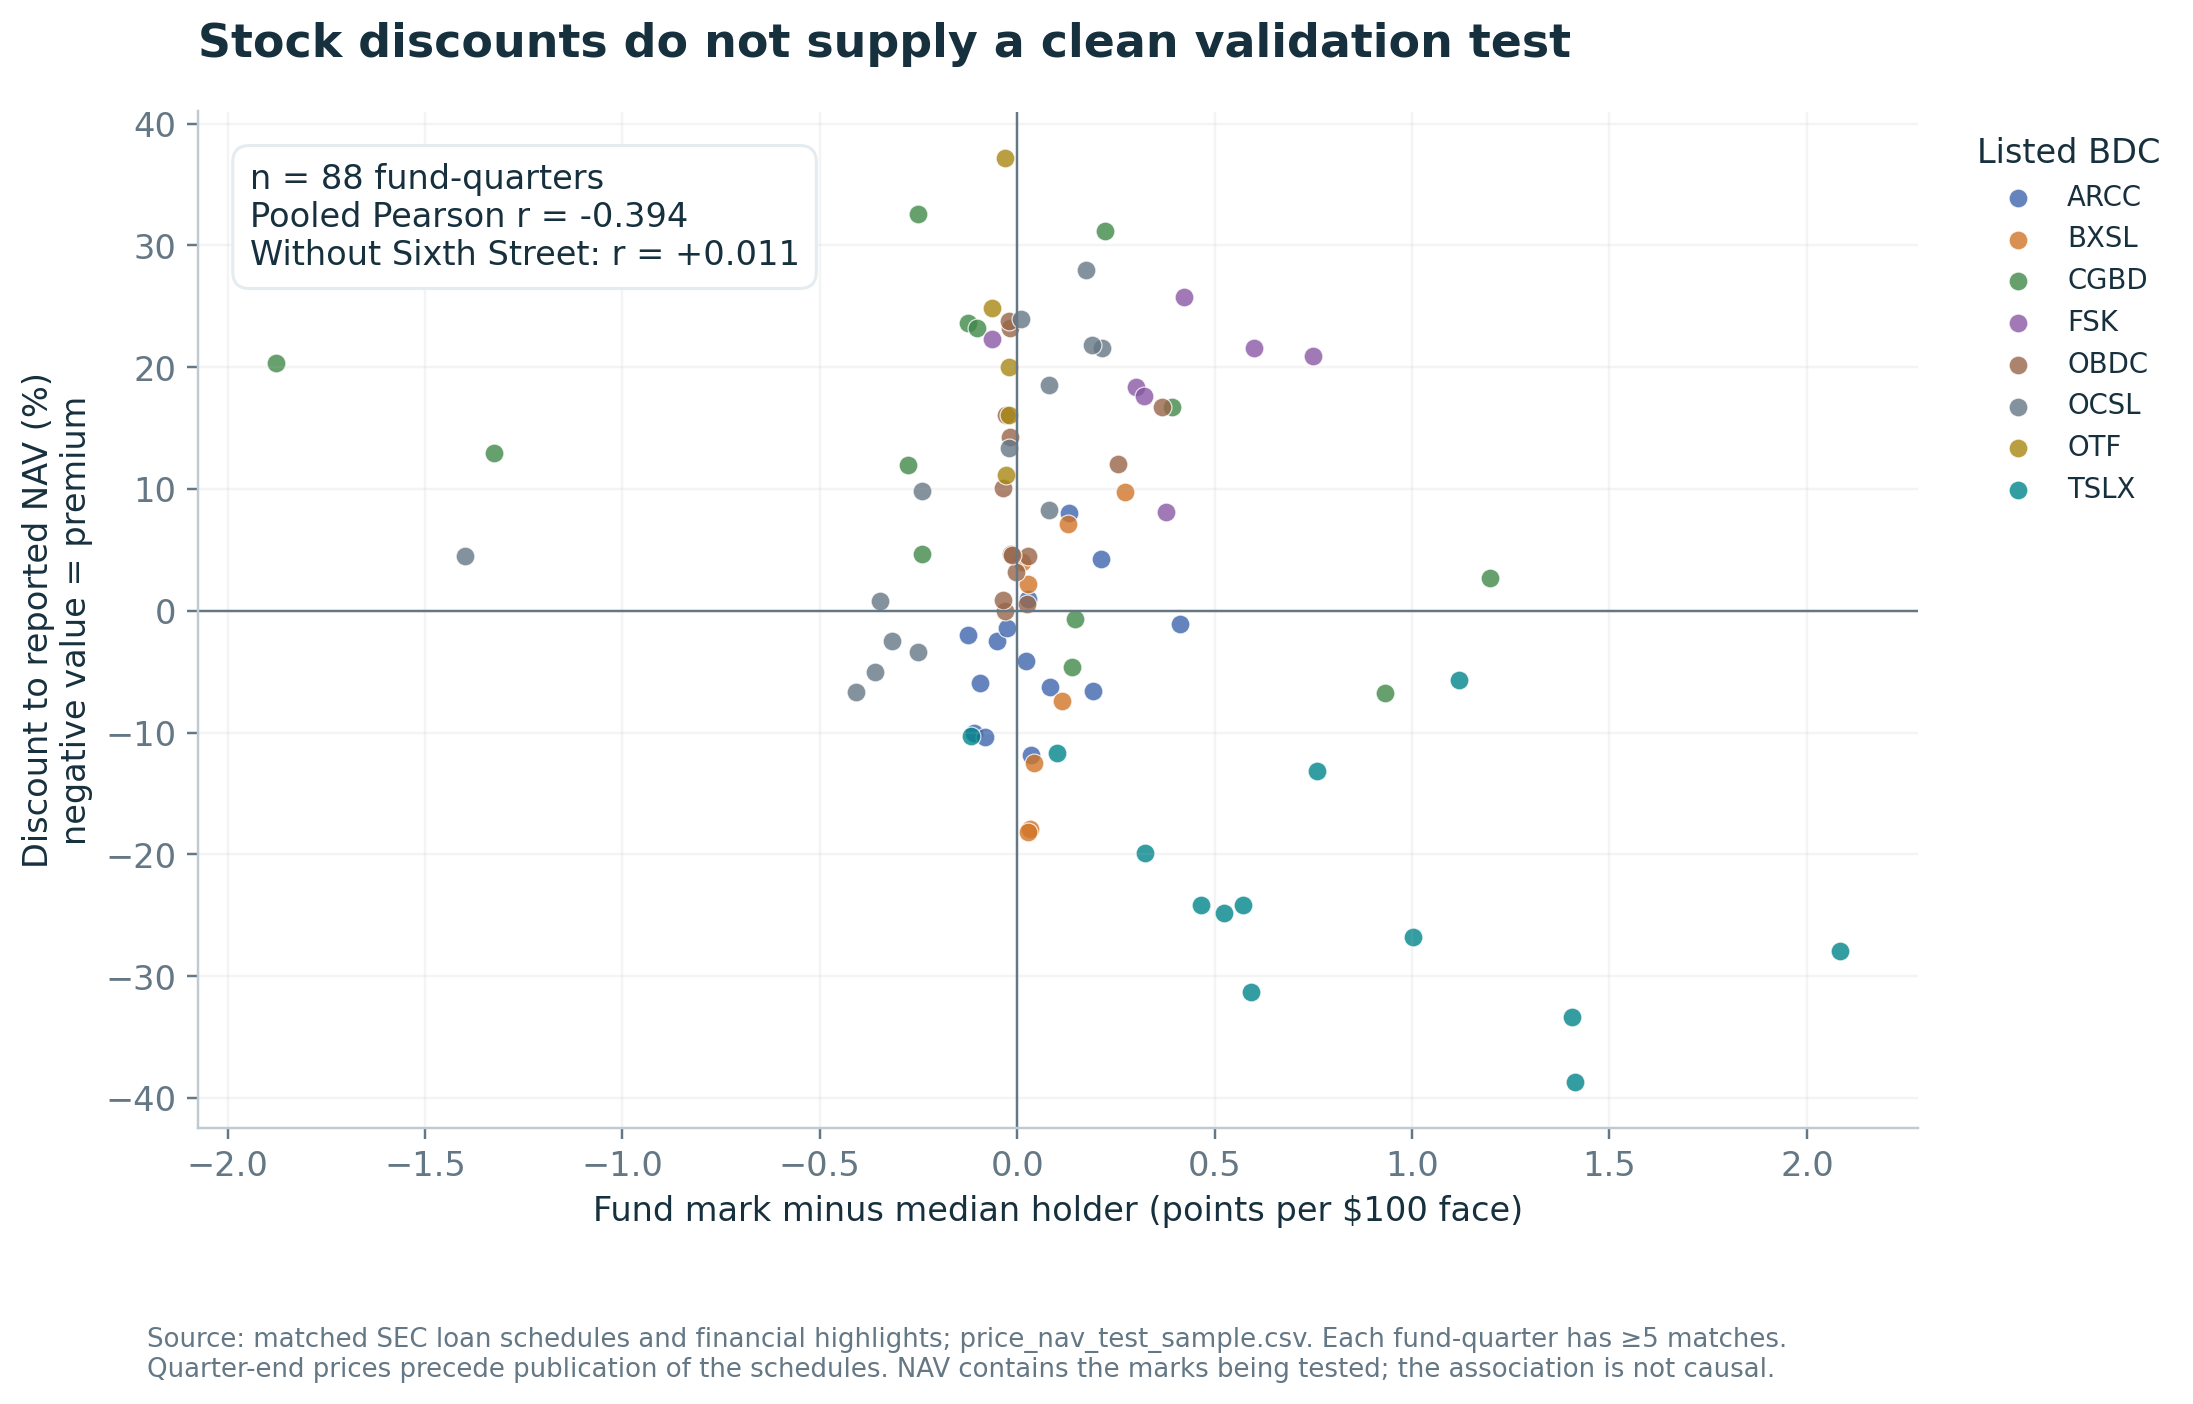
The price test covers 88 fund–quarters from eight listed funds and seven manager groups, with at least five qualifying comparisons in each observation. Prices and NAV per share come from primary financial disclosures; no price is imputed before a fund lists. The discount is 1 − share price / reported NAV per share, so a negative number means a premium.price
The pooled Pearson correlation between a fund’s relative mark and its discount is −0.394; the rank correlation is −0.238. Taken alone, that might suggest higher marks accompany smaller discounts. But removing Sixth Street changes the Pearson correlation to +0.011, with 75 observations. That sensitivity prevents a broad interpretation of the pooled association.
A regression with fund and quarter effects estimates a −2.98-percentage-point change in the discount for a one-point increase in the relative loan mark. The manager-clustered 95% interval runs from −12.11 to +6.16 percentage points. With only seven manager clusters, even that interval should be read cautiously. All leave-one-manager-out intervals include zero. The estimate leaves open how investors respond to higher marks.price
The fixed-effects question is narrower than the pooled question: it asks whether changes within a fund, after common quarterly changes, accompany changes in discounts. It does not estimate a timeless ranking of managers’ valuation practices.
There are two further identification problems. First, quarter-end prices precede publication of the corresponding quarterly schedule; this is not a test of the market’s reaction to seeing the new marks. Second, NAV itself contains those marks. Altering a reported asset value changes the denominator of the discount even if the share price stays fixed.
A mechanical NAV sensitivity removes positive excess value over other managers’ medians from the compared holdings. The pooled correlation then becomes −0.398, close to the original result. That is useful arithmetic, but it does not solve the selection, disclosure-timing or economic-rights problems. Neither correlation validates the loan values.
9. Finding seven: convergence scenarios are small on this measured subset
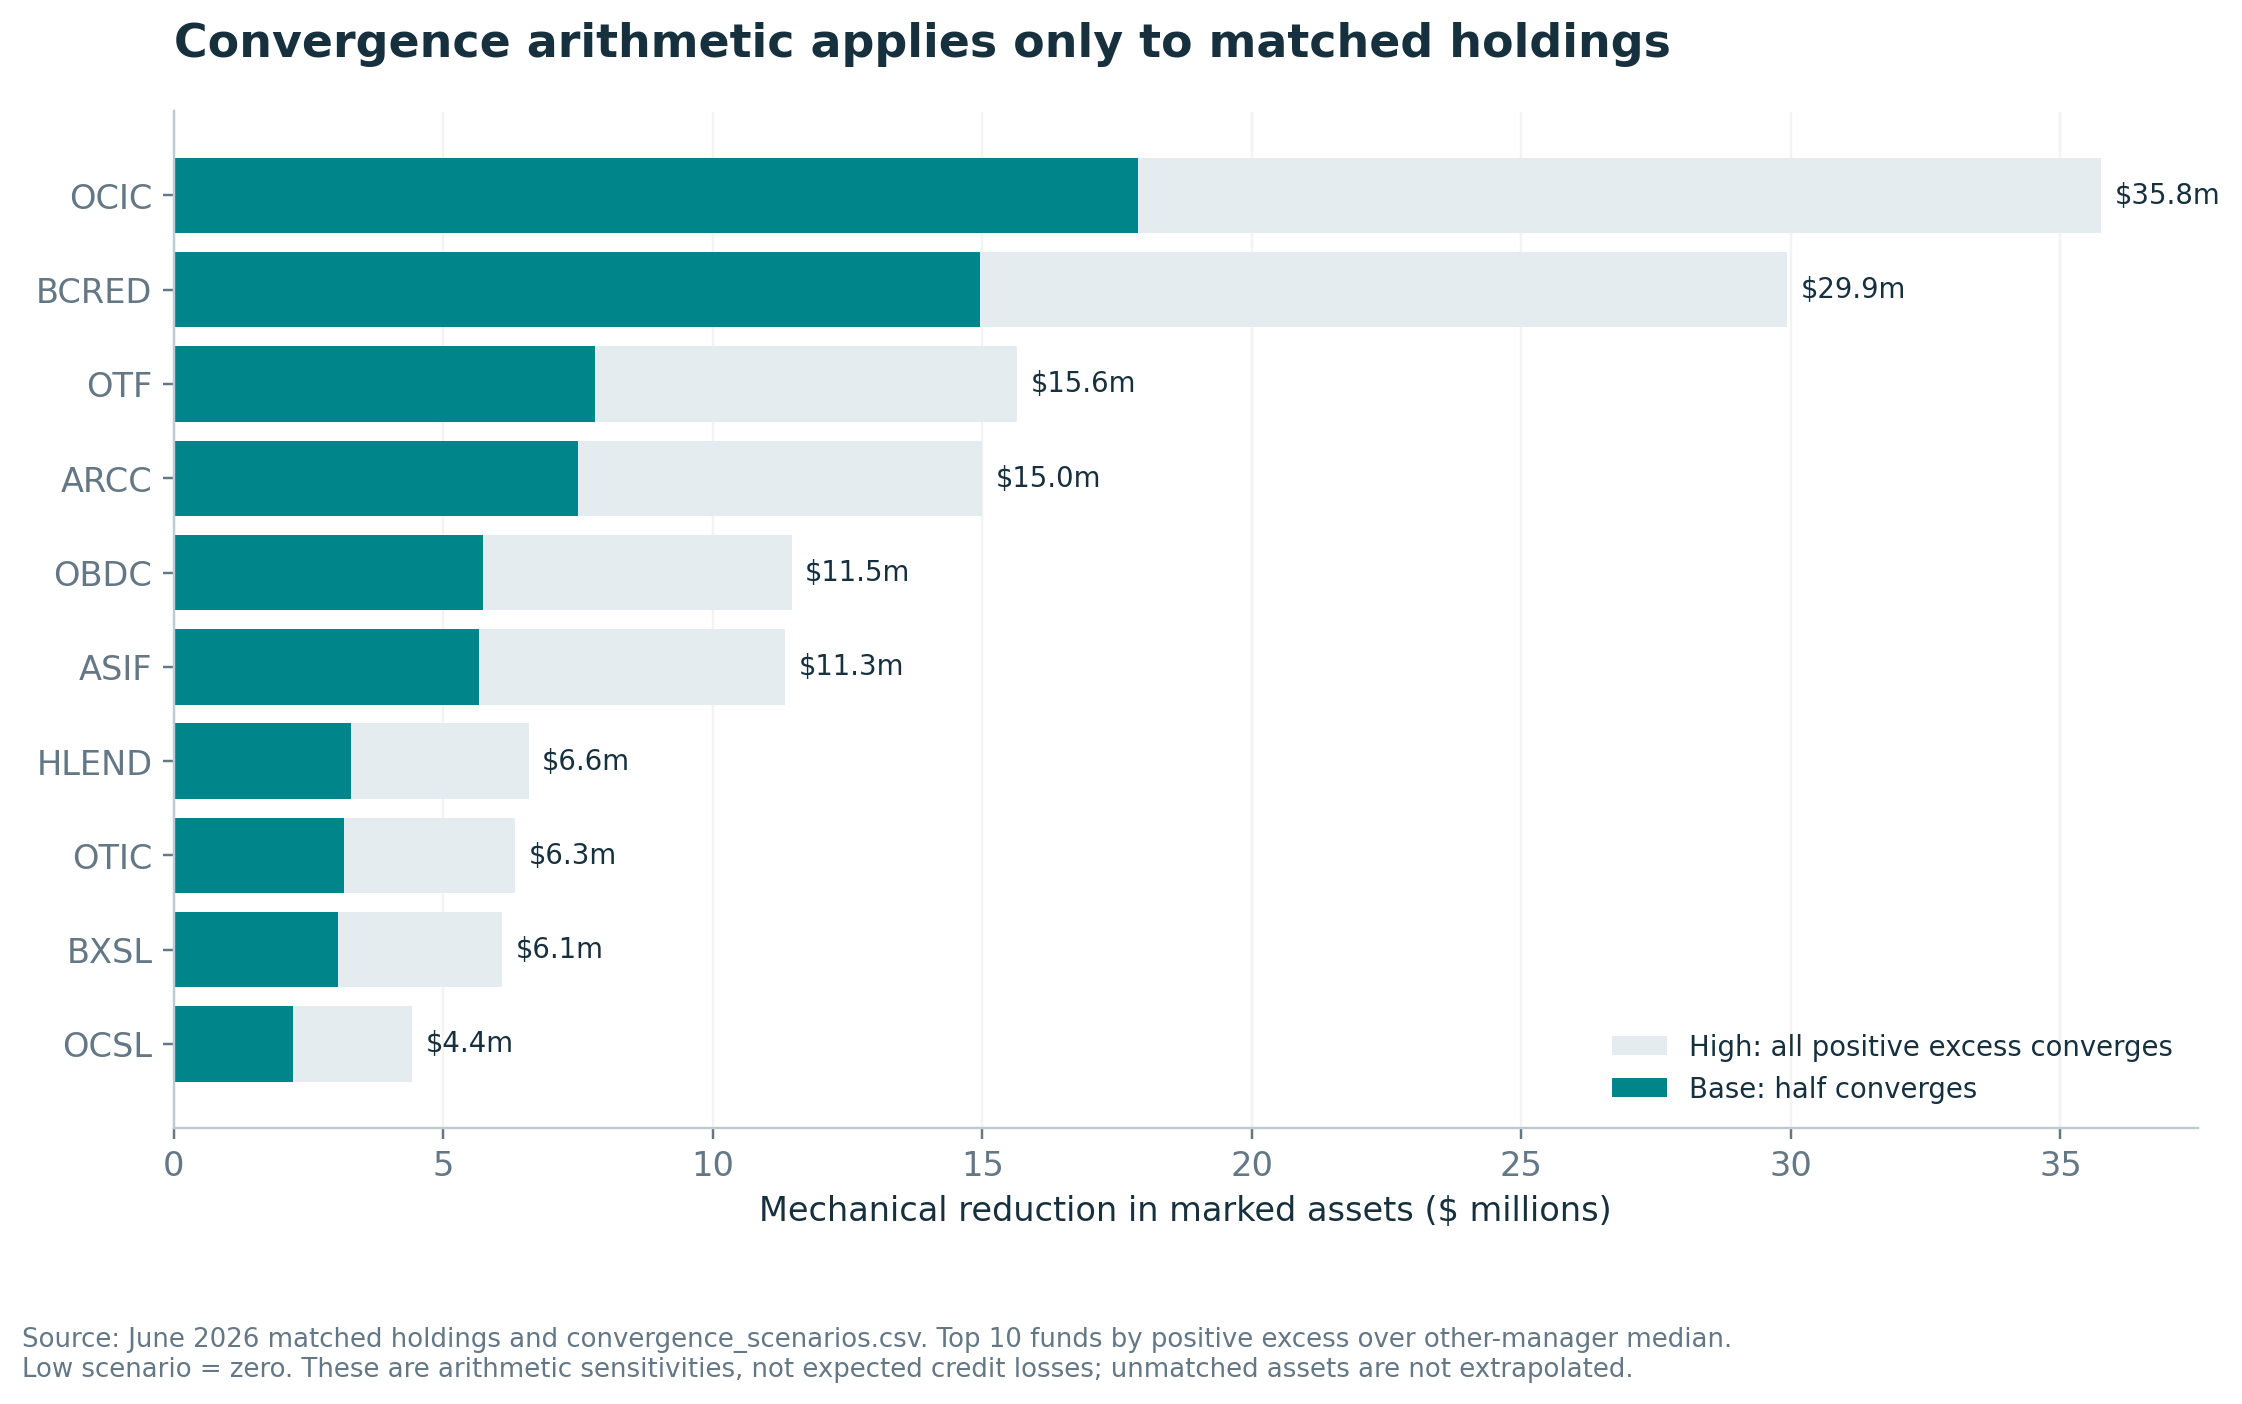
For each June 2026 matched holding, the model converts positive mark differences into dollars.
Positive excess fair value = max(0, holder mark − median mark of other managers) × face ÷ 100
The low scenario recognizes none of that excess as a markdown. The base scenario removes half. The high scenario removes all of it. The scenarios apply assumed markdowns to the observed excess. Low-valued holdings are not marked upward to offset the calculation, and unmatched holdings are not extrapolated.scenario
| Holder | Compared loans | Low, $m | Base, $m | High, $m | High / total NAV |
|---|---|---|---|---|---|
| ARCC | 42 | 0.00 | 7.50 | 14.99 | 0.108% |
| ASIF | 87 | 0.00 | 5.67 | 11.34 | 0.111% |
| BCRED | 96 | 0.00 | 14.96 | 29.93 | 0.070% |
| BXSL | 21 | 0.00 | 3.05 | 6.09 | 0.103% |
| CGBD | 7 | 0.00 | 0.18 | 0.37 | 0.034% |
| HLEND | 94 | 0.00 | 3.29 | 6.58 | 0.055% |
| OBDC | 31 | 0.00 | 5.73 | 11.46 | 0.163% |
| OCIC | 84 | 0.00 | 17.88 | 35.76 | 0.194% |
| OCSL | 21 | 0.00 | 2.21 | 4.42 | 0.319% |
| OTF | 44 | 0.00 | 7.82 | 15.65 | 0.207% |
| OTIC | 44 | 0.00 | 3.17 | 6.33 | 0.234% |
| TSLX | 11 | 0.00 | 1.44 | 2.88 | 0.186% |
Source: June 2026 matched source amounts, peer calculations and issuer net assets. NAV effects assume a dollar-for-dollar asset markdown before tax, fees or other balance-sheet effects. “Compared loans” counts accepted loan keys held by that fund.
Across these 12 holders, the scenarios total $0, $72.90 million and $145.79 million. The high case is 0.117% of their combined reported net assets, applied to a matched subset with $35.12 billion face. It is not an estimate for the BDC industry or the wider private-credit market.
The largest dollar high cases are OCIC and BCRED, reflecting both compared exposure and positive mark differences. OCSL’s high case is smaller in dollars but approximately 0.319% of its total NAV. Dollar rankings and percentage-of-NAV rankings answer different questions.
Convergence toward a peer median need not be the correct economic outcome. The lower holder could revise upward; a new transaction could support either valuation; or both holders could move together after new information. Losses on currently similar marks could also dwarf the measured dispersion. The scenarios isolate one quantity: the value of observed positive differences within the selected comparisons.
10. Evidence that would change the conclusion
Four additions would materially change the strength of the answer.
A verified contract bridge would change the large-gap findings. Loan identifiers, allocation statements or public amendment terms confirming identical collateral, priority, guarantees and call rights could upgrade a disclosed-term candidate into a same-claim comparison. Evidence of different rights could remove it. Equinox’s refinancing economics are particularly consequential.
A complete outcome panel would change the predictive conclusion. Verified missed-payment dates, amendments, repayments, equity distributions and final recoveries for both distressed and successful loans would allow a two- and four-quarter predictive test. Events must be identified independently of high marks, and refinancings must be distinguished from continuation of the same claim. Until then, selected loss histories cannot estimate the frequency of failure after a high mark.
Better exposure coverage would change the generalizability. The current panel excludes unmatchable terms, five unenriched holders and many single-holder loans. A larger set with explicit contract identifiers could show that those missing investments behave differently. The stability of the size and reviewed-name sensitivities supports the result for the matched sample.
A better market design would change the discount test. More independent managers, fixed disclosure dates, prices observed after the relevant release, and controls for other fund characteristics could distinguish persistent fund differences from reactions to valuation information. The current sample is too sensitive to manager composition to support that claim.
The decision rule for an analyst is therefore concrete: start with the loan’s identity, currency, denominator and footnotes; compare values only after those survive review; then follow the same economic claim through later cash flows. A large residual gap identifies where that work is most valuable. A determination about misstatement or conduct would require more evidence.
Workbook and source data
The workbook shows sourced inputs, formulas and outputs. Its live calculation sample contains 8,583 source positions, 8,121 holder–loan–quarters and all 2,706 cross-manager comparisons. The CSV collection also includes comparisons within a manager group. Included-input changes flow through holder marks, loan dispersion, manager arithmetic and convergence scenarios. Matching-policy sensitivities and fixed-effects estimates are labelled Python model snapshots; changing a source value in Excel does not rerun borrower matching or redefine the statistical sample.
The downloads include the broad XBRL extraction and normalized loan schedules. Other CSVs cover source positions, matched holdings, loan-quarter comparisons, fund metrics and selected borrower events. The filing catalog and review tables give source links and locators. The charts use the accompanying CSV data.
The three headline calculations were checked independently:
| Headline | Independent check |
|---|---|
| 0.251-point median gap | Reaggregate original source face/FV by holder; divide again and recompute each high–low gap. |
| 1.74% above five points | Recount 47 / 2,706 using the independently rebuilt gaps and the same strict threshold. |
| Pluralsight 88.00 two quarters before the event | Verify the rendered schedule and inline facts, then recompute 100 × $60.497m / $68.747m using independent decimal arithmetic. |
The independent source reaggregation reproduces the headline dispersion to floating-point precision. The event loss amounts were also checked against both quarterly disclosures and the annual reconciliation. These checks verify extraction and arithmetic; they do not independently certify every matching decision.checks
Source notes
- SEC, Business Development Company Data Sets, updated October 31, 2026; scope, extraction warnings and downloadable vintages. The filing catalog lists the 280 accessions, filing dates and primary URLs. ↩
- Author calculations from original SEC schedules. Reproduction chain:
matched_source_positions.csv→matched_holdings.csv→matched_loan_quarters.csv;sensitivity.csv,quarter_dispersion.csv,manager_scores.csv. Principal tags includeInvestmentOwnedBalancePrincipalAmountand the TSLX underlying-face tag; valuation tags areInvestmentOwnedAtFairValueandInvestmentOwnedAtCost. Each source row supplies its own URL, filing date and fact/context locator. ↩ coverage.csv,fund_metric_selected_sources.csvand the filing catalog describe the sources. The raw extraction identifies both original and corrected principal and currency fields.additional_net_assets_source_facts.csvsupplies exact primary statement URLs, dates andStockholdersEquitytags for the NAV-only supplement. ↩- Blue Owl Technology Finance, listing FAQ, checked November 12, 2026, and June 11, 2025 SEC listing announcement, page 1; first trading date June 12, 2025. The underlying dated price/NAV selection and source facts are in
fund_quarter_market_nav_final.csvand its source file. The fund registry gives legal names and CIKs. ↩ name_review_1_250.csv,name_review_251_500.csv, and the frozen top-500 queue document the review.fuzzy_alias_candidates.csvrecords proposed aliases. The corrections and approved aliases include source URLs. The final reviewed-only sensitivity is recomputed from the selected comparison groups. ↩- HPS Corporate Lending Fund, March 2026 Form 10-Q, filed May 11, 2026; consolidated schedule, debt-section headings and note (1).
hlend_2026q1_repaired_usd_debt_rows.csvpreservesInvestmentOwnedBalanceShares, original units, monetary display interpretation, cost/FV facts and visible floor notes. ↩ - Goldman Sachs Private Middle Market Credit II LLC, March 2023 Form 10-Q, filed May 9, 2023; schedule heading “in thousands” and
InvestmentOwnedBalancePrincipalAmount. The 270-fact correction receipt identifies original tag values, rendered amounts, currencies, fact IDs and scale factors. Sweep’s selected face fact isF_eeb5cc38-ecc5-486b-93d4-e53a6ccd4c29. ↩ - See the Equinox second-lien rows in the consolidated investment schedules. ARCC filed its June 2026 Form 10-Q on July 29, 2026. TSLX filed its June 2026 Form 10-Q on August 4, 2026.
gap_case_positions.csvprovides acquisition/term details, original face/FV facts and rounding precision;gap_case_pairs.csvsupplies the independently recomputed comparison. ↩ - ARCC, September 2026 Form 10-Q, filed October 27, 2026, Equinox facts
f-3810andf-3812; TSLX, September 2026 Form 10-Q, filed November 3, 2026, principal factF_fd7eb544-2a15-4aec-a372-e7d0dc9eb908and FV factF_d82f6397-bb05-4a80-a74e-5b9aafb63b46. The September comparison CSV preserves the arithmetic and unresolved economics. ↩ - Equinox/Sixth Street, November 2, 2026 announcement, refinancing and investor participation. It does not provide a holder-specific old-claim payout bridge. ↩
- June 2026 consolidated schedules: OCSL and OTF, filed August 5, 2026; OCIC and OTIC, filed August 6, 2026; Barracuda Parent LLC first-lien rows, rate/maturity columns and valuation footnotes. OBDC, filed August 5, reports the 4.50% spread position.
gap_case_positions.csvlists principal/FV tags and fact IDs. ↩ - December 2024 Newfold: HPS annual schedule, filed March 20, 2025, visible note (9), 0.75%; BCRED annual schedule, filed March 14, 2025, note (11), 1.00%. September 2023 Marcone: HPS schedule, note (13), 1.75%; BCRED schedule, note (10), 0.75%. Exact contexts, dates and source records are in
wide_gap_term_check_final.csvandlinked_floor_overrides.csv. Visible numbered notes take precedence over faulty inline footnote relationships. ↩ - CGBD, June 2024 Form 10-Q, filed August 5, 2024; Material Holdings schedule row, printed page 9; schedule notes, pages 14–15, including nonaccrual note (8) and commitment note (15); restructuring discussion in MD&A, page 96. ↩
- Recognized-income tags
InterestIncomeOperatingPaidInKind,DividendIncomeOperatingPaidInKindandGrossInvestmentIncomeOperating; signed quarterly source components and fiscal-period derivations infund_metric_selected_sources.csv. Nonconsolidated joint-venture look-through facts are excluded from consolidated income calculations. ↩ - BCRED, March 2023 10-Q; September 2025 10-Q, filed November 13, 2025; 2025 annual operations statement, 10-K filed March 13, 2026; June 2026 operations statement, 10-Q filed August 12, 2026. Q4 interest: $467.495m − $326.729m; Q4 total income: $7,589.581m − $5,620.900m. Exact affiliation components, context IDs and source dates appear in the metrics files. ↩
- BCRED, November 3, 2026 supplement, income-quality discussion and footnote (19). Footnote (39) states that its Level 3/private-investment classification can include quoted and non-quoted investments. See also FASB Topic 820, fair-value hierarchy, paragraphs 820-10-35-37A and 820-10-35-52–53, for the significance and observability of valuation inputs. ↩
- ARCC, June 2026 Form 10-Q, consolidated statements of operations, three-month column, PIK interest/dividends and investment-income tags. Exact source components are in
fund_metric_selected_sources.csv; ratios recompute as 58/768 and (58+63)/768. ↩ - BCRED 2025 10-K, March 2026 10-Q, and June 2026 10-Q, MD&A nonaccrual table/paragraph and denominator footnotes. The September figures are in the November 3 supplement. The historical December 2023 FV disclosure is less than 0.1%, preserved as an upper bound in
bcred_nonaccrual_history.csv. ↩ pik_first_annotation_candidates.csvrecords the screened transitions. Candidate definitions hold disclosed borrower, lien, maturity, benchmark, floor and priority constant across consecutive quarters, while permitting a changed spread; each candidate lists both source rows. No underlying amendment date is inferred. ↩events.csv,curated_event_marks.csv,event_chart_inputs.csv,event_marks_verification.csvandrealized_loss_crosschecks.csv. The three Goldman restructuring amounts also reconcile with its 2024 10-K, filed March 4, 2025, MD&A realized-loss discussion. Unknown first missed-payment dates and the borrower-level loss scope remain explicit fields. ↩- Goldman Sachs Private Middle Market Credit II LLC: March 2023 schedule, filed May 9, 2023; September 2023 schedule, filed November 7, 2023; and March 2024 10-Q, filed May 9, 2024, MD&A realized-loss discussion. Sweep principal/FV fact IDs and corrected March 2023 scale appear in the event input file. ↩
- Same issuer, June 2023 schedule, filed August 8, 2023; 2023 annual schedule, filed March 5, 2024, Thrasio row and visible nonaccrual note (10); June 2024 10-Q, filed August 13, 2024, MD&A restructuring/realized loss. The December typed identifier omits the borrower name; the visible row supplies it. ↩
- Same issuer, September 2023 schedule, filed November 7, 2023; March 2024 schedule, filed May 9, 2024, Pluralsight first-lien SOFR+8%, April 6, 2027 row, principal fact
F_2d2daa29-9f06-4f76-b8e8-897ea2b6fdac; September 2024 10-Q, filed November 12, 2024, MD&A realized-loss discussion. Face $68.747m, March FV $60.497m; event-input CSV supplies the FV fact and intervening June source. ↩ - TCPC, June 2025 10-Q, filed August 7, 2025; September 2025 10-Q, filed November 6, 2025, HomeRenew investment rows; Note 9, subsequent events; and 2025 year-end investment disclosure. The curated event inputs distinguish the older debt from April 2025 replacement claims and show individual face and fair-value facts. ↩
- Primary-source price and NAV/share inputs, filing dates and tag locators:
fund_quarter_market_nav_final.csvandfund_quarter_market_nav_final_sources.csv.price_nav_test_sample.csvlists the regression observations. The text reports the clustered estimates and the manager-exclusion test. Intervals use small-cluster degrees of freedom; the sample and covariate specification are held explicit. ↩ convergence_scenarios.csv, June 2026 matched holdings and primary net-asset facts. For example, HPS’s June 2026 balance sheet, filed August 13, 2026, reports $12,049.588m of net assets underStockholdersEquity. The workbook records each fund’s corresponding source. The scenario factors are analyst assumptions of 0%, 50% and 100%. ↩independent_gap_recomputation.csvandevent_lag_headline_verification.csvdocument the arithmetic checks. The workbook’s Checks sheet records formula verification. ↩
Supporting material
- Excel model ↗Sourced inputs, live calculations and reported outputs.
- Source and model data (CSV collection, part 1 of 2) ↗Data tables, source references and calculation exports.
- Source and model data (CSV collection, part 2 of 2) ↗Data tables, source references and calculation exports.
- Filing catalog ↗Download as CSV.
- Matched loan quarters ↗Download as CSV.