Financial systems
Exxon and Pioneer, tested against well data
Pioneer’s median completed interval grew 27% in the selected wells. Median output per foot fell 18% on the first test and 3% in a smaller six-month sample.
The Pioneer-filed wells in this study have longer completed intervals after Exxon’s acquisition. The modeled return on the $68 billion purchase is 6.0% in the base case. Exxon announced roughly $60 billion in equity value. Its closing accounts imply roughly $68 billion in stock consideration and assumed debt before acquired cash. Management later raised its synergy estimate from about $2 billion to about $4 billion a year, defined as average pretax cash benefits over ten years.[1–4]
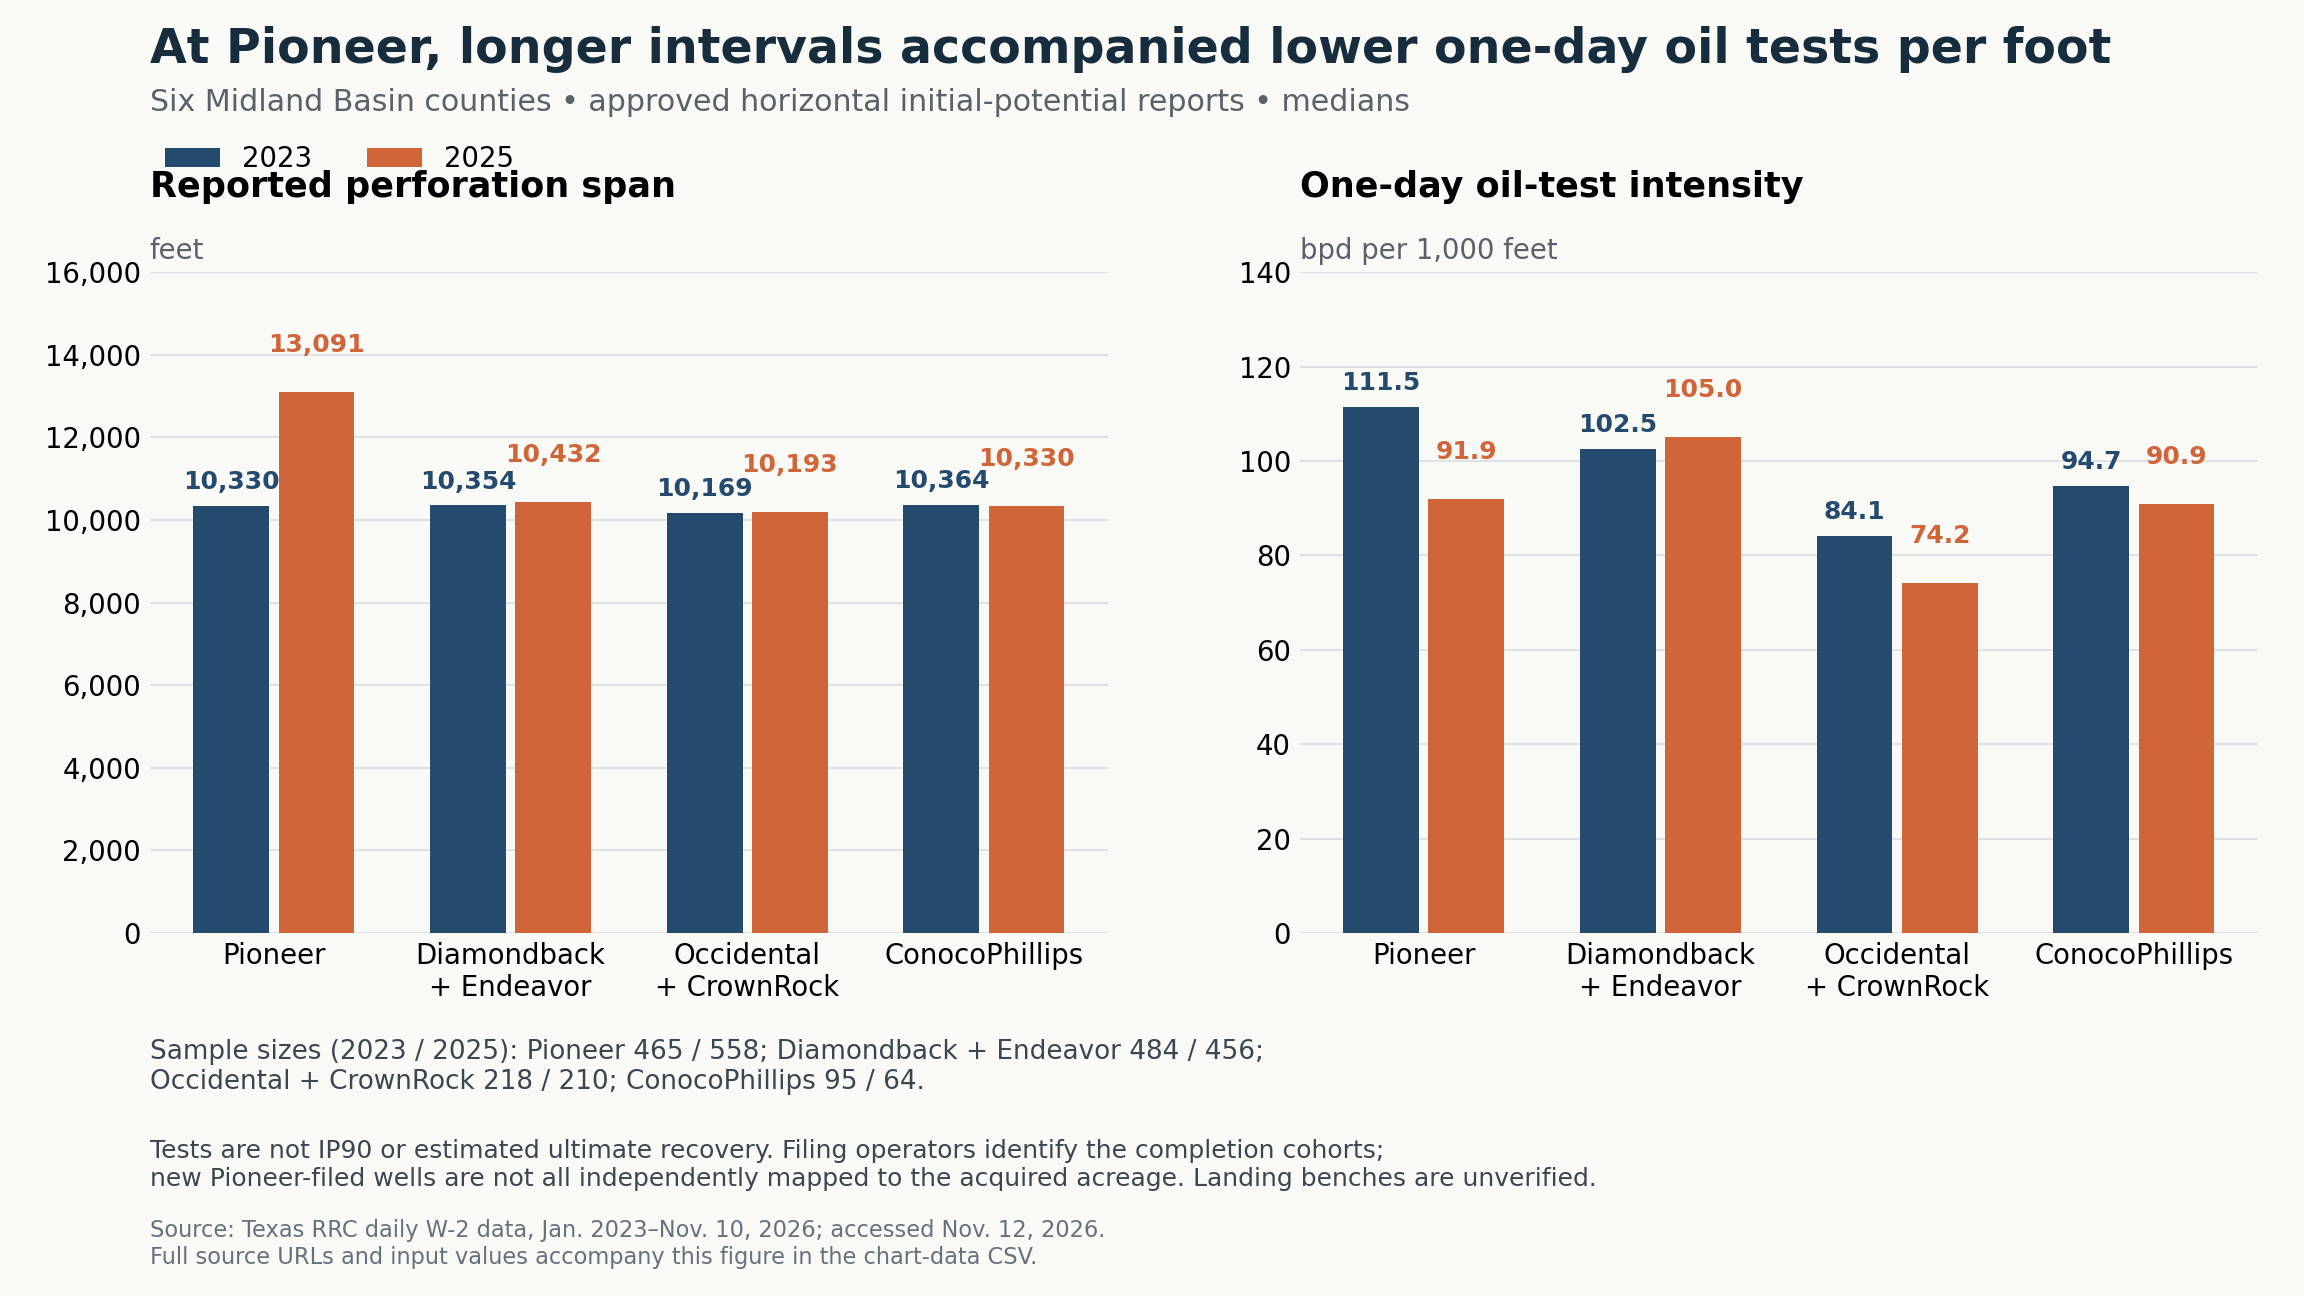
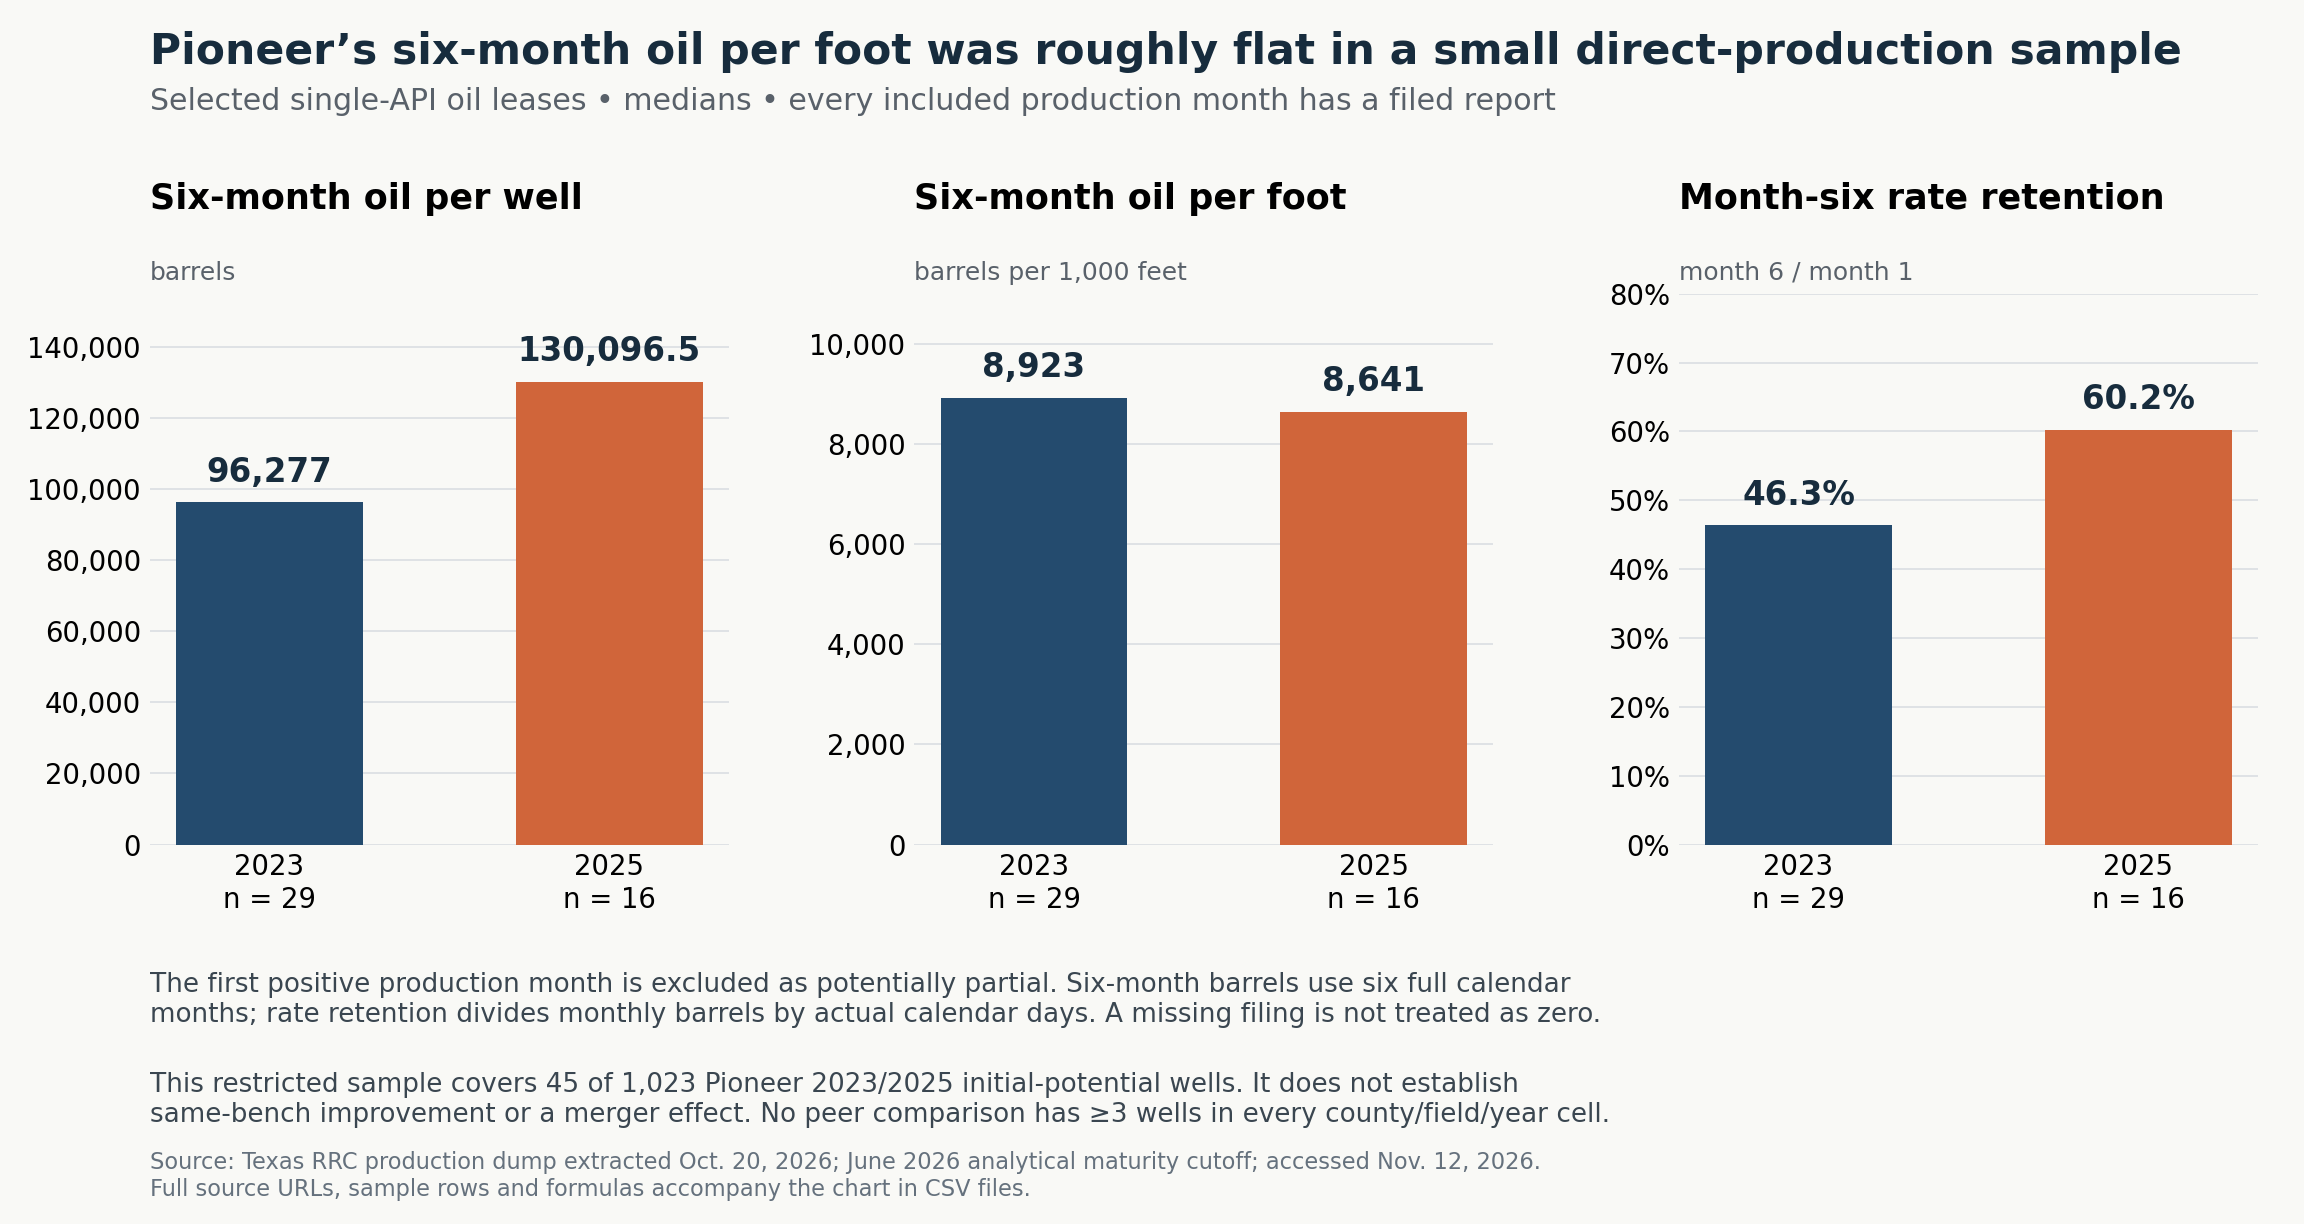
The well evidence is mixed. In six Midland Basin counties, approved Pioneer-filed horizontal completion tests show the median perforated span increasing 26.7%, from 10,330 feet in 2023 to 13,091 feet in 2025. Median one-day oil-test output per 1,000 feet fell 17.6%. Yet a much smaller sample with production reasonably attributable to one observed well shows higher six-month oil volumes and higher month-six/month-one calendar-day oil-rate retention, with 3.2% less oil per completed foot in the 29 Pioneer-filed wells from 2023 and 16 from 2025 that met the production screen. The one-day tests capture early production. Testing Exxon’s lightweight-proppant claim would require the pilot’s well identifiers and comparable controls.[5–7]
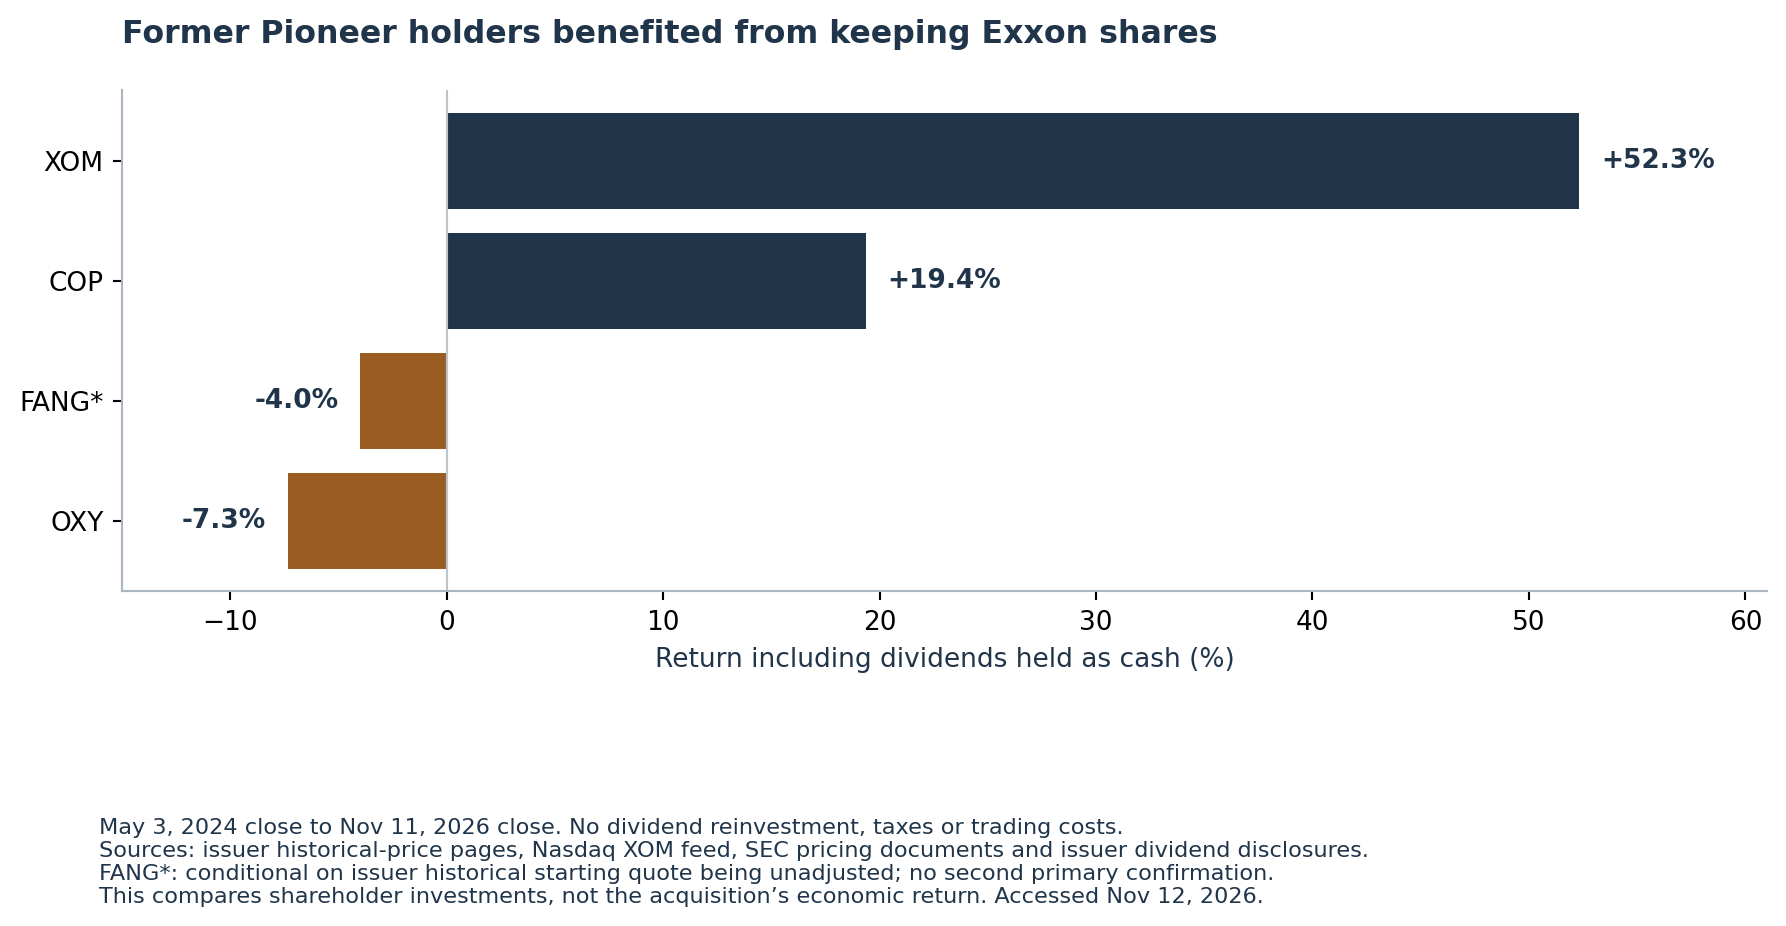
A former Pioneer shareholder who kept the Exxon shares received at closing earned approximately 52.3% through November 11, 2026, including dividends held as cash. Comparable returns were 19.4% for ConocoPhillips, approximately −4.0% for Diamondback subject to the historical-quote qualification below, and −7.3% for Occidental. The 52.3% reflects the value of holding Exxon stock after closing.[12]
The acquisition model developed here produces a 6.0% base-case annual return, a −$13.9 billion NPV at a 10% hurdle, and a low-to-high return range of −2.3% to 10.7%. These are explicitly estimates. They combine Pioneer’s filed standalone forecast, observed benchmark oil prices where available, assumed future prices, estimated synergy timing and a terminal value. Post-close standalone Pioneer cash flow is not disclosed, so a realized acquisition IRR cannot honestly be calculated.[2, 11, 13]
The high case clears a 10% purchase hurdle with stronger oil prices and synergies. Assessing the return on the acquired assets requires sustained production per foot, the capital required to maintain it and standalone Pioneer cash flows after closing.
1. What Exxon bought and paid
The October 10, 2023 merger agreement, announced the next day, specified 2.3234 Exxon shares for each Pioneer share. At Exxon’s October 5 reference price of $108.99, the announcement valued the equity at $59.5 billion, or approximately $253 per Pioneer share, and enterprise value including net debt at approximately $64.5 billion. The exchange ratio was fixed; the dollar value moved with Exxon shares. The transaction closed on May 3, 2024.[1]
The 2025 Form 10-K, Note 20, reports approximately 545 million shares issued, worth approximately $63 billion, and approximately $5 billion of debt assumed. This report uses $68 billion as a rounded gross acquisition investment. The $754 million cash-acquired line covers all acquisitions. The model uses gross consideration because the filing gives no Pioneer-only amount for acquired cash.[2]
The detailed assumed-debt table totals $5.250 billion at fair value against $4.779 billion par. A substantial difference arose from $450 million par of convertible notes valued at $1.327 billion. Adding this more precise debt figure to rounded equity consideration would not produce an equally precise enterprise price. The workbook preserves both the detailed debt evidence and the rounded modeling decision.[2]
Purchase accounting also does not provide another cash purchase price. The reported allocation includes approximately $84 billion of property, plant and equipment, $16 billion of deferred tax liabilities and $1 billion of goodwill. The deferred tax liability reflects differences between book and tax bases; it is not another $16 billion paid to the seller. Commodity prices, development costs, production and discount rates are significant valuation inputs, but Exxon’s purchase-accounting price deck and discount rate are not disclosed. The PP&E footnote still uses preliminary-valuation language; the report does not describe it as an explicitly finalized independent appraisal.[2]
The acquisition-period income disclosure is easy to misread. Pioneer contributed $17.008 billion of revenue and $1.710 billion of net income from May 3 through December 31, 2024. Although the later annual filing repeats the table, it provides no standalone 2025 Pioneer income statement. Revenue includes purchased-commodity activity and is not simply acquired wells multiplied by realized prices. Net income also cannot substitute for free cash flow after development spending.[2]
The regulatory premise has changed since closing. The FTC initially imposed restrictions involving former Pioneer chief executive Scott Sheffield, finalized in January 2025. On July 17, 2025, the Commission reopened and set aside its final order by a 3–0 vote. The old restriction should therefore not be presented as currently operative. The July 2025 order gives the FTC’s reasoning.[14]
2. The promise grew—and its definitions matter
The accompanying 62-row target ledger records quantified changes, important reaffirmations and qualitative upgrades identified in the announcement, filed materials, earnings documents and corporate plans through October 2026. The source inventory contains 108 successful retrievals from 109 attempts. The dated ledger links each identified disclosure.
| Date | Disclosure or revision | Correct interpretation |
|---|---|---|
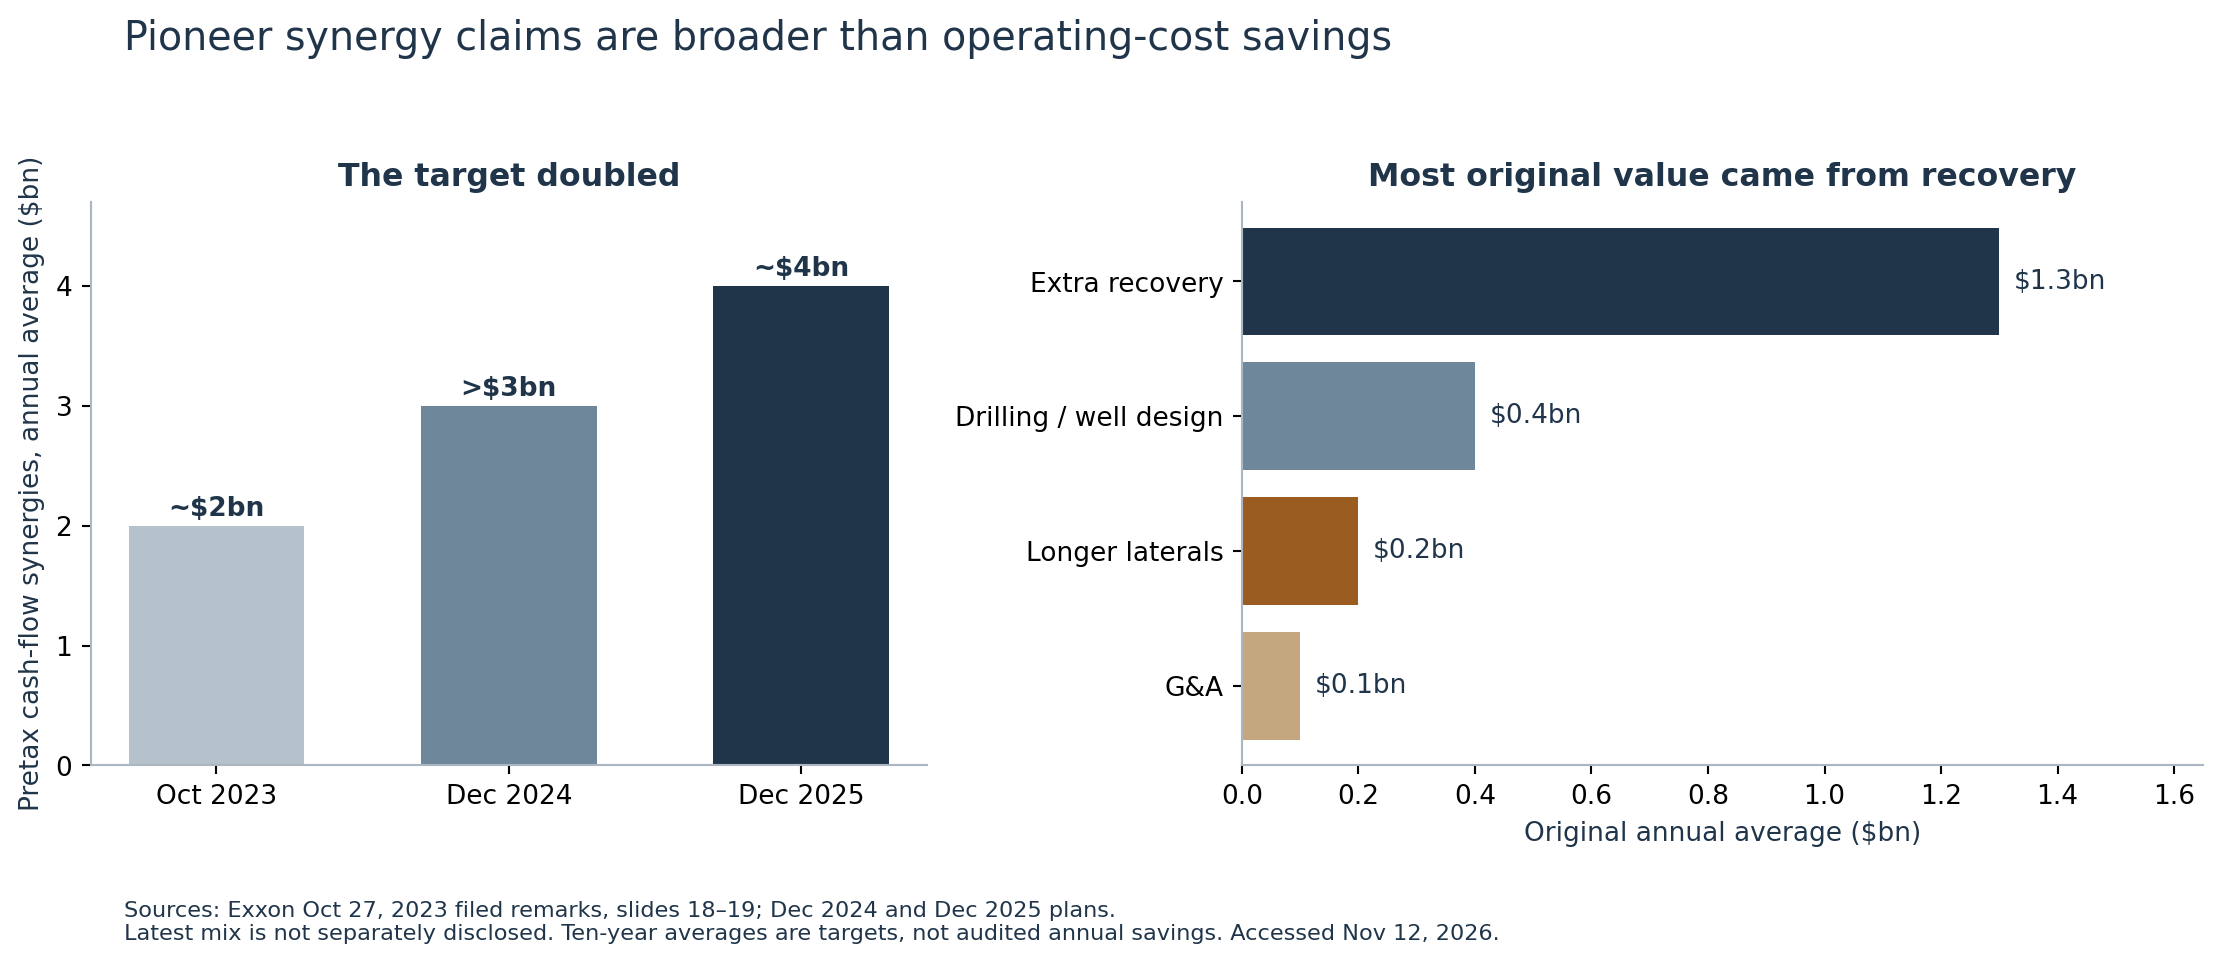
| October 2023 | Approximately $1bn annual synergy beginning the second year; approximately $2bn average annually over the first decade | Pretax cash benefits build over the decade |
| October 2023 | Combined Permian production about 1.3m boe/d on a 2023 basis; about 2m by 2027 | Combined legacy Exxon and Pioneer |
| October 2023 | Approximately $5bn incremental annual FCF initially, $6bn in the second full year including synergies, more than $10bn at decade-end | Forecast cash flow; complete annual commodity-price assumptions undisclosed |
| August/November 2024 | Synergies described as better than originally expected | Qualitative upgrade; no new quantified annual target |
| December 2024 | Average annual synergy raised to more than $3bn; more than $30bn cumulative over 2024–33 | Cumulative illustration used $65 Brent in real 2024 dollars |
| December 2024 | 2027 production target unchanged at 2m; new 2030 target 2.3m; 2025 guidance about 1.5m | The 2030 target did not postpone the 2027 target |
| December 2024 | Lightweight-proppant recovery uplift up to 15%; 2030 drilling/completion cost per foot about 30% below 2019; typical-cube recovery up to 30% above 2019 | The three measures have different scopes and baselines |
| May/August 2025 | Synergies described as above the updated $3bn expectation; proppant uplift raised from up to 15% to up to 20% | Deployment exceeded 100 well equivalents of 10,000 feet each |
| October 2025 | Full-year 2025 Permian guidance raised 1.5m → 1.6m boe/d | Annual guidance changed after earlier quarterly output had already approached 1.6m |
| December 2025 | Average annual synergy raised to about $4bn; 2030 production 2.3m → 2.5m; 2026 target about 1.8m | The $4bn definition remains an average over ten years |
| December 2025 | 2030 drilling/completion cost reduction 30% → 40%; new-well recovery gain 30% → 50%, both versus 2019; cost of supply about $35 → $30/bbl | Forward development measures; acquisition price excluded from money-forward economics |
| January–October 2026 | $4bn synergy, 1.8m 2026 production and 2.5m 2030 production reaffirmed | Reaffirmed targets |
Sources: announcement and October 2023 filed remarks; December 2024 Upstream Spotlight; 2025 quarterly materials and Corporate Plan; January and October 2026 earnings materials. Exact pages and URLs accompany each ledger row.[1, 3, 4]
The original $2 billion breakdown is decisive: $1.3 billion from additional resource recovery, $400 million from drilling and well design, $200 million from longer laterals and fewer wells, and $100 million from general and administrative savings. Thus 65% of the original value proposition depended on recovery. Only 5% was explicitly G&A. Treating the whole number as ordinary recurring operating-cost savings would misstate the investment thesis.[3]
The December 2025 prepared remarks used language suggesting synergies were then running near $4 billion annually. The companion presentation explicitly defined the figure over a ten-year period, and January 2026 remarks repeated the first-ten-years horizon. This report uses that defined basis. Neither relevant annual filing supplies a reconciliation showing $4 billion of Pioneer savings realized in a particular year. Exxon-wide structural savings also overlap conceptually; they cannot be added to Pioneer synergies without a reconciliation.[2, 4]
The recovery claim has a narrower evidentiary foundation than its headline suggests. The December 2025 presentation and March 2026 conference footnote describe an internal comparison in a large Martin County cube development, using time-normalized cumulative oil per lateral foot. Treatment wells were completed October 2024–May 2025; comparison wells December 2024–July 2025. The December presentation specified eight months of production, a limit repeated in March. The API identifiers, raw series and allocation of wells between groups were not published.[4]
Management reports an early-production comparison on selected acreage. It is not publicly reproducible evidence of 20% greater lifetime recovery across Pioneer. In October 2026, management itself said more wells and longer observation were required and indicated that secondary recovery would become more material beyond 2030. The model therefore tests cash-synergy scenarios rather than assigning every acquired barrel a 20% uplift.[4]
3. Identifying former Pioneer wells without losing them in operator changes
The acquisition test starts with the May 2, 2024 wellbore snapshot. The RRC wellbore snapshot immediately before closing contains 1,347,917 statewide records. The November 3, 2026 snapshot contains 1,371,619. The principal geography is Glasscock, Howard, Martin, Midland, Reagan and Upton counties. It excludes New Mexico, the Delaware Basin and Pioneer interests outside these counties.[5]
For Pioneer legal operator 665748, selecting on-schedule oil wells in producing, shut-in and specified inactive-producer statuses gives 8,451 records, 8,386 unique ten-digit API well identifiers and 4,055 district/oil/lease keys. All 8,386 APIs are found in the later snapshot. The later snapshot has on-schedule records for 7,062 of those wells, with 7,014 under the Pioneer legal operator and 48 under other operators. No current operator is asserted for the 1,324 without an on-schedule record. An old off-schedule operator label is not current ownership.[5]
The downloadable crosswalk carries API identity through these changes. It preserves leading zeros and distinguishes physical wellbores from multiple completion records. The crosswalk follows wells Pioneer operated before closing. Mineral title, non-operated interests, some subsidiaries and the full acreage remain unverified. Two snapshots also do not replace a full dated P-4 transfer history.
Original permits can help trace newly completed wells. A well filed under Pioneer after closing may have received its API only after the acquisition. Of the 558 Pioneer-filed 2025 wells, the archived wellbore snapshot alone links only one API to Pioneer. Archived original W-1 permits provide another way to trace development history. 116 of 558, or 20.8%, have a documented original permit issued before closing under Pioneer operator 665748. Ninety-six also match the permit number cited in the completion packet; 20 connect by API to a different older permit. Twenty-four of those permits were issued before 2023. All 465 comparison wells completed in 2023 also match original Pioneer permits. These records establish pre-close development lineage for a subset; the complete boundary of acquired mineral title remains unverified. The wider observations are therefore labeled Pioneer-filed, with original-permit linkage flagged.[5, 10]
The API crosswalk follows legacy wells through operator changes. The permit match documents development history for newer wells.
4. Longer completed intervals and lower initial output per foot
The completion analysis processes 1,309 publicly available daily ZIP files, containing 147,819 data packets, for January 2023 through November 10, 2026. Approved initial-potential horizontal completions are deduplicated by API and packet history. The final descriptive sample contains 4,848 wellbores across 2023–26, including legacy XTO, with the cleanest annual comparison using 2023 versus 2025 to avoid the integration year and incomplete 2026.[6]
“Length” below means the reported perforation envelope, calculated from completion interval endpoints. It approximates completed lateral span from the reported perforations. The rate measures a reported one-day initial-potential test. All 1,023 Pioneer observations in the two comparison years have one reported lateral and a 24-hour test.
| Filing-operator group | Wells, 2023 / 2025 | Median completed span, ft, 2023 / 2025 | Median one-day oil test per 1,000 ft, b/d, 2023 / 2025 |
|---|---|---|---|
| Pioneer | 465 / 558 | 10,330 / 13,091 | 111.5 / 91.9 |
| Diamondback + Endeavor | 484 / 456 | 10,354 / 10,432 | 102.5 / 105.0 |
| Occidental + CrownQuest/CrownRock operations | 218 / 210 | 10,169 / 10,193 | 84.1 / 74.2 |
| ConocoPhillips group | 95 / 64 | 10,364 / 10,330 | 94.7 / 90.9 |
Source: author calculations from approved RRC W-2 packets; source fields, packet identifiers and exclusions supplied. The table takes the median of the ratios calculated for individual wells.[6]
Pioneer’s absolute median oil test fell from 1,265 to 1,186.5 barrels a day, or 6.2%, while completed span rose 26.7%. This is compatible with several explanations: different drawdown, completion timing, lift, geology, interference or a development strategy favoring longer wells with lower output per foot. It cannot isolate technology effectiveness.
RRC fields cover producing benches that the public data do not distinguish. “Spraberry (Trend Area)” spans multiple horizons, and a reported deepest formation does not reliably identify the landing zone. The report therefore provides same-county, same-regulatory-field comparisons and leaves same-bench treatment effects UNKNOWN.
Within common county/field strata, using fixed 2023 Pioneer well-count weights and at least five observations in each operator/year cell, Pioneer’s test intensity changes by −16.1% versus +4.4% for Diamondback/Endeavor: a −19.7% relative change. Corresponding relative changes are −8.9% against Occidental/CrownQuest and −11.1% against ConocoPhillips. The comparison uses weighted averages of stratum medians.[6]
The magnitude is sensitive to selection. Adding test method produces a relative difference of −8.9% against Diamondback with a five-well minimum, but −22.6% with a ten-well minimum. The smaller-cell result gives substantial weight to a six-observation peer cell. Restricting tests to 0–30 days after completion and matching method gives −17.4%. Pumping became more common in the Pioneer sample, rising from 54.4% to 65.9%. The defensible inference is that the initial-test panel does not show a broad improvement per foot; a precise merger penalty is not identified.[6]
The 116-well 2025 subset with original pre-close Pioneer permits has a median completed span of 15,504 feet and test intensity of 93.5 b/d per 1,000 feet, versus 10,330 feet and 111.5 for the 2023 cohort. The stricter 96-well subset matching the completion permit has the same median span and 92.6 b/d per 1,000 feet. Restricting to documented development lineage therefore preserves the broad pattern, although permit timing and selection still prevent causal attribution.[6, 10]
5. Six months of production on leases with one observed well
Texas usually reports oil production for each lease. Dividing a multiwell lease’s barrels among API numbers would manufacture well observations. The RRC production dump was therefore joined only after converting internal district codes and preserving its report-filed flag. A missing report is not a reported zero.[7]
The restricted production sample requires a single observed API on the lease across the two wellbore snapshots and the completion records, no completion-report statement of multiple producing wells, a first positive production month near completion, and six subsequent fully reported calendar months. The first positive month is excluded because it can be partial. Six calendar months are not precisely 180 days. These filters favor particular lease structures and produce a small, selected panel.
The full production-table scan covered 79.4 million lease-cycle records and selected 369,538 relevant lease-months. Of 2,787 selected 2023/2025 completions across the four requested groups plus legacy XTO, 147 pass the strict production screen, including 29 Pioneer observations in 2023 and 16 in 2025. The production extract extends through August 2026; the six-month comparison conservatively uses a June 2026 maturity cutoff.[7]
| Pioneer restricted sample | 2023 | 2025 |
|---|---|---|
| Eligible single-observed-API leases | 29 | 16 |
| Median completed span | 10,301 ft | 12,861 ft |
| Median oil over six subsequent full months | 96,277 bbl | 130,097 bbl |
| Median six-month oil per 1,000 completed feet | 8,923 bbl | 8,641 bbl |
| Median month-six/month-one calendar-day oil-rate retention | 46.3% | 60.2% |
Median six-month oil per well rises 35.1%, while the median normalized measure falls 3.2%. Within Pioneer’s one usable common county/field cell, Midland/Spraberry, normalized six-month production falls 6.9%, based on 21 versus seven observations. The retention statistic includes downtime and operating decisions; it is not a fitted reservoir-decline coefficient.
Peer coverage is too sparse for the requested controlled monthly-production inference. Diamondback/Endeavor has 14 versus seven eligible wells; Occidental/CrownQuest 22 versus ten; ConocoPhillips 46 versus none. No peer has even one common county/field stratum with at least three observations in all four operator/year cells. The study leaves landing-bench comparisons unresolved.[7]
The selected Pioneer wells produced more oil over six months and slightly less oil per completed foot. A six-month history gives an early production comparison for these leases. Estimating lifetime recovery or the effect of the merger would require longer histories and controls for landing bench, interference and which wells entered the sample.
The fixed pre-close lease list reports 185.9 million gross oil barrels in 2023 and 109.2 million in 2025, from 43,734 and 47,178 filed lease-months respectively. Only filed reports are summed. Those totals do not measure decline of the original 8,386 wellbores: frozen leases can receive new infill, while wells or production can move to new lease keys outside the list. They also include other working interests and royalties. The series is supplied to audit continuity, without interpreting its movement as a merger-driven production loss.[7]
6. Pad geometry, water, proppant and drilling activity
Public surface coordinates provide a check on development batching, although they do not identify official pads. RRC county GIS files distinguish surface from bottom-hole points and specify the coordinate datum. All 465 Pioneer 2023 and 558 Pioneer 2025 completion observations match one surface point.[8]
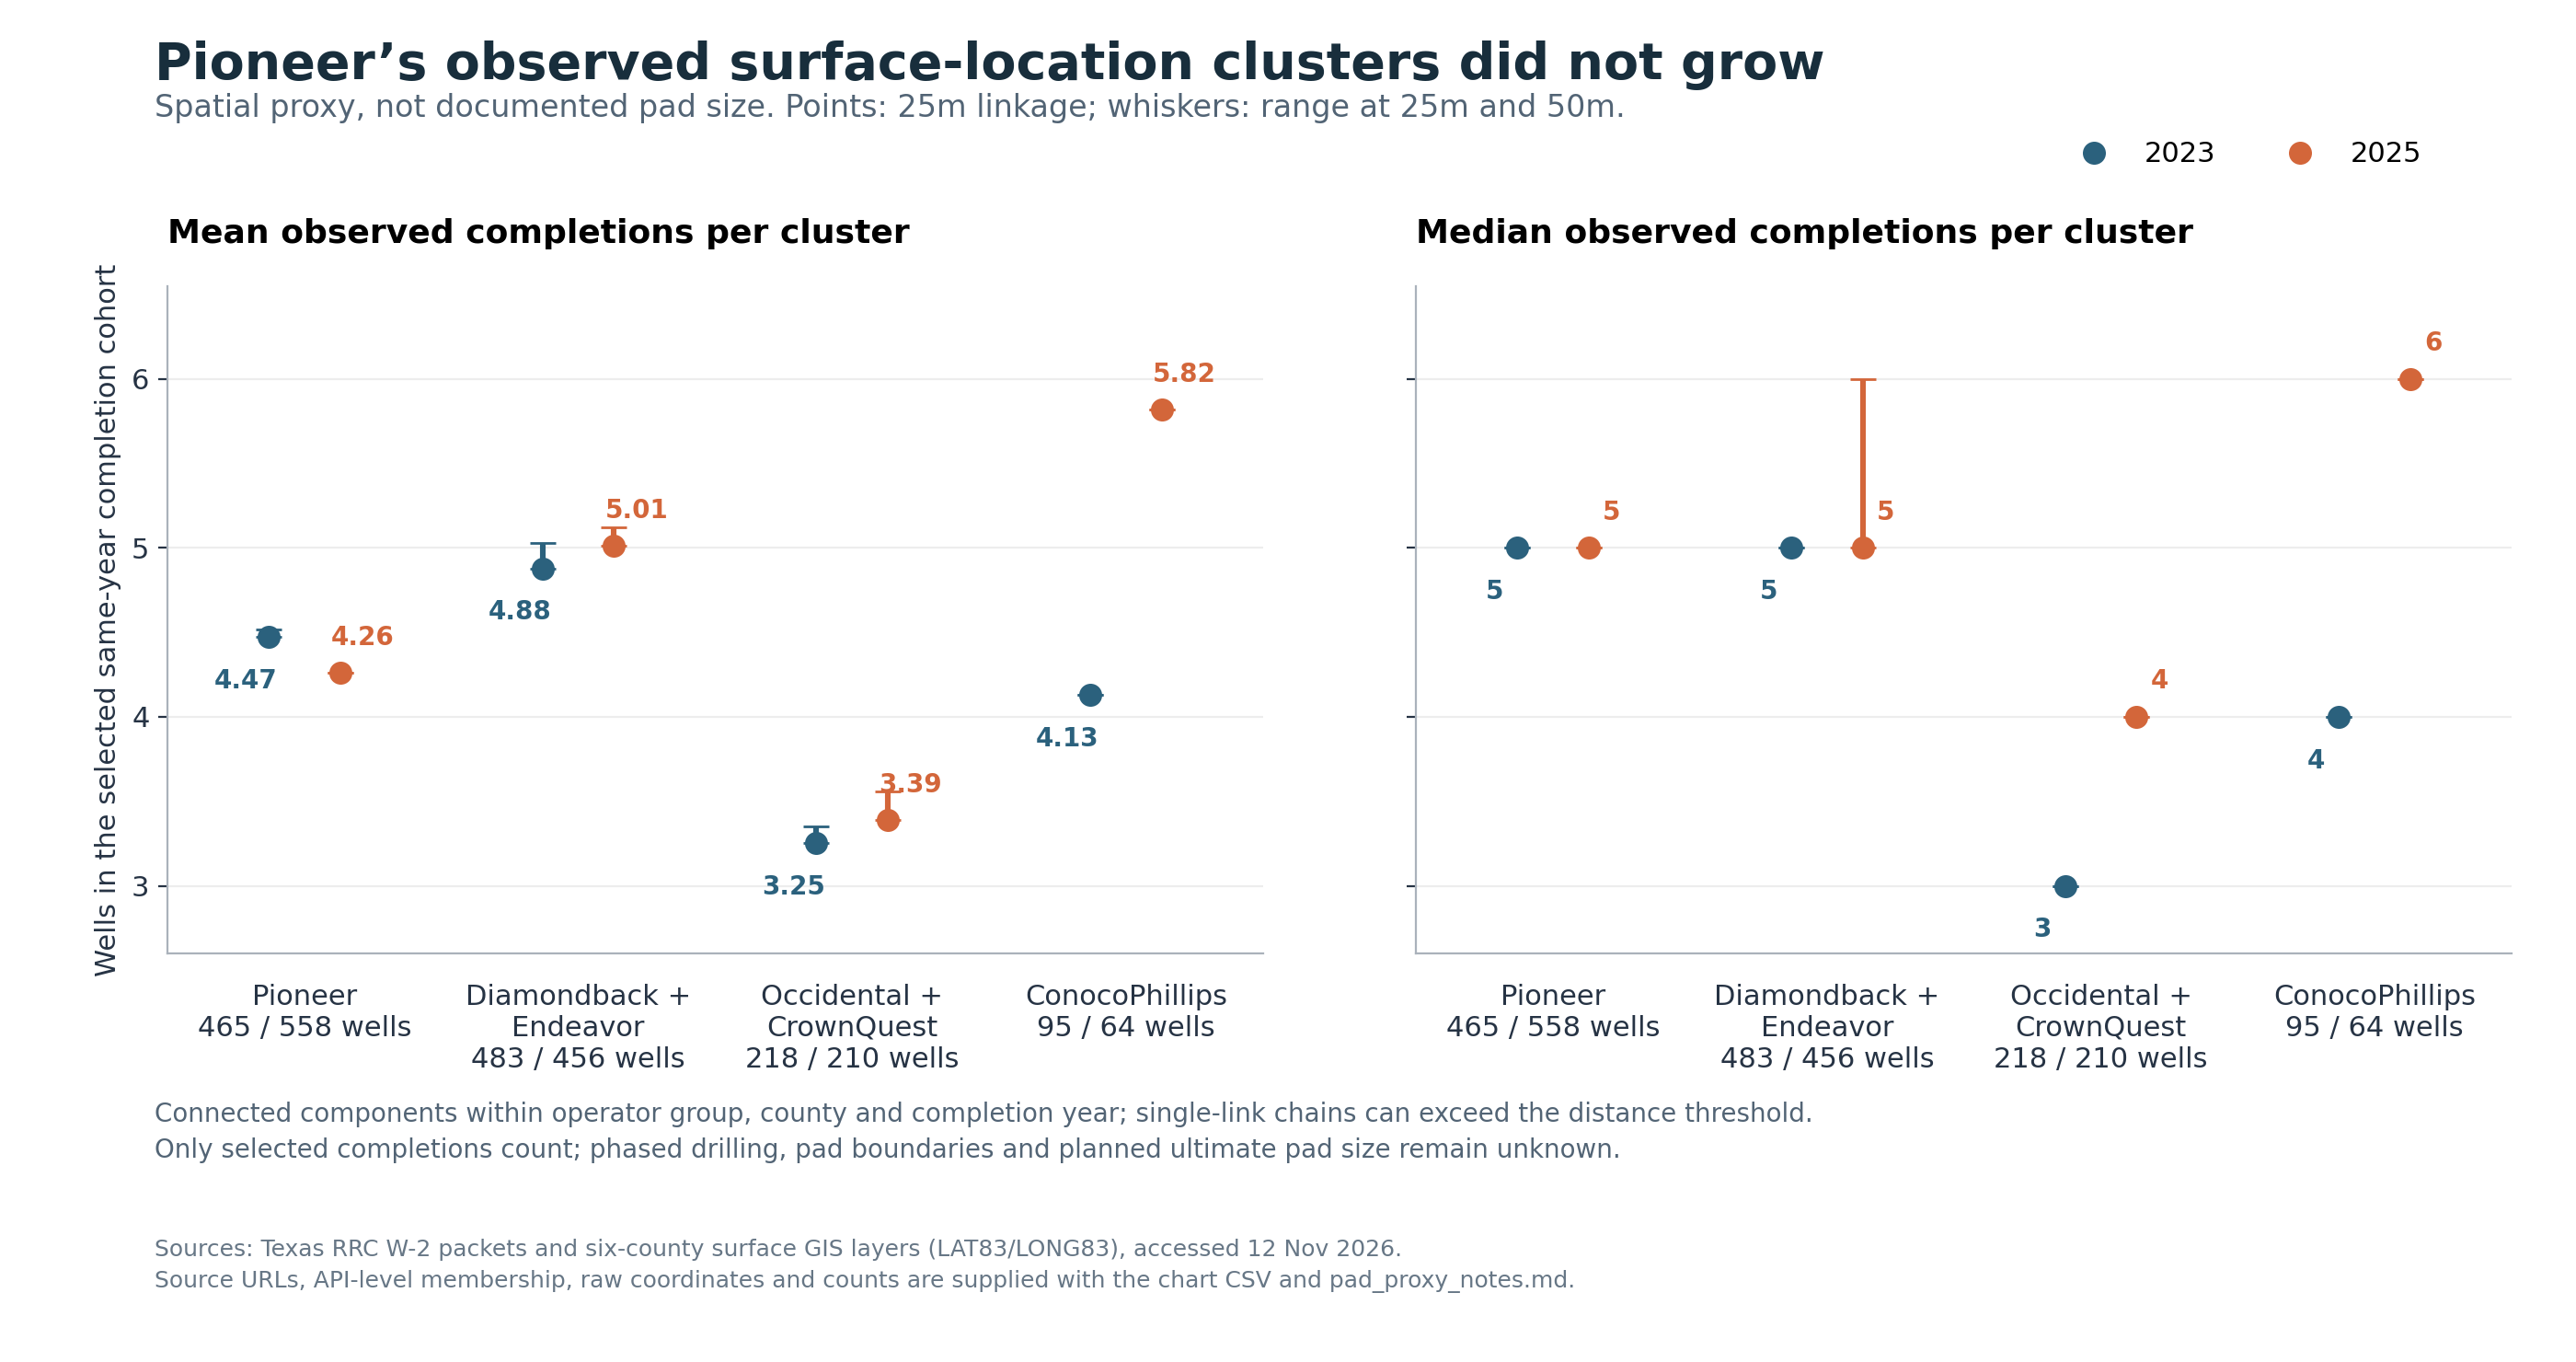
Grouping wells from the same operator group, county and completion year into connected surface clusters with a 25-metre neighbor threshold gives 4.47 observed wells per cluster in 2023 and 4.26 in 2025. The median remains five. A 50-metre threshold gives 4.51 and 4.26. Thus this proxy does not show larger same-year completion batches. It omits phased completions and off-sample wells, and connected clusters can extend beyond the neighbor threshold. It cannot be renamed measured pad size. Removing the single longer-chain 2023 Pioneer cluster does not reverse the result.[8]
FracFocus disclosures also record completion water volumes. Its public records match 465 of 465 Pioneer 2023 observations and 553 of 558 in 2025 within the specified job-date window. Median disclosed base-water volume per perforated foot is 1,809 gallons in 2023 and 1,788 in 2025, a 1.1% reduction. The mean moves the other way, from 1,847 to 1,943 gallons per foot. The median changed little, while the mean increased.[9]
| Group | Positive-water observations, 2023 / 2025 | Median gallons per completed foot, 2023 / 2025 |
|---|---|---|
| Pioneer | 465 / 553 | 1,809 / 1,788 |
| Diamondback + Endeavor | 466 / 440 | 1,895 / 1,953 |
| Occidental + CrownQuest | 214 / 196 | 1,922 / 1,856 |
| ConocoPhillips | 82 / 60 | 2,057 / 2,012 |
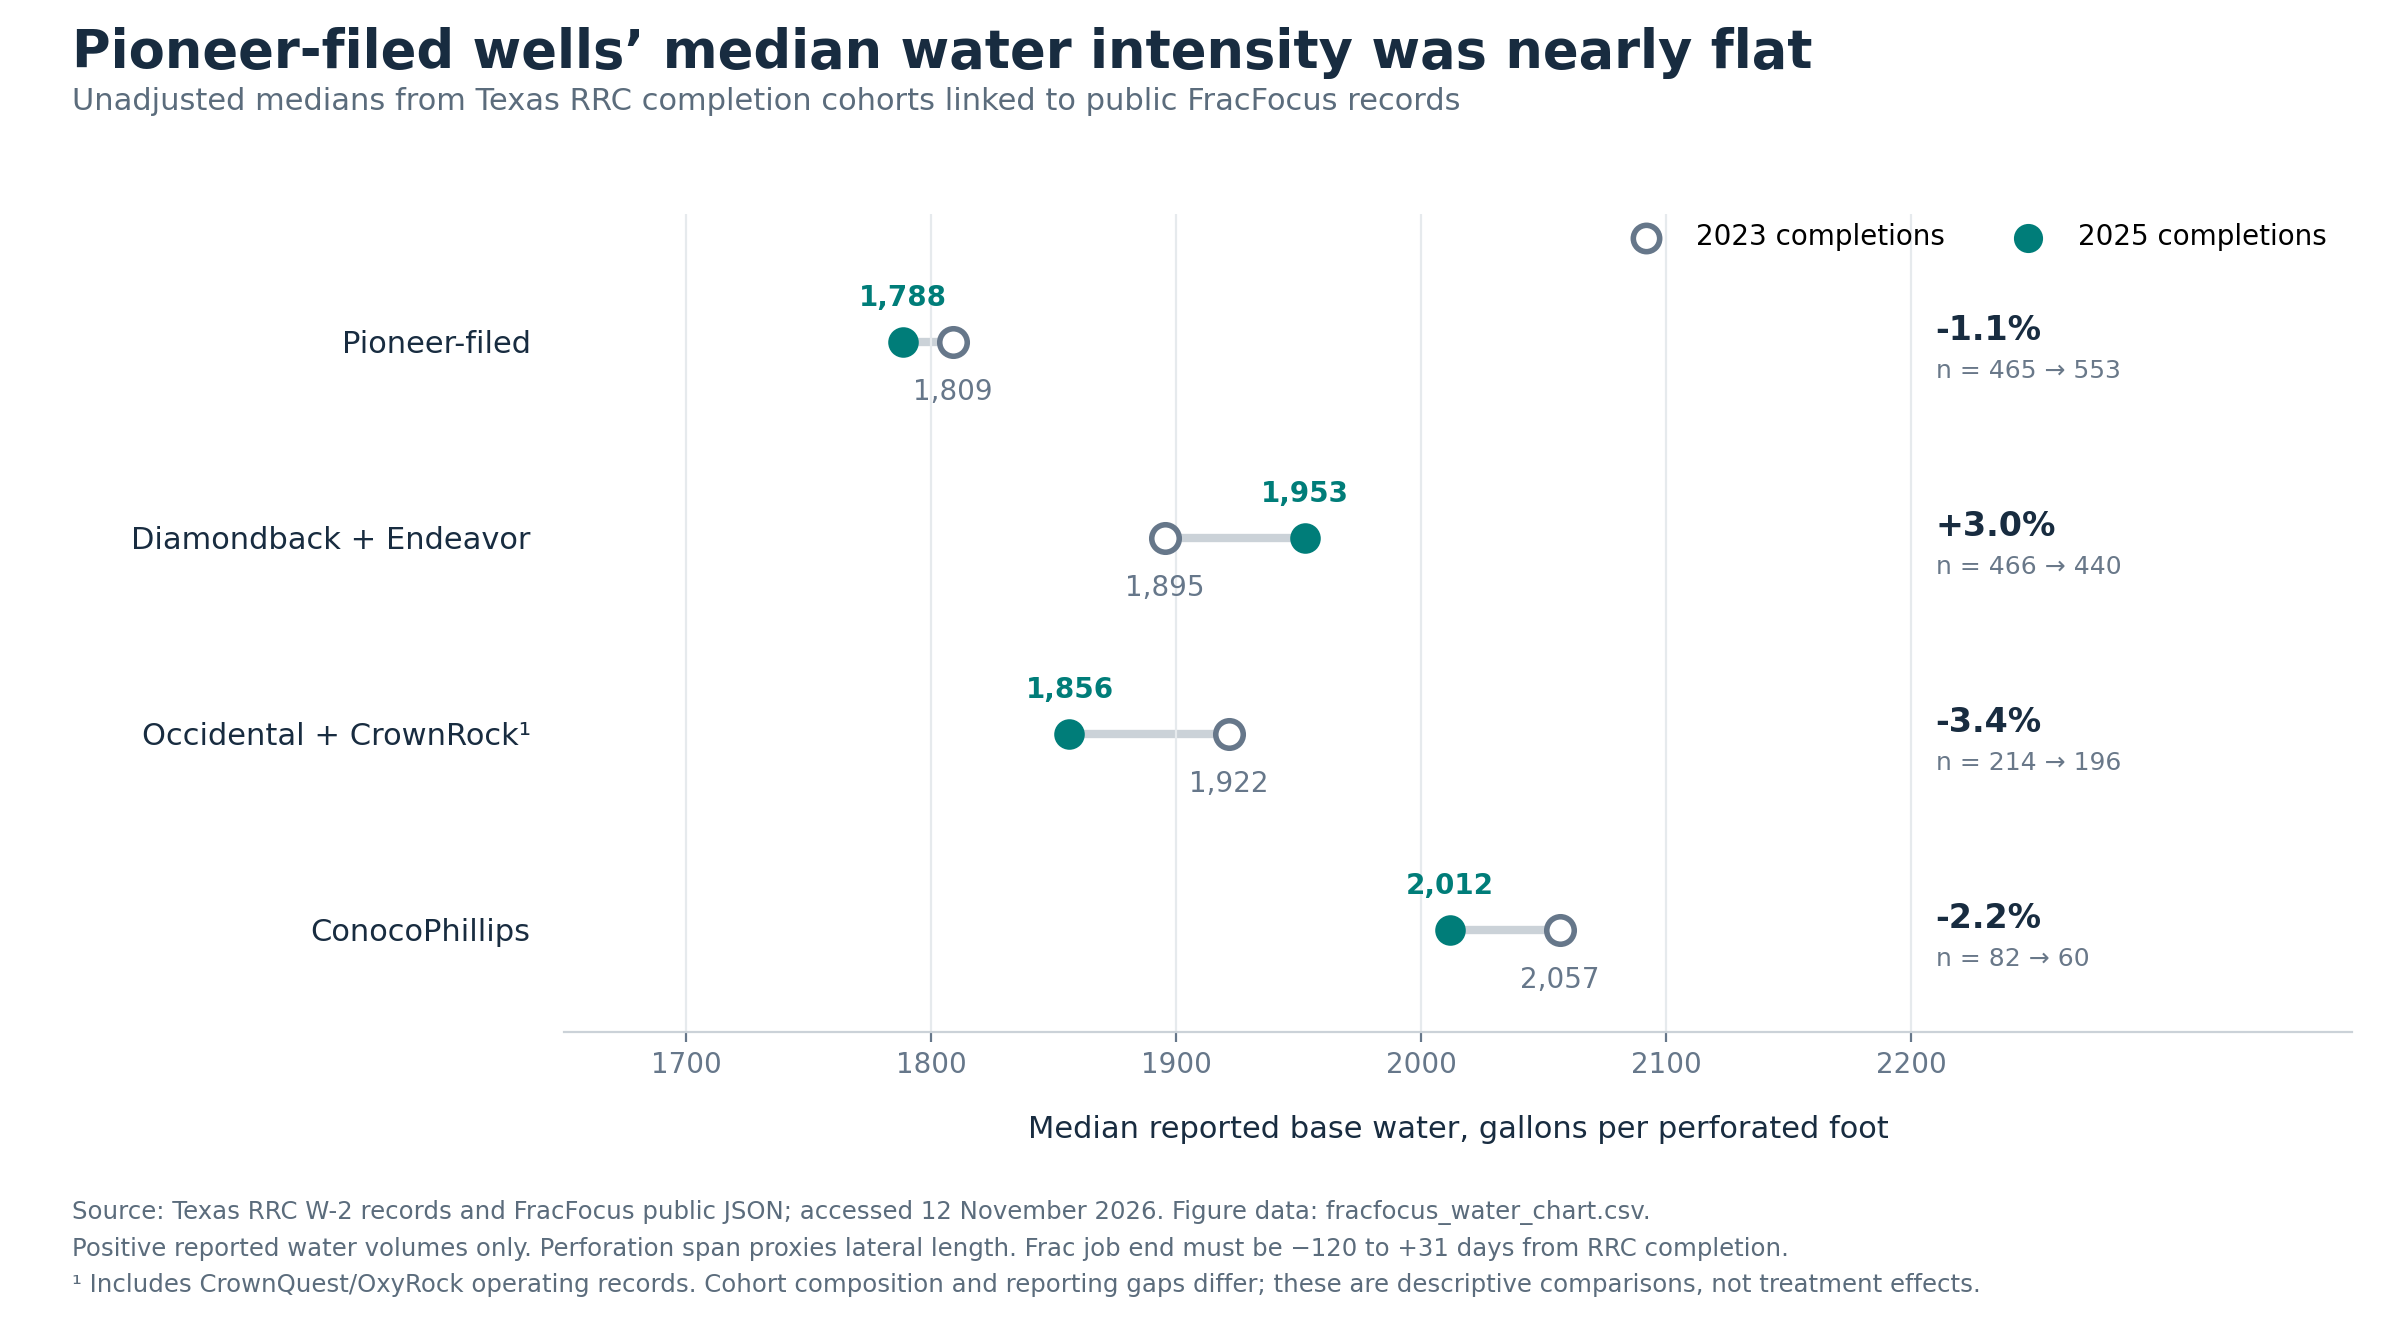
The joining rule uses the nearest disclosed job end between 120 days before and 31 days after the RRC completion date, preserving alternatives and signed date differences. RRC “work completed” need not equal the fracture-job date. These pooled medians are not county/bench-adjusted causal estimates. Base water also does not measure freshwater consumption or distinguish recycled water, and non-water fluids with different units are not summed into gallons.[9]
Same-county/field standardization reinforces the limited water conclusion: against Diamondback/Endeavor, Pioneer water per foot increases 1.5% versus 1.0%, a relative change of just +0.5%. Across the three peer comparisons, relative changes range from approximately −1.4% to +0.5%. Total gallons divided by total footage in the unadjusted Pioneer sample rises 4.5%; a nearly flat median should not be mistaken for reduced program water use.[9]
Sand intensity remains an unresolved data-quality question. A fixed diagnostic sample of the first 50 API numbers in each operator/year group requested 400 records; 395 returned disclosures, 386 met the date rule and 375 contained positive reported quartz mass. Fourteen exceed an analyst review flag of 6,000 pounds per foot; one implies roughly two million pounds per foot. The table reports the raw values and flags. This deterministic sample is not geographically random because API prefixes encode counties.
FracFocus’s guide explains that ingredient mass can be calculated by the registry when not supplied. Summing CAS 14808-60-7 measures only registry-reported quartz mass. Exact duplicate ingredient rows account for none of the positive quartz-mass anomalies. Proprietary composition, other proppants, mass provenance and units remain unresolved. Consequently, the report does not turn diagnostic sand medians into a claimed merger saving. A record-level mass reconciliation and treatment and control well identifiers would make the comparison testable. The CSV collection includes the diagnostic sample and its flags.[9]
Original-approved horizontal new-drill permits in the six counties provide a comparable activity measure:[10]
| Filing-operator group | 2023 permits | 2025 permits |
|---|---|---|
| Pioneer | 487 | 486 |
| Diamondback + Endeavor | 494 | 336 |
| Occidental + CrownQuest | 225 | 150 |
| ConocoPhillips | 69 | 67 |
The series uses archived original W-1 sequence-99 records. Allowing later horizontal amendments would raise Diamondback’s 2025 count to 339; the original-permit definition is used consistently here. Pioneer totals 487 in 2023, 533 in 2024, 486 in 2025 and 588 through November 6, 2026. That indicates continued inventory development; permits are neither wells completed nor rigs working. Pioneer disclosed 22 rigs and six fracture fleets at June 30, 2023, and 20 rigs and five fleets at March 31, 2024. A comparable public post-close former-Pioneer rig series was not found. Exxon’s October 2026 disclosure of three automated rigs describes a subset, not the whole acquired fleet.[10]
The peer groups are themselves changing. Diamondback closed Endeavor in September 2024 and Double Eagle in April 2025; Occidental closed CrownRock in August 2024; ConocoPhillips closed Marathon in November 2024. They provide regional context, and their own acquisitions limit the comparison.[15]
Their own operating disclosures also show why a simple before/after test is insufficient. Diamondback reports an average 15 rigs in 2025 and estimates that its workload would have required 22 at its 2023 pace; the 22 is Diamondback’s workload estimate. Occidental reports $530 per lateral foot for specified Midland zones in 2025, including drilling, completion, hookup and first lift. ConocoPhillips reports approximately 30% fewer Lower 48 rigs and fracture crews than its 2024 pro forma base. These definitions and geographies differ. They describe activity in the wider industry using company-specific definitions.[15]
7. What the reported financial record does—and does not—show
Exxon reported Permian production of approximately 610,000 boe/d in 2023, 1.185 million in 2024, and 1.6 million in 2025. Third-quarter 2026 production exceeded 1.8 million boe/d. The 2024 number includes Pioneer only after May 3; 2025 includes a full year. Consequently, the apparent roughly 35% annual increase from 2024 to 2025 is not an organic productivity measure. Nor is the combined Permian series the former Pioneer business alone.[2, 4]
Exxon reports capital spending for all US upstream operations. On the consistently recast cash-capital-expenditure basis in the 2025 filing, US Upstream cash capex rose from $11.276 billion in 2024 to $15.907 billion in 2025; global Upstream cash capex rose from $20.261 billion to $24.659 billion. US Upstream includes assets beyond the Permian. Neither figure supplies a Pioneer-only sustaining-capital requirement or a measured merger saving. Earlier capital-and-exploration disclosures use a different basis and are not spliced into this series.[2]
For the first nine months of 2026, global Upstream cash capex was $16.645 billion, versus $18.276 billion in the corresponding 2025 period. This remains a global segment measure; Exxon provides no standalone former-Pioneer capital or operating cost breakdown.[16]
The share arithmetic makes the financing visible:
| Measure | 2023 | 2024 | 2025 | First nine months 2026 |
|---|---|---|---|---|
| Shares outstanding at period end, million | 3,971 | 4,353 | 4,179 | 4,079 |
| Pioneer acquisition shares issued, million | — | 545 | — | — |
| Program repurchases, million shares | 162 | 167 | 180.1 | See all-share figure below |
| Program repurchase cash, $bn | 17.5 | 19.1 | 20.0 | — |
For the first nine months of 2026, the filing reports approximately 100 million shares acquired for $15.1 billion. Program repurchases, total share acquisitions and cash-flow totals can differ because of employee withholding, excise tax and timing. They are not combined as if identical measures. The July 2026 parent-company reorganization exchanged shares one-for-one; cancellation of treasury shares was not another market buyback. Despite repurchases, year-end 2025 shares outstanding remained 5.2% above year-end 2023.[2, 16]
The clean pre-deal cash anchor is Pioneer’s 2023 filing. Operating cash flow was $8.448 billion. Subtracting $4.571 billion of cash oil-and-gas additions and $177 million of other cash asset additions gives $3.700 billion after-interest cash FCF. Adding back $127 million of cash interest at the model’s estimated 23% tax rate gives approximately $3.798 billion of unlevered cash flow, a 5.6% yield on the $68 billion gross purchase base.[11]
That differs from Pioneer’s reported non-GAAP FCF of $4.111 billion, which reconciles as operating cash flow plus $169 million of working-capital adjustment and $47 million of after-tax merger costs, less $4.553 billion of adjusted capital expenditure. Both measures are preserved. Neither is silently substituted for the other.
Pioneer produced 714,730 boe/d in 2023, including 372,127 barrels/day of oil, at a reported oil realization of $77.03. Reported production costs of $7.81/boe and production/ad valorem taxes of $3.02/boe are historical operating and tax line items. First-quarter 2024 production was 747,981 boe/d, and cash FCF calculated from the cash-flow statement was approximately $979 million. These observations anchor the model’s scale without inventing a standalone 2025–26 history.[11]
8. Purchase-return model: what is known, estimated and missing
The filed merger proxy contains Pioneer’s management forecast prepared using the October 2, 2023 commodity strip. It is the best disclosed standalone planning anchor, although it predates closing and is unaudited prospective information.[13]
| Year | Oil price, WTI $/bbl | Production, thousand boe/d | Adjusted EBITDAX, $bn | Capex, $bn | Unlevered FCF, $bn |
|---|---|---|---|---|---|
| 2024 | 82.95 | 772 | 11.372 | 4.571 | 5.659 |
| 2025 | 76.15 | 827 | 11.119 | 4.950 | 5.024 |
| 2026 | 71.54 | 884 | 11.018 | 5.212 | 4.494 |
| 2027 | 67.96 | 949 | 11.085 | 5.383 | 4.394 |
| 2028 | 65.07 | 1,022 | 11.326 | 5.380 | 4.642 |
Unlevered FCF already deducts capital expenditure, unlevered taxes and working-capital requirements. The model does not deduct capex or tax the baseline a second time.
There are two oil-price comparisons. The closing-available expectations proxy uses the April 9, 2024 EIA forecast for 2024–25: $85.83 for the post-close 2024 calendar period and $82.48 for 2025. The 2026 input remains the older proxy’s $71.54 because an auditable free closing-date 2026 forward curve was not recovered. Later years use scenario prices. This hybrid must not be called Exxon’s closing price assumptions or the May 3 futures curve.[13, 17]
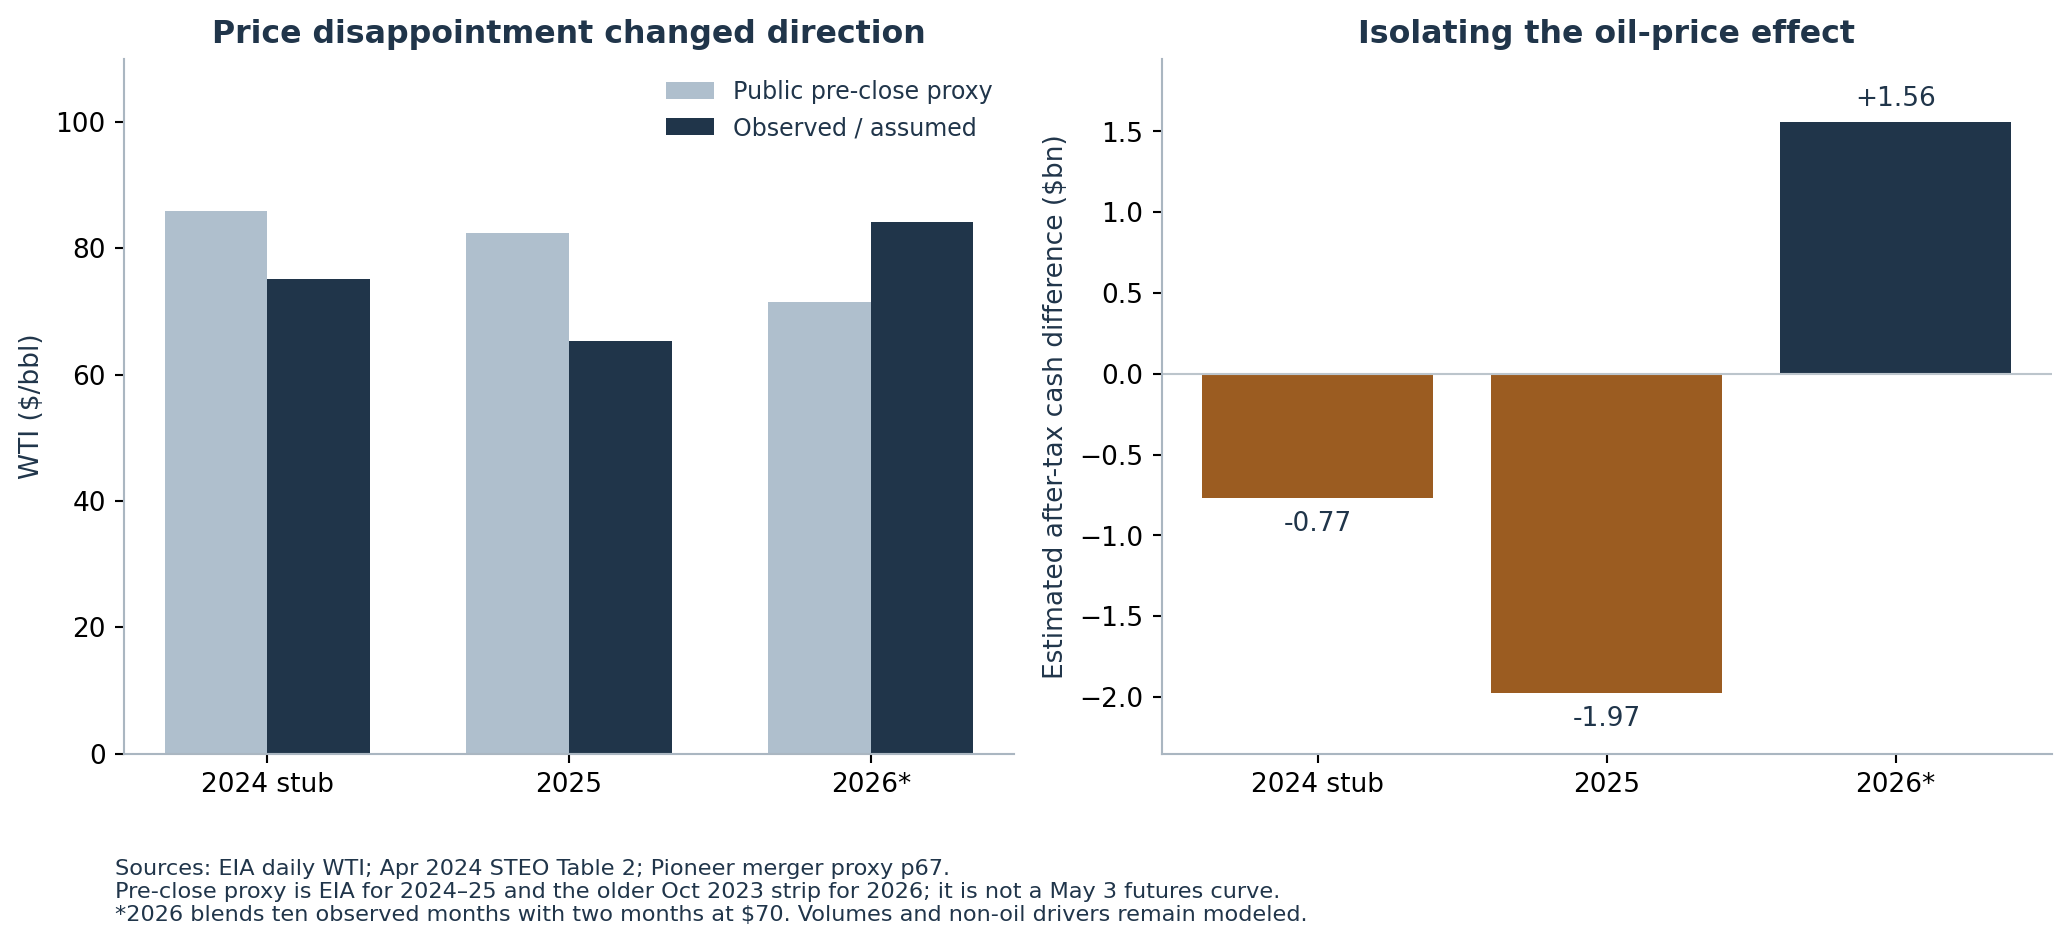
The observed-price update uses available daily EIA WTI observations: $75.10 for May 3–December 2024, $65.39 for 2025, and $87.02 for January–October 2026. Full-year 2026 blends ten observed months with two months at the scenario price. The observed values are benchmark prices. The 2026 case includes two forecast months. The model does not claim to have observed post-close Pioneer cash flow.[17]
For each year, the oil-price cash adjustment is:
Estimated net oil barrels × (new WTI-proxy WTI) × (1-4.6%) × (1-23%).
Oil volumes use the proxy production forecast and Pioneer’s reported 2023 oil share of 52.1%. The 4.6% rate is the standard Texas oil-production tax; exemptions are not modeled. The 23% marginal income-tax rate is an analyst estimate. Gas and NGL prices, basis differentials, operating costs, working capital and baseline volume forecasts remain unchanged. This isolates an oil-price sensitivity rather than constructing a fictional realized income statement.[11, 18]
The initial investment is −$68 billion on May 3, 2024. In an all-stock transaction this represents the value of stock consideration and assumed debt. Annual cash flows occur on December 31, with standalone 2024 cash flow prorated to 243/366 of the year. XIRR uses the dates of the modeled cash flows. The modeled 2024–33 window contains ten calendar buckets but only about 9.66 years after purchase.
Synergy assumptions are $1 billion, $3 billion or $4 billion of average annual pretax cash benefits. The timing weights are 0.10, 0.30, 0.60, 0.85, 1.10, 1.30, 1.45, 1.45, 1.45 and 1.40 across 2024–33, summing to ten. The timing weights are model assumptions. Applying 23% tax uniformly is an approximation: recovery revenue, operating savings and avoided capex have different tax timing. No additional recovery uplift is added to volumes on top of cash synergies. Dollar benefits are modeled at each oil-price scenario: recovery-related value is price-sensitive, but no updated public component breakdown supports a reliable mechanical price adjustment to the latest $4 billion claim.
For 2029–33, 2028 standalone production, capex and cash flow are held flat. That assumes continued spending can offset decline. It avoids extrapolating perpetual growth but is not unconditionally conservative. The terminal value is five times 2033 standalone unlevered cash flow, excluding synergy, with zero, three and seven times tested. The model applies a multiple to free cash flow. The proxy adviser applied its multiple to EBITDA.
9. Low, base and high cases—and the assumptions that decide them
All cases use the observed-price update through the available periods, a $68 billion gross purchase base, the specified synergy ramp and the five-times standalone terminal value.
| Estimated outcome | Low | Base | High |
|---|---|---|---|
| Long-run WTI, $/bbl | 55 | 70 | 85 |
| Average pretax annual synergy, $bn | 1 | 3 | 4 |
| Return using closing-available price proxy | −2.0% | 6.3% | 11.0% |
| Return after observed WTI update | −2.3% | 6.0% | 10.7% |
| NPV at 10%, $bn | −34.9 | −13.9 | +2.8 |
| Present value of acquired cash flows, $bn | 33.1 | 54.1 | 70.8 |
| Undiscounted cash received / purchase | 0.86× | 1.46× | 1.96× |
These estimates do not prove that Exxon overpaid by $13.9 billion. They show that the base assumptions fail a 10% acquisition hurdle. Different sustaining capital, realized pricing, recovery and residual-resource values could change the answer materially. The observed oil-price update lowers base-case present value by about $1.2 billion relative to the hybrid expectations proxy; the difference comes from changing the model’s oil prices.
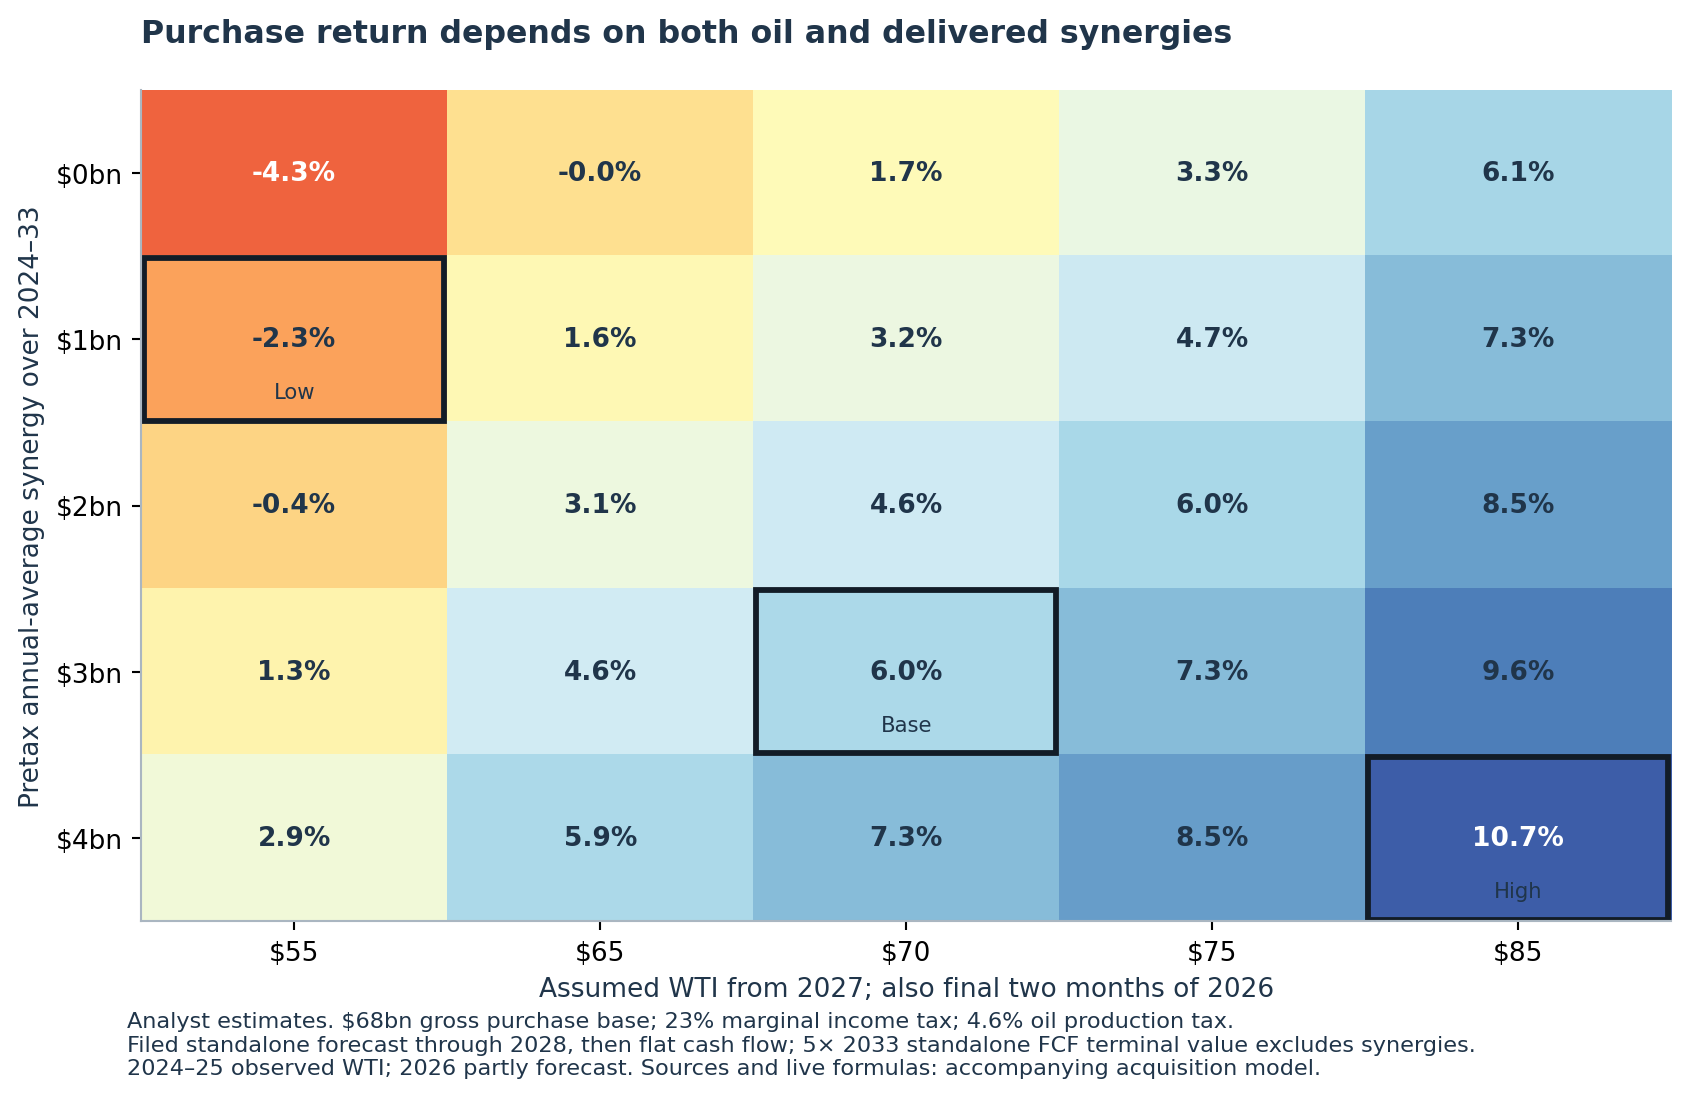
At the same $70 long-run WTI assumption, raising average pretax synergy from $3 billion to management’s $4 billion raises the estimated return from 6.0% to 7.3%, still below 10%. The original $2 billion synergy assumption produces approximately 4.6%. Oil price and purchased-asset cost remain central even if management achieves its current synergy target.
| Estimated acquisition return | $55 WTI | $65 WTI | $70 WTI | $75 WTI | $85 WTI |
|---|---|---|---|---|---|
| $1bn average annual synergy | −2.3% | 1.6% | 3.2% | 4.7% | 7.3% |
| $2bn | −0.4% | 3.1% | 4.6% | 6.0% | 8.5% |
| $3bn | 1.3% | 4.6% | 6.0% | 7.3% | 9.6% |
| $4bn | 2.9% | 5.9% | 7.3% | 8.5% | 10.7% |
Within this model, $4 billion of average synergy requires roughly $82 WTI in the long-run price assumption to reach a 10% return. That threshold is conditional on the production and capital spending forecast and terminal value; it is not a geological breakeven or Exxon’s corporate oil-price requirement.
Terminal value and sustaining capital are equally revealing. With base oil and synergy assumptions, removing terminal value lowers the estimated return to 1.2%. Three, five and seven times terminal standalone cash flow produce 4.3%, 6.0% and 7.4%, respectively. Adding 20% to forecast capex from 2027, without inventing an immediate tax benefit, lowers the five-times base return to 3.8%. These sensitivities identify where more operating evidence has the greatest valuation value.
Exxon’s published greater-than-40% Permian development return and approximately $30/bbl cost of supply address new investment from today. They do not charge those projects with the full stock consideration paid for Pioneer. A profitable marginal drilling program can coexist with a modest return on the purchase price.[3, 4]
10. Former Pioneer shareholders outperformed the selected peers
For one Pioneer share held into closing, the economic position became 2.3234 Exxon shares, ignoring fractional-share cash and taxes. Using the May 3 closing Exxon price of $116 and the November 11, 2026 price of $166.71, plus $9.98 of dividends per Exxon share during the holding period, gives 52.3%. The exact calculation is (166.71 + 9.98) / 116 − 1; the exchange ratio cancels in the percentage return.[12]
| Security held over the same period | Start price | End price | Dividends held as cash | Holding-period return |
|---|---|---|---|---|
| Exxon | $116.00 | $166.71 | $9.98 | 52.3% |
| Diamondback† | $201.50 | $180.98 | $12.46 | −4.0%, conditional |
| ConocoPhillips | $122.23 | $137.86 | $8.04 | 19.4% |
| Occidental | $64.39 | $57.24 | $2.42 | −7.3% |
The calculation holds dividends as cash through the endpoint. Variable dividends are included where paid and entitled within the period; dividends after the endpoint are excluded. Prices come from issuer historical-price services, contemporaneous SEC-filed price references and the public Nasdaq quote record. Dividend amounts tie to filings and issuer declarations. The raw receipts preserve dates and source-service adjustment language.[12]
† Diamondback qualification: its issuer history carries a generic split/dividend-adjustment notice. The calculation treats the $201.50 starting observation as an unadjusted close. Contemporaneous confirmation of that interpretation was not recovered, so its −4.0% result remains conditional. The other three starting prices have independent primary-source confirmation.
The result measures the security shareholders received. Exxon shareholders also own Guyana, LNG, refining, chemicals and other assets. Relative equity performance incorporates valuation changes and commodity exposures across those businesses. It cannot be attributed solely to Pioneer integration. Share buybacks likewise redistribute ownership of the whole company; they do not independently prove that the acquired wells earned the cost of the stock issued.
11. What would change the conclusion
The checks covered the acquisition terms, well data and modeled returns. First, the acquisition basis and synergy definitions were reconciled across the announcement, closing filing, annual acquisition notes and later plan footnotes. Second, an independent calculation reproduced the 4,848-well completion selection and examined 24 original packets against 13 extracted fields; the length and test results reconcile. Third, the cash-flow equations and all three case returns were independently recomputed outside the spreadsheet, and the workbook reproduced them with live XIRR formulas. A check on the production records also reproduced all 147 eligible production observations and their six-month calculations, including every Pioneer well in that subset. FracFocus header quantities were checked against full disclosure responses and selected PDFs; the checks compare fields from the same underlying submissions.
The evidence most likely to improve the valuation is a reproducible bridge from specific well improvements to after-tax cash:
- Publish the pilot API identifiers and comparable control definitions. Landing bench, spacing, parent/child status, completion dates and drawdown would make the 20% early-production claim testable.
- Extend the production window. Eighteen to twenty-four months of comparable cumulative production and decline would be more informative than a one-day test or eight-month chart, while still falling short of observed lifetime recovery.
- Development costs and sustaining capital. Longer wells can reduce cost per foot while requiring more dollars per well. The acquisition return depends on cash remaining after the spending needed to replace decline.
- Reconcile Pioneer cash synergies. A reconciliation would quantify recovery, operating savings, avoided capex, integration costs and taxes, and account for overlap with company-wide structural savings.
- Disclose the acquired-business cash bridge. Pioneer-only cash generation, capex and realized oil/gas/NGL pricing would replace the weakest model assumptions.
Evidence of persistent production gains per foot at similar geology and capital intensity would raise confidence in the recovery thesis. A requirement for materially higher sustaining capital, or gains confined to a narrow pilot, would lower it. The completed-span increase is already observable. The step from that operating change to an attractive return on approximately $68 billion remains conditional.
Source and audit key
Source access date for the Pioneer analysis was November 12, 2026. Printed page numbers refer to the document’s numbering; named sections or data tags are supplied for HTML and machine-readable sources. Every material spreadsheet input and target-ledger row gives its source URL, period and locator. The report identifies calculated well statistics and model results.
[1] Transaction documents. Exxon, October 11, 2023 merger announcement, transaction-terms and production paragraphs; May 3, 2024 closing Form 8-K, Item 2.01. Period: announcement and closing dates.
[2] Purchase accounting and reported financial history. Exxon 2023 Form 10-K, p.50, Upstream Highlights—Permian; 2024 Form 10-K, pp.47, 62, 80, 118–119, Note 21; 2025 Form 10-K, pp.29, 44, 60, 74–75, 112–113, Note 20. Periods: FY2023–25 and acquired operations May 3–December 31, 2024.
[3] Original and 2024 operating targets. October 2023 merger-call filing, prepared remarks p.3 and Q&A pp.6–7; October 27, 2023 filed remarks, slides 18–19; December 2024 Upstream Spotlight, slides 16, 21–23 and definitions/footnotes pp.44–46; December 2024 Corporate Plan, p.31 for 2025 guidance. Periods: forecasts through 2027/2030 and 2024–33 synergy illustration.
[4] Revised targets and pilot limits. August 2025 earnings transcript, p.3; October 2025 slides, p.25; December 2025 Corporate Plan, pp.13–14, 24, 34, 49, 51–52; January 2026 prepared remarks, p.6; March 2026 conference transcript, pp.6–7 and footnotes; October 2026 earnings transcript, pp.3–4, 14–15, 26; October 2026 presentation, p.24. Periods: pilot completion windows 2024–25; plans through 2030 and beyond.
[5] Well identity. Texas RRC wellbore snapshot directory, files OG_WELLBORE_EWA_Report_2024-05-02.csv and OG_WELLBORE_EWA_Report_2026-11-03.csv; definition manual, pp.3–13. Tags: API, operator number, schedule flag, well status, lease and district. Periods: the two snapshot dates.
[6] Completions. Texas RRC completion-data directory, daily archives January 2023–November 10, 2026; subscription manual, pp.3–4, 10–15. Tags: PACKET, W-2, production interval, test duration, calculated 24-hour oil. Each extracted row lists the source archive and packet identifiers.
[7] Production. Texas RRC PDQ bulk directory, PDQ_DSV.zip, October 2026 vintage, OG_LEASE_CYCLE_DATA_TABLE; PDQ manual, pp.4–5, 12–13, 26; reporting help, lease reporting and zero/missing-report definitions. Source coverage through August 2026; six-full-month comparisons use June 2026 maturity cutoff.
[8] Surface geometry. Texas RRC county GIS data, surface-point layers for the six counties, NAD83 attribute coordinates; Digital Map Information User Guide, pp.12–13 for surface/API/NAD83 fields, p.28 for reliability, pp.2/5 for datum/layer conventions; source file inventory and checks in pad_proxy_notes.md. Period: current downloaded geometry joined to 2023/2025 completions.
[9] FracFocus. Public registry and example API disclosure, job headers and ingredient records; exact public search requests, disclosure identifiers, job dates and response receipts supplied. Tags: TotalBaseWaterVolume, JobEndDate, MassIngredient, CAS number. Period: job search September 2022–February 2026, matched to 2023/2025 RRC cohorts. FracFocus User Guide, August 2023 running headers, p.122 for water/non-water units, pp.30/124/127 for ingredient-mass calculation and units. The CSV collection includes the disclosure identifiers and diagnostic data.
[10] Permits and rigs. Texas RRC permit master, daf804.txt.gz, November 7, 2026 vintage; DAPERMIT manual, II.13–II.17 for permit layout; II.18–II.19 for historical records and sequence 99 originals, II.21 for approved operator, and II.23 for issue date. Pioneer Q1 2024 Form 10-Q, p.26; Q2 2023 Form 10-Q, p.27, Drilling Highlights. Periods: permit issue years 2023–November 6, 2026; fleet point dates June 2023/March 2024.
[11] Pioneer reported baseline. 2023 Form 10-K, p.40 production/prices/costs, p.68 cash flow, p.84 cash interest; FY2023 earnings release, non-GAAP FCF reconciliation; Q1 2024 Form 10-Q above, cash-flow statement and operating review. Periods: FY2023 and three months ended March 31, 2024.
[12] Share returns. SEC-filed Exxon May 3 price reference; COP May 3 price reference; OXY 2025 proxy, p.33 footnote 2; issuer histories for Diamondback, ConocoPhillips and Occidental; Nasdaq Exxon history query. Exact dividend filings, entitlement periods and calculation blocks in the accompanying CSVs. Period: May 3, 2024–November 11, 2026.
[13] Standalone forecast. Definitive merger proxy, January 8, 2024, p.67, “Certain Unaudited Prospective Financial and Operating Information of Pioneer,” alongside the adviser’s valuation discussion. Forecast years 2024–28; October 2, 2023 price strip.
[14] Regulatory update. FTC, July 17, 2025 order announcement, Commission action and vote; case record, original/final orders and reopening. Period: 2024–25 proceedings.
[15] Peer acquisition context. Diamondback 2024 Form 10-K, Note 5, Endeavor; Diamondback 2025 Form 10-K, Note 4, Double Eagle; Occidental CrownRock completion release, August 1, 2024; ConocoPhillips Marathon completion release, November 22, 2024. Diamondback 2025 shareholder letter, “2025 Year in Review”; Occidental Q3 2025 slides, p.14 footnote 1; COP Q2 2025 slides, p.5 footnote 3. All additional locators are in peer_control_context.csv. Periods: 2024–25 closings, not a common organic-production baseline.
[16] Current Exxon share accounting. Q3 2026 Form 10-Q, pp.8–9 and Note 1, redomicile/share activity; p.23, Cash Capital Expenditures, Upstream row. Period: nine months ended September 30, 2026; July 1 reorganization.
[17] Oil prices. EIA April 2024 Short-Term Energy Outlook, Table 2, quarterly/annual WTI forecasts; daily WTI series, tag PET.RWTC.D. Periods: forecast issued April 9, 2024; observed prices 2024–October 2026, with available daily observations averaged.
[18] Oil tax. Texas Comptroller, crude-oil production tax, “Rates” section. Standard 4.6% rate used only for incremental oil-price sensitivity; exemptions and company tax positions are not inferred.
The Excel model contains reported inputs, editable assumptions, calculations and outputs. The accompanying CSV collection includes source references, derived tables, exclusions and chart data.
Supporting material
- Excel model ↗Sourced inputs, live calculations and reported outputs.
- Source and model data (CSV collection) ↗Data tables, source references and calculation exports.