Financial systems
Inside the auto loan tapes
CarMax 2023-1 recorded 3.58% in cumulative net losses through September 2026. Its loss rate was 67.3% higher than that of CarMax 2017-1 at the same reporting age.
CarMax Auto Owner Trust 2023-1 recorded 3.58% cumulative net losses through September 2026, against an original 2.30% central lifetime expectation. At the same trust reporting age, its cumulative net-loss rate was 67.3% higher than CarMax 2017-1. Ally 2023-1 had also exceeded its original lifetime assumption: 1.38% realized versus 1.20% expected. Remaining loans and later recoveries will determine the final results.caot, history, ratings, ally
Among 1,838 Ally loans with an observable six-month outcome after their second observed extension month, 37 charged off (2.01%). The sample had no comparison group of similar borrowers who went without extensions.events
These findings come from 322 public monthly asset files, 15,260,952 loan-month records and 546,897 unique trust-and-loan keys across ten selected trusts. Seven trusts have longitudinal panels; Carvana, Exeter and Bridgecrest contribute one September 2026 snapshot each. The earliest panels begin in 2017. The results describe only the sampled pools and reporting periods.coverage
A uniform loss formula also fails. Ally’s nominal charge-off field already contains net losses. AmeriCredit needs signed repossession proceeds in its calculation. CarMax’s raw loss fields do not fully reconcile to its trustee certificates. This report uses certified transaction amounts for transaction CNL and preserves unresolved differences in the published data.mapping
1. Which loans are in the study?
An auto-loan securitization holds a selected group of loans and issues bonds paid from their cash flows. ABS-EE is the SEC filing carrying standardized asset information. Exhibit 102 supplies loan records; Exhibit 103 explains how the issuer uses particular fields. Recurring records let an analyst follow an asset within a trust, including later recoveries after its balance reaches zero. They do not automatically identify the same borrower across trusts or expose every loan originated by the lender.schedule
The two selected 2017 transactions provide historical controls within their processed SEC windows. Five 2023 transactions provide recent collateral pools with several years of observed performance. Three additional snapshots describe the collateral remaining in their public filings. These trusts were chosen for comparisons across time and issuers; they were not randomly sampled.
| Selected trust | Processed reporting periods | Monthly files | Loan-month records |
|---|---|---|---|
| CarMax 2017-1 | 2017-01 to 2021-01 | 49 | 2,629,400 |
| SDART 2017-1 | 2017-02 to 2021-04 | 51 | 2,181,839 |
| CarMax 2023-1 | 2023-01 to 2026-09 | 45 | 3,397,028 |
| SDART 2023-1 | 2023-01 to 2026-09 | 45 | 1,818,542 |
| AMCAR 2023-1 | 2023-02 to 2026-09 | 44 | 1,544,840 |
| Ally 2023-1 | 2023-06 to 2026-09 | 40 | 2,015,896 |
| World Omni 2023-A | 2023-01 to 2026-09 | 45 | 1,559,472 |
| Carvana 2026-P2 | 2026-09 only | 1 | 38,690 |
| Exeter 2026-1 | 2026-09 only | 1 | 45,175 |
| Bridgecrest 2024-1 | 2026-09 only | 1 | 30,070 |
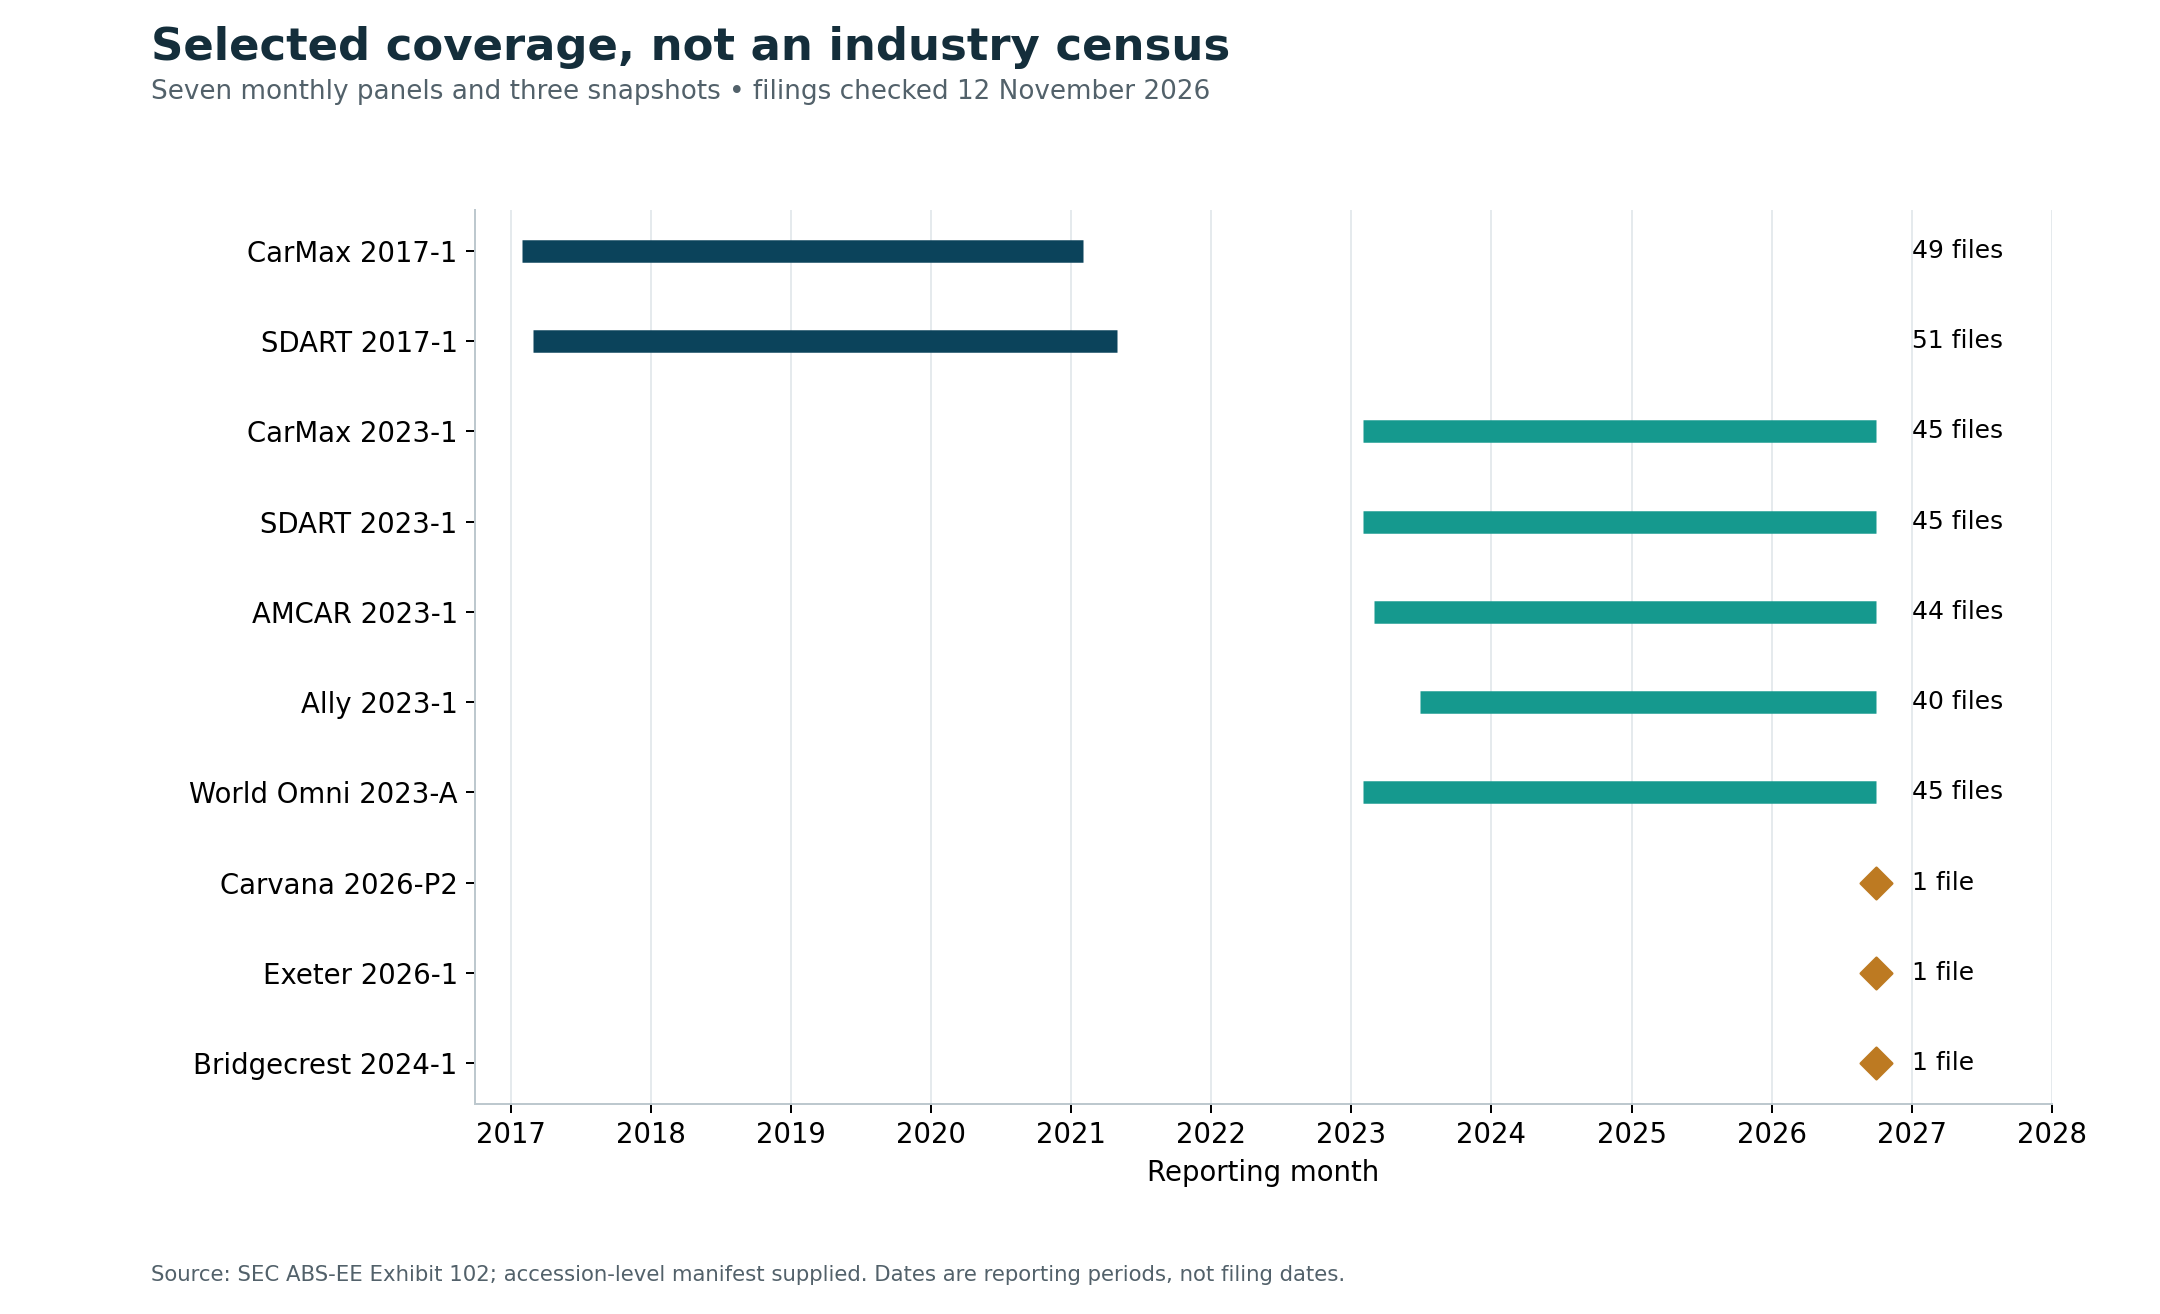
Source: SEC ABS-EE Exhibit 102. The filing manifest gives each accession, reporting period, filing date, XML URL, row count and source hash. Bars show selected contiguous periods; diamonds show single-month snapshots.
The processed corpus contains 51.53 GB of decompressed XML. There were 0 duplicate asset identifiers within individual files. Trust-and-loan keys are not unique people: one person may have multiple loans, and the analysis does not deduplicate people across securitizations.
The longitudinal observations span 2017–2021 and 2023–2026. There is no 2022 reporting panel and no complete origination census for 2018–2021. Origination can precede the first observed tape. Initial reporting months can also precede transaction issuance. Ally has 40 tapes but 39 trustee certificates: its first certificate spans June–July 2023 collections and reports the two monthly net-loss observations individually.ally-controls
The analysis intentionally uses a common September performance cutoff. Those reports were filed in October; any later October-performance releases are outside this extraction. The manifest freezes the selected population and identifies every period analyzed.
Public coverage is a shelf-level question
Carvana, Exeter and Bridgecrest have public ABS-EE filings. The selected September files identify Carvana 2026-P2, Exeter 2026-1 and Bridgecrest Lending Auto Securitization Trust 2024-1. The depositor histories link to public filings as early as 2020 for Exeter, 2020 for Carvana and 2023 for Bridgecrest.extra
Santander issues through both Santander Drive Auto Receivables Trust (SDART) and DRIVE. The sample includes SDART. CarMax Select, World Omni Select and auto-lease pools are outside the sample. Carvana issues prime and nonprime deals under different programs. Bridgecrest can service a Carvana loan that belongs to a Carvana trust.
Exeter’s 2026-1 prospectus identifies a selection break: EART 2025-2 began excluding borrowers above specified credit thresholds, while the Select program gathered higher-score collateral. A before-and-after EART comparison would mix performance changes with changes in the loans entering that shelf.exeter
Private Tricolor deals are omitted. Tricolor’s March 12, 2025 announcement describes its $328 million transaction as privately placed under Rule 144A. No public Tricolor loan tape was processed. That omission supplies no estimate of its losses, extensions or collateral characteristics. The AmeriCredit loan-level results cover the public AMCAR trust in the sample.tricolor, coverage
2. Which original loss expectations have already been exceeded?
A transaction’s realized cumulative net loss should be compared with its lifetime expectation using the same fixed original pool denominator:
Cumulative net loss = (cumulative gross losses − cumulative recoveries) ÷ original securitized pool face.
Current delinquency instead uses remaining active balance. A shrinking denominator can raise the delinquency percentage even when delinquent dollars decline. Neither measure should casually be divided by outstanding notes, whose repayment and protection differ from the collateral.
| 2023 trust | Realized CNL, September 2026 | Original lifetime base | Difference, percentage points | 61+ / ending face |
|---|---|---|---|---|
| SDART 2023-1 | 10.54% | 15.50% S&P | -4.96 | 9.53% |
| AMCAR 2023-1 | 8.15% | 10.00% S&P | -1.85 | 4.87% |
| CarMax 2023-1 | 3.58% | 2.30% S&P | 1.28 | 4.39% |
| Ally 2023-1 | 1.38% | 1.20% Fitch | 0.18 | 1.75% |
| World Omni 2023-A | 0.70% (rounded) | 1.35% S&P | -0.65 | 1.15% |
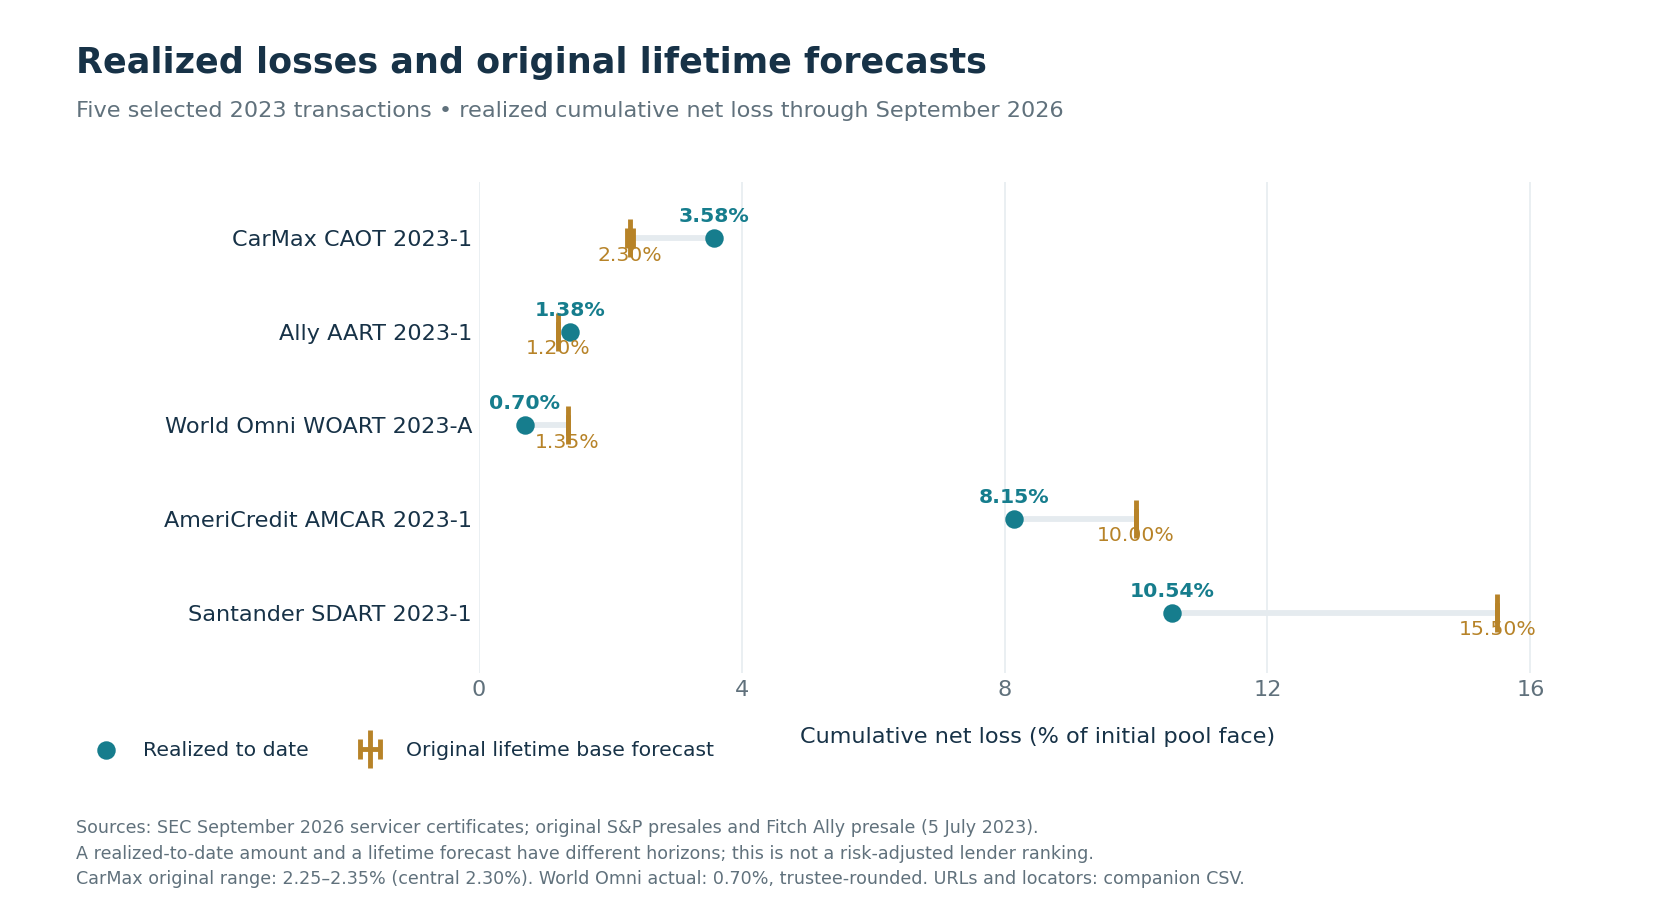
Sources: September 2026 SEC certificates; original S&P presales for SDART, AMCAR, CarMax and World Omni; original Fitch presale for Ally. September results are interim. Issuance expectations cover the life of each transaction. World Omni reports a rounded rate of 0.70%.
CarMax’s $88,498,974.24 cumulative gross losses minus $35,052,627.59 cumulative recoveries equal $53,446,346.65 net loss. Dividing by $1,491,002,573.66 initial pool face gives 3.584591%. That exceeds the original 2.30% central assumption by 1.284591 percentage points, or 55.85% relative. Using the upper end of S&P’s original 2.25%–2.35% range does not change the direction of the result.caot, ratings
S&P’s October 28, 2026 surveillance reports 3.58% in realized losses and raises its lifetime forecast to 3.75%. CarMax’s own prospectus used 2.30% CNL, 50% recovery and a three-month recovery lag to value its retained interests.surveillance, caot-prospectus
Ally’s $15,508,739.08 cumulative net loss divided by $1,121,998,940.08 original amount financed produces 1.382242%, above Fitch’s original 1.20% base case. The denominator is the original amount financed.ally, ratings
SDART, AMCAR and World Omni remain below their original lifetime loss assumptions at this observation date. The benchmark in each case is the agency’s base lifetime expectation for the pool. The pools differ in credit mix, seasoning, remaining collateral and starting expectations. An 8.15% loss against a 10.00% expectation conveys different information from a 3.58% loss against 2.30%; both the realized rate and its issuance benchmark matter.
The certificate delinquency comparison uses 61 or more days and a common ending face-balance denominator. The loan-level analysis measures literal 60 or more days from reported days delinquent. SDART’s September literal 60+ rate is 10.10%, while its 61+ certificate buckets give 9.53% on ending balance. AMCAR’s delinquency rate is 4.87% 61+ on ending face and approximately 4.64% on the certificate’s beginning balance.sdart, amcar
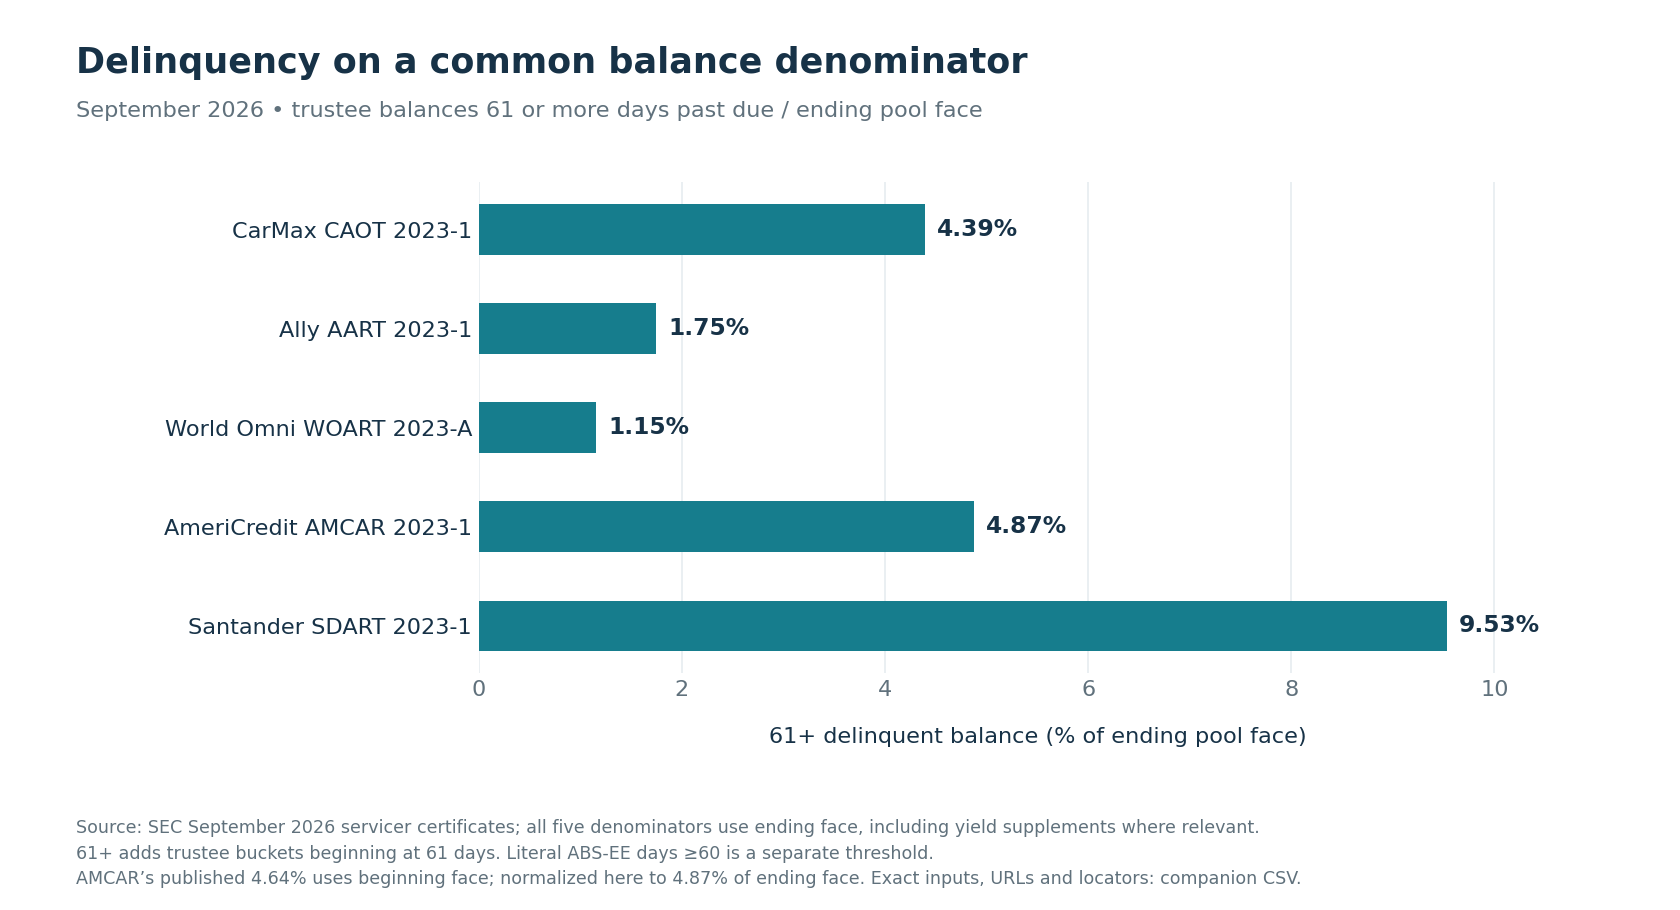
Sources: the five September 2026 certificates. World Omni’s denominator is face balance, including the difference between face and its yield-adjusted pool measure. The rates apply to collateral remaining in each securitization.
3. CarMax’s deterioration survives a reporting-age comparison
Comparing an old, nearly paid-down trust with a young trust would be misleading. The two CarMax histories allow a more useful test at reporting month 45: September 2020 for 2017-1 and September 2026 for 2023-1. The analysis uses 94 unique monthly SEC certificates across the two selected histories, with the applicable amended January 2018 report replacing its original.history
| Measure at trust reporting month 45 | CarMax 2017-1 | CarMax 2023-1 |
|---|---|---|
| Cumulative net loss / original pool | 2.14% | 3.58% |
| 61+ delinquency / ending face | 1.60% | 4.39% |
| Remaining face / original pool | 14.62% | 14.03% |
| Monthly extended balance / beginning face | 0.77% | 1.68% |
| Cumulative recoveries / cumulative gross losses | 44.70% | 39.61% |
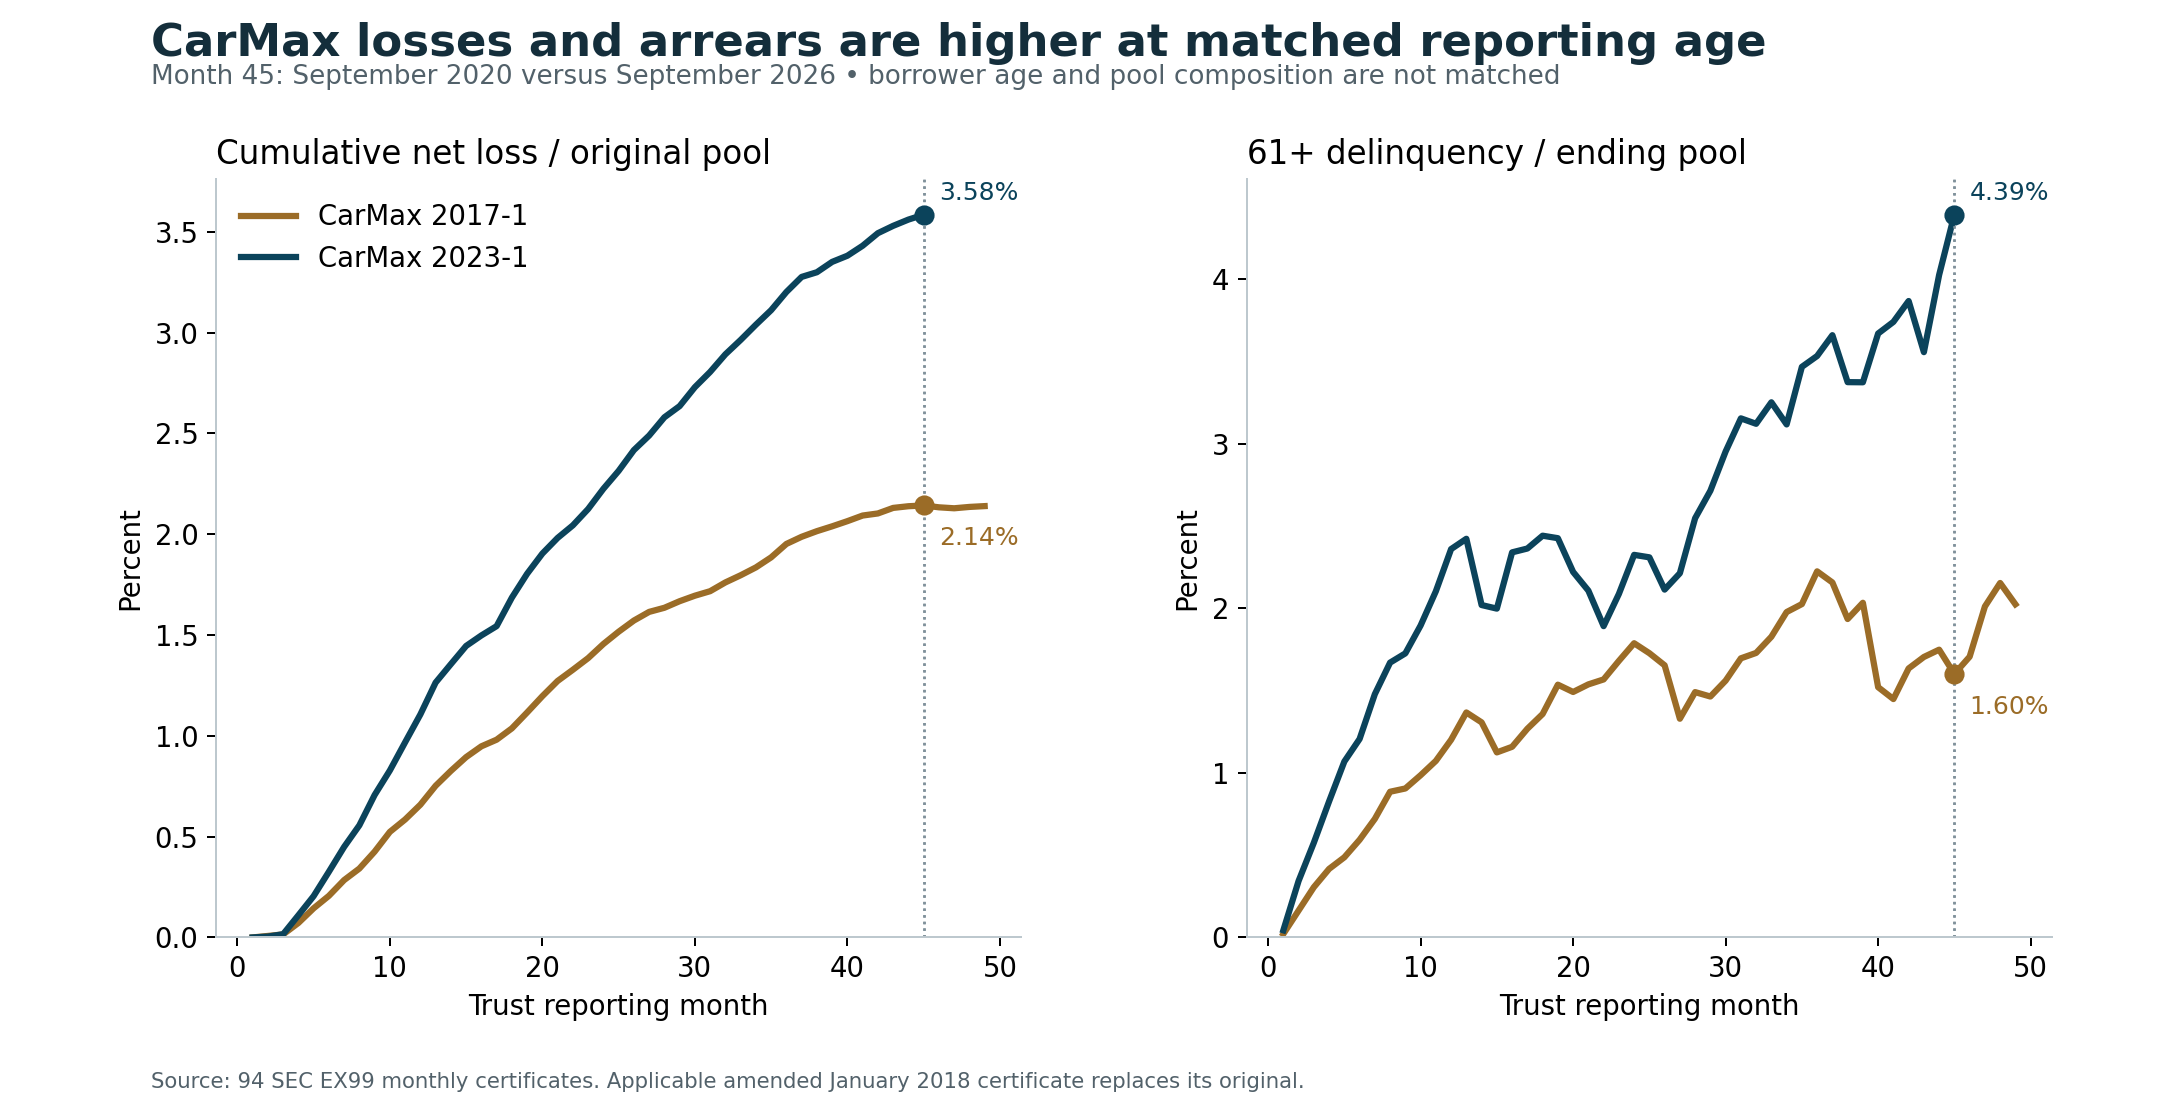
Source: monthly SEC CarMax EX99 certificates. The controls CSV supplies every source URL and original certificate label. Trust reporting age is not borrower age.
The older pool’s month-45 net loss was $28,066,388.69, on an exact original denominator of $1,310,000,025.92. Its 2.142472% CNL is therefore 1.442119 percentage points below the newer pool’s result. The relative increase is 67.310963%. Both pools had approximately 14%–15% of their initial balances remaining. This reduces an obvious maturity mismatch without controlling borrower selection, seasoning, vehicle mix, servicing or economic conditions.
Delinquency moves in the same direction: 4.39% versus 1.60% at month 45. Monthly extended balances were 1.68% versus 0.77% of beginning balance. Earlier 2017-1 certificates did not report the extension balance, so missing historical cells remain missing.
The older endpoint also illustrates censoring. CarMax’s January 2021 SEC certificate still contained 26,380 receivables and $139.28 million of face balance; its SEC reporting obligation was subsequently suspended. SDART 2017-1 ended its processed SEC loan-level window with 13,895 loans and $121.06 million remaining. SDART’s May 17 certificate records an optional purchase and zero ending note balances. The remaining observation gap concerns the borrowers’ loans after that cleanup.terminal
Late recoveries can reduce cumulative net loss. CarMax 2017-1 moved from 2.142472% at month 45 to 2.139277% in its last processed SEC monthly report. A model forcing cumulative net losses to rise forever would fail that historical check.
The original numerical 2017 rating-agency loss expectations remain UNKNOWN in this report because no free primary numerical forecast was verified. CarMax’s 2017 prospectus does disclose a 2.25% issuer fair-value loss assumption, with 50% recovery and a three-month lag. The historical rating benchmark remains unknown.2017-assumptions
4. Long terms, LTV and scores require issuer-specific definitions
The first observed 2023 pools have materially different loan characteristics. Rates and PTI below use original amount financed as the weight; term, LTV and used-vehicle shares use loan counts. The figures describe the loans entering each panel.attributes
| First observed pool | Loans | Reported term ≥84 months | LTV >120% | Original rate | Positive PTI | Used vehicles |
|---|---|---|---|---|---|---|
| CarMax 2017-1 | 82,256 | 0.00% | 13.77% | 7.34% | 7.77% | 99.62% |
| SDART 2017-1 | 66,797 | 0.00% | 30.83% | 15.76% | 10.31% | 70.46% |
| CarMax 2023-1 | 75,490 | 0.00% | 6.13% | 8.80% | 8.78% | 99.93% |
| SDART 2023-1 | 63,342 | 0.00% | 20.02% | 16.51% | 10.80% | 73.33% |
| AMCAR 2023-1 | 49,131 | 17.05% | 23.29% | 13.21% | 9.96% | 72.89% |
| Ally 2023-1 | 50,424 | 5.07% | 0.94% | 8.21% | 8.04% | 69.00% |
| World Omni 2023-A | 45,522 | 0.00% | 20.43% | 5.15% | 9.70% | 5.48% |
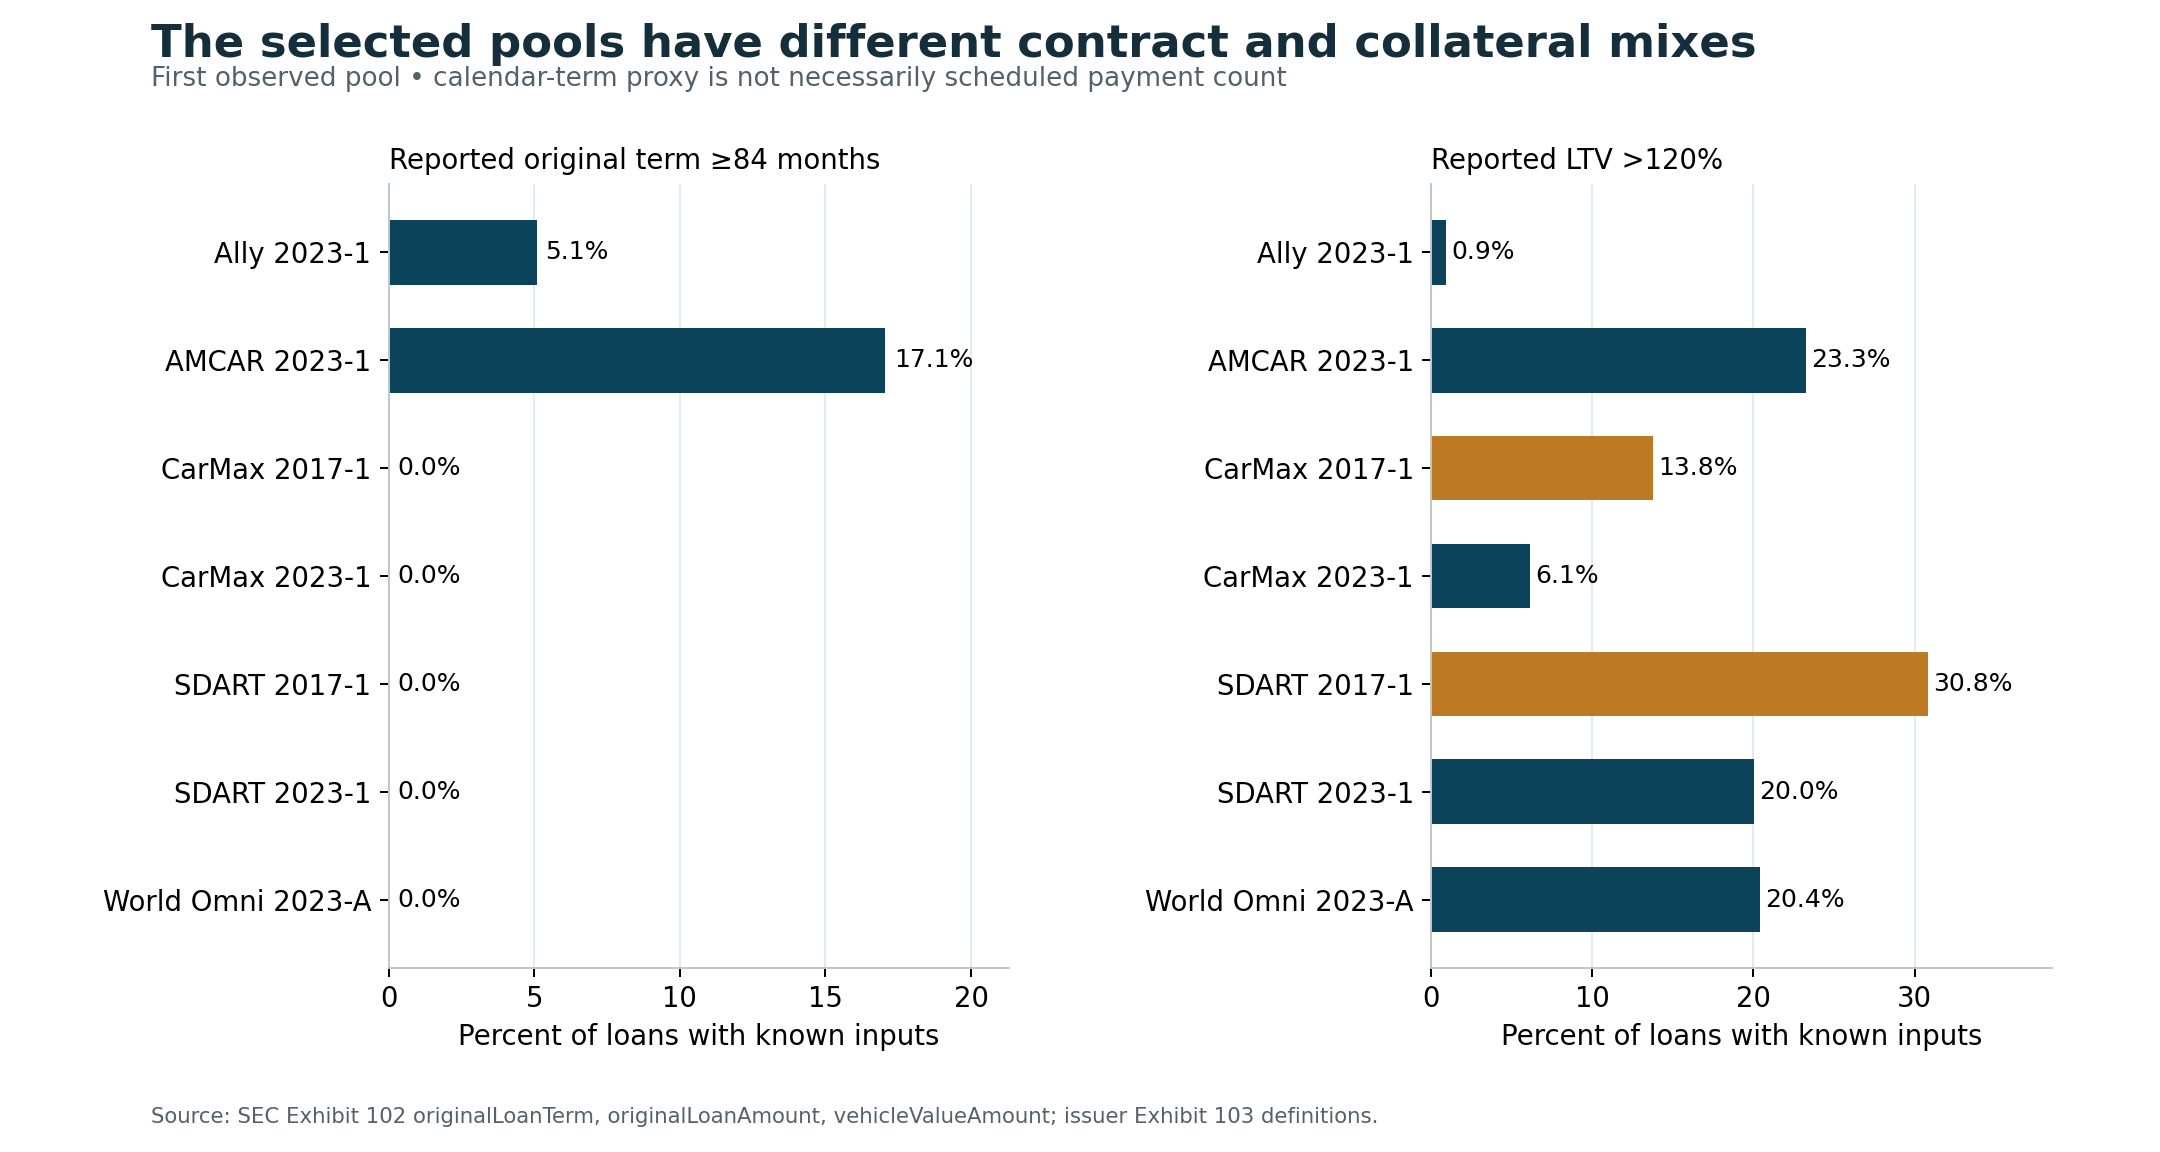
Sources: originalLoanTerm, originalLoanAmount and vehicleValueAmount in Exhibit 102; issuer Exhibit 103 definitions. Counts, weighted numerators, valid denominators and missingness are supplied.
“84 months” does not always mean 84 scheduled payments
Several issuers report calendar months between origination and maturity, including partial months. CarMax warns that this can exceed the contractual payment count by up to two months. The table therefore labels reported term at least 84 months as a long-contract proxy. An exact seven-year payment share is unknown where the reporting convention does not identify it.
Carvana’s explanatory filing does define original term as scheduled monthly payments. In its September 2026 active snapshot, 3,187 of 35,719 loans—8.92%—have exactly 84 payments. The count describes loans still active in that prime pool.carvana
LTV depends on what “value” means
Strict loan-to-value (LTV) greater than 120% is reconstructed as original loan amount divided by reported vehicle value. A prospectus bucket beginning at exactly 120% cannot be silently treated as a strict greater-than threshold.
CarMax uses a retail sales price excluding specified financed extras, while the loan can include taxes, fees and products. AMCAR’s conventions include wholesale or invoice values. Identical financed dollars can therefore yield different LTVs without any change in the borrower’s cash contribution. A common formula does not create a common valuation denominator.attributes
Within the selected CarMax pools, the high-LTV count share is 6.13% in 2023, against 13.77% in 2017, despite the newer trust’s higher subsequent losses. This does not imply that lower LTV causes higher losses. It shows why one initial statistic cannot explain the whole performance difference.
PTI is not total household debt burden
The payment-to-income ratio, or PTI, compares the reported loan payment with income under the lender’s convention. The measure covers this loan payment and the reported income. The principal calculation uses positive reported PTI, excludes blanks and the documented 9.9999 unknown sentinel, and includes other positive ratios above 100% at their reported values.
The main calculation treats a zero PTI as unavailable. Nearly all zero-PTI records in the first/latest 2023 snapshots checked still show positive scheduled payments. The workbook also shows how including the zeros changes the estimate. For Ally, first-pool weighted PTI is 8.04% among positive values, versus 7.51% when zeros are included. World Omni’s positive-only figure is 9.70%. Missing observations must not be interpreted as payment-free loans.pti
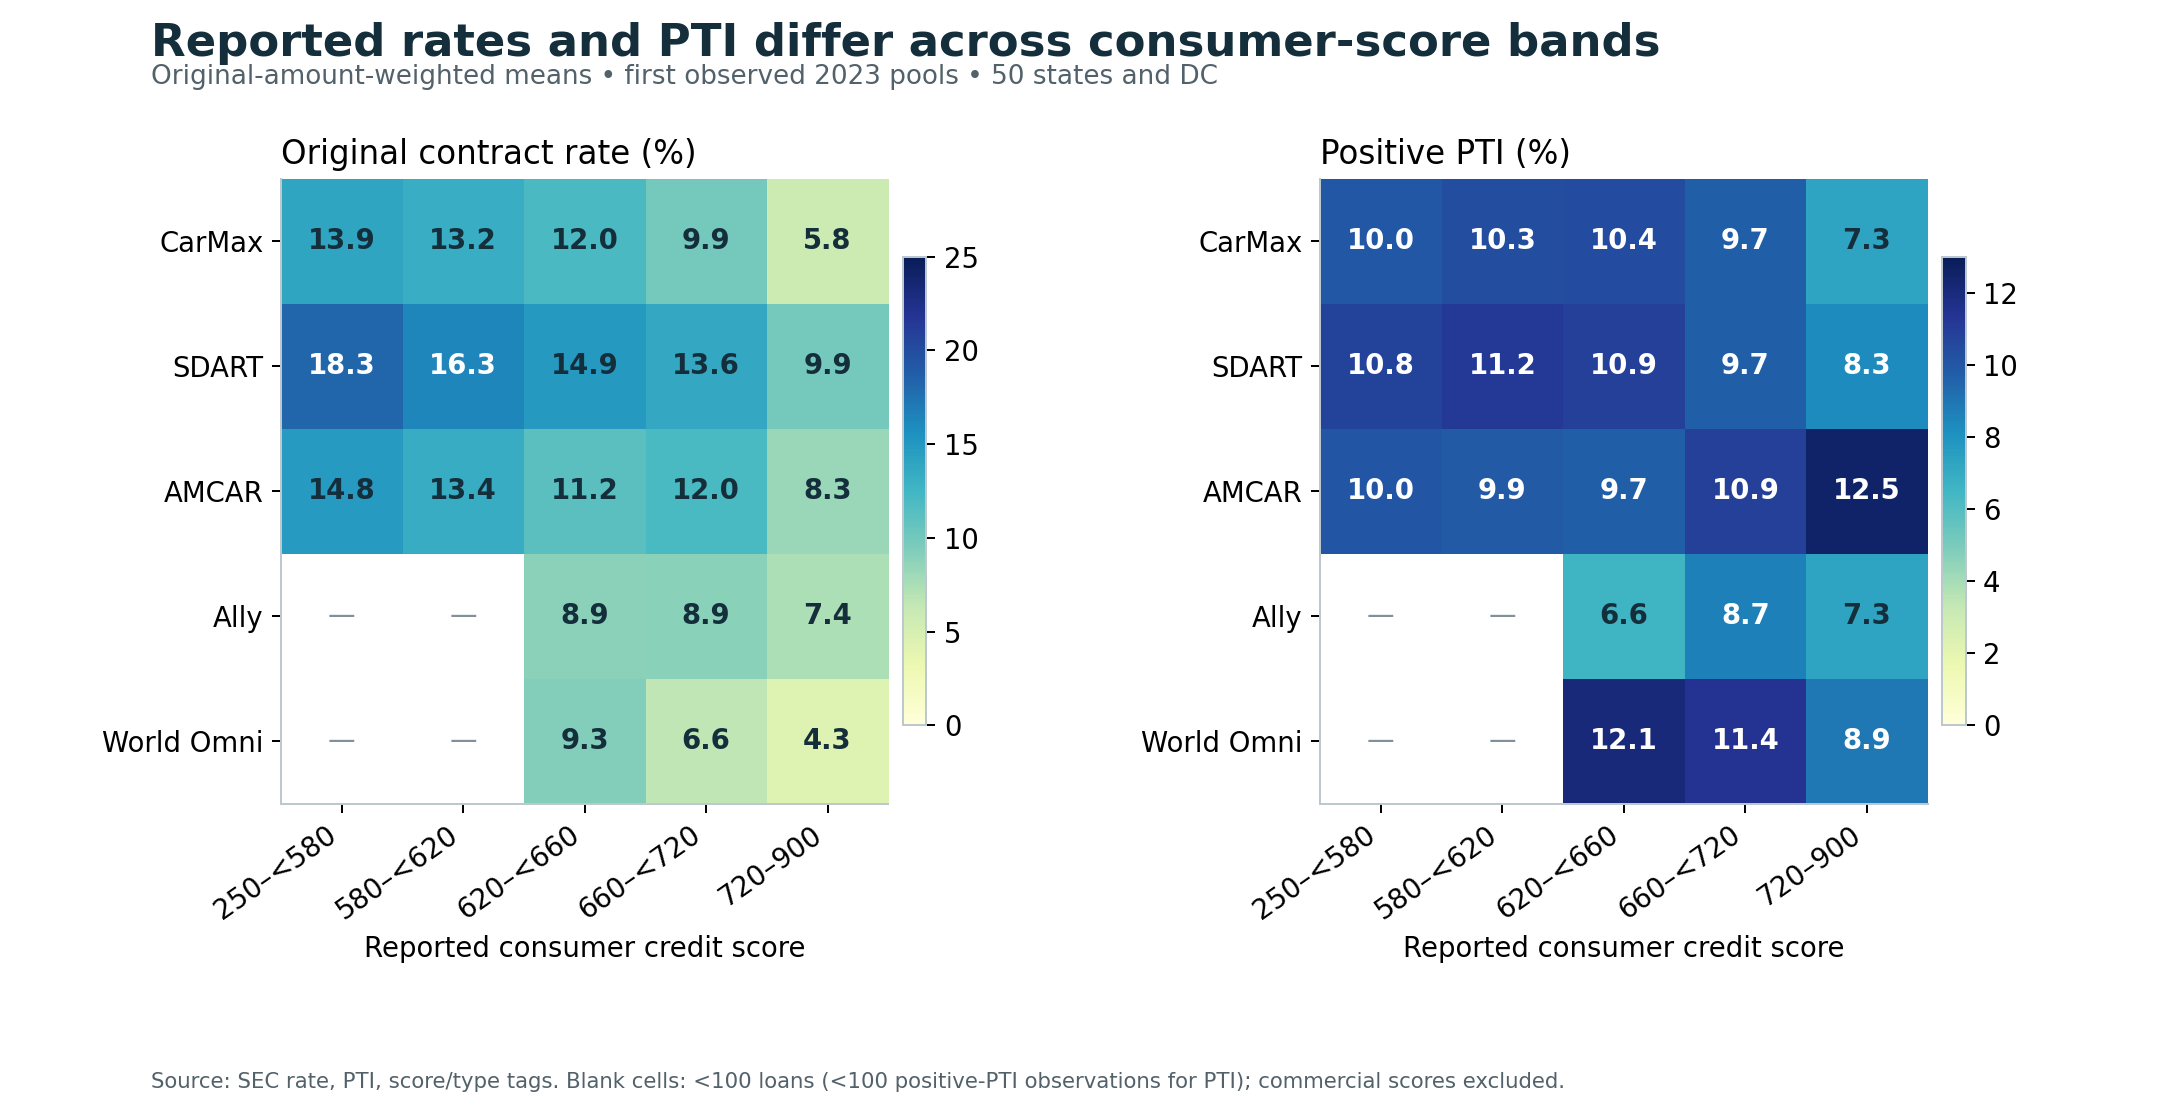
Sources: SEC original rate, PTI, score and score-type tags. Rate cells require at least 100 loans; PTI cells require at least 100 positive-PTI observations; all aggregate cells remain in the CSV. Fractional co-borrower scores are unrounded, with half-open thresholds at 580, 620, 660 and 720.
In the selected CarMax 2023 pool, the original-amount-weighted rate is 13.9% in the 250–below-580 consumer-score band and 5.8% in the 720–900 band. Positive PTI is 10.0% and 7.3%, respectively. Those are descriptions of selected loans; they do not hold applicant income, vehicle, term or other underwriting factors constant.
Ally’s first file contains 2,789 commercial bureau scores and 45,781 consumer bureau scores. Commercial scores cannot enter consumer bands merely because they are numeric. Mixing them would turn a consumer below-580 band containing only four loans into an apparent group exceeding 1,600. The workbook groups scores by reported type.pti
Consumer scores still differ across issuer conventions. CarMax can average obligor/co-obligor scores, World Omni can take the higher score, and SDART uses the primary borrower. The comparison does not estimate a lender premium for identical applicants. The interest measure is labeled issuer-reported original contract rate; it is called APR only where the issuer explicitly defines it that way.
5. Follow origination cohorts without confusing them with deal names
A trust called “2023-1” can hold loans originated in several years. The loan-age comparison follows October–December 2022 originations present in each first observed 2023 pool. Origination has month-level precision; no day within the month is invented.
At month 45, October 2022 loans are observed in July 2026, while December loans are observed in September. This matches borrower age across three adjacent calendar months. It does not show every loan’s condition on one common calendar date, and it excludes loans that paid off, defaulted or were omitted before selection into the sampled pool.
| Selected Q4 2022 cohort, age 45 months | Opening loans | Original amount, $m | Known 60+ / active balance | Ever two extension months / loans | Unknown DPD / active balance |
|---|---|---|---|---|---|
| SDART 2023-1 | 39,365 | 1,093.07 | 9.97% | 8.39% | 0.00% |
| AMCAR 2023-1 | 13,181 | 369.55 | 5.32% | 26.36% | 1.18% |
| CarMax 2023-1 | 19,526 | 516.36 | 3.82% | 7.39% | 0.00% |
| Ally 2023-1 | 7,845 | 230.16 | 1.10% | 3.79% | 0.00% |
| World Omni 2023-A | 18,186 | 606.29 | 1.05% | 3.35% | 0.00% |
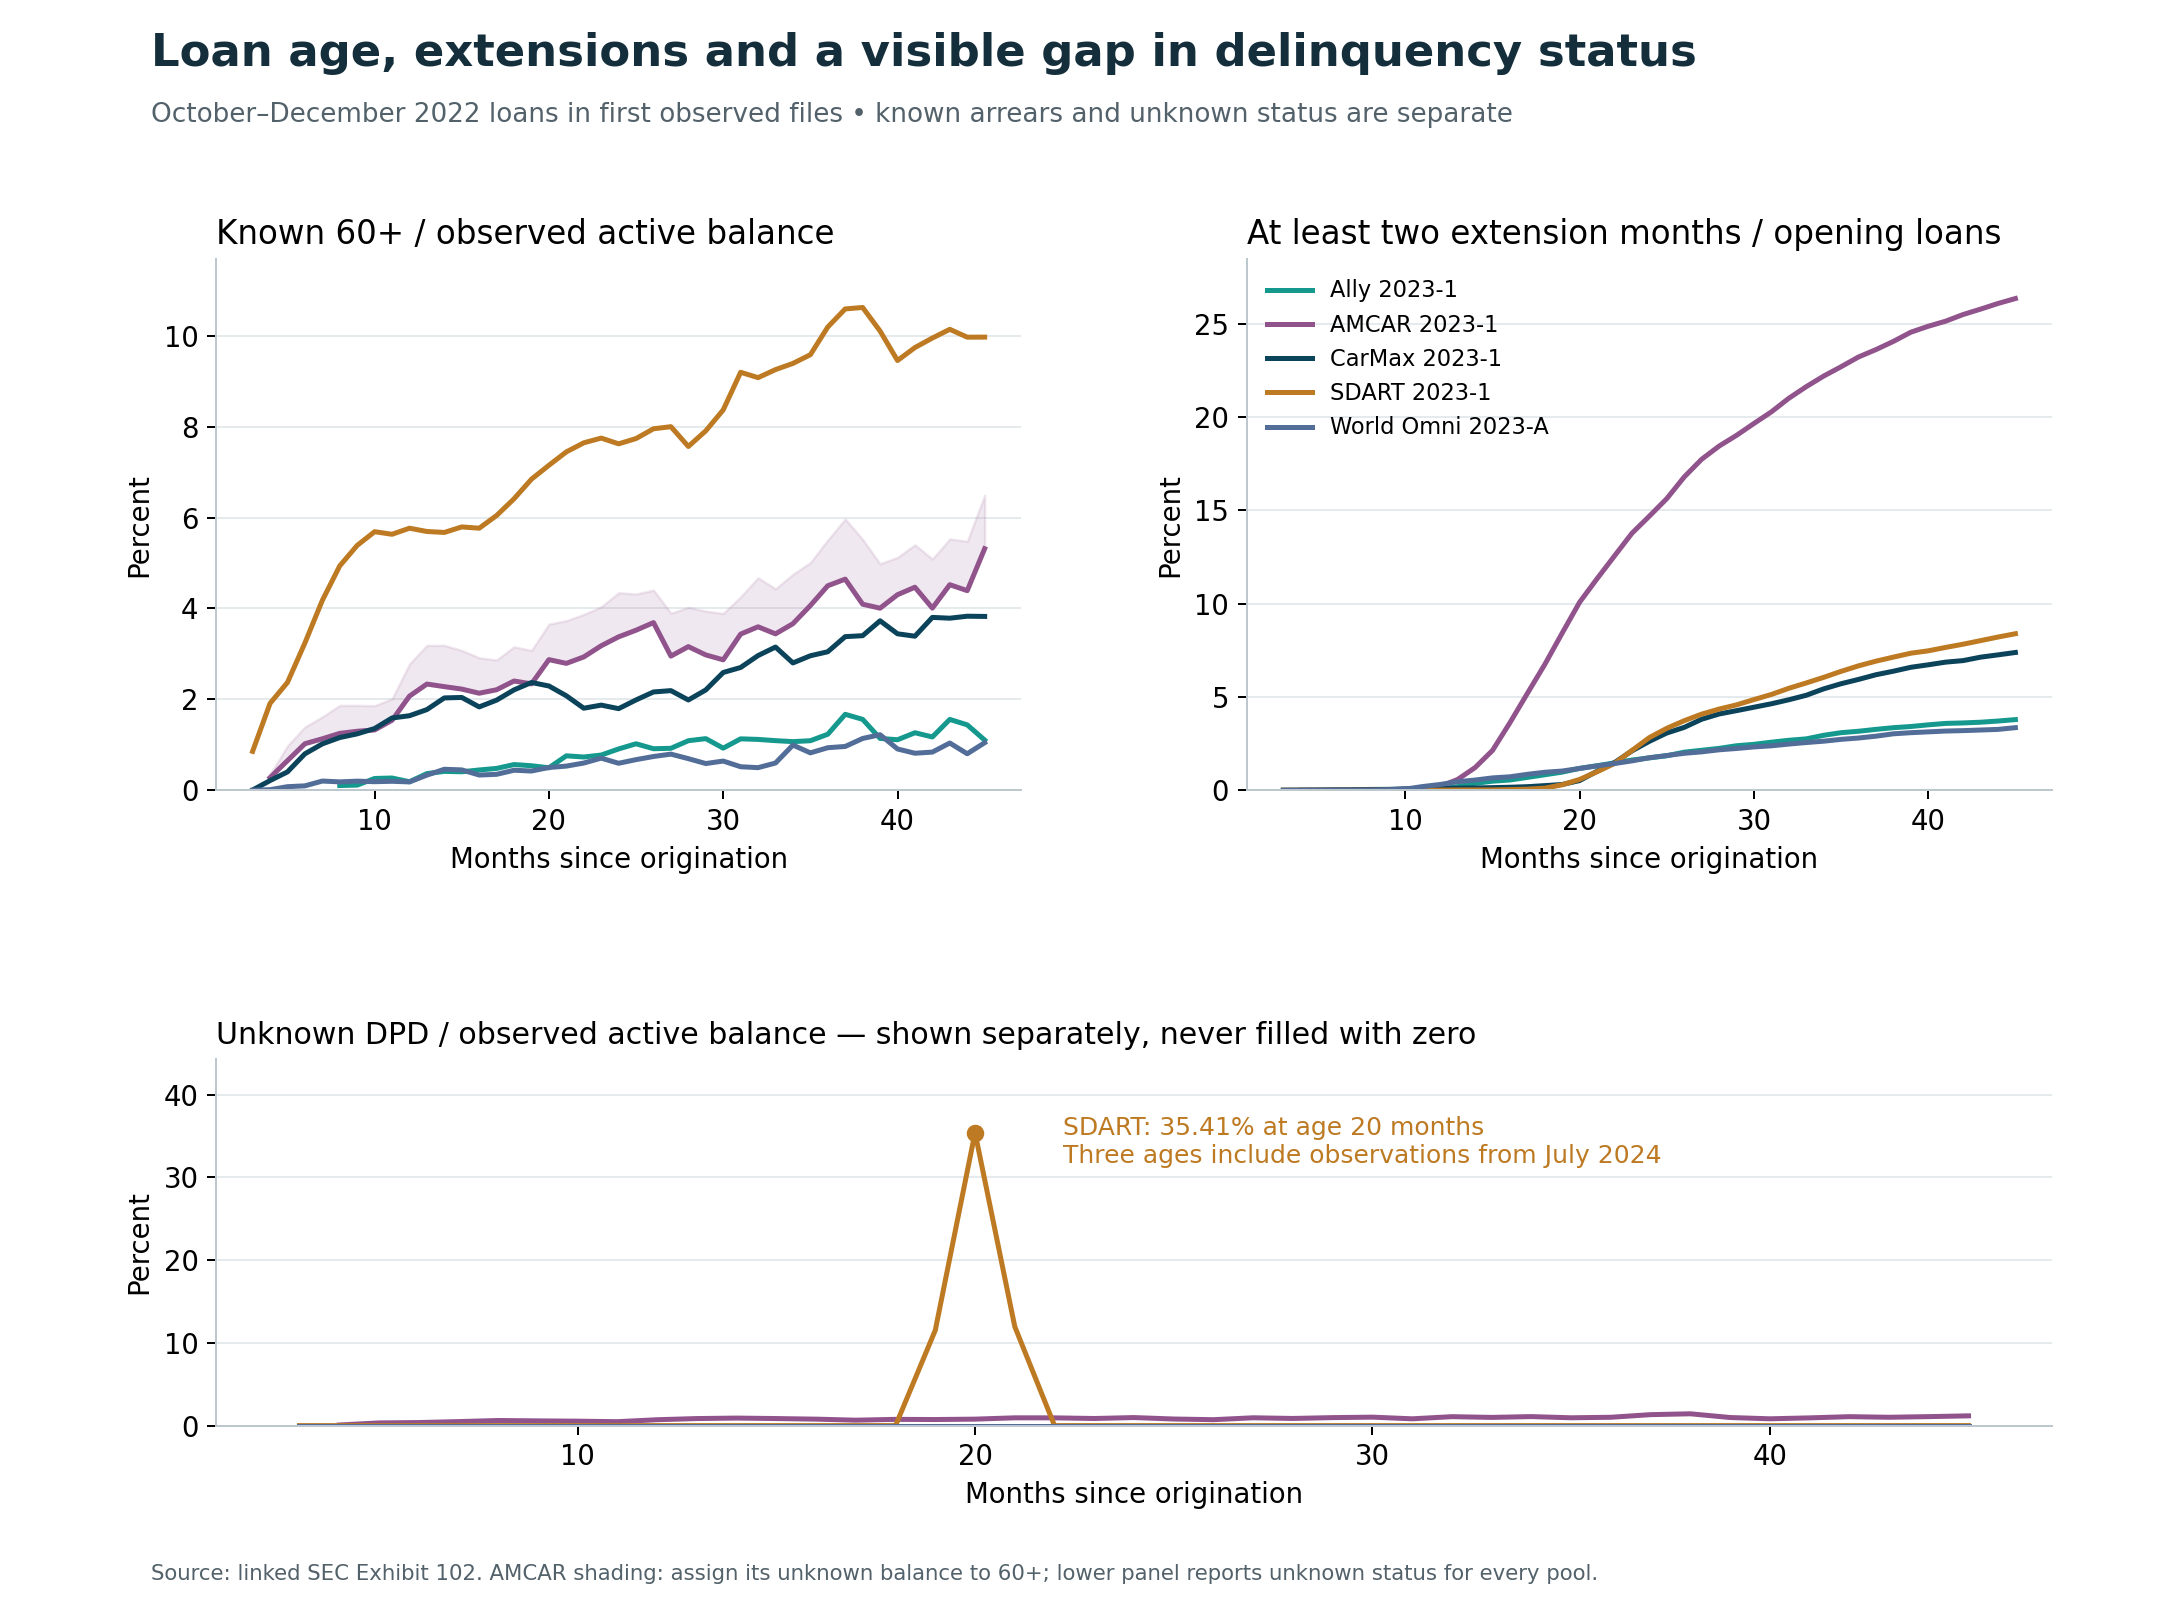
Source: monthly Exhibit 102 linked by trust plus assetNumber. Delinquency divides by observed active balance; extension incidence divides by the fixed opening cohort count. Each loan’s history starts with its first appearance in a tape. AMCAR shading assigns its unknown-status balance to 60+; the lower panel shows unknown status for every pool. Curves are displayed through age 45 months.
At age 45 months, known 60+ delinquency ranges from 1.05% in the selected World Omni 2023-A origination cohort to 9.97% in SDART 2023-1. The cumulative share with two observed extension months ranges from 3.35% to 26.36%. Aligning loan age exposes these differences without making the underlying borrowers or prior observation windows equivalent.
Cumulative extension incidence and current delinquency answer different questions. A charged-off loan stops contributing to active delinquent balance but remains in the original cohort count. Falling current delinquency can coexist with rising cumulative losses.
The analysis tracks missing days-past-due values (DPD) as unknown. AMCAR’s September tape has $3.46 million, or 1.22% of ending balance, with unknown delinquency status. Its known literal 60+ rate is 5.09%; treating every unknown dollar as 60+ would produce a mechanical upper bound of 6.31%. Neither filling unknowns with zero nor automatically declaring them delinquent is justified. The loan-age data supply exact unknown-status dollars at every observed age.attributes
SDART’s July 2024 file presents a larger historical gap: the delinquency tag is absent for 21,579 active loans carrying $401.64 million, or 57.78% of remaining face. The reviewed explanatory exhibit defines a reported zero as current; it does not equate an omitted tag with zero. The model therefore keeps these statuses unknown. In the selected Q4 2022 cohort, the gap affects loan ages 19–21 months and reaches 35.41% of active balance at age 20. Figure 6 shows the share with unknown delinquency status.sdart-gap
How much vintage-level net loss is supported?
Ally’s entire monthly net-loss history reconciles to cents. Its selected Q4 2022 cohort contains 7,845 loans, $230.16 million of original amount financed, and $2.64 million of observed net-loss flows through month 45: 1.148025% of original amount. The loss measure starts when the selected Ally 2022 loans enter the pool.cohorts
A mapping conflict also has to remain visible. Ally’s explanatory text would exclude terminal-dated rows from beginning balances and the charge-off tag, but those literal filters fail the trustee controls. Raw beginning balances tie all 39 certificates; filtering September’s net-loss tag would produce zero instead of $364,098.47. The report uses the reconciled raw beginning balances and unfiltered net-loss tag, while applying the certificate-validated terminal-date filter to ending balances.mapping
AMCAR’s corresponding 13,181 loans have $369.55 million of original amount and $33.27 million of observed net-loss flows, or 9.003027%. It is labeled a loan-tag estimate: the complete 44-tape pool total differs from the September whole-dollar trustee total by −$1.74, and the maximum certificate-period difference is $3.52. These residuals are small, but not exact reconciliations.
Observation starts at loan age 6–8 months for Ally and 2–4 months for AMCAR. Four Ally cohort loans leave under the reported repurchase/replacement code; their subsequent borrower performance is unknown. The fixed opening denominator remains unchanged. These original-loan denominators also differ from the cutoff pool face used in deal forecasts.
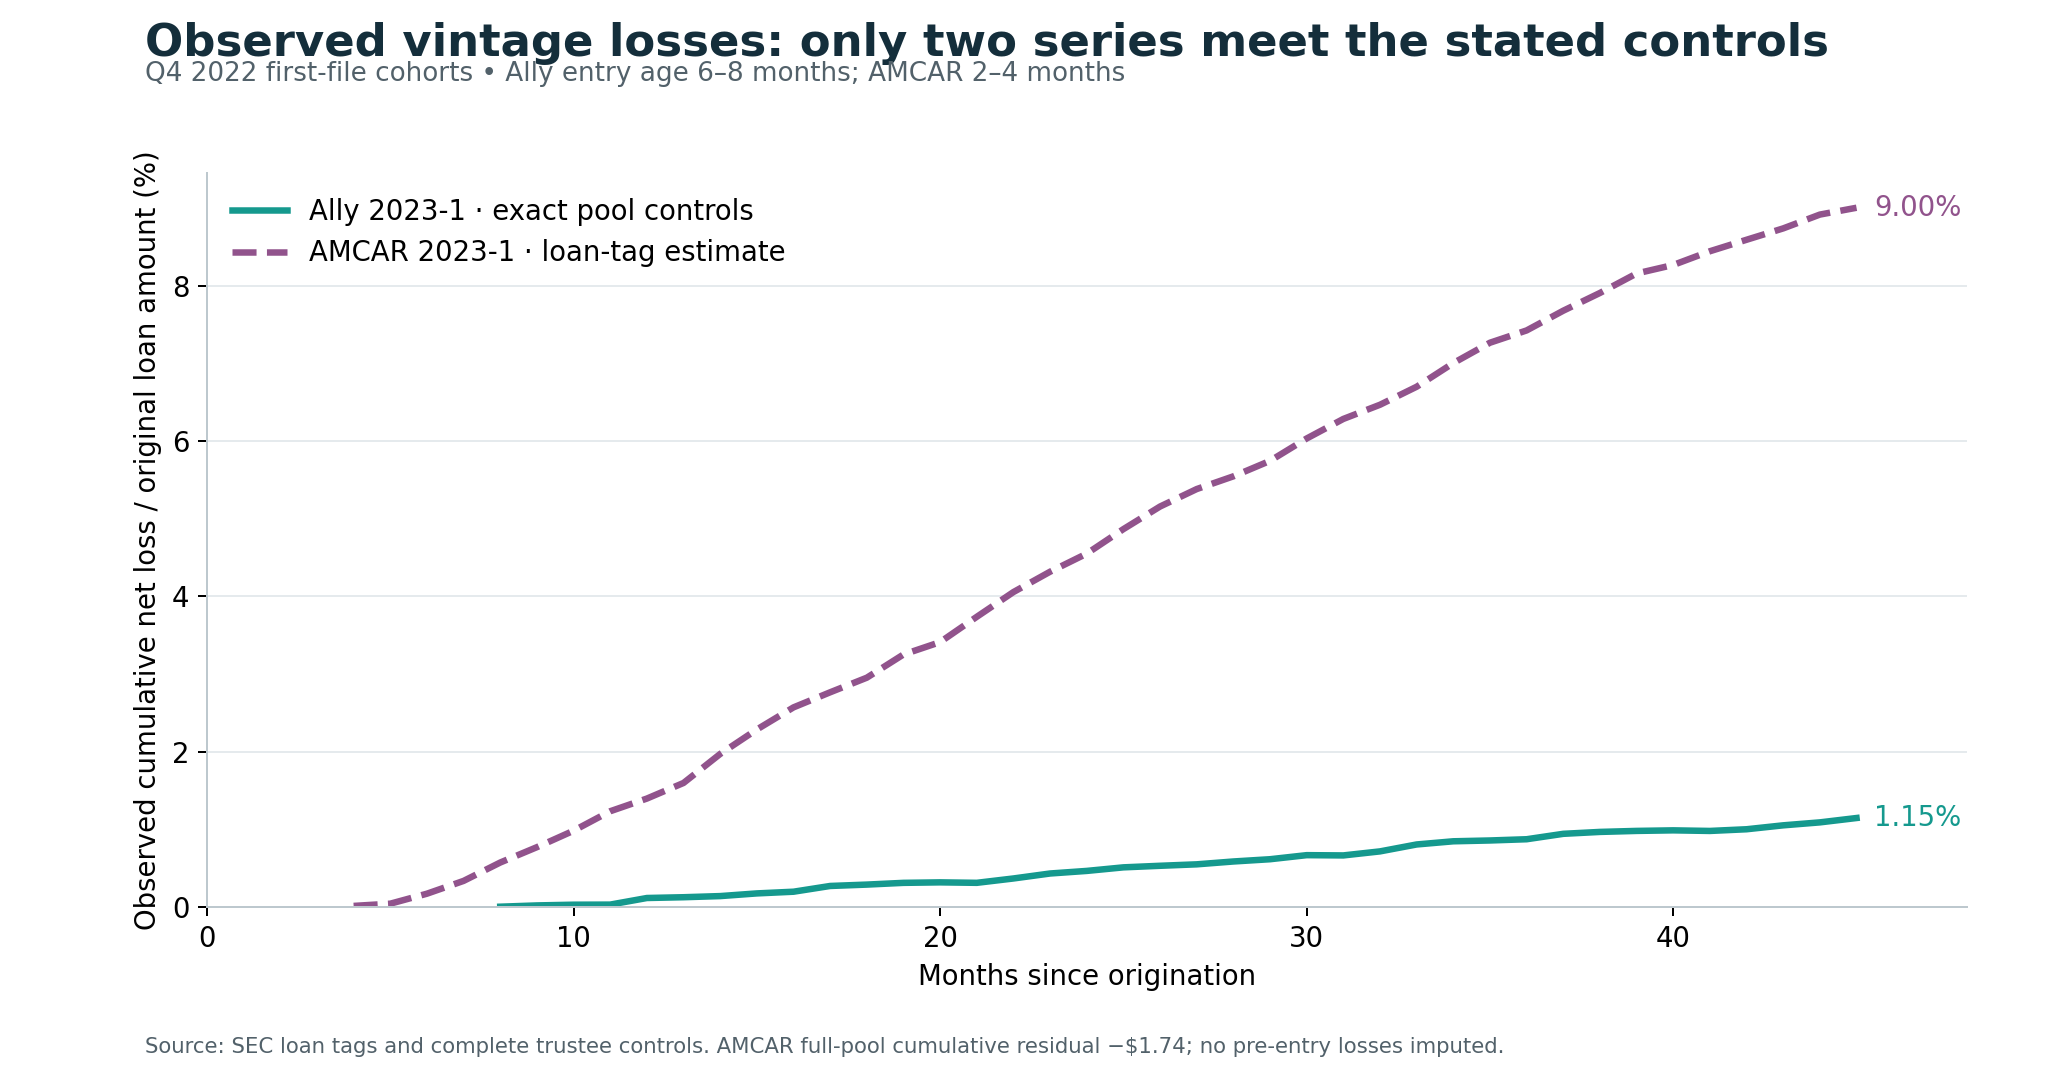
Sources: loan cash flows and complete monthly trustee controls. Ally’s pool totals reconcile exactly. AMCAR’s have the residuals described above. Both curves start at observed entry and stop following collateral after it leaves.
CarMax, SDART and World Omni raw loss series remain diagnostics. In September 2026, CarMax’s unadjusted charge-off-minus-recovery proxy exceeds certified net losses by $507,016.82. Across its 45-month history, that unadjusted proxy totals approximately $89.94 million, against $53.45 million certified. The explanatory disclosure describes reinstatements and servicing adjustments, but the reviewed fields do not provide an exact loan-level bridge.
SDART’s selected-month certificate-minus-raw difference is $58,324.09, including reported cramdowns; World Omni’s is $1,686.92. Those differences limit the use of loan-level data to attribute deal losses.mapping
Original rating expectations are transaction-level lifetime estimates. The reviewed presales do not provide a comparable monthly forecast of 60+ delinquency or extensions for each origination cohort. The transaction comparisons use the matching forecasts. The loan-age comparisons describe observed outcomes.
6. What happens after two observed extension months?
The field paymentExtendedNumber records months added during the reporting period. A value of two in one month can represent one event adding two months. The analysis identifies reporting months with a positive extension amount or applicable extension code, excludes negative reversals, and locates the second observed extension month.schedule, events
The loan must remain active at that marker with no prior observed full charge-off. Follow-up covers the next six months, excluding the marker month. A first transition to charged-off zero-balance status is the outcome. Full repayment is an observed terminal outcome. Unexplained disappearance, sale, repurchase or servicing transfer censors observation. Recent markers without six calendar months available are excluded.
| Selected trust | Eligible second events | Observed outcomes | Censored | Full charge-offs in next six months | Observed rate |
|---|---|---|---|---|---|
| SDART 2023-1 | 3,701 | 3,698 | 3 | 221 | 5.98% |
| AMCAR 2023-1 | 11,914 | 11,913 | 1 | 823 | 6.91% |
| CarMax 2023-1 | 4,519 | 4,519 | 0 | 287 | 6.35% |
| Ally 2023-1 | 1,838 | 1,838 | 0 | 37 | 2.01% |
| World Omni 2023-A | 1,107 | 1,107 | 0 | 17 | 1.54% |
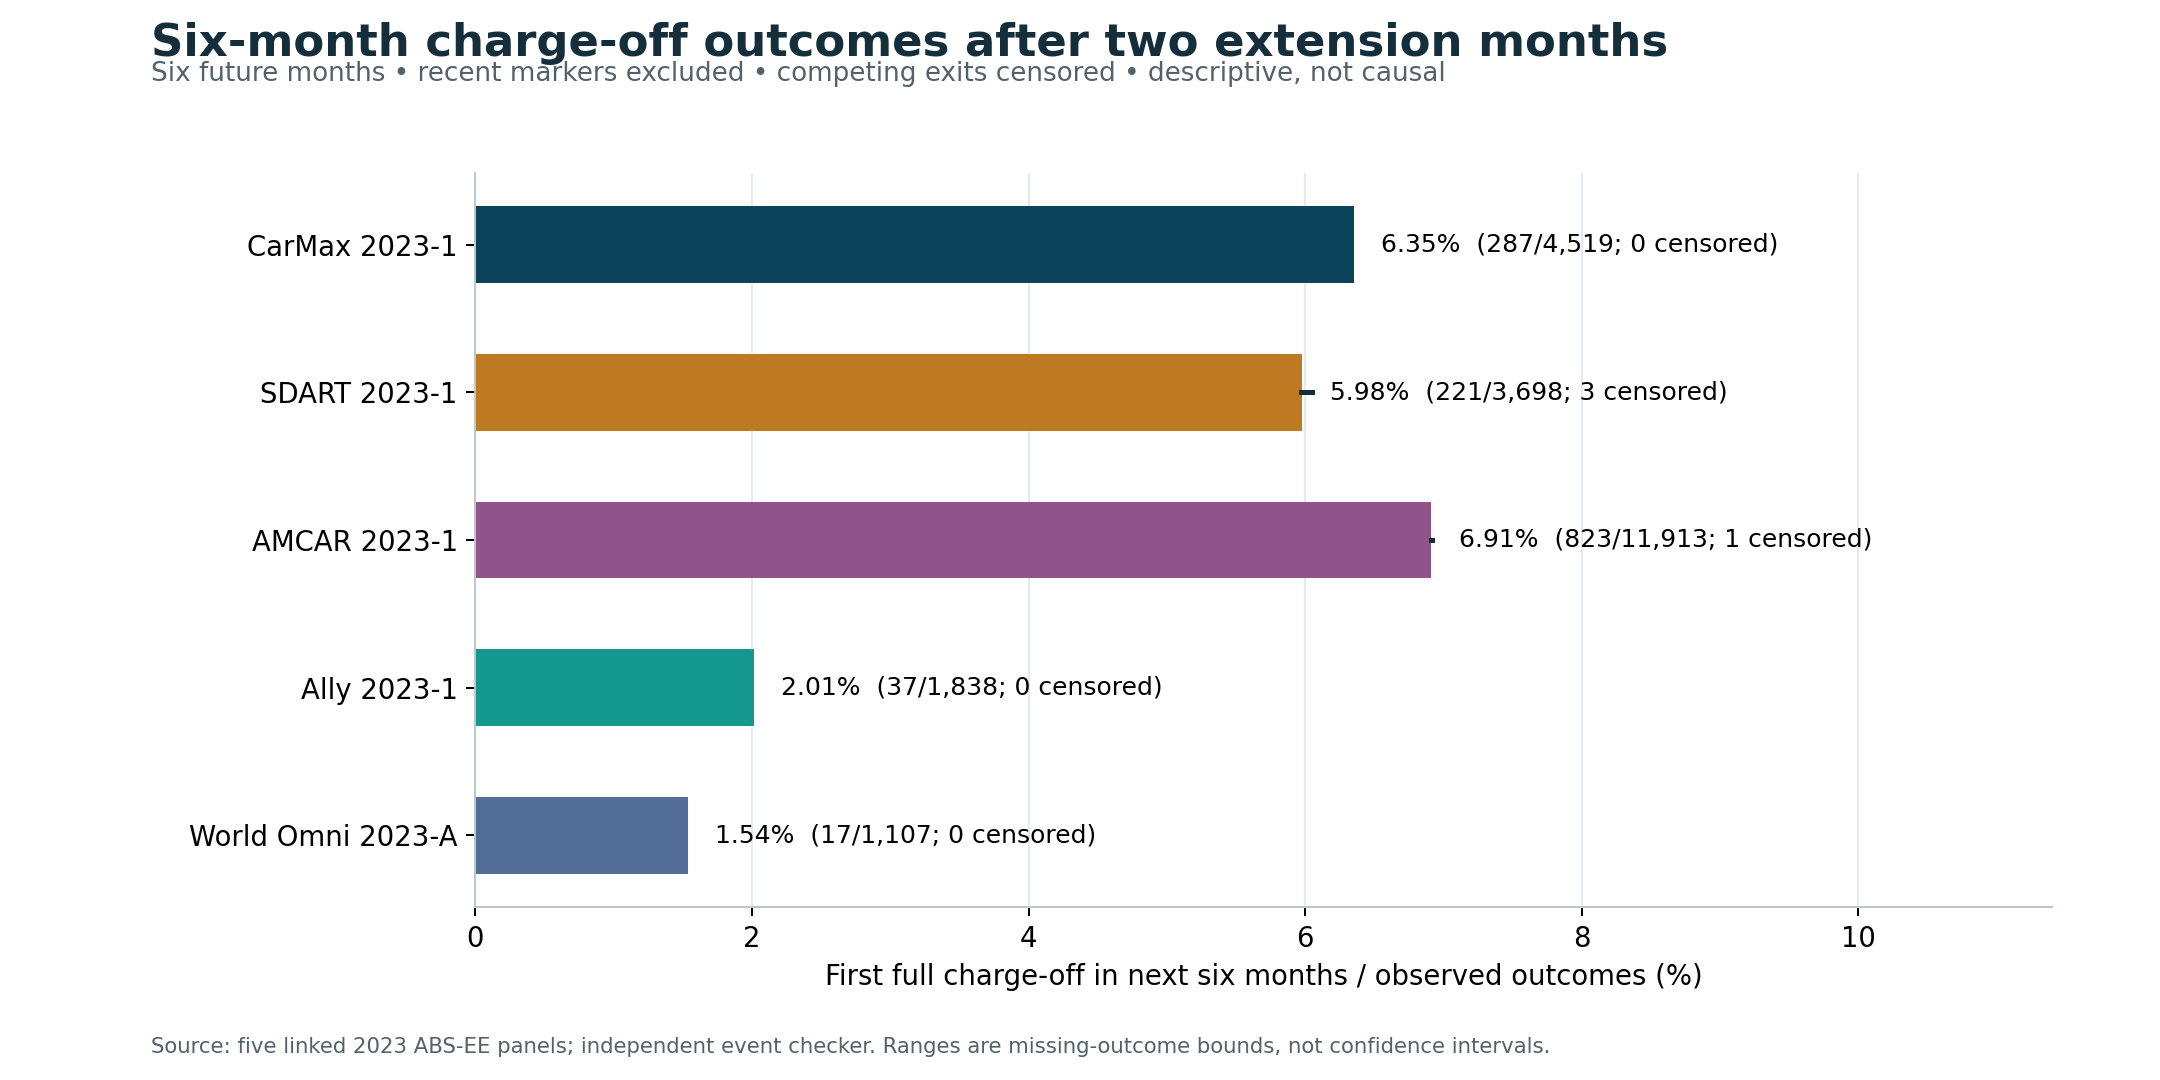
Source: the five 2023 loan panels, checked by an independent streaming calculation. Thin ranges show the missing-outcome bounds when all censored cases are assigned first to no charge-off and then to charge-off.
Ally’s 37/1,838 = 2.013058% result survives the independent implementation. Another 210 second-extension markers lack six months of calendar follow-up and are excluded. Among eligible loans, 199 were observed 60+ at least once during follow-up. A low six-month charge-off rate does not exhaust the evidence of payment stress.
AMCAR’s observed rate is 823/11,913 = 6.91%, with one additional eligible loan censored. Assigning that outcome to non-default or default moves the all-eligible result only from 6.90784% to 6.91623%. Here, uncertainty about the missing outcome is small; uncertainty about interpretation is larger.events
The groups differ in borrower quality, age, earlier payment history and extension policies. There is no matched untreated group. First- and second-extension groups overlap and start at different dates. The comparison leaves the effect of an additional extension and repayment beyond six months unresolved.
Historical definitions also change. SDART changed the treatment of automatic maturity extensions around October 2020, moving a reported modification from an extension code to a term-change code. That reporting break is not treated as a behavioral improvement. Repeat-extension outcome comparisons use the 2023 panels.mapping
7. Texas versus the United States
Geography describes reported current, billing or last-known state, depending on issuer. It need not be origination state. Within each sampled trust, the national denominator includes the 50 states and District of Columbia. Blank, military and territorial codes are not silently assigned to a state. Texas is compared with both the full national sample and the rest excluding Texas.
| September 2026 trust | TX active loans | US known 60+ | Texas known 60+ | Rest-US known 60+ | Score-standardized TX–rest gap, pp | US/TX balance covered by common bands |
|---|---|---|---|---|---|---|
| SDART 2023-1 | 2,469 | 10.11% | 7.93% | 10.59% | -2.81 | 91.9% / 92.4% |
| AMCAR 2023-1 | 3,245 | 5.09% | 5.10% | 5.09% | 0.10 | 99.5% / 99.6% |
| CarMax 2023-1 | 2,576 | 4.52% | 4.38% | 4.54% | -0.56 | 99.6% / 99.6% |
| Ally 2023-1 | 2,050 | 1.83% | 1.42% | 1.89% | -0.48 | 94.1% / 96.6% |
| World Omni 2023-A | 69 | 1.25% | 1.96% | 1.24% | 0.49 | 98.8% / 96.8% |
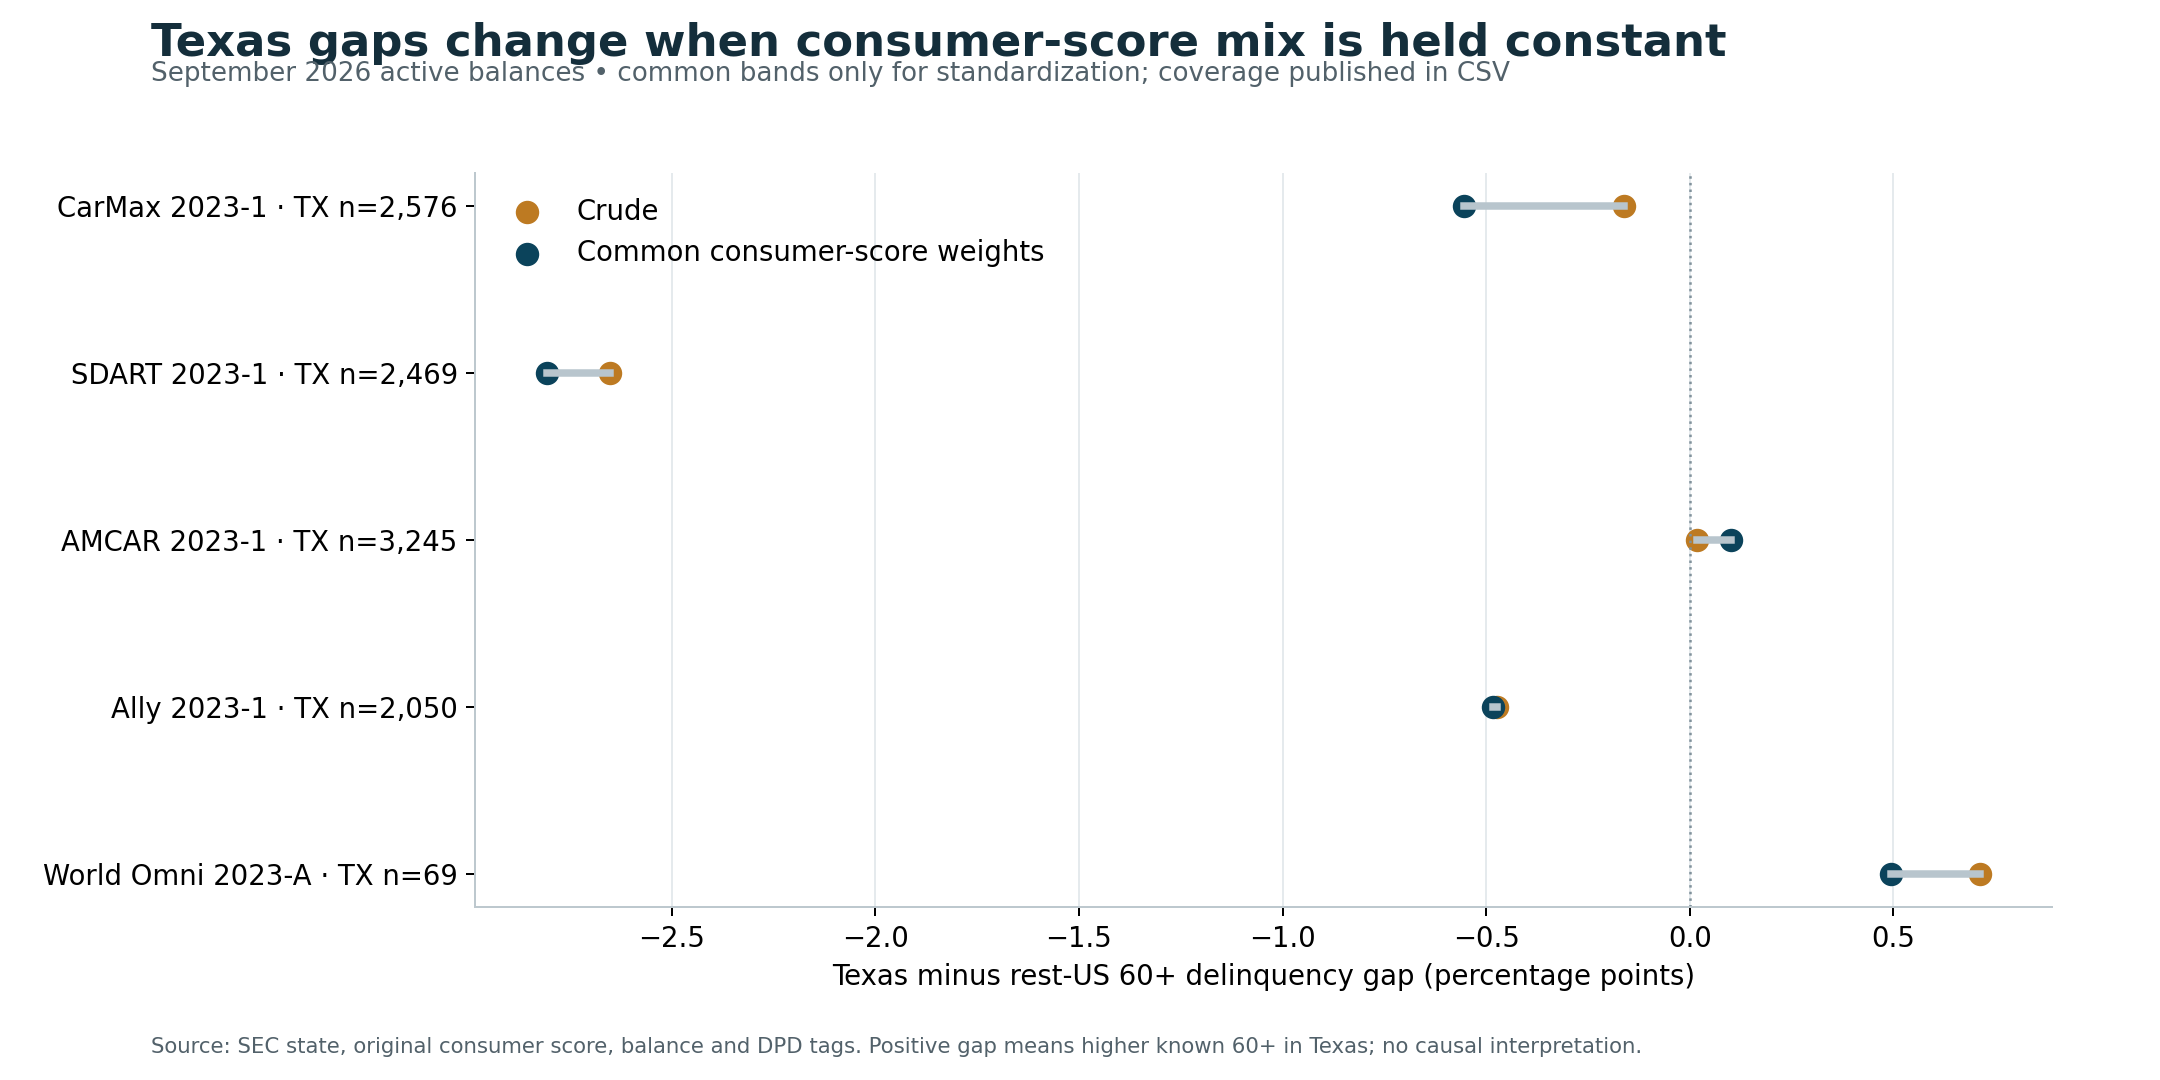
Sources: September 2026 state, original score, current balance and days-delinquent tags. Standardization applies common national balance weights to consumer-score bands observed in both Texas and the other states. Commercial and unknown scores remain in crude results but are excluded from standardization.
Across these selected pools, the crude Texas-minus-rest-US gap ranges from -2.65 to +0.71 percentage points. Using common consumer-score weights gives -2.81 to +0.49 points. Each row represents one pool. World Omni’s Texas result rests on only 69 active loans, a particularly small regional group.
This adjustment asks what the observed band-level delinquency would imply under the same score mix. It does not control loan age, contract term, vehicle age, income, migration, local selection or score-model differences. The data publish the share of national and Texas balances covered by common bands, so standardization cannot silently discard unknown-score exposure.
This is also a remaining-collateral comparison. Loans that prepaid or left the trust are absent from current balance. Different repayment speeds can change the surviving borrower mix without changing the original risk of a state’s borrowers. Differences in who remains in the pools limit any inference about the effect of geography.
8. Prices remain below their peak; recoveries have partly rebounded
Collateral prices matter when vehicles are sold, but timing and definitions must match. The chart uses Cox Automotive’s Manheim wholesale price index. Older published bases are bridged through the corresponding December 2021 reference and normalized to December 2021 = 100. The reconstruction uses rounded public releases.prices
The normalized index is approximately 79.7 in December 2025. The latest checked October 2026 published index is 206.8, equivalent to roughly 80.2 on the chart’s scale. October contributes a price observation only.
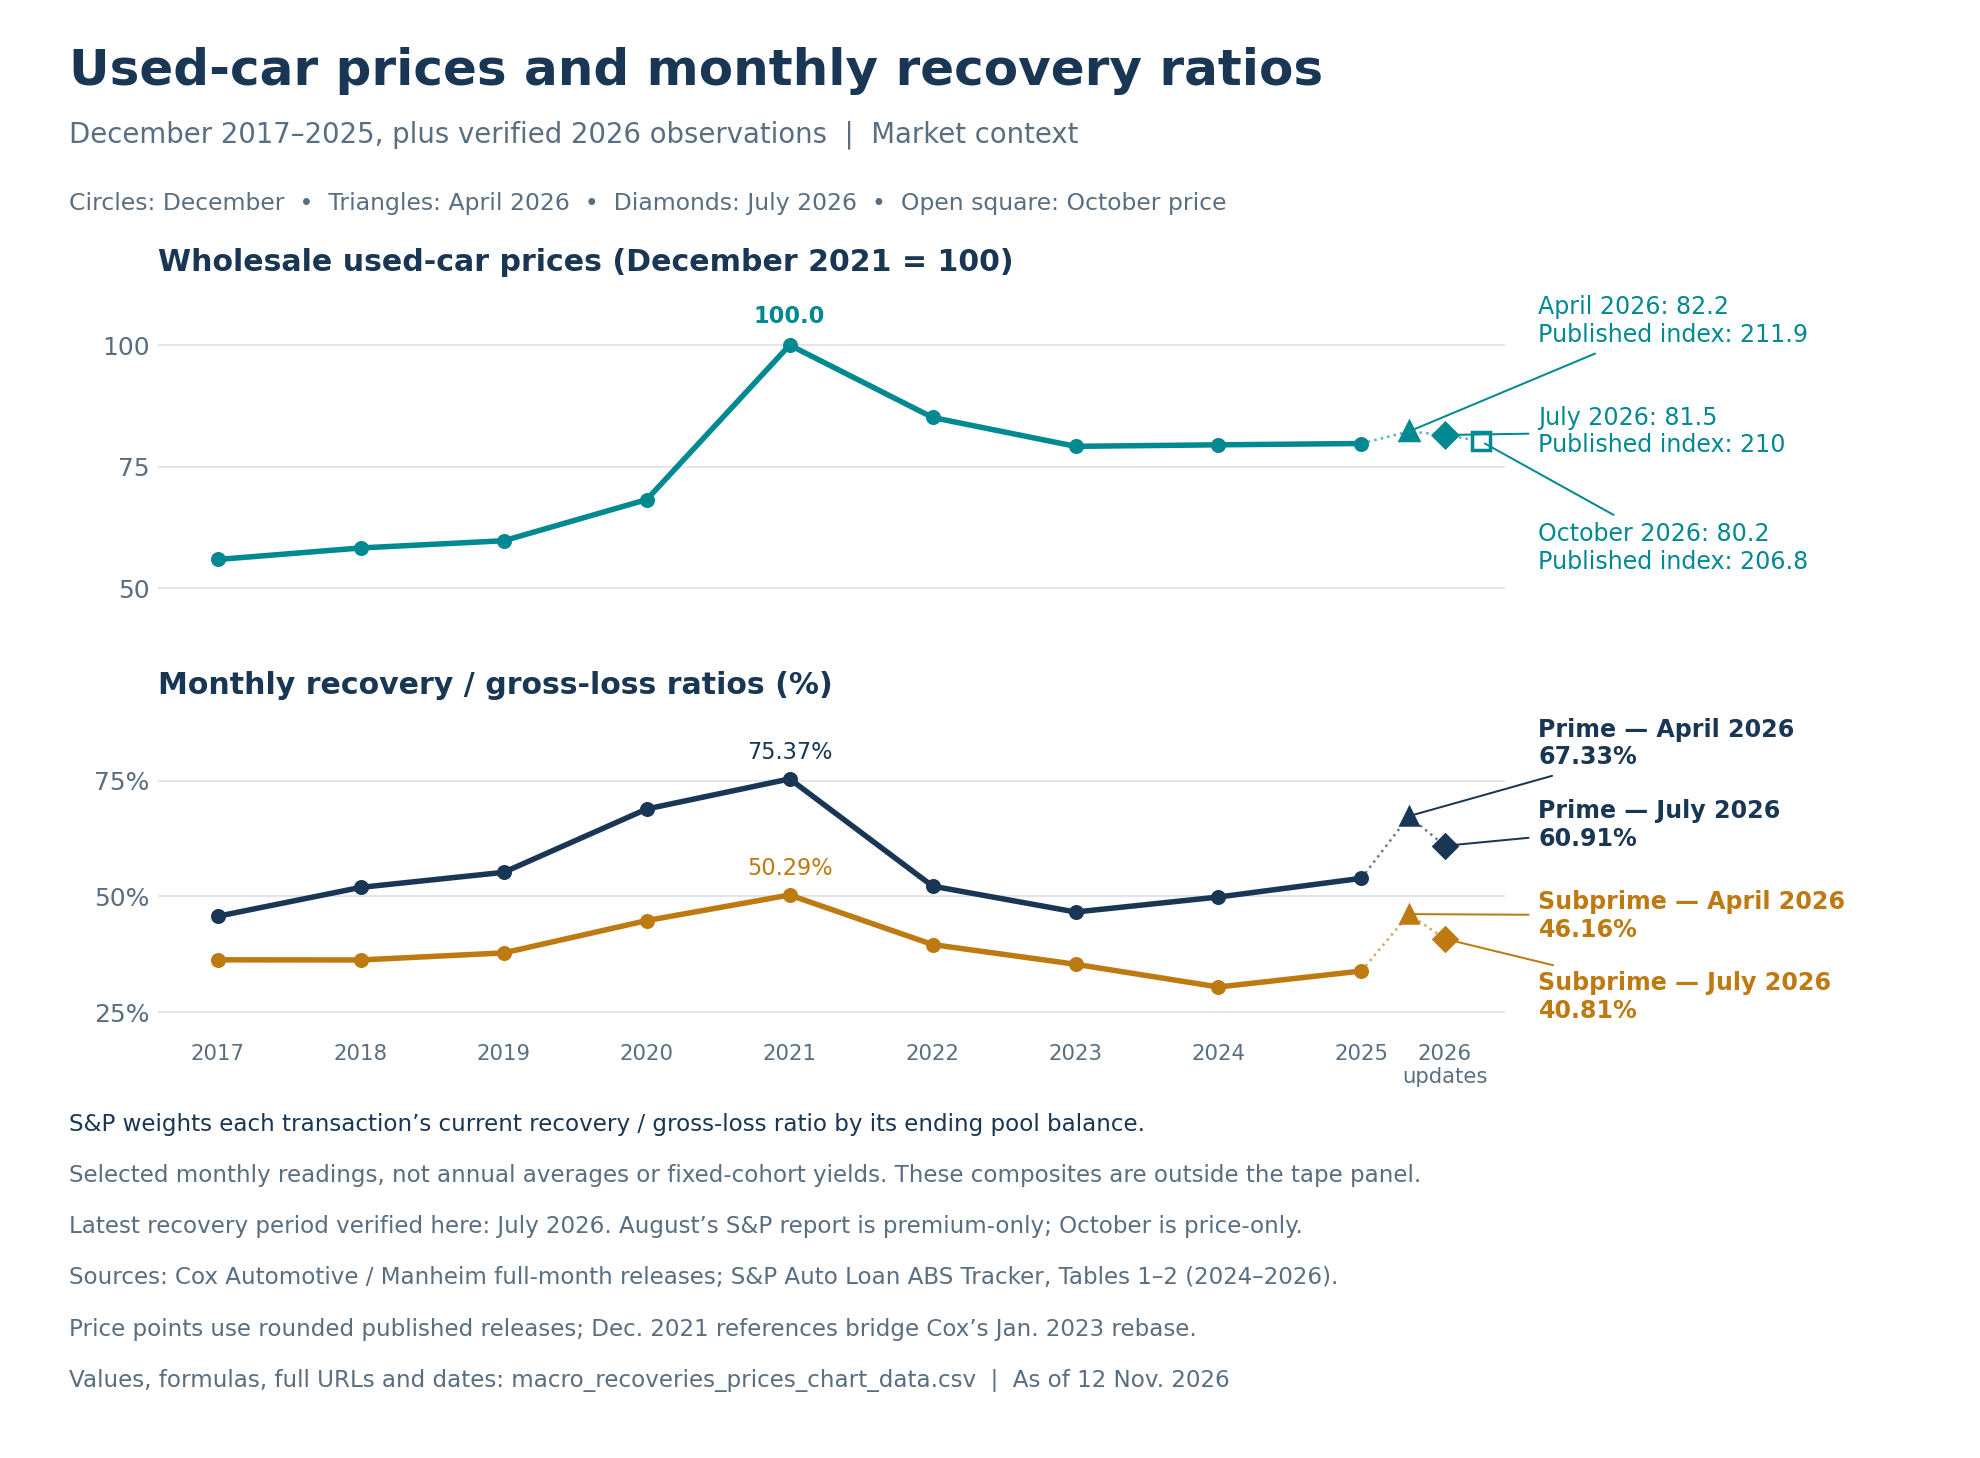
Sources: Cox/Manheim full-month releases and S&P Auto Loan ABS Tracker tables. Each December point covers a single month. April and July 2026 show newer paired observations; October shows price alone.
S&P’s broader prime recovery measure fell from 75.37% in December 2021 to 53.89% in December 2025; subprime fell from 50.29% to 33.86%. Newer observations temper that decline: April 2026 reached 67.33% prime and 46.16% subprime, before moderating to 60.91% and 40.81% in July. Different calendar months are not a seasonally matched annual comparison.recoveries
S&P weights transaction-level current-recovery/current-gross-loss ratios by ending pool balance. These are neither matched-default-cohort recovery yields nor the aggregate recoveries divided by aggregate defaults in this study’s selected trusts.
July is the latest detailed recovery table freely verified here. An August tracker was published October 2, 2026, but its detailed table was behind paid access. No values were imputed from that unavailable table.
The observations are consistent with prices affecting recoveries but do not identify a price elasticity. Vehicle age and condition, repossession and sale timing, expenses, post-charge-off borrower payments, portfolio mix and earlier default timing all affect current cash recoveries. A regression of a few selected December observations would imply more precision than the data support.
CarMax 2023-1's cumulative cash recoveries equal 39.61% of cumulative gross charge-offs through September 2026. The prospectus assumed 50% recoveries. The certificate ratio includes principal and finance charges, with uneven recovery windows across loans. Later collections can raise it.caot, caot-prospectus
9. Low, base and high scenarios
CarMax provides a transparent anchor: realized CNL exceeds the original expectation and a current agency forecast is available. Hold September’s realized loss, remaining face and original denominator fixed. Future net losses are a percentage of $209.22 million remaining face:
Illustrative final CNL = ($53.4463 million + $209.2227 million × future net-loss rate) ÷ $1,491.0026 million.
| Scenario | Future net loss / remaining face | Additional net loss, $m | Illustrative final CNL |
|---|---|---|---|
| Low | 0.000% | 0.00 | 3.585% |
| Base | 1.179% | 2.47 | 3.750% |
| High | 5.000% | 10.46 | 4.286% |
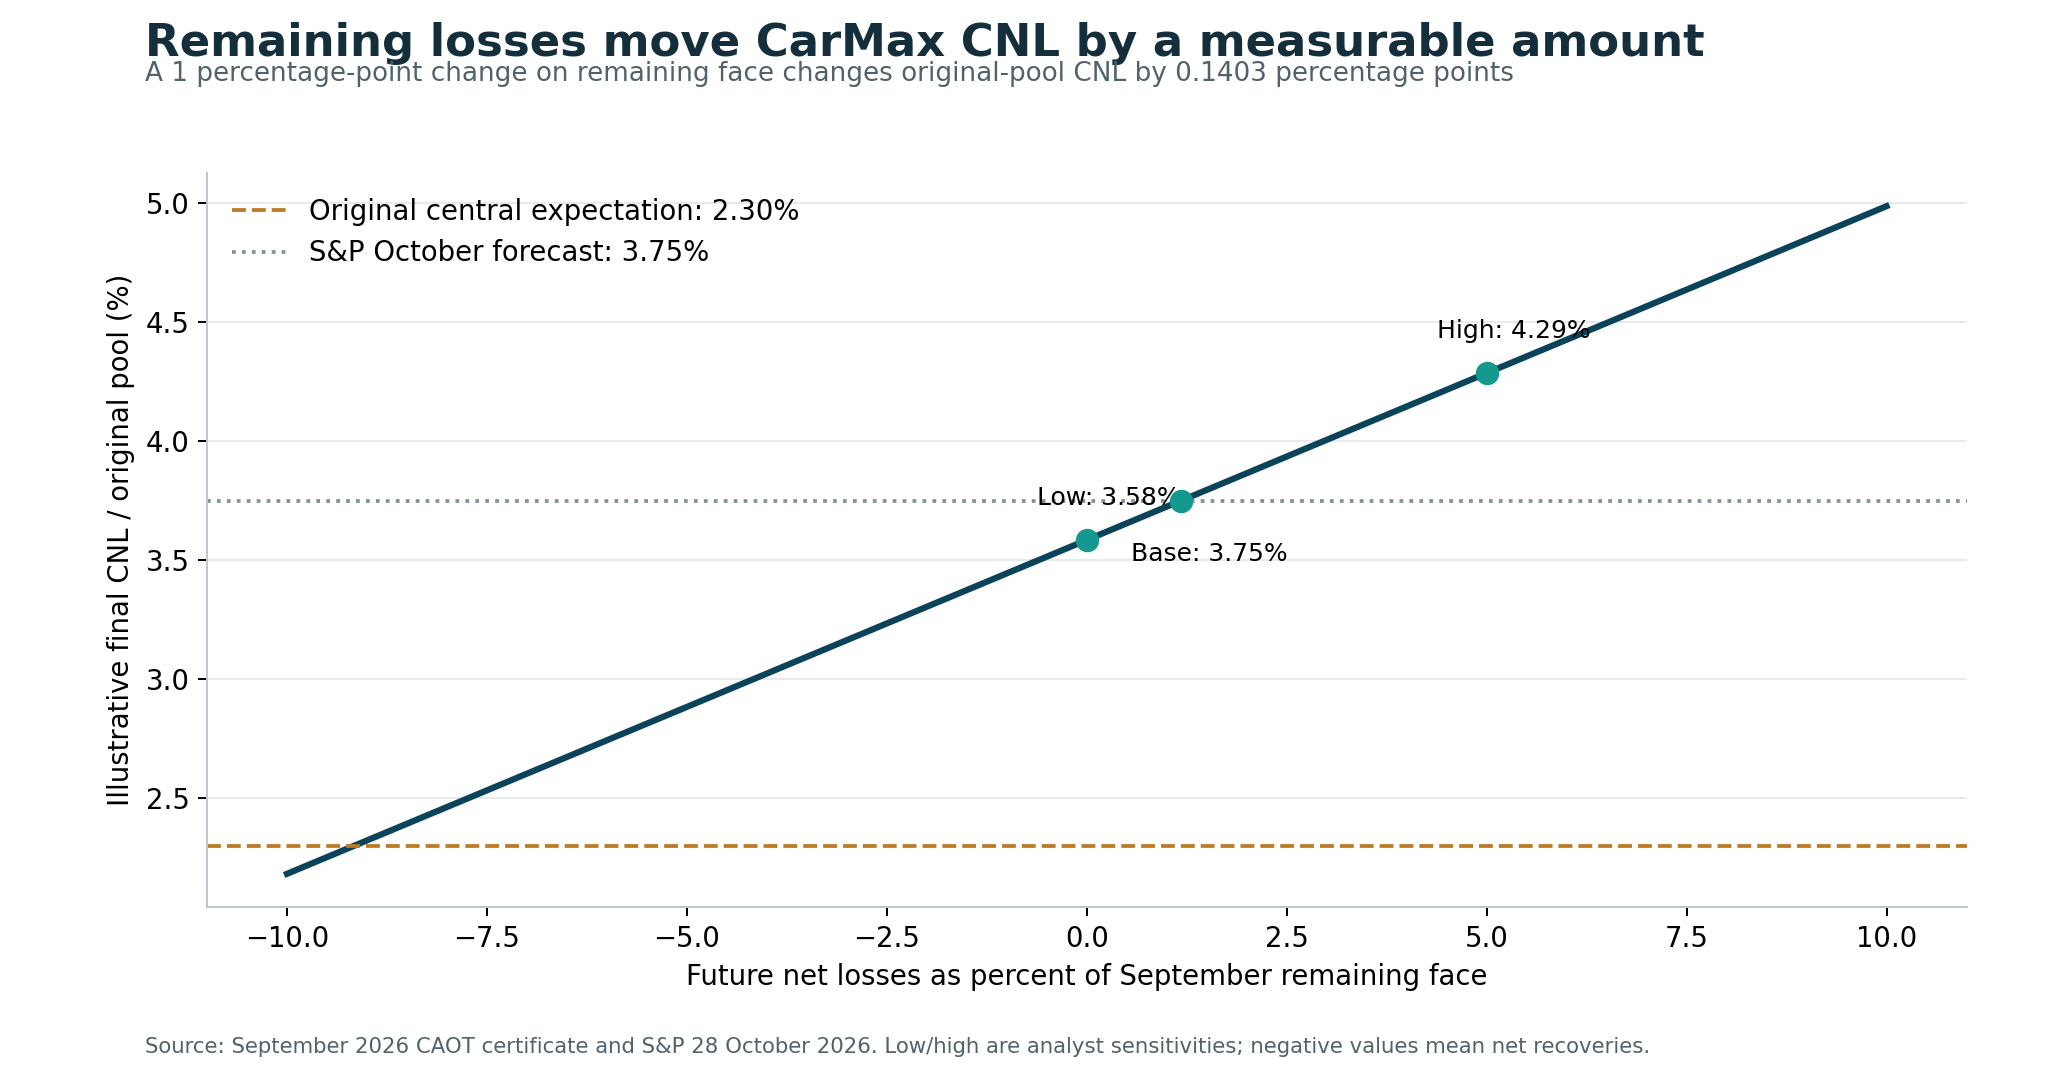
Sources: September CarMax certificate and S&P’s October 28 update. Low/high tail rates are analyst-selected sensitivities. Base backs into the agency’s 3.75% ultimate forecast. No probabilities are assigned.
Reaching 3.75% requires $2.47 million additional net losses, or 1.178768% of remaining face. The high case applies a 5% future net-loss rate to remaining face, producing 4.286209% final CNL. That result illustrates the effect of the stress assumption.
Each additional one percentage point of net loss on remaining face adds 0.140324 percentage points to original-pool CNL. The workbook lets readers change tail assumptions and preserves the sourced starting values. It also permits negative future net losses: recoveries on old charge-offs can exceed new charge-offs. Zero future net loss is therefore not a mathematical floor.
Returning to the original 2.30% central expectation would require approximately $19.15 million of net future recoveries, after offsetting new charge-offs. That is the threshold that would reverse the eventual overrun; this report assigns it no likelihood.
Evidence that would change the conclusion
A broader matched population could change the market interpretation. Adding every eligible trust, tracking collateral exits and consistently matching origination month, seasoning, score convention and vehicle valuation could show the selected pools to be unusually weak or unusually strong. The present sample cannot settle that selection question.
Exact accounting bridges could change loan-vintage comparisons. Full reinstatement, cramdown and liquidation reconciliation would permit more reliable attribution of CarMax, SDART and World Omni losses to individual loans. Current residuals prevent a verified five-lender vintage CNL ranking.
Longer and better matched extension follow-up could change the assessment. Borrowers still paying at six months can default later; early delinquency can cure. Comparable non-extended borrowers observed from the same decision date are needed before attributing an effect to extensions.
Final recoveries could change ultimate losses. Exceeding the original forecast today does not guarantee the final lifetime total. Conversely, a pool below its original lifetime expectation can exceed it later. The scenarios quantify the remaining exposure without presenting a probability estimate.
Methods, decisive assumptions and release limits
The analysis streamed the SEC XML filings into compressed CSVs and used pandas and NumPy to apply issuer-specific field definitions and calculate the aggregates.
| Choice | Consequence |
|---|---|
| Fixed original pool face for transaction CNL | Comparisons use the same denominator as issuance assumptions. |
| Fixed original loan amounts for origination-cohort loss | These results cannot be read directly against whole-deal cutoff-balance forecasts. |
| Positive PTI with a zero-inclusive sensitivity | Ambiguous zeros do not mechanically lower the principal PTI estimate. |
| Unrounded consumer scores and issuer-specific score types | Commercial scores and co-borrower averages do not silently cross consumer thresholds. |
| Six future months after the second observed extension month | Recent events, competing exits and missing follow-up have explicit treatment. |
| Unknown delinquency tracked as missing | The analysis reports known 60+ exposure and shows the upper bound if all missing cases are delinquent. |
Forty-one extracted fields cover loan terms, borrower attributes and the vehicle at origination. Monthly observations add payments, balances and delinquency status. Servicer reports supply modifications, extension months and the reason the balance reached zero. The loss calculations use repossession proceeds, charge-offs and recoveries. The analysis preserves source strings and reported codes. “Unknown” marks inputs the tapes could not resolve.
The three headline numbers were independently cross-checked:
| Headline | Recomputed value | Independent cross-check |
|---|---|---|
| CarMax 2023-1 realized CNL | 3.584591% | Certificate gross losses less recoveries, divided by exact initial face. S&P surveillance reports 3.58%. |
| CarMax month-45 relative increase | 67.310963% | Two independently parsed certificate histories and exact original denominators, including $1,310,000,025.92 for 2017-1. |
| Ally realized CNL | 1.382242% | All 40 monthly loan net-loss totals reconcile to the certificate; original 1.20% independently verified in Fitch presale. |
The workbook contains sourced inputs, formulas and results. The aggregate data download contains chart inputs and reconciliation tables. The filing manifest links to each underlying SEC loan tape.
Sources and calculation notes
- CarMax, 2023-1 September 2026 servicer certificate, October 15, 2026, EX99 rows 5–7, 17b, 18b, 77 and 80–83: initial/ending face and cumulative gross loss, recoveries and net loss. Workbook Trust inputs and Calculations show dollar amounts before division. ↩
- CarMax, 2017-1 September 2020 certificate, October 15, 2020, rows 5–7, delinquency, extensions and 78–81; compare 2023-1 September 2026. The aggregate download includes the original labels and source URLs for all 94 certificates. Its matched reporting-age table aligns the 45 common months. ↩
- Original lifetime base expectations: S&P, SDART 2023-1, January 12, 2023, “Expected Loss”/Rationale, 15.50%; AMCAR 2023-1, March 2, 2023, same section, 10.00%; CAOT 2023-1, January 13, 2023, p. 6, 2.30%; World Omni 2023-A, February 2, 2023, p. 2, 1.35%. Fitch, Ally 2023-1 presale, July 5, 2023, pp. 1, 3–4, 1.20%. The percentages are the agencies’ base expectations for the collateral. ↩
- Ally, September 2026 certificate, October 22, 2026, pp. 6–7: initial aggregate amount financed, ending collateral, cumulative net loss and delinquency. Ally Exhibit 103, field 48, controls exclusion of terminal-dated balances from ending face. ↩
- Calculated from the monthly SEC asset files in the filing manifest. The extension outputs download reports the counts and six-month rates. Relevant tags: assetNumber, paymentExtendedNumber, modificationTypeCode, reportingPeriodModificationIndicator, zeroBalanceCode, zeroBalanceEffectiveDate and reportingPeriodActualEndBalanceAmount. Ally September explanatory exhibit, fields 35 and 70, describes in-period changes/extensions. Two implementations reproduced the counts. A targeted ten-file first/latest check found every code-4 extension accompanied by a true in-period modification indicator; it is not a full-period semantic audit. ↩
- The filing manifest gives report and filing dates, XML links, SHA256 hashes and extracted row counts for the SEC ABS-EE files. The analysis used 41 fields from those filings. ↩
- Issuer explanatory exhibits: CarMax, AMCAR, SDART, World Omni and Ally, September 2026 reporting. See chargedoffPrincipalAmount, recoveredAmount, repossessedProceedsAmount, modification/extension notes and servicing-adjustment disclosures. The monthly reconciliation tables show the residuals. ↩
- SEC Regulation AB, Schedule AL, current text checked November 12, 2026, Item 3: loan terms, obligor, performance and modifications; especially 3(c)(4), 3(c)(6), 3(f)(24)–(25), and 3(j)(2). Auto-loan exit codes are verified in the SEC ABS XML Technical Specification, version 3.2, March 2025, section 4.1.11, printed p. 4-3. Issuer-specific reporting details appear in the explanatory exhibits cited above. ↩
- Ally’s first June 2023 loan file and subsequent 39 tapes; the 39 certificate source URLs and June–July first-period mapping are in the Ally monthly reconciliation table in the aggregate download. All net-loss and ending-face controls reconcile to cents using the stated mapping. The terminal-date exclusion applies to ending face; beginning face uses the raw sum that reconciles to the certificates. ↩
- Selected public ABS-EE cover pages: Carvana 2026-P2, October 15, 2026; Exeter 2026-1; Bridgecrest 2024-1, October 15, 2026. Each covers September 2026. The filing manifest identifies the analyzed September files by accession. ↩
- Exeter, 2026-1 final prospectus, dated January 21 and filed January 23, 2026, p. 57, discussion of the EART/Select selection changes. The change affects the credit-score mix of the pool. ↩
- Tricolor, issuer announcement of $328 million securitization, March 12, 2025, opening transaction/private-placement paragraphs. For another private-issue example, an SEC fund holdings filing for December 31, 2025, filed February 23, 2026, identifies AMCAR 2025-1 A1/A2A holdings as Rule 144A private placements in the security-title fields. The examples describe the reporting status of the specific transactions cited. ↩
- S&P, CarMax ratings update, October 28, 2026, Table 1 (2023-1 realized CNL, reporting age, pool factor, delinquency) and Table 2 (original 2.25%–2.35% range and current 3.75% expectation). The January 2023 presale gives the original 2.30% central estimate. ↩
- CarMax, 2023-1 final prospectus, filed January 23, 2023, pp. 128–129, retained-interest fair-value assumptions: CNL, recovery percentage and recovery lag. ↩
- SDART, September 2026 certificate, October 2026, collateral/loss and delinquency rows. Literal 60+ additionally includes loans reporting exactly 60 days in the corresponding Exhibit 102. World Omni, September certificate, October 29, 2026, Pool Statistics: face equals yield-adjusted balance plus yield-supplement overcollateralization. ↩
- AMCAR, September 2026 certificate, October 29, 2026, pp. 1 and 5: initial/current collateral, net losses and delinquency. The certificate reports whole dollars. Loan tags record cents. ↩
- CarMax, January 2021 certificate, February 16, 2021, and Form 15, March 16, 2021. SDART, April 2021 certificate, May 17, 2021, rows 76, 84, 112–113, and Form 15, filed May 19. These certificates mark the endpoints of the analyzed SEC histories. ↩
- CarMax, 2017-1 prospectus, dated January 25 and filed January 27, 2017, p. 121, issuer fair-value assumptions. Historical rating-agency loss forecasts for 2017 remain unverified. ↩
- Calculated from first-file and current-status fields. The workbook shows the source inputs for the loan metrics. LTV divides originalLoanAmount by vehicleValueAmount using each issuer’s valuation convention. Literal delinquency uses currentDelinquencyStatus ≥60 and active balance. Missing or negative status goes into the unknown group. ↩
- Carvana September 2026 explanatory exhibit, originalLoanTerm definition; loan file, originalLoanTerm and positive ending balance. Composite score strings remain raw; consumer analysis extracts only explicit FICO values. ↩
- Issuer Exhibit 103 score/PTI definitions in Ally, fields 26–27 and 31, and World Omni. The workbook distinguishes score types and shows the positive-only and zero-inclusive PTI calculations. ↩
- The vintage-loss chart data give original principal and cumulative observed cash flows for Ally and AMCAR’s Q42022_MOB45 cohort comparisons. Cohorts use the origination month reported at first observation and track cash flows from pool entry. The denominator sums the original amounts of the selected loans. The filing manifest gives the source URLs and hashes. ↩
- Cox Automotive, December 2021 release, January 7, 2022, reference index under the older base; rebasing explanation, January 9, 2023; December 2025, January 8, 2026; July 2026, August 7; October 2026, November 6, opening full-month value paragraphs. The recovery-price chart data include the observation dates and source URLs. ↩
- S&P, full-year/December 2023 tracker, February 13, 2024, Table 2 historical observations; April 2026 tracker, June 2, 2026, Tables 1–2; July 2026 tracker, September 1, 2026, Tables 1–2 and Appendix I recovery definition. August tracker, October 2, exists but its detailed recovery table was not freely verified. ↩
- SDART, July 2024 Exhibit 102 and Exhibit 103, filed August 15, 2024, currentDelinquencyStatus and Item 3(f)(25). An independent XML parse confirms the absent-tag counts and balances; no reported zero or negative DPD occurs in the file. The filing manifest gives the source hash. ↩
Supporting material
- Excel model ↗Sourced inputs, live calculations and reported outputs.
- Aggregate source and model data ↗Chart inputs, cohort counts and certificate reconciliations.
- SEC loan tape filing manifest ↗Report dates and SEC links for the 322 underlying filings.
- Trust and reporting coverage ↗Selected trusts, reporting periods and loan-month counts.
- Payment extension outcomes ↗Counts, charge-off rates and missing-outcome bounds by trust and score band.