Financial systems
How much longer server lives lift Big Tech profits
Alphabet and Microsoft disclosed $7.6 billion in fiscal 2023 operating-income benefits. A four-year-life model puts the current five-company net-income sensitivity at $24 billion.
Longer server lives have added billions of dollars to reported profits. The cleanest directly documented comparison is Alphabet and Microsoft in their respective fiscal 2023 years: their extensions reduced depreciation and increased operating income by a combined $7.6 billion, with a combined $6.0 billion increase in net income. The disclosures cover two companies’ annual effects across different fiscal periods and equipment categories.1
The fleet has grown substantially; a cohort model estimates the current sensitivity. This report’s base model estimates that four-year computing-equipment lives would reduce the latest available trailing-twelve-month operating income of Alphabet, Microsoft, Meta, Amazon and Oracle by $30.0 billion, and net income by $24.0 billion, assuming a 20% marginal book-tax benefit. The modeled net-income reduction ranges from $20.2 billion to $27.7 billion across the equipment-allocation scenarios. That takes their combined latest-period operating income from $527.0 billion to $497.0 billion, and net income from $607.3 billion to $583.3 billion.
A scenario assigning three years only to estimated AI accelerator costs reduces current net income by $23.3 billion in the base case, with a much wider $11.8–37.6 billion range. Reverting to the companies’ earlier representative server/network lives produces a $41.7 billion base reduction. These scenarios answer different questions; they must not be added together.
The next depreciation wave matters at least as much as the historical extensions. At September 2026, Alphabet and Meta alone reported $234.8 billion of assets not yet in service. These balances include buildings and other infrastructure, as well as equipment. A conditional example putting 60% into four-year equipment and 40% into 20-year buildings would produce $39.9 billion of annual depreciation after the entire pool enters service. The calculation shows the annual expense implied by that one balance and mix. The cohort forecast uses its commissioning schedule.2
The evidence supports a material earnings-timing effect. The appropriate accounting life still depends on the equipment. Older GPUs remain publicly offered for rent, while newer architectures and price reductions create real economic pressure. The decisive missing information is the cost and age distribution of the installed fleet, its commissioning dates, and its utilization and realized margins.
1. Changes the companies disclosed
Depreciation spreads the capitalized cost of an asset across its estimated service life. If a new $600 asset has no residual value, six-year straight-line depreciation is $100 a year; four-year depreciation is $150. The extra $50 reduces operating income by $50. At an assumed 20% incremental tax benefit, net income falls $40. The original cash purchase does not change.
For an existing asset, a life change is prospective: the remaining carrying value is allocated across the revised remaining life. Dividing the entire historical purchase price by the new life would misstate the transition. Nor does an extension erase the cost. It moves expense into later periods. Once an asset would already have been fully depreciated under the shorter schedule, the annual comparison can reverse.
Disclosed annual effects
Positive amounts below mean higher reported earnings following a life extension. Negative amounts mean lower earnings following a shortening. Operating-income effects are either expressly disclosed or the one-for-one effect of a disclosed reduction in operating depreciation. ND means the company did not disclose the figure on its own. All EPS figures are adjusted to current share-split units where necessary.
| Company | Fiscal period | Lives, years | OI benefit, $m | NI benefit, $m | EPS benefit, $ |
|---|---|---|---|---|---|
| Alphabet | 2021 | Servers 3→4; network 3→5 | 2,600.0 | 2,000.0 | 0.149 |
| Alphabet | 2023 | Servers 4→6; network 5→6 | 3,900.0 | 3,000.0 | 0.240 |
| Microsoft | 2021 | Servers 3→4; network 2→4 | 2,700.0 | 2,300.0 | 0.300 |
| Microsoft | 2023 | 4 → 6 | 3,700.0 | 3,000.0 | 0.400 |
| Meta | 2021 | Selected assets 3→4 | 620.0 | 516.0 | 0.180 |
| Meta | 2022 | 4 → 4.5 then 5 | 860.0 | 693.0 | 0.260 |
| Meta | 2025 | 4–5 → 5.5 | 2,920.0 | 2,590.0 | 1.000 |
| Amazon | 2020 | 3 → 4 | 2,700.0 | 2,000.0 | 0.199 |
| Amazon | 2022 | Servers 4→5; network 5→6 | 3,600.0 | 2,800.0 | 0.280 |
| Amazon | 2024 | 5 → 6 | 3,200.0 | 2,500.0 | 0.230 |
| Amazon | 2025 | Subset 6→5 | -1,400.0 | -1,000.0 | -0.100 |
| Oracle | 2023 | 4 → 5 | 434.0 | ND | ND |
| Oracle | 2025 | 5 → 6 | 733.0 | 573.0 | 0.200 |
| CoreWeave | 2023 | 5 → 6 | 20.0 | ND | 0.100 |
| Nebius | 2026 H1 | 4 → 5 | 86.1 | 75.7 | ND |
| WhiteFiber | 2025 | Cloud equipment 3→5 | 10.0 | 7.9 | 0.250 |
Sources are the accounting-estimate and PP&E notes in the relevant annual reports, with exact URLs, dates and scope in the accompanying source ledger.1, 3, 4, 5, 6, 7, 8, 9
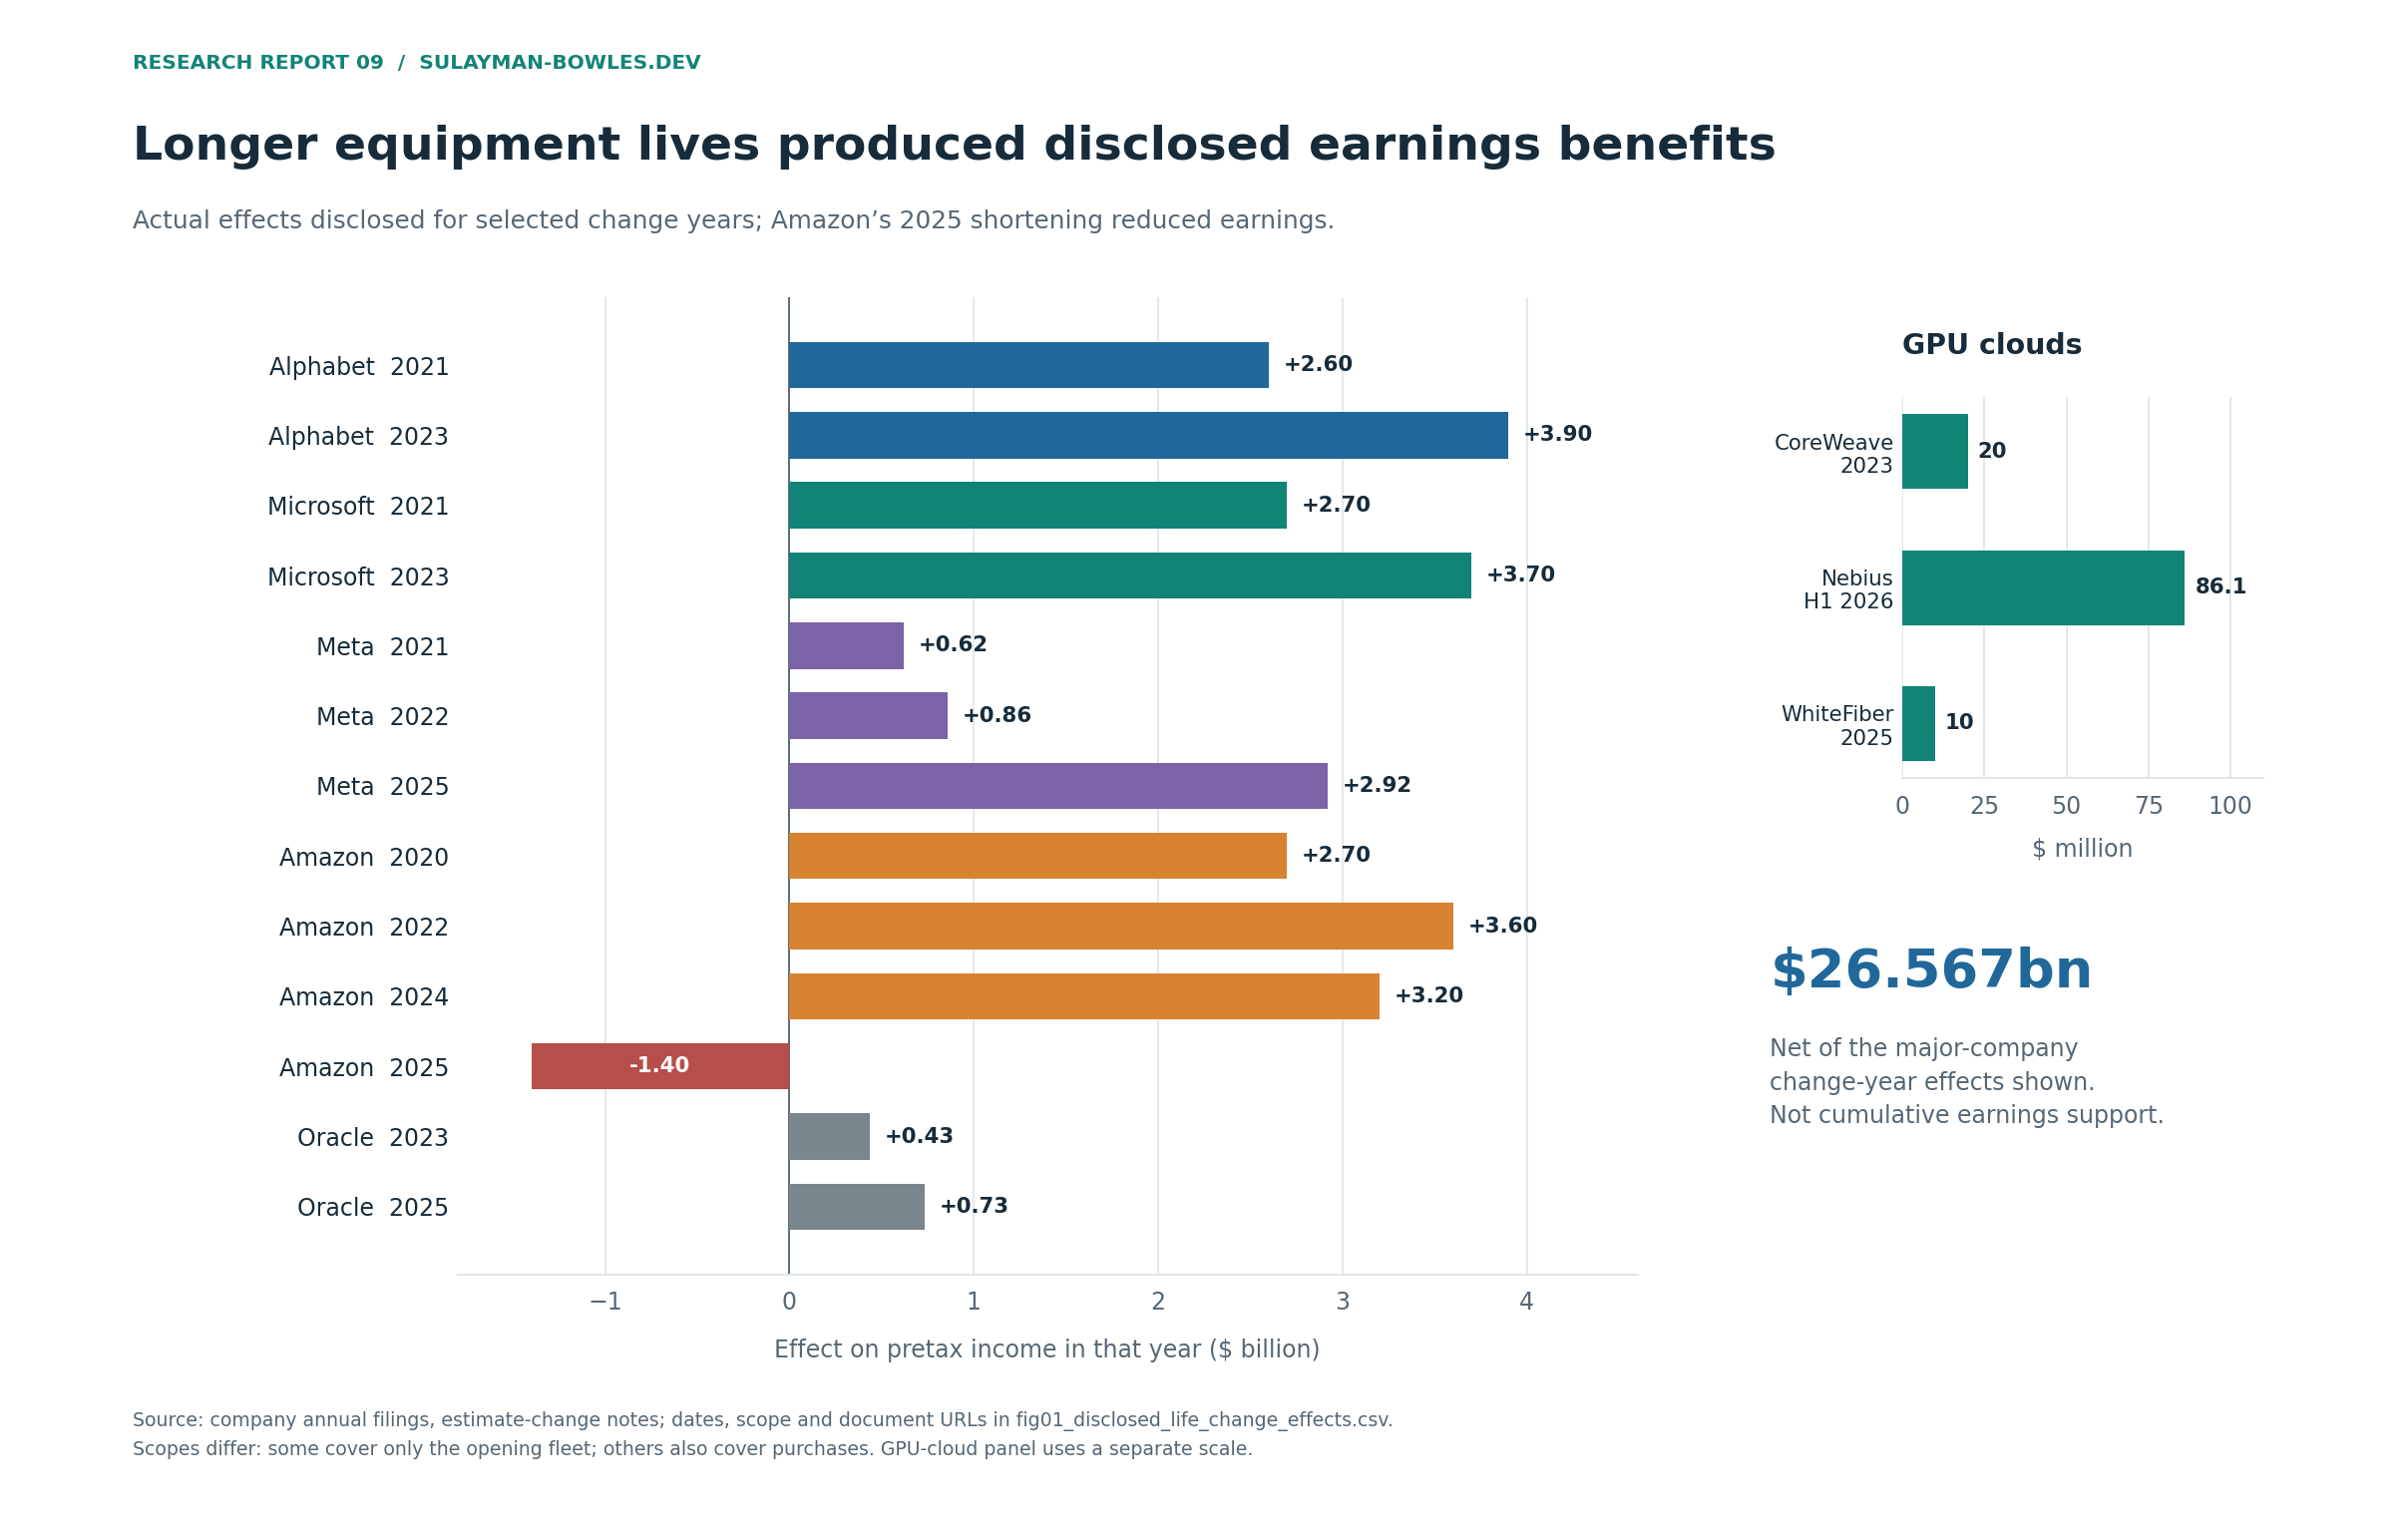
The asset population matters. Microsoft’s fiscal 2023 disclosure applies to equipment already included in PP&E at June 2022. Alphabet includes both the opening fleet and assets placed in service during 2023. Meta’s $2.59 billion 2025 net-income benefit applies to assets already placed in service at December 2024. The table therefore cannot be summed into an estimate of all earnings support across all intervening years. Subsequent benefits from those assets remain in later income statements without necessarily receiving another disclosure of the dollar effect.
Amazon’s reversal is real and belongs in the comparison
Amazon extended server lives from three to four years in 2020, from four to five in 2022, and from five to six in 2024. Networking moved from five to six years in 2022. In 2025 it shortened a subset of servers and networking equipment from six to five years, primarily affecting AWS. Its 2025 annual report reports a $1.4 billion operating-income reduction, $1.0 billion net-income reduction and $0.10 EPS reduction.4
The earlier $700 million depreciation estimate was based on the opening fleet. It is not the final annual impact, which also includes affected 2025 additions. Amazon also recorded accelerated depreciation associated with equipment retirements. Those charges are a different event and must not be counted again as part of the accounting life change.
Amazon also forecast a $900 million 2025 operating-income benefit from extending certain heavy-equipment lives from 10 to 13 years; Amazon did not quantify the effect. That non-server change is outside this adjustment. The server/network reduction is therefore not the net effect of every Amazon PP&E estimate change.4
The amount of the fleet subject to the five-year policy is not disclosed. This model divides Amazon server/network cohorts equally between five- and six-year lives from 2025. The equal split is a model assumption. A model leaving every Amazon server at six years would miss a documented change; assigning every server five years would claim a scope the filing leaves unresolved.
As an extreme sensitivity around the same base allocation, putting all eligible modeled gear at five years or all at six changes Amazon’s four-year counterfactual EPS to $12.14 or $11.77, respectively, versus the base $11.96. The corresponding five-company after-tax adjustment is $21.9–26.0 billion. These endpoints expose the missing subset information; both are assumptions about the fleet mix.
Changes continue beyond the largest platforms
CoreWeave extended computing equipment from five to six years in 2023 and disclosed a $20 million expense reduction. Nebius extended server/network lives from four to five years effective January 2026; the realized first-half reduction was $86.1 million in depreciation and $75.7 million in net income. Its earlier $167.6 million full-year estimate and the disclosed second-quarter subset are not additional realized benefits.7, 8
WhiteFiber extended cloud-equipment lives from three to five years in 2025. Its full-year benefit was $10.0 million before tax, $7.9 million in net income and $0.25 per diluted share. IREN’s public GPU history uses five years; no corresponding GPU-life extension was identified. ChronoScale reported that equipment-lease renegotiation extended finance-equipment amortization to five years, but did not provide a quantified earnings effect suitable for this table.9, 10, 11
Microsoft also announced a fiscal 2027 extension for datacenters and office buildings from 15 to 25 years. Management expected a minimal operating-income benefit and a larger effect on the classification of future datacenter leases. That is a building and lease-accounting development; it is not a further extension of GPU lives and is outside this report’s equipment-only earnings adjustments.12
2. What current earnings look like under alternative lives
The main model uses the same estimated acquisition costs and commissioning dates under four depreciation paths. The “book” path follows the disclosed sequence of representative lives. The alternatives are:
- Earlier lives: Alphabet servers/network three years; Microsoft servers three/network two; Meta servers three/network four; Amazon servers three/network five; Oracle four; CoreWeave five; Nebius four. Meta’s earlier network figure is an analytical representative life, because the disclosed range is broader.
- Four years: all modeled computing gear uses four years, including CPU servers and networking. Buildings keep their existing treatment.
- AI three years: only the estimated accelerator-cost share uses three years. Other computing gear follows the book path. This includes custom accelerators such as TPUs where relevant; it does not equate AI capital spending exclusively with Nvidia purchases.
For each company, the difference between alternative and book equipment depreciation is deducted from reported operating income. Reported depreciation for buildings and other assets remains in the baseline. Net-income and EPS bridges apply the stated marginal tax assumption and hold the reported share denominator fixed. This isolates depreciation; it does not forecast offsetting revenue, pricing, financing or management responses.
All paths assume straight-line depreciation and zero residual value. The base opening-fleet convention treats 65% of 2019 gross gear as still depreciable, spread evenly across age bands; Low/High use 50%/80%. CoreWeave starts with its first public 2022 purchases. Nebius starts with the 2023 continuing-company balance and a 35% active fraction. These assumptions fill gaps in opening-fleet ages and status. They matter more to the early historical comparison than to the current window, by which most opening cohorts have expired.
Base-case EPS bridge
The four largest companies use the sum of four reported quarterly diluted EPS figures. Oracle and CoreWeave use constructed TTM common-income/share ratios. Oracle’s latest TTM ends in August 2026; the other four large companies and CoreWeave end in September. Nebius uses a first-half EPS bridge because its convertible-share and investment-income treatment makes a simple TTM EPS construction less reliable.
| Company / EPS period | Reported or constructed EPS | Earlier lives | Four years | AI accelerators: three years |
|---|---|---|---|---|
| Alphabet — latest TTM | 19.16 | 18.47 | 18.76 | 18.79 |
| Microsoft — latest TTM | 19.16 | 17.03 | 18.06 | 18.08 |
| Meta — latest TTM | 29.33 | 26.92 | 27.89 | 27.83 |
| Amazon — latest TTM | 12.37 | 11.59 | 11.96 | 11.97 |
| Oracle — latest TTM | 6.38 | 5.46 | 5.46 | 5.56 |
| CoreWeave — latest TTM | -4.71 | -6.55 | -9.32 | -11.51 |
| Nebius — H1 2026 | 1.53 | 1.16 | 1.16 | 0.86 |
USD per diluted share. Alternative EPS columns are modeled. Nebius’s row covers continuing EPS for H1 2026. CoreWeave’s negative EPS becomes a larger loss. Source financial statements and EPS notes are linked in the workbook’s raw-financial and quarterly-EPS inputs.2, 7, 8, 13, 14, 16
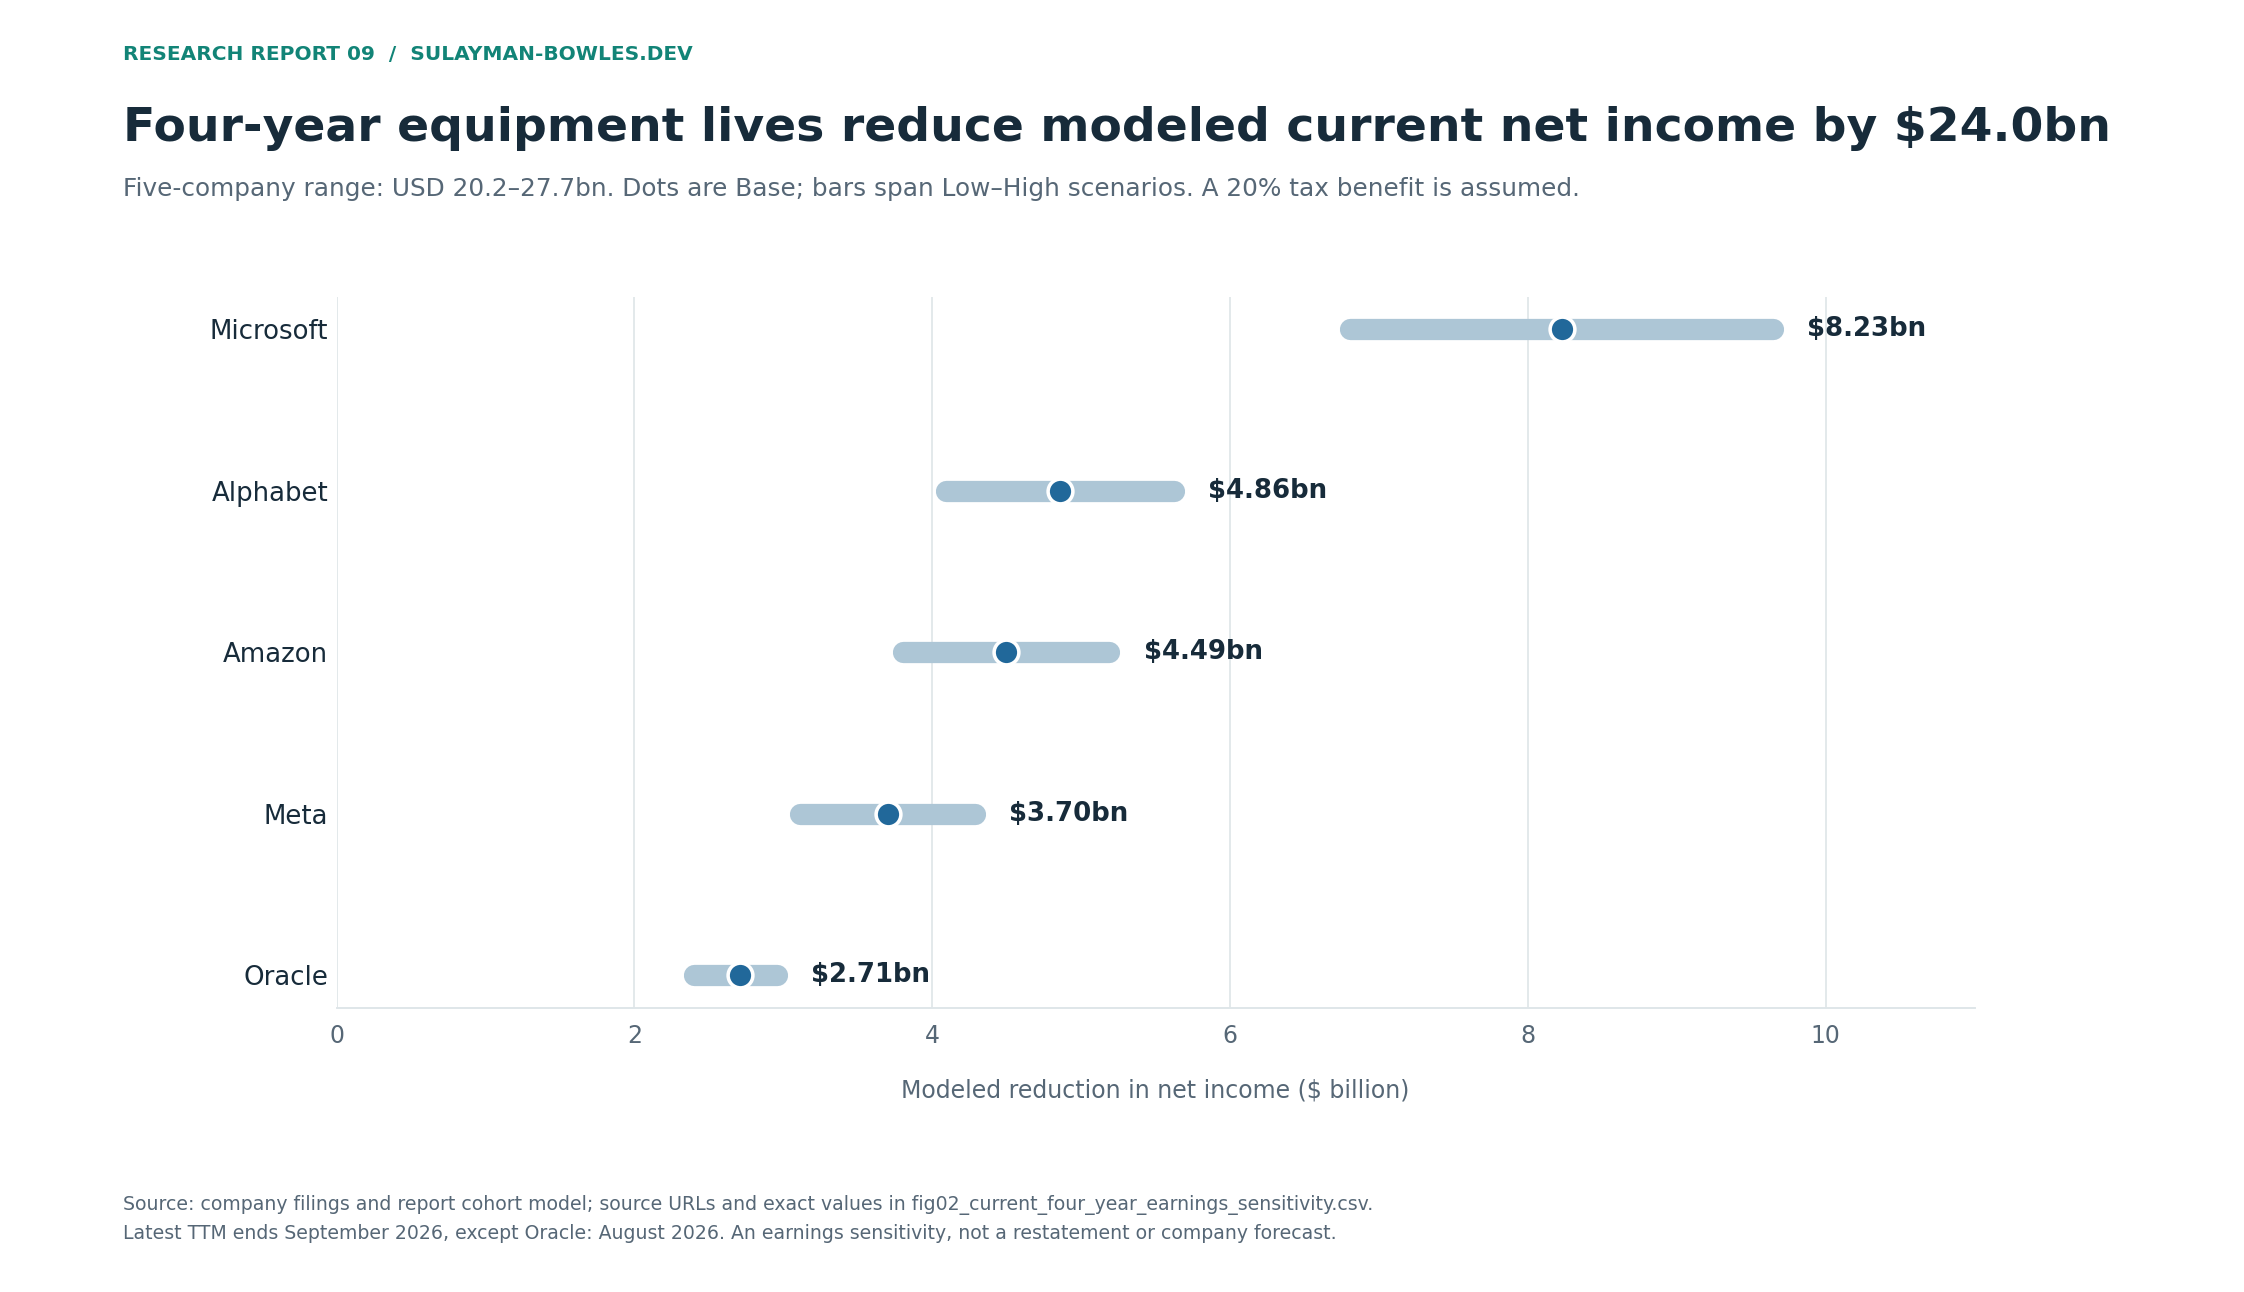
The base four-year effect equals 5.7% of the five companies’ reported operating income and 3.9% of reported net income. Operating income is the clearer comparison: reported net income also contains investment gains, tax effects and other non-operating items. Those items remain in this bridge. The adjusted EPS figures should not be read as normalized recurring earnings.
| Life scenario | Low | Base | High |
|---|---|---|---|
| Earlier representative lives | 35.1 | 41.7 | 48.2 |
| Uniform four-year gear | 20.2 | 24.0 | 27.7 |
| Three-year AI accelerators | 11.8 | 23.3 | 37.6 |
USD billions of modeled net-income reduction across the five large companies. Each scenario is an alternative to the baseline. Low/Base/High vary equipment mix, accelerator share, opening-fleet assumptions and commissioning; they are not statistical confidence intervals.
Oracle has the largest proportional EPS sensitivity among the five in this model. Microsoft has the largest dollar reduction in net income. The difference reflects both the size of the modeled fleet and the relative size of reported earnings; it is not a ranking of the quality of each company’s accounting.
Historical comparison since 2020
The table below gives the base four-year EPS deduction for each historical year. Subtract it from reported EPS. Negative deductions in early years are intentional: a uniform four-year life can be longer than the three-year life then in use, initially increasing earnings. The complete annual output includes operating income, net income, all three alternative paths and forward depreciation for every modeled company.
| Company | 2020 | 2021 | 2022 | 2023 | 2024 | 2025 |
|---|---|---|---|---|---|---|
| Alphabet | -0.066 | 0.171 | 0.083 | 0.351 | 0.303 | 0.297 |
| Microsoft | -0.150 | 0.290 | 0.142 | 0.575 | 0.539 | 0.610 |
| Meta | -0.158 | 0.300 | 0.437 | 0.785 | 0.687 | 1.291 |
| Amazon | 0.125 | 0.084 | 0.252 | 0.170 | 0.372 | 0.231 |
| Oracle | 0.000 | 0.000 | 0.000 | 0.159 | 0.146 | 0.428 |
| CoreWeave | — | — | — | 0.246 | 1.768 | 2.400 |
| Nebius | — | — | — | — | 0.000 | 0.000 |
| IREN | — | — | — | — | 0.004 | 0.005 |
| WhiteFiber | — | — | — | ND | -0.059 | 0.147 |
Modeled dollars per share; issuer fiscal years. Dashes denote periods before comparable public GPU-cloud data. Microsoft and Oracle FY2026 historical deductions are additionally $0.938 and $0.745, respectively. CoreWeave’s first comparable inputs are 2022; Nebius’s continuing-company opening balance is 2023. No pre-IPO GPU history is invented.
These historical sensitivities are not a substitute for the directly disclosed change-year benefits. They answer what a consistently different life path would have produced, including different opening carrying values and subsequent additions. They also use annual timing approximations: Meta’s successive 2022 changes are represented by a 4.5-year annual life. An independent quarterly check changes its modeled 2022 book depreciation by about $134 million, but current TTM book depreciation by only about $16 million.
IREN and WhiteFiber use different fleet disclosures
IREN’s September 2026 gross GPU hardware was $5.819 billion, excluding its mining equipment. Another $398 million of finance-lease ROU assets was primarily GPUs and related hardware. Its accounting policy includes delivered hardware still in storage within the hardware class; depreciation starts when available for use. Treating the entire reported class as a fully operating fleet would therefore be unjustified.10
The supplementary model assumes 25%/50%/75% of delivered GPU-class costs are active in Low/Base/High cases. The high case also includes the finance-lease class as a GPU proxy. Its implied current book depreciation exceeds reported total PP&E depreciation, so it serves as an aggressive test of earlier commissioning. The base case remains below that ceiling.
WhiteFiber’s reported gross cloud-equipment class fell from $146.6 million at December 2025 to $131.8 million at September 2026 following equipment disposals. Its $549.8 million of nine-month cash purchases and deposits therefore cannot sensibly be labeled GPU purchases. The supplementary model applies a proportional retirement proxy and adjusts the alternative carrying value removed on disposal, holding proceeds fixed. The ages of disposed assets are unknown.15
| Company | Period | Reported EPS | Earlier lives | Four-year EPS | AI-three-year EPS |
|---|---|---|---|---|---|
| IREN | Q1 FY2027, three months | -0.66 | -0.66 | -0.72 | -0.78 |
| WhiteFiber | Nine months ended September 2026 | -3.25 | -3.48 | -3.35 | -3.42 |
Modeled EPS for the stated reporting periods. No marginal tax shield is assumed. The AI scenario applies three years to an estimated 75% accelerator-cost share in the base case; remaining host equipment follows book lives. WhiteFiber includes the modeled disposal-carrying-value effect. The workbook also supplies depreciation-only results.
ChronoScale remains an unquantified comparison. Its FY2026 report for the year ended May 31 shows $122.5 million of net finance-lease ROU assets and $54.6 million of annual ROU amortization. A comparable GPU cohort model needs the underlying gross cost, vintage and lease-modification detail, which the reviewed material does not provide. Applied Digital still consolidates the business; counting both as independent GPU fleets would duplicate exposure.11
3. The capital-spending number is not the depreciating equipment number
The model starts with the asset balances and spending detail in the annual filings. The latest annual balance snapshots show the scale and composition of the accounting base:
| Company / year end | Gross PP&E | Accumulated depreciation | Net PP&E | Gear class | CIP |
|---|---|---|---|---|---|
| Alphabet FY2025 | 345.1 | 98.5 | 246.6 | 122.2 | 78.6 |
| Microsoft FY2026 | 431.8 | 118.7 | 313.1 | 215.9 | UNKNOWN |
| Meta FY2025 | 233.7 | 57.3 | 176.4 | 98.0 | 50.5 |
| Amazon FY2025 | 534.1 | 177.1 | 357.0 | 172.5 | 71.7 |
| Oracle FY2026 | 122.7 | 22.7 | 100.0 | 59.6 | 40.0 |
| CoreWeave FY2025 | 33.9 | 3.4 | 30.6 | 20.9 | 9.4 |
| Nebius FY2025 | 6.2 | 0.6 | 5.6 | 3.1 | 2.4 |
USD billions. “Gear” follows each issuer’s disclosed class and is not perfectly comparable: Microsoft includes software; Alphabet is an estimate using the disclosed approximate 60% computing share of technical infrastructure. CIP includes assets not yet in service. UNKNOWN means the company did not report a figure for that item. Finance leases are already inside consolidated PP&E; the table does not add them a second time.13, 14, 16
The principal reconstruction is:
capital additions proxy=cash PP E purchases+new finance-lease assets+Δunpaid PP E.
commissioned capital proxy=additions+opening CIP-closing CIP.
The second line is not a complete asset roll-forward where disposals, foreign exchange, acquisitions or abandoned projects are unisolated. The workbook preserves those residuals. Cash paid this year may settle equipment delivered earlier; a finance lease may bring an asset into use without an equivalent investing-cash outflow; and a building under construction may absorb cash for several periods before depreciation begins.
Four company-specific adjustments prevent the largest distortions
Amazon: use the company’s reported total and AWS net PP&E additions, which already include noncash items, instead of adding leases again. In 2025, total net additions were $142.4 billion and AWS additions were $96.5 billion. The base model allocates commissioned capital to AWS in proportion to AWS’s share of reported net additions, then treats 65% of that allocation as computing gear. It does not depreciate fulfillment centers and delivery equipment as GPUs.14
CoreWeave: its November 2026 materials define capex using the increase in gross PP&E less the change in construction in progress. The nine-month amount was $30.650 billion, compared with $23.558 billion of cash PP&E purchases. The company-defined measure is closer to commissioned capital than cash spending. The forecast uses its $37–39 billion annual guidance on that definition.17
Meta: its capex guidance includes finance-lease principal payments. Principal repays a liability; it is not a new asset purchase. The model removes that principal from the guided cash number, then includes new finance-lease assets where the filings identify them. Counting principal and newly recognized lease assets as two additions would exaggerate the depreciable base.18
Microsoft: its fiscal 2026 filing supports $115.948 billion of cash PP&E additions, $24.608 billion of finance-lease assets obtained and a $19.800 billion increase in unpaid PP&E. Their sum is $160.356 billion. But the change in net PP&E plus depreciation is $142.410 billion. The approximately $17.95 billion difference remains unallocated because the filing does not provide a complete movement table assigning it. A separately disclosed CIP balance is also unavailable; the model makes no Microsoft CIP adjustment.13
That Microsoft residual has a measurable effect on uncertainty. Removing the entire difference from fiscal 2026 modeled capital, proportionately across cohorts, lowers the current five-company four-year net-income reduction from $24.0 billion to $23.5 billion. Microsoft’s modeled four-year EPS rises by about $0.07. This calculation measures sensitivity to the unexplained difference.
How the model allocates equipment and building costs
Alphabet said about 65% of third-quarter technical-infrastructure spending was for servers and networking; its balance-sheet note says approximately 60% of technical-infrastructure assets were computing equipment. Those are different measures: a spending flow and a gross asset stock. Microsoft said roughly three quarters of its latest-quarter capital expenditure related to shorter-lived CPU/GPU assets. Oracle’s investor presentation describes its infrastructure investment as predominantly chips, memory and networking.2, 19, 20, 21
These statements support an equipment-heavy recent buildout. They do not disclose the proportion of cost attributable specifically to accelerators. The model estimates the equipment share first and then estimates the AI share within gear and varies both.
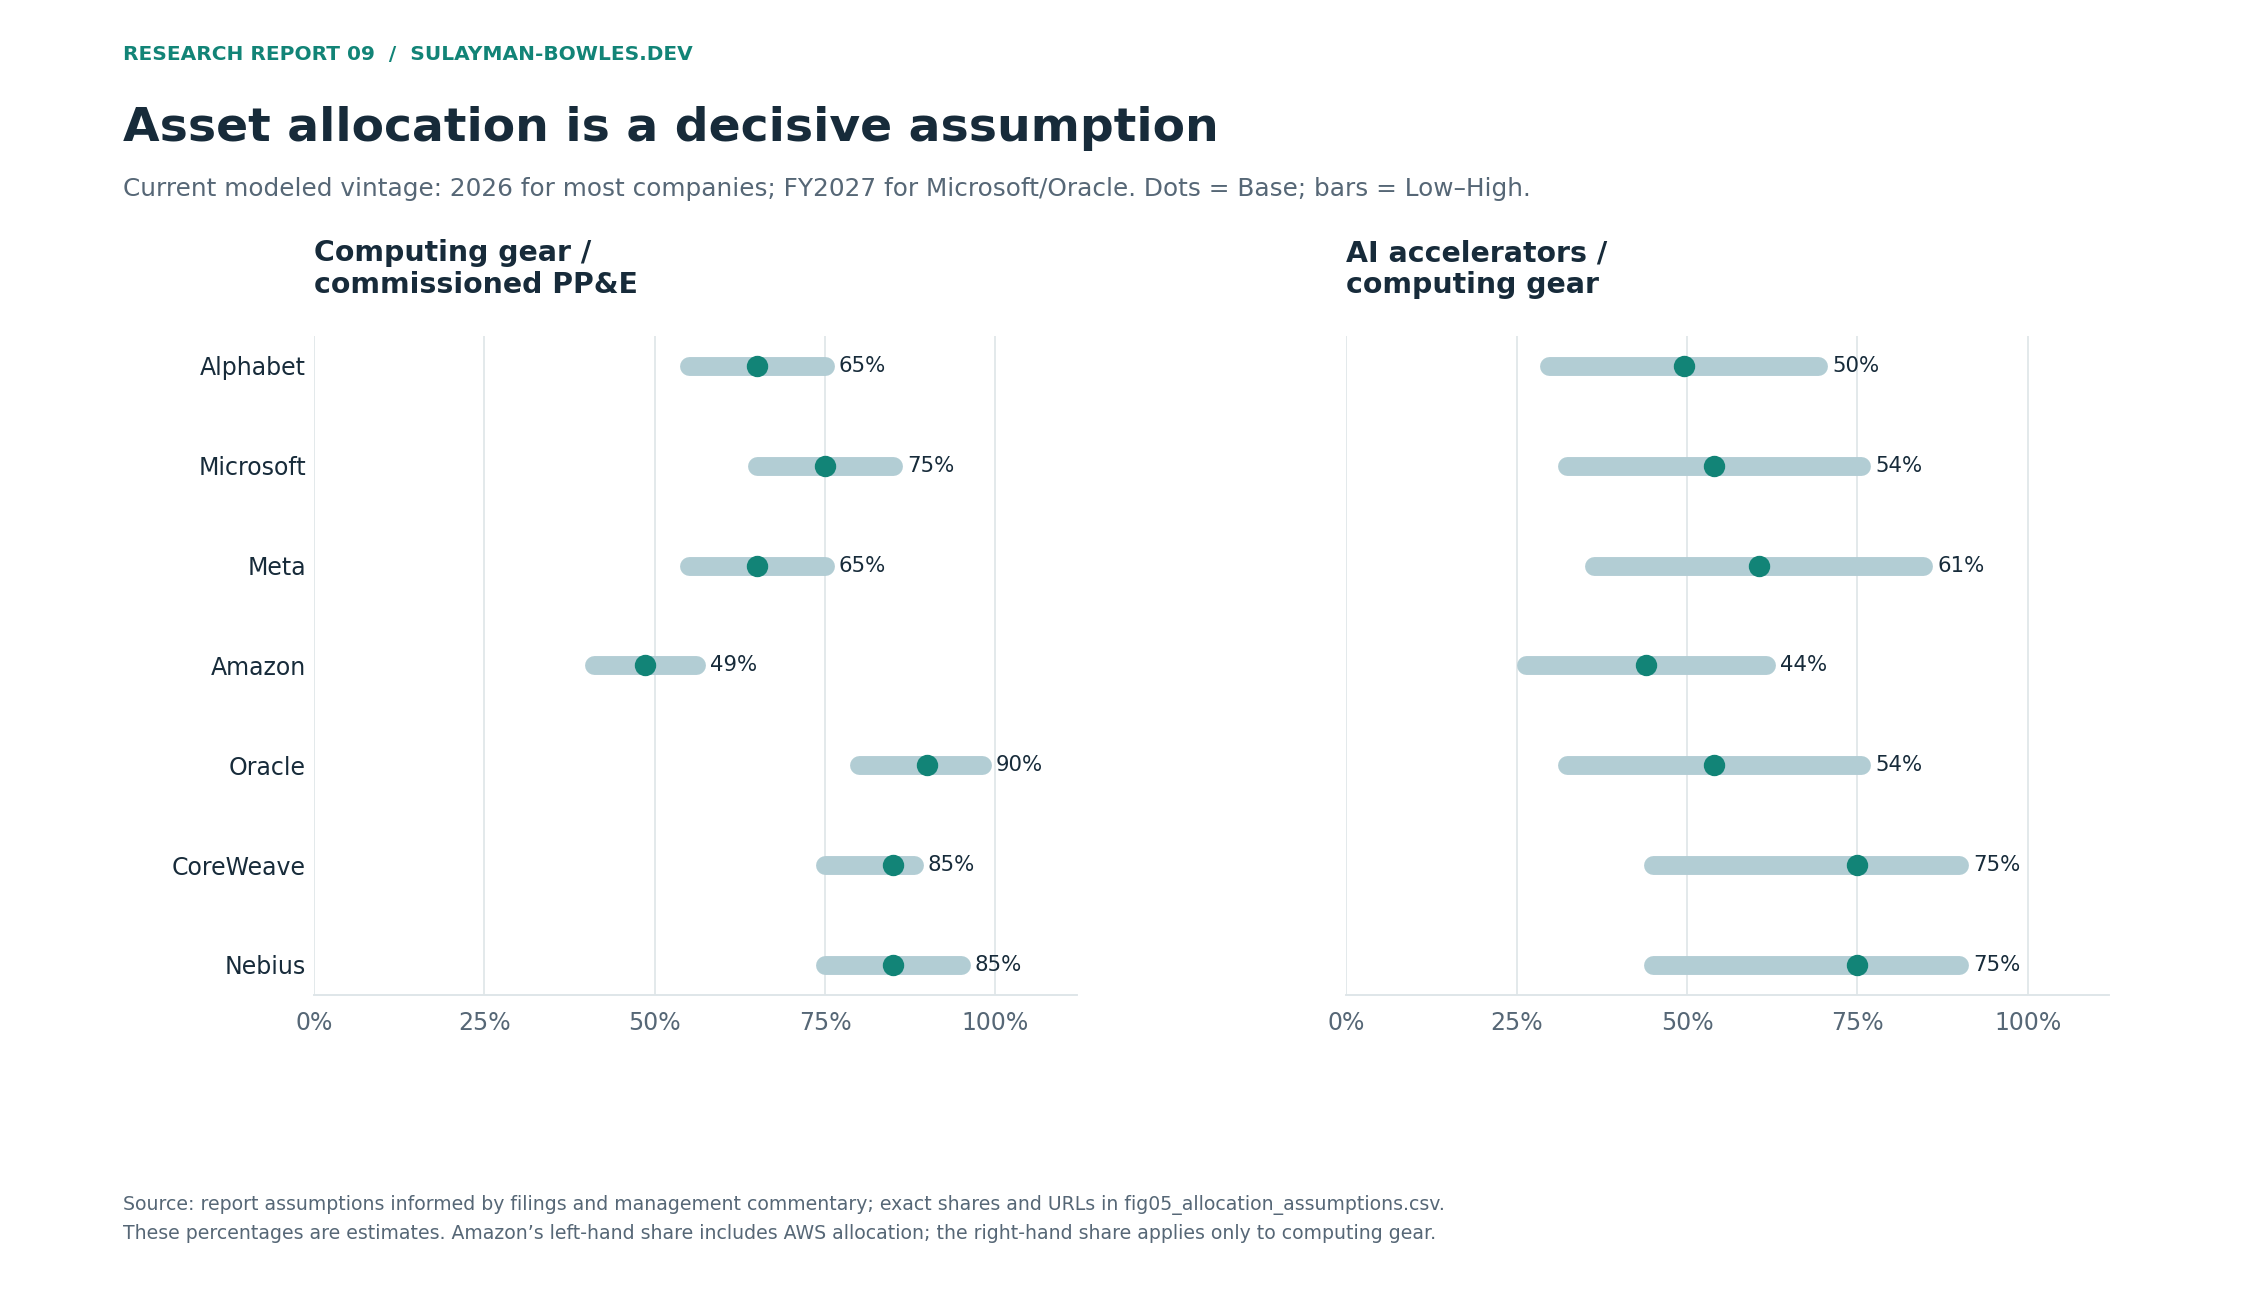
In the base case, current-vintage gear shares are 65% for Alphabet and Meta, 75% for Microsoft, 90% for Oracle, and 85% for CoreWeave and Nebius. Amazon’s 65% share applies to the AWS allocation of commissioned capital; after the AWS allocation, its current company-wide gear share is about 49%. Earlier vintages have lower assumed gear and AI shares. The base generic AI share rises from 5% of gear in 2020 to 55% in 2026 before company factors; the Low/High multipliers are 0.6/1.4, capped at 90%.
The strongest available calibration is Meta, which discloses depreciation on servers and network equipment. The base current model gives $18.83 billion, versus $18.36 billion disclosed, a 2.6% difference. That supports the order of magnitude while leaving room for different commissioning dates, retirements and class mixes. Early or aggressive cases can fail this check: the workbook flags small historical overages for Oracle and Nebius, and the larger IREN high-case overage. A sensitivity that exceeds total reported depreciation is not presented as a reconciled asset ledger.
4. Assets waiting to enter service are the next expense pipeline
Alphabet’s September 2026 assets not yet in service were $145.270 billion; Meta’s construction in progress was $89.499 billion. Together they were $234.769 billion, compared with $129.113 billion at December 2025. That increase is a balance-sheet observation. It does not require an assumption about GPU lives.2
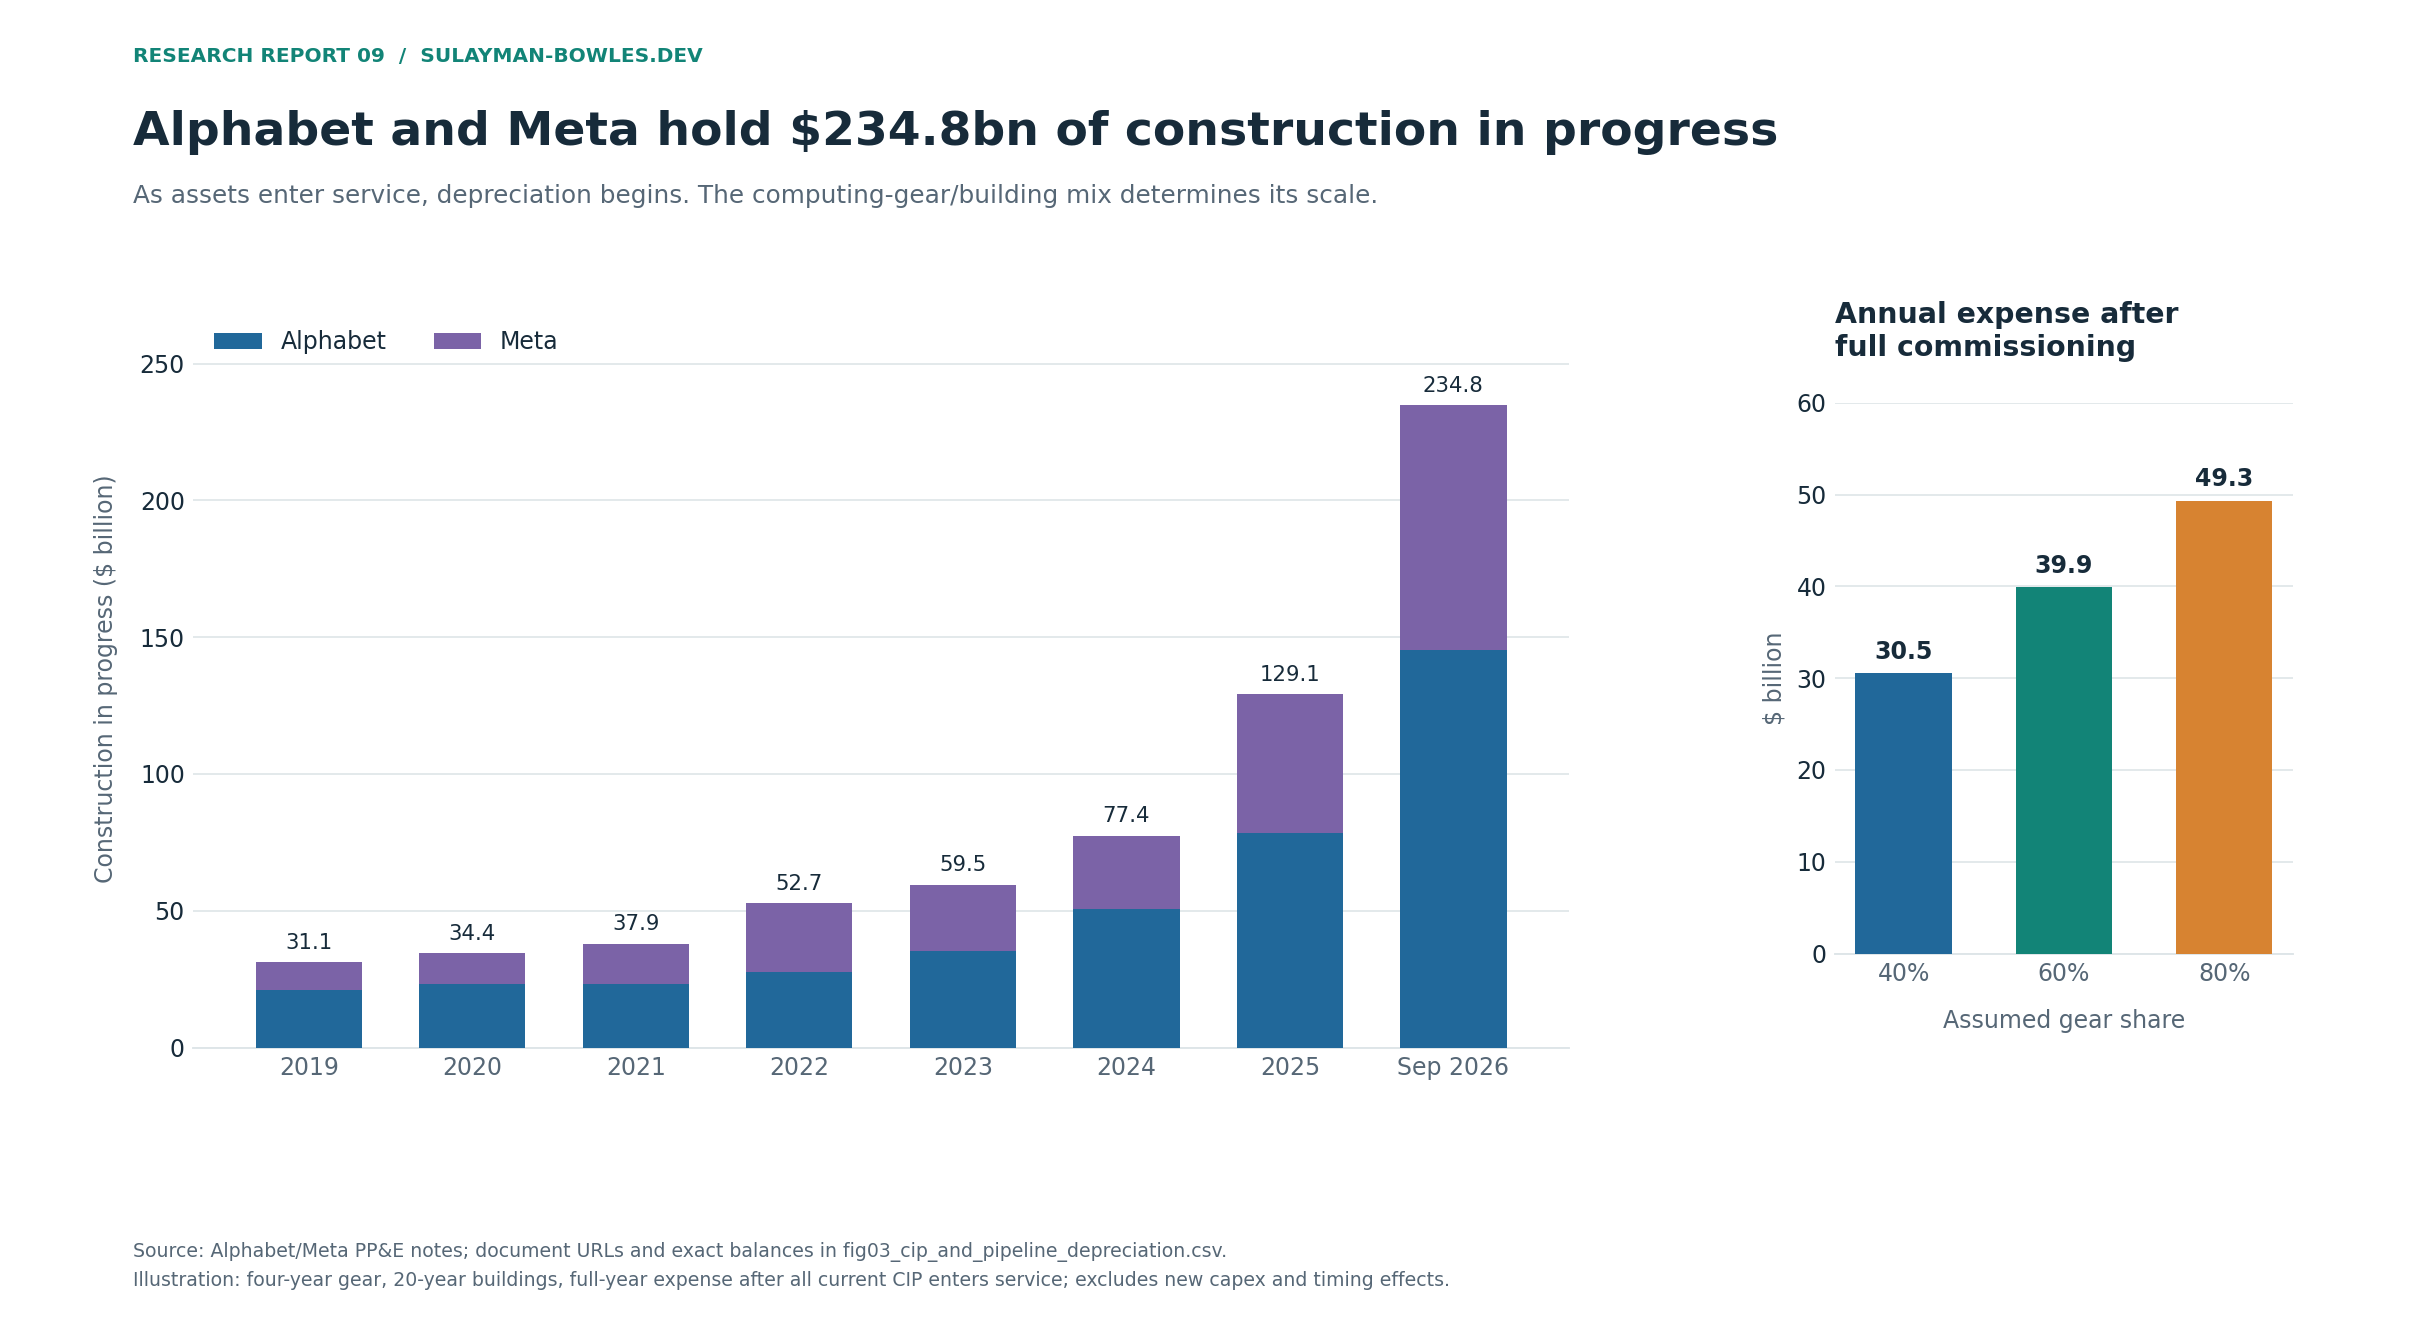
For the $234.769 billion pool, four-year gear and 20-year buildings imply the following conditional expense:
| Equipment / building split | Annual expense after full commissioning | Half-year first-service example |
|---|---|---|
| 40% / 60% | $30.5bn | $15.3bn |
| 60% / 40% | $39.9bn | $20.0bn |
| 80% / 20% | $49.3bn | $24.7bn |
Analytical scenarios. “First-year” assumes the entire pool commissions evenly through one year. Real projects may enter service over several years, include land, change scope or be abandoned. These figures are not added to the main forecast, which already accounts for CIP movements.
The split is powerful because $1 of four-year equipment generates five times the annual depreciation of $1 of a 20-year building. Calling all datacenter capex “chips” overstates the immediate expense; treating it all as long-lived real estate understates it.
The same distinction between an asset balance and a spending flow applies elsewhere. Oracle reported $48.5 billion of CIP at August 2026. CoreWeave reported about $9.3 billion at September. Nebius reported $7.8 billion at June, and IREN $4.6 billion at September. Their different reporting dates and classifications prevent a clean same-date industry total. Microsoft’s construction commitments are not an acceptable substitute for an undisclosed CIP asset balance.13, 16, 17, 10
Where interim CIP is reported, the base forecast continues its observed accumulation through the first forecast year. The high depreciation-sensitivity case holds the latest observed CIP flat, implying faster commissioning. Subsequent CIP is held at the prior ratio to the capital basis. Amazon’s interim CIP is unavailable: its annual CIP/capital ratio is modeled, then prorated to estimate current commissioning. The model makes no CIP adjustment for Microsoft; CoreWeave uses its commissioned-capital measure. New evidence on delivery and power-on dates could change the forward result substantially with existing accounting lives unchanged.
5. Forward depreciation rises even if existing accounting lives stay unchanged
The current guidance anchors use the companies’ own definitions and periods:
| Company | Verified primary guidance / statement | Model treatment |
|---|---|---|
| Alphabet | CY2026 capex $195–205bn; 2027 significantly higher, unquantified | $195/200/205bn cash in Low/Base/High |
| Meta | CY2026 $135–145bn, including finance-lease principal | Remove modeled principal; add new lease assets |
| Amazon | CY2026 net cash capex $220bn | Add noncash asset additions; keep net-basis consistency |
| Microsoft | CY2026 capex about $170bn; next fiscal quarter above $50bn; H2 acceleration | FY2027 cash $180/200/220bn plus $20bn finance assets: analyst cases |
| Oracle | Quarterly spending and equipment-heavy buildout verified; annual dollar range not primary-verified | FY2027 cash $90/100/110bn plus $6bn finance assets: analyst cases |
| CoreWeave | CY2026 commissioned-capex definition: $37–39bn | $37/38/39bn on the company definition |
| Nebius | Latest verified H1 cash spending and asset balances; no primary-verified annual dollar guide | CY2026 cash $20/22.5/25bn: analyst cases |
The Microsoft, Oracle and Nebius model ranges are analyst scenarios. An annual dollar range not verified in a free primary numerical source is not upgraded to “company guidance.” Later growth is also an assumption. Microsoft and Oracle fiscal years are not calendar years.17, 18, 19, 20, 21, 22
For most companies, subsequent cash spending grows 10%/20%/30% in Low/Base/High cases; Oracle uses 0%/10%/20%, and Nebius 15%/30%/45%. CoreWeave’s later commissioned-capital growth uses 10%/20%/30%. These assumptions are deliberately visible because a forward depreciation model without a spending path is incomplete. They are not predictions of management decisions.
The five-company forward comparison
| FY | Scenario | Book gear depreciation | Four-year expense | Four-year extra | AI3 expense | AI3 extra |
|---|---|---|---|---|---|---|
| 2027 | Low | 157.3 | 205.9 | 48.6 | 189.3 | 32.0 |
| 2027 | Base | 193.4 | 253.6 | 60.3 | 259.6 | 66.2 |
| 2027 | High | 234.7 | 309.0 | 74.3 | 349.1 | 114.4 |
| 2028 | Low | 236.0 | 313.3 | 77.3 | 286.9 | 51.0 |
| 2028 | Base | 298.9 | 398.7 | 99.7 | 409.3 | 110.4 |
| 2028 | High | 374.5 | 502.4 | 127.9 | 572.4 | 197.9 |
USD billions; equipment depreciation only. Each portfolio row sums the same numbered issuer fiscal years, so it is not a common calendar-year total. “Book” means the modeled equipment expense under the disclosed representative asset lives. AI3 changes only the estimated accelerator share.
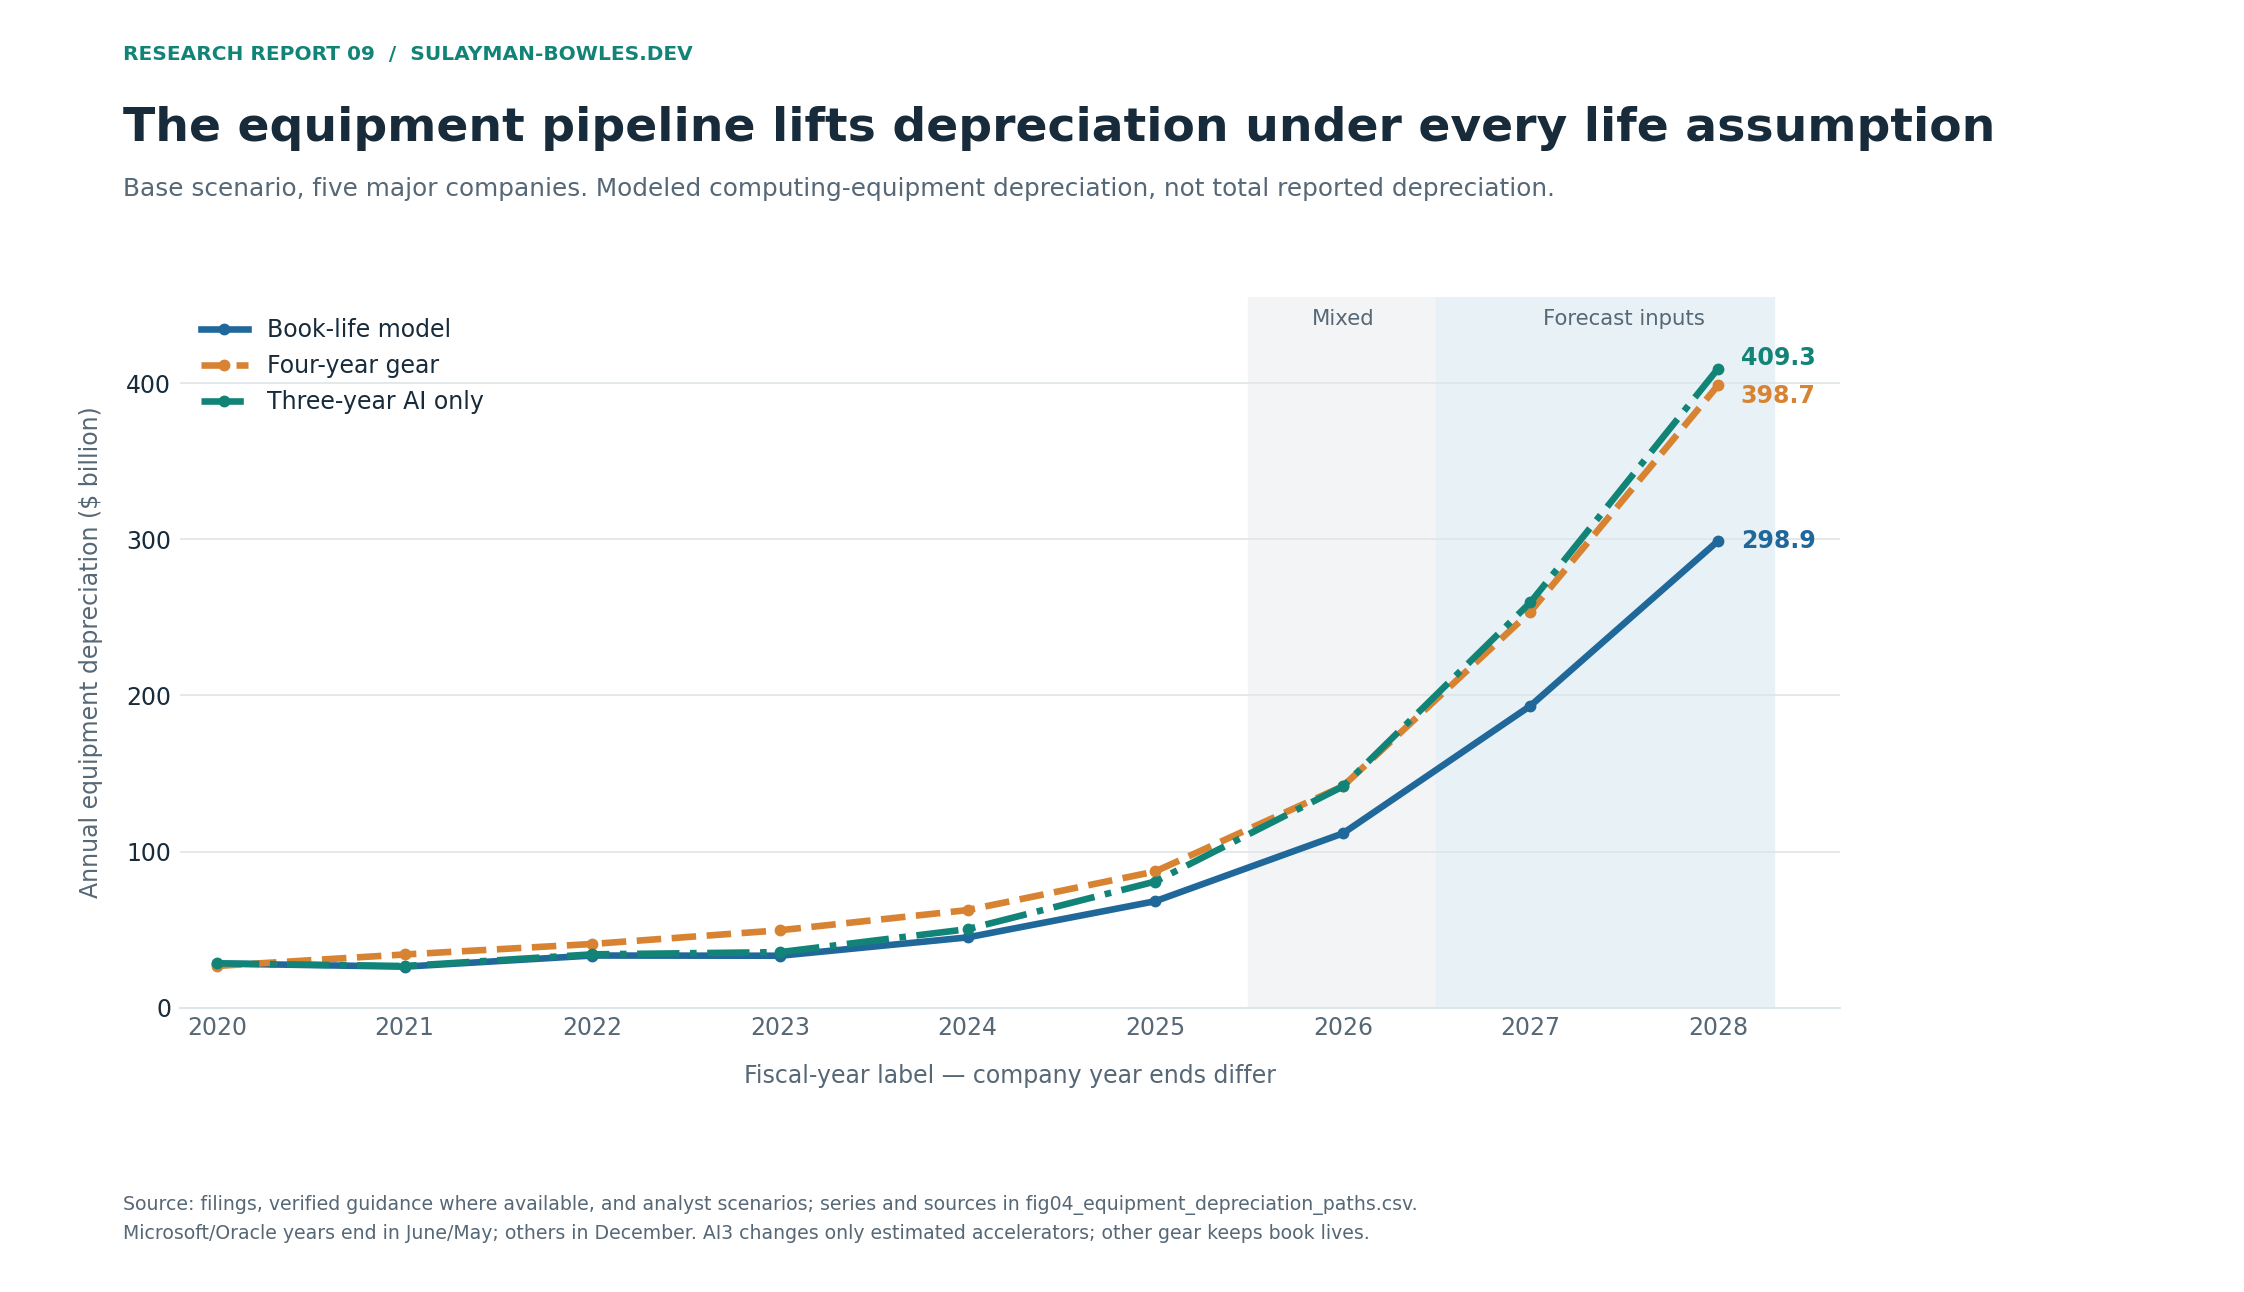
In the base case, modeled equipment depreciation under book lives reaches $193.4 billion in FY2027 and $298.9 billion in FY2028 across the five companies. Four-year equipment adds $60.3 billion and $99.7 billion, respectively. The AI-three-year scenario adds $66.2 billion and $110.4 billion. The AI scenario becomes more severe than the four-year scenario as higher assumed accelerator shares move through the fleet.
Those are substantial potential earnings charges, but an absolute EPS forecast would require projections for revenue, margin, interest, tax, buyback and issuance forecasts. This report does not invent those inputs. It supplies the depreciation-related EPS deduction, using the latest share counts and the same tax assumption:
| Company | FY2027 EPS deduction | FY2028 EPS deduction |
|---|---|---|
| Alphabet | 1.03 | 1.75 |
| Microsoft | 1.85 | 3.12 |
| Meta | 2.72 | 4.09 |
| Amazon | 0.89 | 1.36 |
| Oracle | 1.72 | 3.34 |
| CoreWeave | 11.00 | 15.73 |
| Nebius | 3.94 | 7.85 |
| IREN | 0.60 | 1.67 |
| WhiteFiber | 0.19 | 0.17 |
Base modeled EPS deductions under four-year gear; subtract from an independently developed earnings forecast. CoreWeave and Nebius use no assumed tax shield. IREN and WhiteFiber have supplementary forecasts driven by net movements in GPU assets.
The tax sensitivity is smaller than the equipment-allocation uncertainty. Applying 15%, 20% or 25% marginal tax benefits to the base current $30.0 billion depreciation increase gives net-income reductions of $25.5 billion, $24.0 billion and $22.5 billion. These are book-tax assumptions. The timing of tax deductions and cash taxes may differ from financial-statement depreciation.
Two other conventions matter. The model uses midpoint commissioning within each observed or forecast period; it does not assume January delivery for a full year’s purchases. And it does not use a fresh six-year life for an old asset after a change: revised remaining life is measured after deducting elapsed age. These choices account for both buying equipment and revising the estimate for equipment already owned.
6. What faster Nvidia releases mean for older GPUs
The economic concern is straightforward. New accelerators can perform more computing work per unit of power, rack space and operating cost. An older GPU can remain functional yet become less attractive in a power-constrained datacenter. A fleet earning healthy revenue today can still face lower future prices or utilization.
Nvidia’s January 2026 Rubin announcement describes an annual platform cadence and claims a large inference-cost improvement over Blackwell for specified workloads. That is relevant evidence of competitive pressure. The performance comparison comes from Nvidia and covers the specified workloads. The three-year stress test matters because it brings expense forward while the hardware and demand environment are changing; older chips can continue to serve workloads after three years.23
Older GPU offers are still visible
The following public on-demand prices were observed at the cutoff. They are quoted per GPU-hour, using the specified multi-GPU offering. CoreWeave values divide the full eight-GPU node price by eight. The associated CPU, memory, storage, region and service terms differ.
| GPU / provider | List price, $ per GPU-hour |
|---|---|
| V100 16 GB / Lambda | 0.79 |
| A100 40 GB / Lambda | 1.99 |
| A100 80 GB / Lambda | 3.19 |
| H100 80 GB / Lambda | 4.59 |
| B200 180 GB / Lambda | 7.69 |
| A100 / CoreWeave eight-GPU node ÷ 8 | 2.70 |
| H100 / CoreWeave eight-GPU node ÷ 8 | 6.16 |
| B200 / CoreWeave eight-GPU node ÷ 8 | 8.60 |
The comparison uses public prices for Lambda’s eight-GPU offerings and CoreWeave’s eight-GPU on-demand nodes in North America. The A100 memory configurations are not pooled as one product.24, 25
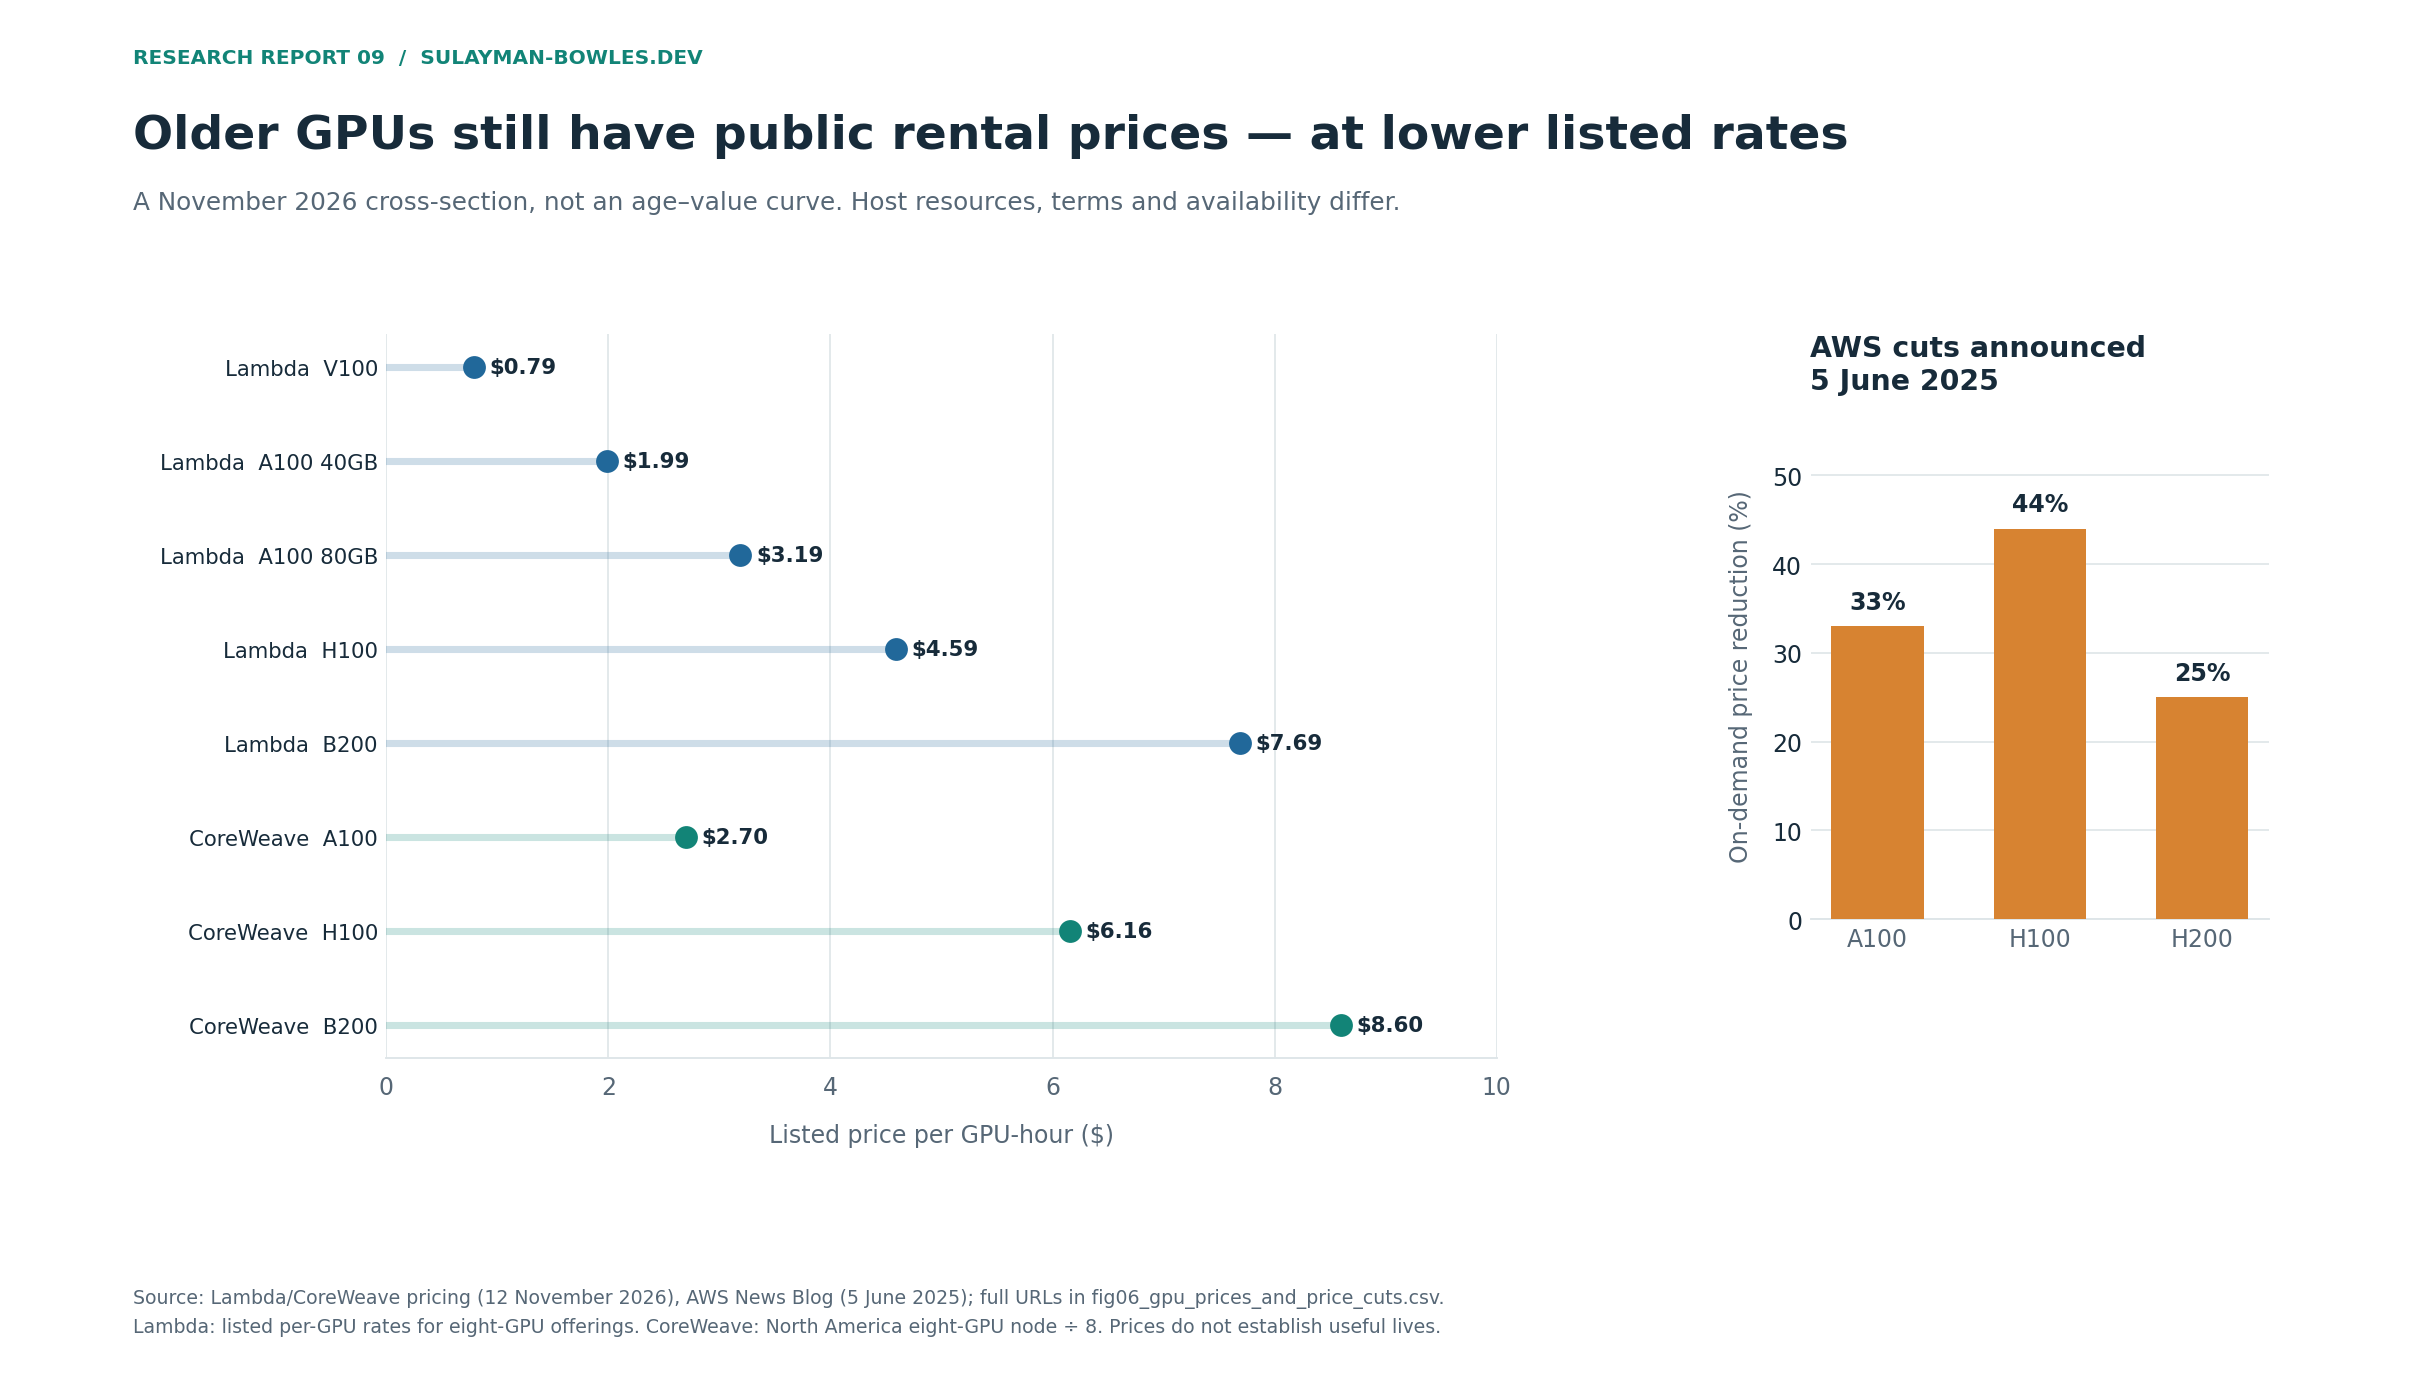
Nvidia introduced A100 in 2020 and V100 in 2017. Their continuing appearance in public rental menus in November 2026 shows that providers can still offer older architectures. The listings leave purchase dates, profitability and the share of the original fleet still in service unknown.26
The contrary evidence is also concrete. In June 2025, AWS announced on-demand price reductions of 33% for A100-based P4 instances, 44% for H100-based P5 and 25% for H200-based P5en. The “up to 45%” headline includes other pricing arrangements and should not be repeated as the on-demand cut for every GPU. Prices can fall substantially while the hardware remains rented.27
Management offers a further, qualified counterweight. Oracle’s October 2026 investor presentation said four-year-old GPU capacity had been renewed or sold at a premium. CoreWeave said in September that it was contracting new compute capacity at higher prices. The former is a company claim about a subset with limited disclosed economics; the latter concerns new capacity and does not independently prove the pricing of older GPU cohorts. Neither supplies the full utilization, operating-cost and renewal schedule needed to value an installed fleet.21, 28
Accounting life should reflect the expected service period of the asset, including feasible redeployment to less demanding workloads. Economic value also depends on price, power, cooling, network architecture, software compatibility, repair costs and contractual obligations. A profitable six-year use in one workload can coexist with a much shorter competitive life in another. The public evidence is too heterogeneous to turn Nvidia’s product-release interval into a universal depreciation schedule.
What would change the conclusion?
The conclusion would become stronger or weaker with specific, observable evidence:
- Cost and age by accelerator generation. A reconciliation from total capex to installed GPUs, CPUs, networking, buildings and CIP would replace the largest allocation assumptions. A materially smaller accelerator share would reduce the AI-three-year adjustment.
- Commissioning dates and retirement rolls. Later service dates would defer forward depreciation. Earlier retirements would reduce surviving asset balances and could create disposal or impairment charges. Complete PP&E movements would resolve the Microsoft residual.
- Realized economics for older cohorts. Renewal prices, utilization, power costs, maintenance and cash margins for comparable A100/H100 fleets would be much more informative than a current rental menu. Sustained profitable renewals would support longer economic use; persistent idle capacity or negative contribution margins would support shorter estimates.
- Further disclosed estimate changes. A quantified life revision, impairment or retirement program would replace an analytical scenario with an observed accounting event. Amazon’s 2025 shortening is an example of such evidence already incorporated here.
- Financing and lease detail. Equipment amortization, lease modifications, purchase options and the underlying gross financed hardware cost would make the ChronoScale comparison quantifiable and improve IREN’s split.
Adding the effects in the original filings yields $7.6 billion in operating income and $6.0 billion in net income. Rounded disclosed EPS effects multiplied by shares provide a cross-check. The $234.769 billion pipeline was checked both from the printed CIP balances and independent balance-sheet identities. The $23.983 billion modeled net-income reduction was reproduced by an independent calculation of depreciation by interval and by the workbook’s formula calculations. Numerical agreement verifies the calculation; it does not remove uncertainty about an undisclosed fleet.
Longer lives have clearly supported reported earnings, and the growing asset base makes the choice increasingly material. The base-case result is a roughly $24 billion after-tax sensitivity to four-year computing-equipment lives across the five large companies, with a wider range for AI-specific shortening. The larger forward question is how quickly the capital already committed and under construction becomes depreciating equipment—and how much revenue and cash that equipment earns over its service life.
Sources, scope and reproducibility
The information cutoff was November 12, 2026, at 07:00 UTC. Amounts are in US dollars. Modeled figures estimate how earnings would change under the stated assumptions.
The source package covers every available annual 10-K since FY2019 for Alphabet, Microsoft, Meta, Amazon and Oracle, supplemented by the latest published interim financial statements at the cutoff. Microsoft and Oracle already have FY2026 annual reports; the calendar-year companies’ latest completed annual reports are FY2025. CoreWeave’s pre-listing history comes from its registration filings; Nebius requires 20-F and interim releases, with continuing-company comparability beginning in 2023. Historical Yandex operations are not silently relabeled as a GPU cloud. IREN’s available annual filings and WhiteFiber’s predecessor/registration and annual filings have their own entries. ChronoScale/Applied Digital is discussed once because of consolidation and the stated data gap.
The workbook starts with the filing inputs and editable assumptions. It reconstructs equipment investment by cohort, calculates depreciation and estimates how alternate asset lives affect earnings. CSVs document the figures, units and source locations. The data distinguish estimates, rounding and residuals from disclosed values. The downloads include the chart inputs.
- Alphabet FY2023 10-K, filed 31 January 2024, Note 1 “Use of Estimates,” p. 56: primary source. Microsoft FY2023 annual report, filed 27 July 2023, Note 1 and MD&A “Change in Accounting Estimate”: primary source. Their fiscal year ends are December 31 and June 30, respectively. ↩
- Alphabet September 2026 10-Q, filed 29 October 2026, Note 7 PP&E table, pp. 27–28; “assets not yet in service” and technical-infrastructure composition: primary source. Meta September 2026 10-Q, filed 22 October 2026, Note 6 PP&E, p. 19, and cash-flow/earnings statements: primary source. Exact XBRL tags and balance identities are in the source and audit CSVs. ↩
- Alphabet FY2021 10-K, filed 2 February 2022, Note 1: primary source. Microsoft FY2021 annual report, filed 29 July 2021, Note 1 and MD&A: primary source. Alphabet’s historical $2.98 EPS effect is divided by its subsequent 20-for-1 split. ↩
- Amazon annual reports, Note 1 “Use of Estimates”: FY2020, filed 3 February 2021, primary source; FY2022, filed 3 February 2023, primary source; FY2024, filed 7 February 2025, primary source; FY2025, filed 6 February 2026, p. 41, primary source. FY2020 EPS is adjusted for the 20-for-1 split. ↩
- Meta/Facebook annual reports, Note 1 “Use of Estimates”: FY2021, filed 3 February 2022, primary source; FY2022, filed 2 February 2023, primary source; FY2025, filed 29 January 2026, p. 94, primary source. ↩
- Oracle FY2023 and FY2025 10-Ks, filed 20 June 2023 and 18 June 2025, Note 1 “Use of Estimates”; FY2025 pp. 69–70: primary source; primary source. ↩
- CoreWeave FY2025 10-K, filed 2 March 2026, Note 1 PP&E, pp. 91–92, useful-life change, financial statements and EPS note: primary source. Registration statement filed 3 March 2025, financial statements F-6/F-10 and PP&E F-29: primary source. Historical EPS/shares use the March 2025 20-for-1 split. ↩
- Nebius FY2025 20-F, filed 30 April 2026, MD&A p. 55 and Note 1: primary source. H1 2026 financial statements released 12 August 2026, Note 1 “Changes in Accounting Estimates,” F-10, and EPS note: primary source. Q3 2026 results were scheduled for later on 12 November, before U.S. market open, and were not yet available at the 07:00 UTC cutoff. The company’s 30 October scheduling notice is primary source. ↩
- WhiteFiber FY2025 10-K, filed 26 March 2026, Note 2 change in estimate and Note 7 PP&E: primary source. Earlier combined financial statements in the 11 July 2025 S-1: primary source. The annual totals omit the interim subsets, which appear in the workbook. ↩
- IREN FY2026 10-K, filed 27 August 2026, Note 2 F-18 and Note 14 F-33/F-34: primary source. September 2026 10-Q, filed 5 November 2026, operations p. 10, Note 11 PP&E p. 23, Note 17 leases pp. 30–31 and Note 22 EPS pp. 37–38: primary source. ↩
- ChronoScale FY2026 10-K, p. 7 and Note 15, financed equipment and useful-life discussion: primary source. Applied Digital August 2026 10-Q, MD&A and consolidation discussion: primary source. The scope audit records the unresolved predecessor/cohort data. ↩
- Microsoft FY2026 Q4 call, 29 July 2026, Amy Hood’s prepared remarks before the FY2027 outlook: primary source. ↩
- Microsoft FY2026 annual report, filed 29 July 2026, cash flows p. 53, Note 6 PP&E p. 69 and Note 13 leases p. 78: primary source. September 2026 10-Q, filed 28 October 2026, Note 6 and lease note: primary source. ↩
- Amazon FY2025 10-K, PP&E and segment notes, including net PP&E additions and AWS depreciation, pp. 47 and 70: primary source. September 2026 10-Q, filed 30 October 2026: primary source. ↩
- WhiteFiber September 2026 10-Q, filed 10 November 2026, cash flows p. 4 and Note 7 PP&E pp. 21–22, including equipment disposals: primary source. Its finance-lease reclassification concerns real estate and is excluded from GPU additions. ↩
- Oracle FY2026 10-K, filed 22 June 2026, Note 1 and PP&E disclosures: primary source; August 2026 10-Q, filed 11 September 2026, PP&E note: primary source. The complete annual class balances for all companies are in
ppe_classes.csv, with per-field URLs, dates, notes and classifications; balance totals and subsets are explicitly distinguished. ↩ - CoreWeave November 10, 2026, Q3 earnings presentation, slide 16 capital-expenditure reconciliation: primary source; Q4/FY2026 outlook presentation, slide 3: primary source. ↩
- Meta September 2026 10-Q, filed 22 October 2026, liquidity/outlook and cash-flow statements; $135–145 billion includes finance-lease principal: primary source. ↩
- Alphabet Q3 2026 earnings call, 28 October 2026, CFO prepared remarks on spending composition and 2026/2027 outlook: primary source. The current event page was captured at the report cutoff; the source record includes the observation date. ↩
- Microsoft FY2027 Q1 earnings call, 28 October 2026, Amy Hood’s capital-expenditure remarks: primary source. Its calendar-year $170 billion statement and Q2 figure are not a full fiscal-year cash-capex guide. ↩
- Oracle Investor Day CFO presentation, 28 October 2026, slides 14, 20 and 24, capital composition, older GPU economics and illustrative investment plan: primary source. Slide 24 illustrates funding and costs across several quarters. ↩
- Amazon September 2026 10-Q, liquidity and capital resources, $220 billion 2026 net-cash expenditure outlook: primary source. ↩
- Nvidia, “NVIDIA Rubin Platform…” announcement, 5 January 2026; annual cadence and workload-specific inference-cost claims: primary source. ↩
- Lambda public pricing, observed 12 November 2026, eight-GPU on-demand rows for V100, A100 40/80 GB, H100 and B200: primary source. The listed rates are offers and can change. ↩
- CoreWeave public pricing, observed 12 November 2026, North America eight-GPU on-demand A100/H100/B200 nodes: primary source. Full-node hourly prices $21.60/$49.24/$68.80 are divided by eight. ↩
- Nvidia A100 launch, 14 May 2020: primary source; V100 launch, 10 May 2017: primary source. ↩
- AWS News Blog, 5 June 2025, price-reduction table by instance type and pricing arrangement: primary source. ↩
- CoreWeave, 17 September 2026, company release on contracting new compute capacity at higher prices: primary source. The company’s management reports the prices. ↩
Supporting material
- Excel model ↗Sourced inputs, live calculations and reported outputs.
- Source and model data (CSV collection) ↗Data tables, source references and calculation exports.
- Source coverage ↗Download as CSV.