Financial systems
Oracle’s AI build-out through a lender’s eyes
Oracle can finance the base case on schedule. A one-year delay creates a modeled $21.2 billion borrowing need in fiscal 2028.
A lender’s credit memo for sulayman-bowles.dev Information cutoff: 12 November 2026. Financial statements through 31 August 2026. All dollar amounts are US dollars. “FY2027” ends on 31 May 2027. Forecasts and proposed lending terms reflect the analyst’s assumptions and judgment.
Oracle can finance the contracted build under a demanding combination of timely delivery, customer collections, vendor credit and equity support. It cannot presently demonstrate that this happens without damaging credit. Credit deterioration has already occurred: S&P’s rating moved to BBB−, and Oracle’s approximately five-year new-issue Treasury spread widened from 115 basis points in February to 275 in November. The completed November capital raise confirms continued market access. How much of the expansion operating cash can cover remains uncertain.ratings, pricing
The credit case turns on three numbers:
- About $86 billion of the latest $664 billion remaining performance obligations, or RPO, is expected to become revenue within twelve months. The rest requires a longer conversion period. The schedule measures expected revenue recognition. Customer payment dates remain undisclosed.
- About $278 billion is debt plus recognized and estimated unstarted leases, net of unrestricted cash and securities, at 31 August. This includes an estimated $146 billion present value for $288 billion of leases that had not commenced. The underwriting measure includes lease commitments.
- About $21 billion of additional borrowing is needed in the model’s twelve-month conversion delay, beyond announced financing, assumed vendor credit and refinancing of maturities. If a major customer also removes equipment and funding support, the requirement is larger.
In the base case, no further deficit borrowing is required. However, that case still draws $106.1 billion of new vendor credit over the forecast, receives $27 billion of additional customer advances, keeps the November financing and refinances every maturing note. Funded debt reaches $187.8 billion in FY2031. “No extra financing gap” therefore does not mean “no more debt.”
Recommendation: conditional approval for limited, staged exposure with contractual information rights and funding tests. I would decline a new five-year unsecured commitment at the last observed 275-basis-point issue spread on public disclosures alone. A proposed underwriting hurdle is Treasury plus 325–375 basis points, or a delayed-draw facility negotiated on its own terms at SOFR plus 350–425 basis points, subject to the structure below. These are proposed lending terms.
1. A large backlog supports demand, but duration governs repayment
The latest RPO disclosure divides recognition into approximately 13% within twelve months, 37% in months 13–36, 34% in months 37–60 and 16% thereafter. Multiplying the rounded $664 billion balance by 13% produces $86.32 billion; “about $86 billion” is the appropriate headline precision.q1
The lending decision turns on how much contracted work can be energized, accepted, billed and collected before its financing becomes burdensome. An RPO balance is not interchangeable with cash, trade receivables, a sovereign guarantee or a funded escrow. It provides evidence of contracted demand while leaving the lender exposed to performance, timing and counterparty risk.
Quarterly evidence
The following table keeps revenue duration beside the cash investment it is meant to support. Cash-flow quarters are derived from cumulative filings: second and third quarters are year-to-date differences; fourth quarters are full-year figures less the first nine months. Interest is expense, since comparable quarterly cash-interest disclosures were not available. The downloadable data include exact filing URLs, dates, tags and contexts.history
| Quarter | RPO | 12m share | Within 12m | Cash capex | CFO | FCF | Interest expense |
|---|---|---|---|---|---|---|---|
| FY2024 Q1 | 64.9 | 49% | 31.8 | 1.31 | 6.97 | 5.66 | 0.87 |
| FY2024 Q2 | 65.5 | 48% | 31.4 | 1.08 | 0.14 | -0.94 | 0.89 |
| FY2024 Q3 | 80.2 | 43% | 34.5 | 1.67 | 5.47 | 3.80 | 0.88 |
| FY2024 Q4 | 97.9 | 39% | 38.2 | 2.80 | 6.08 | 3.28 | 0.88 |
| FY2025 Q1 | 99.1 | 38% | 37.7 | 2.30 | 7.43 | 5.12 | 0.84 |
| FY2025 Q2 | 97.3 | 39% | 37.9 | 3.97 | 1.30 | -2.67 | 0.87 |
| FY2025 Q3 | 130.2 | 31% | 40.4 | 5.86 | 5.93 | 0.07 | 0.89 |
| FY2025 Q4 | 137.8 | 33% | 45.5 | 9.08 | 6.16 | -2.92 | 0.98 |
| FY2026 Q1 | 455.3 | 10% | 45.5 | 8.50 | 8.14 | -0.36 | 0.92 |
| FY2026 Q2 | 523.3 | 10% | 52.3 | 12.03 | 2.07 | -9.97 | 1.06 |
| FY2026 Q3 | 552.6 | 12% | 66.3 | 18.64 | 7.15 | -11.48 | 1.18 |
| FY2026 Q4 | 638.0 | 12% | 76.6 | 16.49 | 14.62 | -1.87 | 1.44 |
| FY2027 Q1 | 664.0 | 13% | 86.3 | 28.50 | 23.10 | -5.40 | 1.43 |
RPO and recognition percentages are rounded issuer disclosures. “Within 12m” is calculated. USD billions except percentages; cash capex is purchases of property, plant and equipment. Historical FCF equals CFO less cash capex.
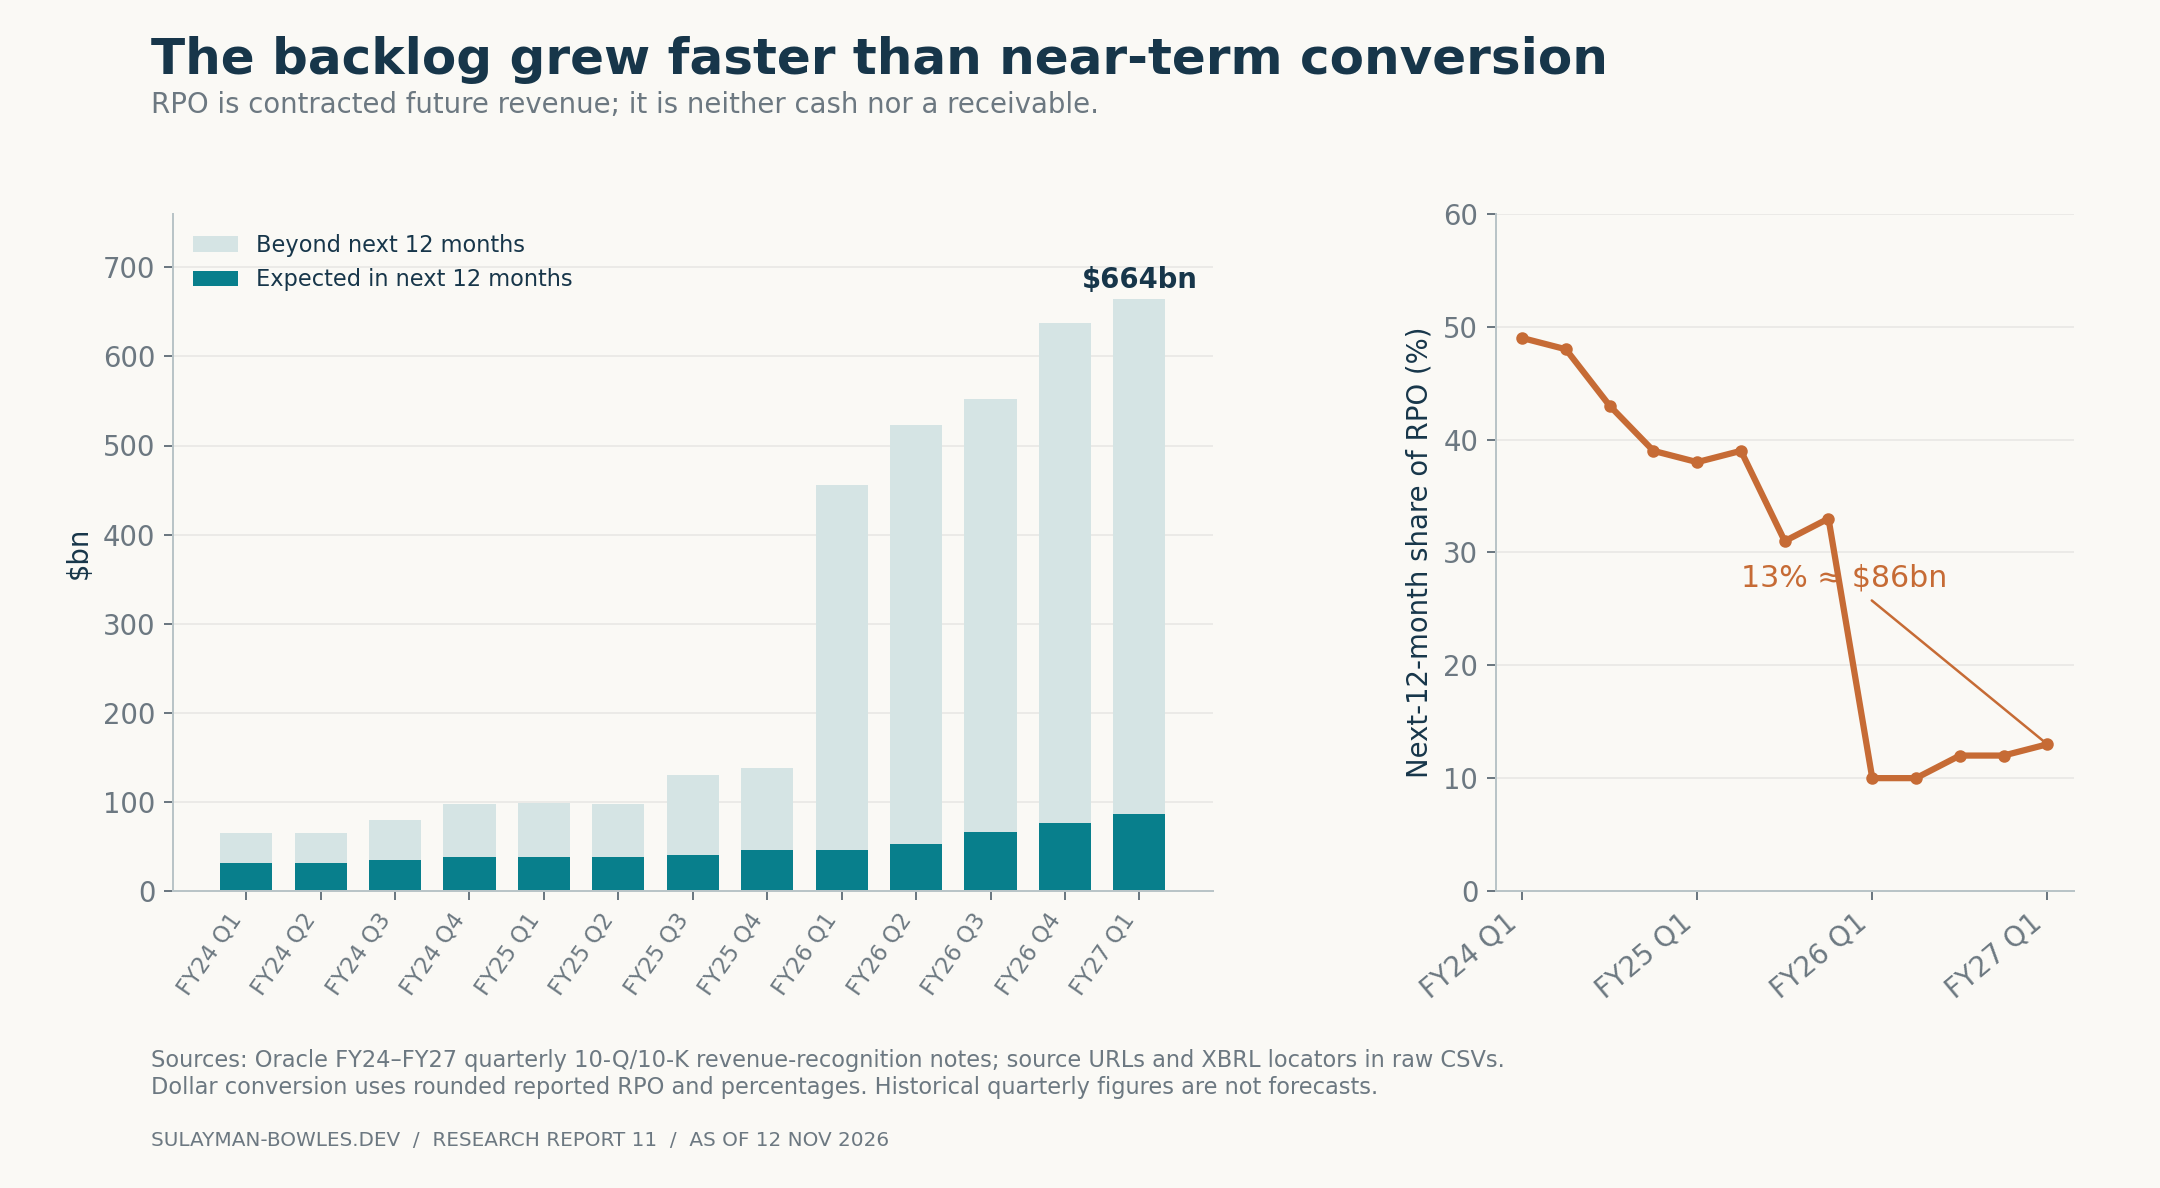
Figure 1. Sources: quarterly Oracle 10-Q/10-K revenue-recognition notes, FY2024–Q1 FY2027; calculations and individual source URLs in 01_rpo_conversion.csv and historical_sourced_inputs.csv.
The twelve-month dollar amount has grown materially even as the near-term percentage has fallen from the older software-heavy profile. The declining share measures the timing of revenue recognition. The rising total measures demand across the contract terms. Neither tells a lender when cash will arrive.
For lending purposes, I would underwrite the conversion of backlog to cash customer by customer. The schedules should show the responsible payer, acceptance requirements, minimum cash payments, termination provisions and remedies. Public aggregate RPO cannot supply those details. In particular, an apparently long revenue runway does not remove the need to fund the equipment installed before the first invoice.
2. Cash generation is real, but customer advances now finance a material part
The historical direction is unambiguous. Annual cash capex overtook operating cash flow in FY2025 and substantially exceeded it in FY2026. The trailing period through August 2026 intensifies that pattern.
| Period | CFO | Cash capex | FCF | Interest expense | Cash interest |
|---|---|---|---|---|---|
| FY2024 | 18.673 | 6.866 | 11.807 | 3.514 | 3.655 |
| FY2025 | 20.821 | 21.215 | -0.394 | 3.578 | 3.374 |
| FY2026 | 31.977 | 55.663 | -23.686 | 4.599 | 3.896 |
| TTM to Aug 2026 | 46.940 | 75.660 | -28.720 | 5.104 | UNKNOWN |
USD billions. TTM is FY2026 plus Q1 FY2027 less Q1 FY2026; it overlaps FY2026. Annual cash interest is reported net of capitalized amounts where specified. TTM cash interest remains UNKNOWN.annual
The latest quarter’s $23.103 billion CFO included $11.363 billion of customer prepayments with significant financing components. Removing those receipts leaves $11.740 billion. The same diagnostic over the trailing year reduces CFO from $46.940 billion to $30.985 billion, and FCF from negative $28.720 billion to negative $44.675 billion.prepay
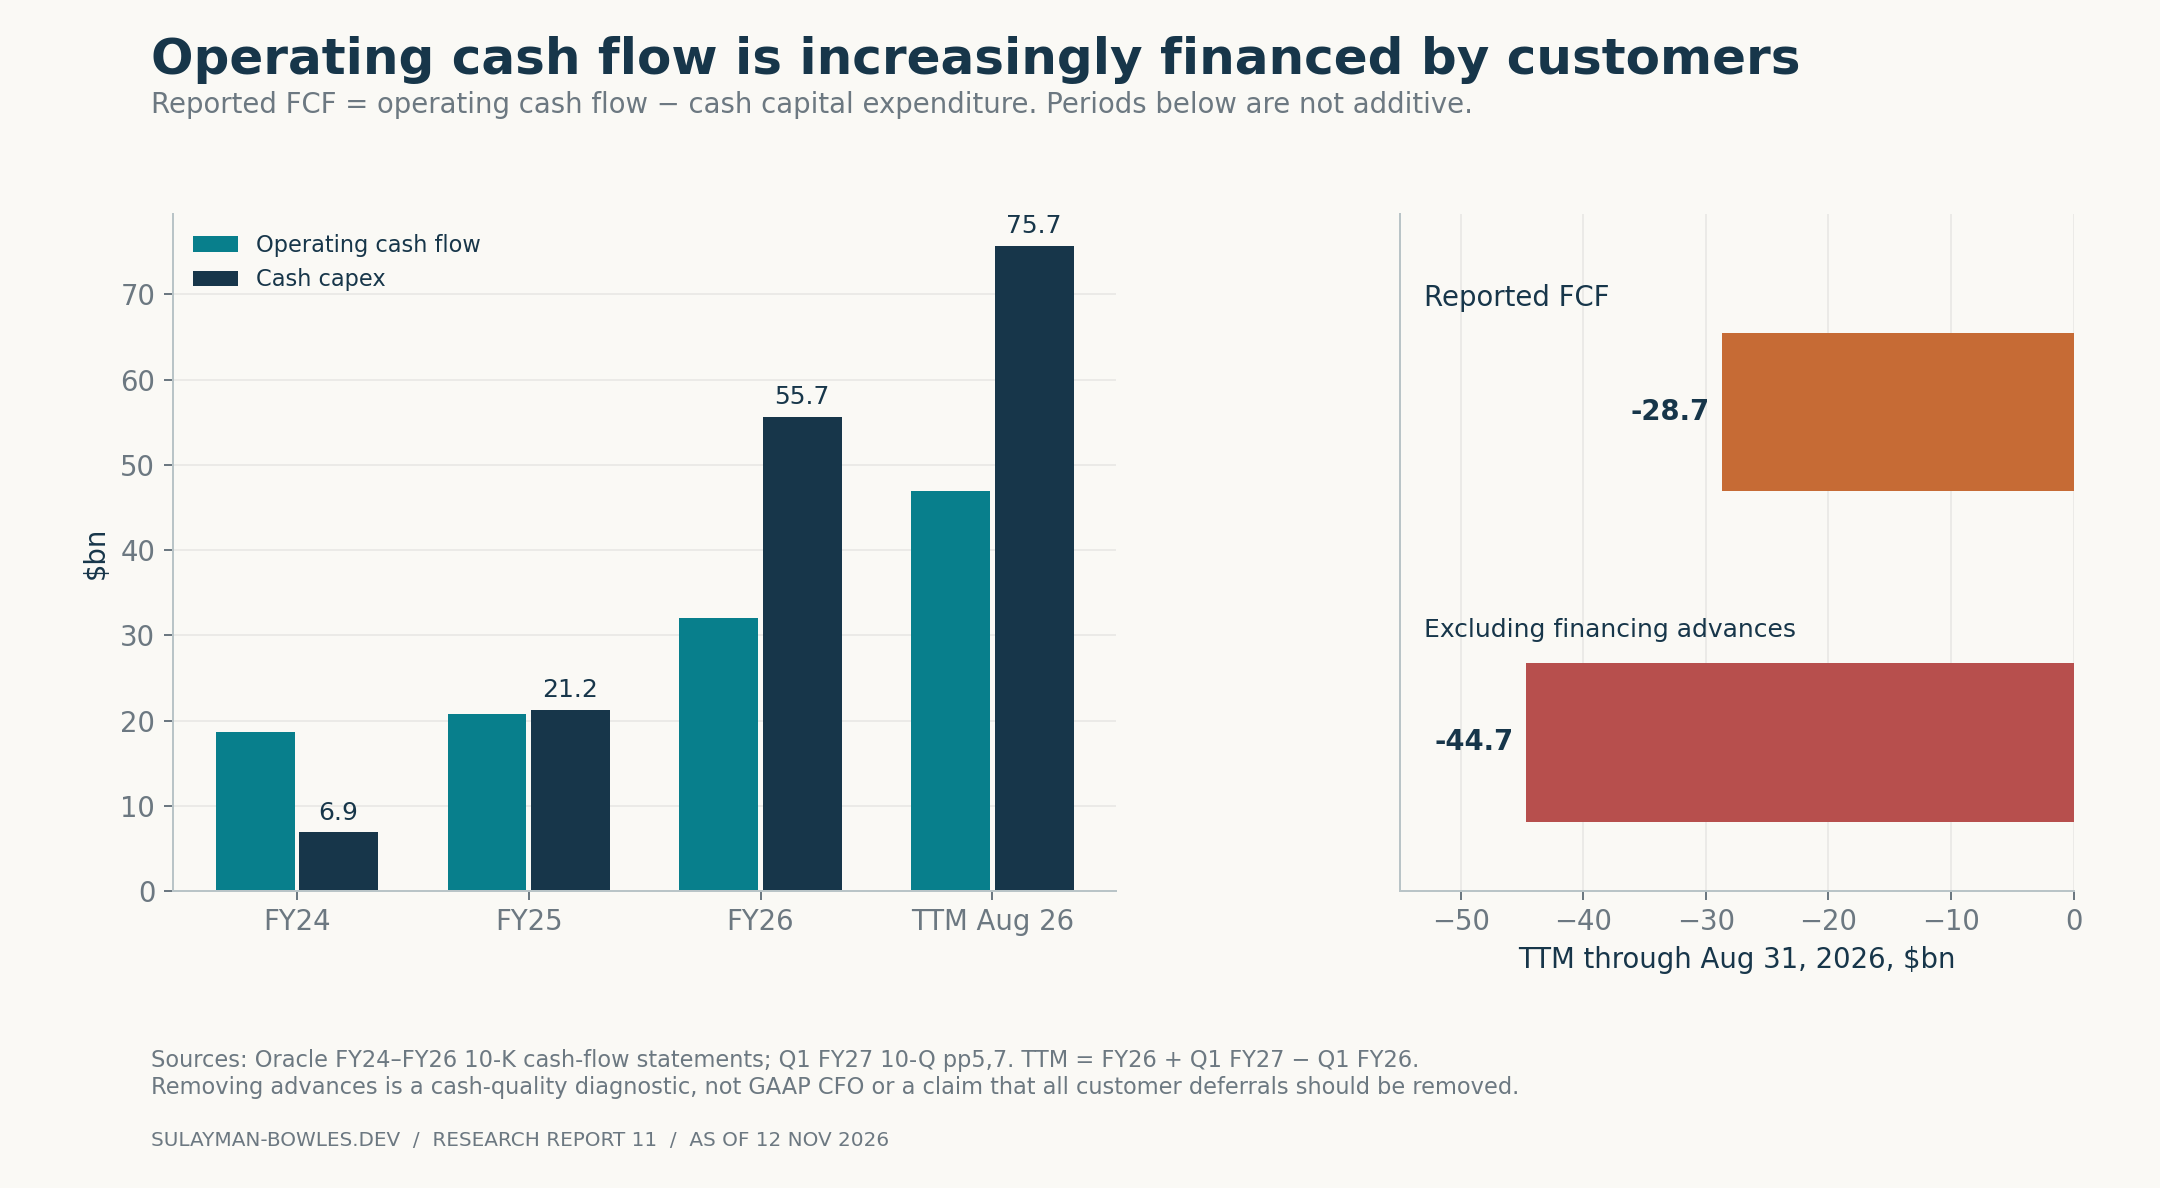
Figure 2. Sources: Oracle annual cash-flow statements and Q1 FY2027 10-Q, pp. 5 and 7. The cash-quality calculation deducts financing advances from reported cash from operations.
Advance funding can improve a lender’s position: a customer contributes money before Oracle spends or delivers. Its weakness is that the service must subsequently be provided without collecting that portion of the invoice again. The model adds new cash advances and deducts the delivery of previously prepaid services. Counting the advance as cash today and the associated revenue as fresh cash later would exaggerate repayment capacity.
Oracle’s Q1 “net cash outlay” capex measure was $17.966 billion. That reconciliation starts with $28.499 billion of cash capex, incorporates a negative $0.830 billion financing flow, and deducts $11.363 billion of customer advances. It should not then be deducted from CFO that already includes those advances. That would count the same funding benefit twice.release
The forecast also distinguishes equipment bought with vendor credit from equipment paid for immediately. Vendor credit reduces the immediate cash purchase, while creating principal and interest obligations. The memo therefore reports both cash surplus before equipment principal and cash remaining after vendor and finance-lease principal. Neither label should be casually substituted for historical reported FCF.
The practical test is recurring cash after delivering prepaid work, paying interest and maintaining productive capacity. Large quarterly CFO is helpful evidence, but the financing component must be visible to the committee.
3. Unstarted leases belong in the underwriting perimeter
At August, reported financial debt was $125.337 billion. Operating and finance lease liabilities were $34.621 billion and $9.185 billion. Unrestricted cash plus marketable securities was $37.077 billion. The $2.565 billion restricted cash balance is excluded from usable liquidity.balance
Oracle also disclosed $288 billion of additional lease commitments not yet commenced, expected to begin between Q2 FY2027 and FY2029, generally with terms of 15–19 years. Those commitments rose from $260 billion at May. Adding their full nominal value to reported debt would mix discounted and undiscounted amounts. Ignoring them would omit a major fixed obligation.leases
The central estimate assumes seventeen years of level payments, a 7.5% discount rate and commencement weights of 25%, 50% and 25%, at 0.375, 1.25 and 2.25 years after August. It gives:
PV_(future leases)=(288) / (17) × (1-(1.075)^(-17)) / (0.075) × ((0.25) / (1.075^(0.375))+ (0.50) / (1.075^(1.25))+ (0.25) / (1.075^(2.25))) =$145.846bn.
The resulting net measure is $125.337 + $43.806 + $145.846 − $37.077 = $277.912 billion. The term/rate sensitivity spans approximately $122–173 billion for the additional lease PV. A higher discount rate lowers this accounting-style estimate; it does not reduce promised rent.
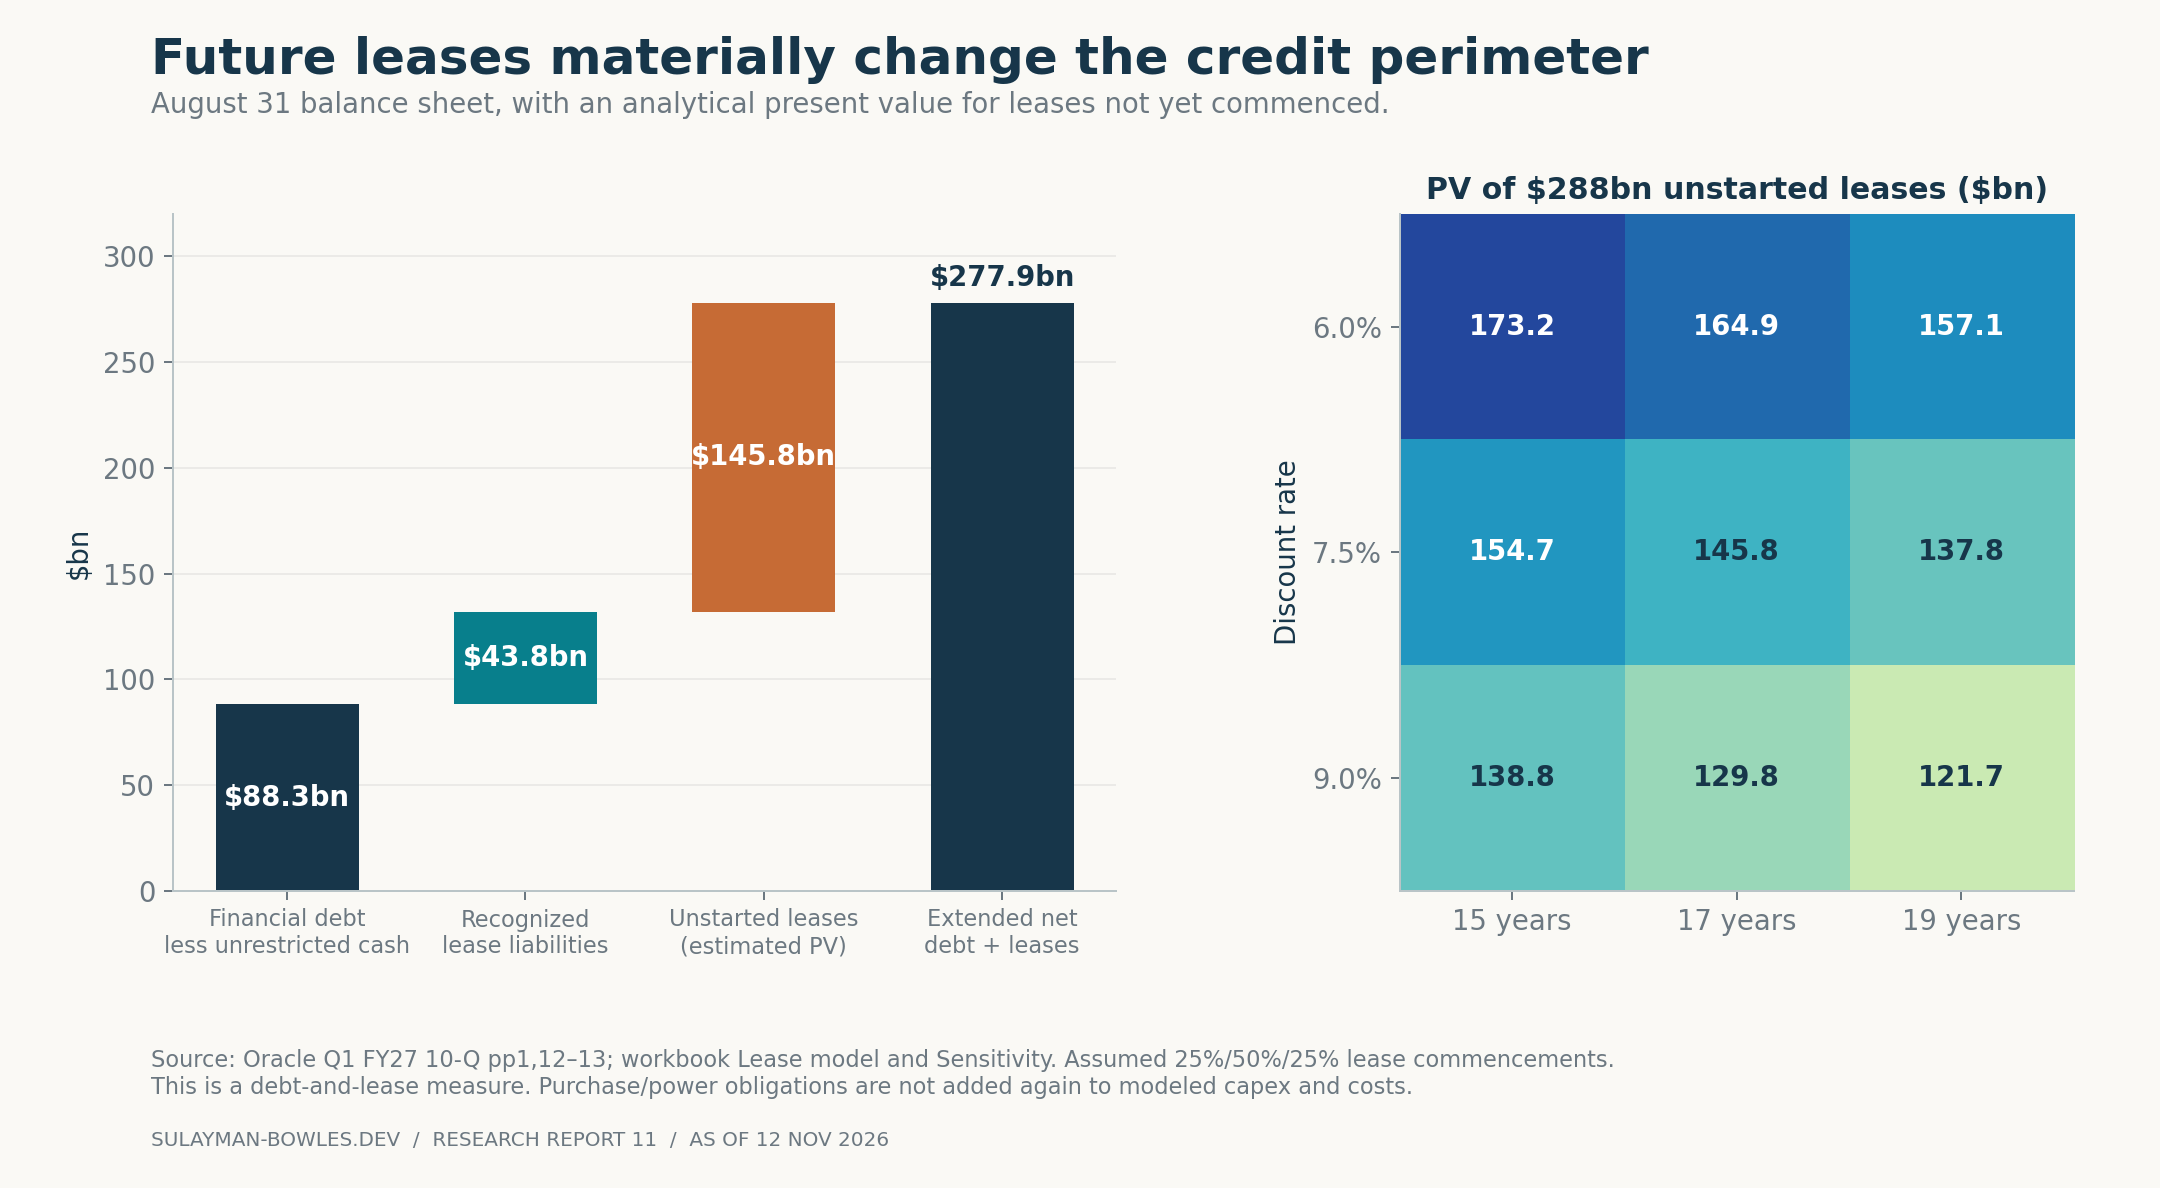
Figure 3. Reported components: Q1 FY2027 10-Q, balance sheet and lease note. Future lease PV, start allocations and sensitivity are analyst estimates from the workbook’s Lease model and Sensitivity sheets.
On trailing earnings, that exposure is 7.46 times GAAP-based EBITDAR, or 6.38 times after adding back stock compensation and restructuring. Historical EBITDAR here means reported operating income plus depreciation, intangible amortization and operating lease expense. Neither ratio is Oracle’s or a rating agency’s official leverage measure.
This adjustment reveals a duration mismatch: the illustrative AI contract lasts five years, the model uses a six-year life for servers and networking equipment, and building commitments can last fifteen to nineteen years. Contract renewals, replacement customers and continued equipment investment must bridge the difference. A profitable first contract alone cannot extinguish the lease tail.
The debt plus leases measure covers those two liability categories. Purchase and power commitments of $34.150 billion are already included in modeled capex and operating costs. A previously disclosed contingent guarantee of up to $3.3 billion related to lessor borrowings due in September requires explicit confirmation of release; omission from the later note is insufficient evidence that the exposure disappeared.commitments
4. Good unit economics depend on who funds and owns the equipment
Oracle’s October investor-day illustration describes a one-gigawatt AI project with $37 billion of hardware investment, $16 billion annual revenue when fully ramped, an average five-year contract, 35% non-GAAP gross margin and 34% operating margin. The footnotes identify cost-plus arrangements whose costs and contract values can change. Land and buildings are not purchased in this hardware illustration.economics
The presentation offers three funding approaches:
| Structure | Initial two-year cash outlay | Fully ramped annual revenue | Lender interpretation |
|---|---|---|---|
| Oracle funds hardware | $37bn | $16bn | Oracle pays for and bears the equipment exposure |
| Vendor finances 70% of hardware | $18bn, including early principal payments | $16bn | Payment timing changes; total equipment cost does not become $18bn |
| Customer brings GPUs; Oracle supplies networking | $6bn | $11bn | Less Oracle capex and revenue; customer GPUs are not Oracle collateral |
Self-funded hardware consumes 46.25 cents per dollar of five-year contract revenue: $37 billion divided by $80 billion. Assuming five fully ramped revenue years, customer-provided GPUs give an illustrative ratio of 10.91 cents, using $6 billion divided by $55 billion. The calculation uses annualized revenue to estimate the $55 billion denominator. BYOH remaining performance obligations are undisclosed. The ratios compare equipment costs with contract revenue.
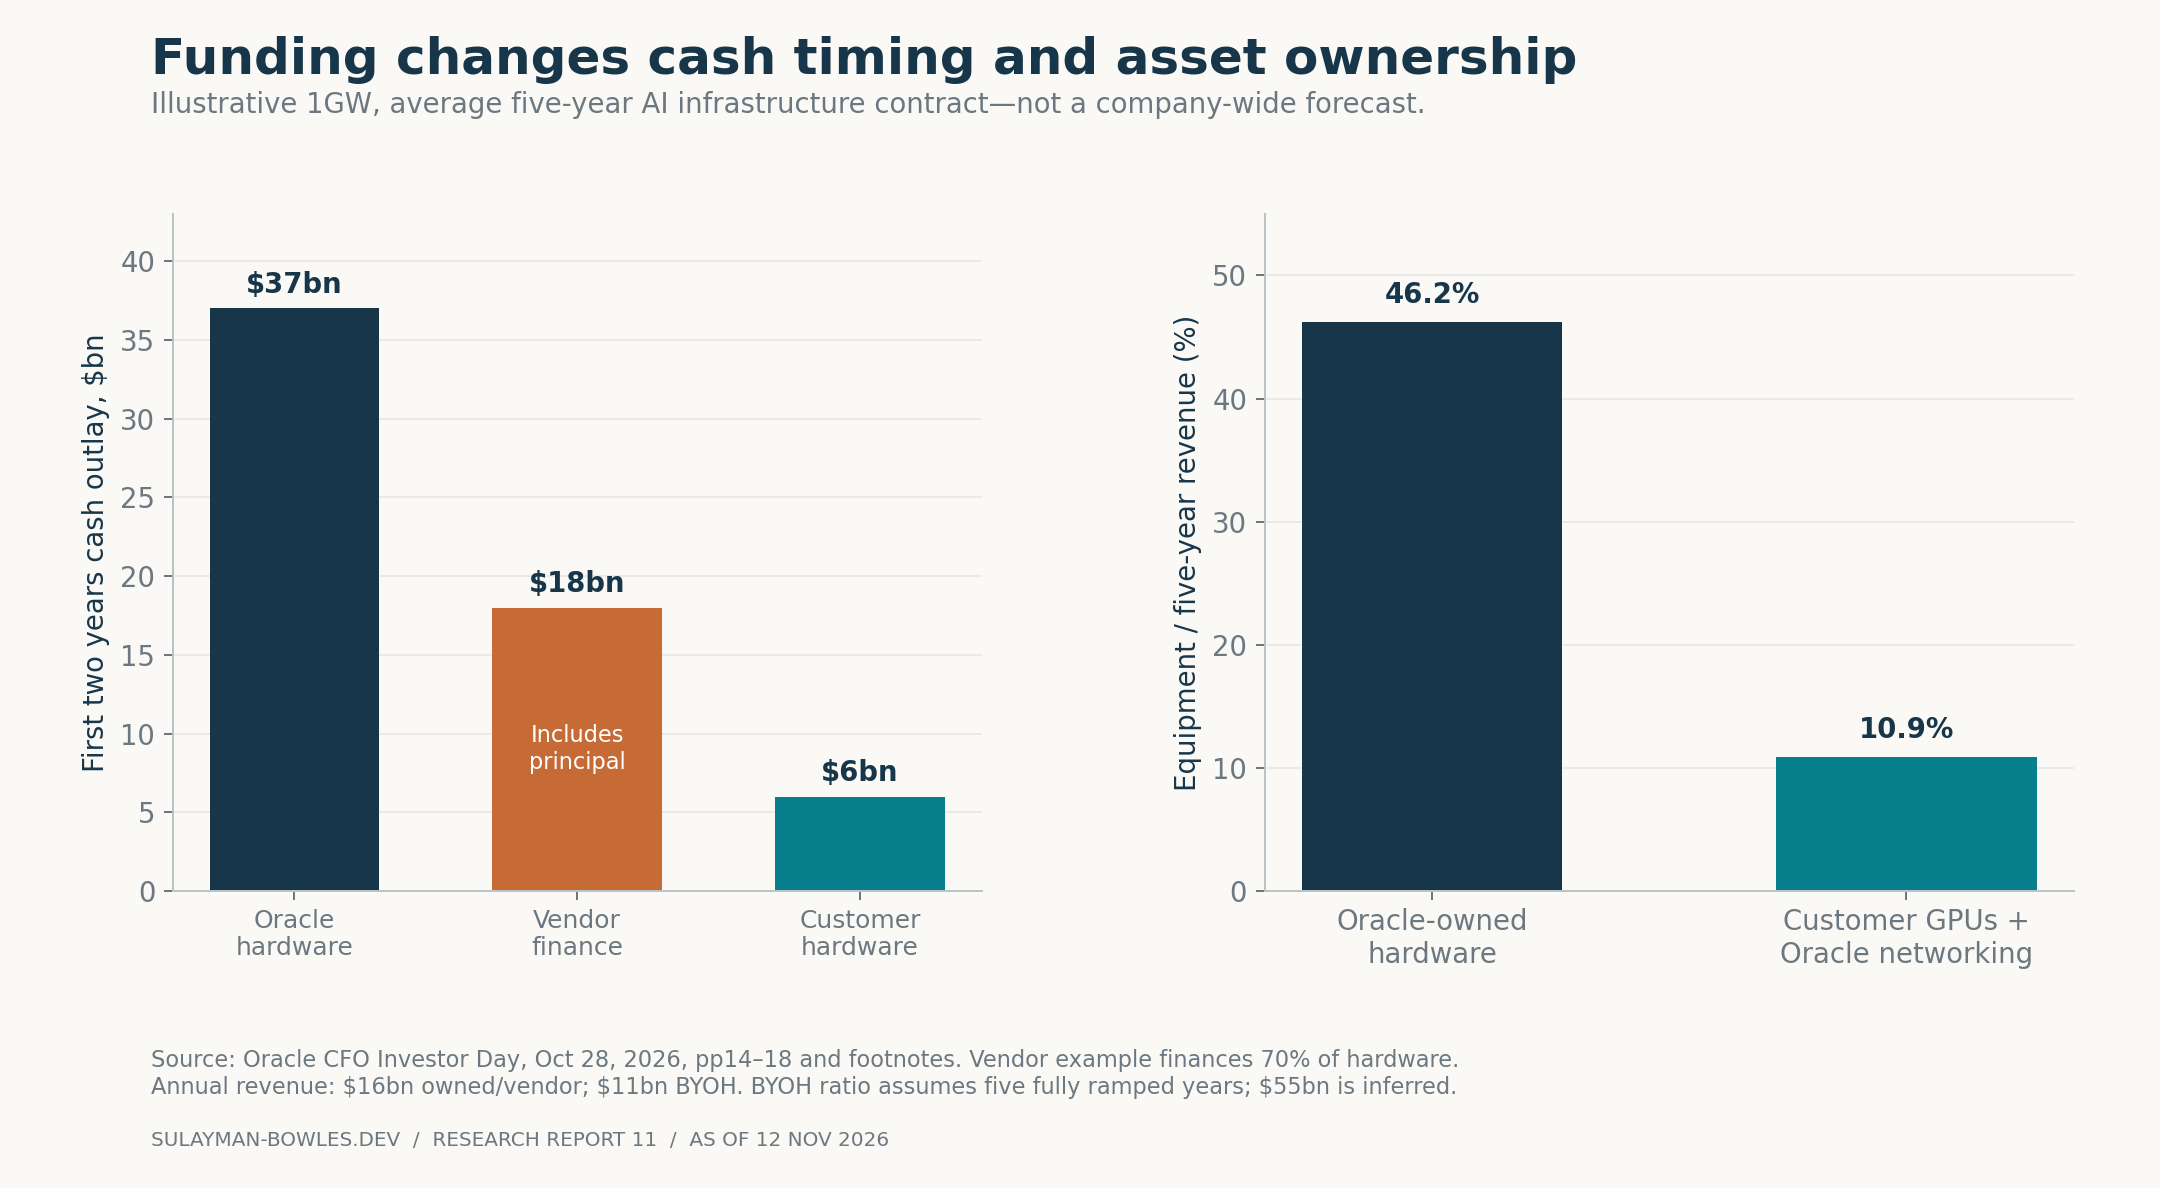
Figure 4. Source: CFO presentation, 28 October 2026, pp. 14–18, including footnotes. Vendor cash outlay includes principal; the other columns have different asset ownership and revenue economics.
The strongest public evidence on AI margins is management’s 32% gross margin on capacity delivered in Q3 FY2026. The figure covers the capacity delivered in that quarter. The 35% figure is an illustrative fully ramped target. The model uses AI gross margins of 30%, 32%, 35%, 35% and 35%, and deducts one percentage point for direct overhead to produce an operating-margin assumption.actualmargin
The presentation’s 28% “ROI” also needs translation. Its footnote uses annual net operating profit after tax plus depreciation, divided by cumulative capex. That includes a return of invested capital and is not a project IRR. A lender should underwrite the cash timing, reinvestment and obligations directly.
There is a credible conversion mechanism, but the funding mix is decisive. Oracle illustrates roughly $220 billion of equivalent hardware investment for the remaining approximately six gigawatts through FY2028, with about a 50% reduction in upfront cash requirements from vendor financing, customer hardware and advances. The exact mix, loan rates, amortization and customer protections are not publicly supplied.build
5. The coupon ladder is manageable only with continued refinancing access
The reconstructed ladder contains 60 outstanding note series after the November transaction: $129.5 billion fixed-rate principal and $1 billion floating-rate principal. Fixed annual coupons total $6.521 billion, a 5.035% weighted coupon. The run rate uses current coupon terms. Refinancing and maturities can change cash interest.
Each series in the supplied ladder identifies CUSIP, original prospectus URL, issue date, maturity, coupon or floating spread, balance reconciliation and source locator. The associated fixed-coupon calendar runs through 2066. The July 2026 maturity appears in the reconciliation with zero current balance.ladder
| Fiscal year | Notes requiring refinancing, $bn |
|---|---|
| Remaining FY2027 | 2.25 |
| FY2028 | 5.50 |
| FY2029 | 5.50 |
| FY2030 | 9.25 |
| FY2031 | 9.75 |
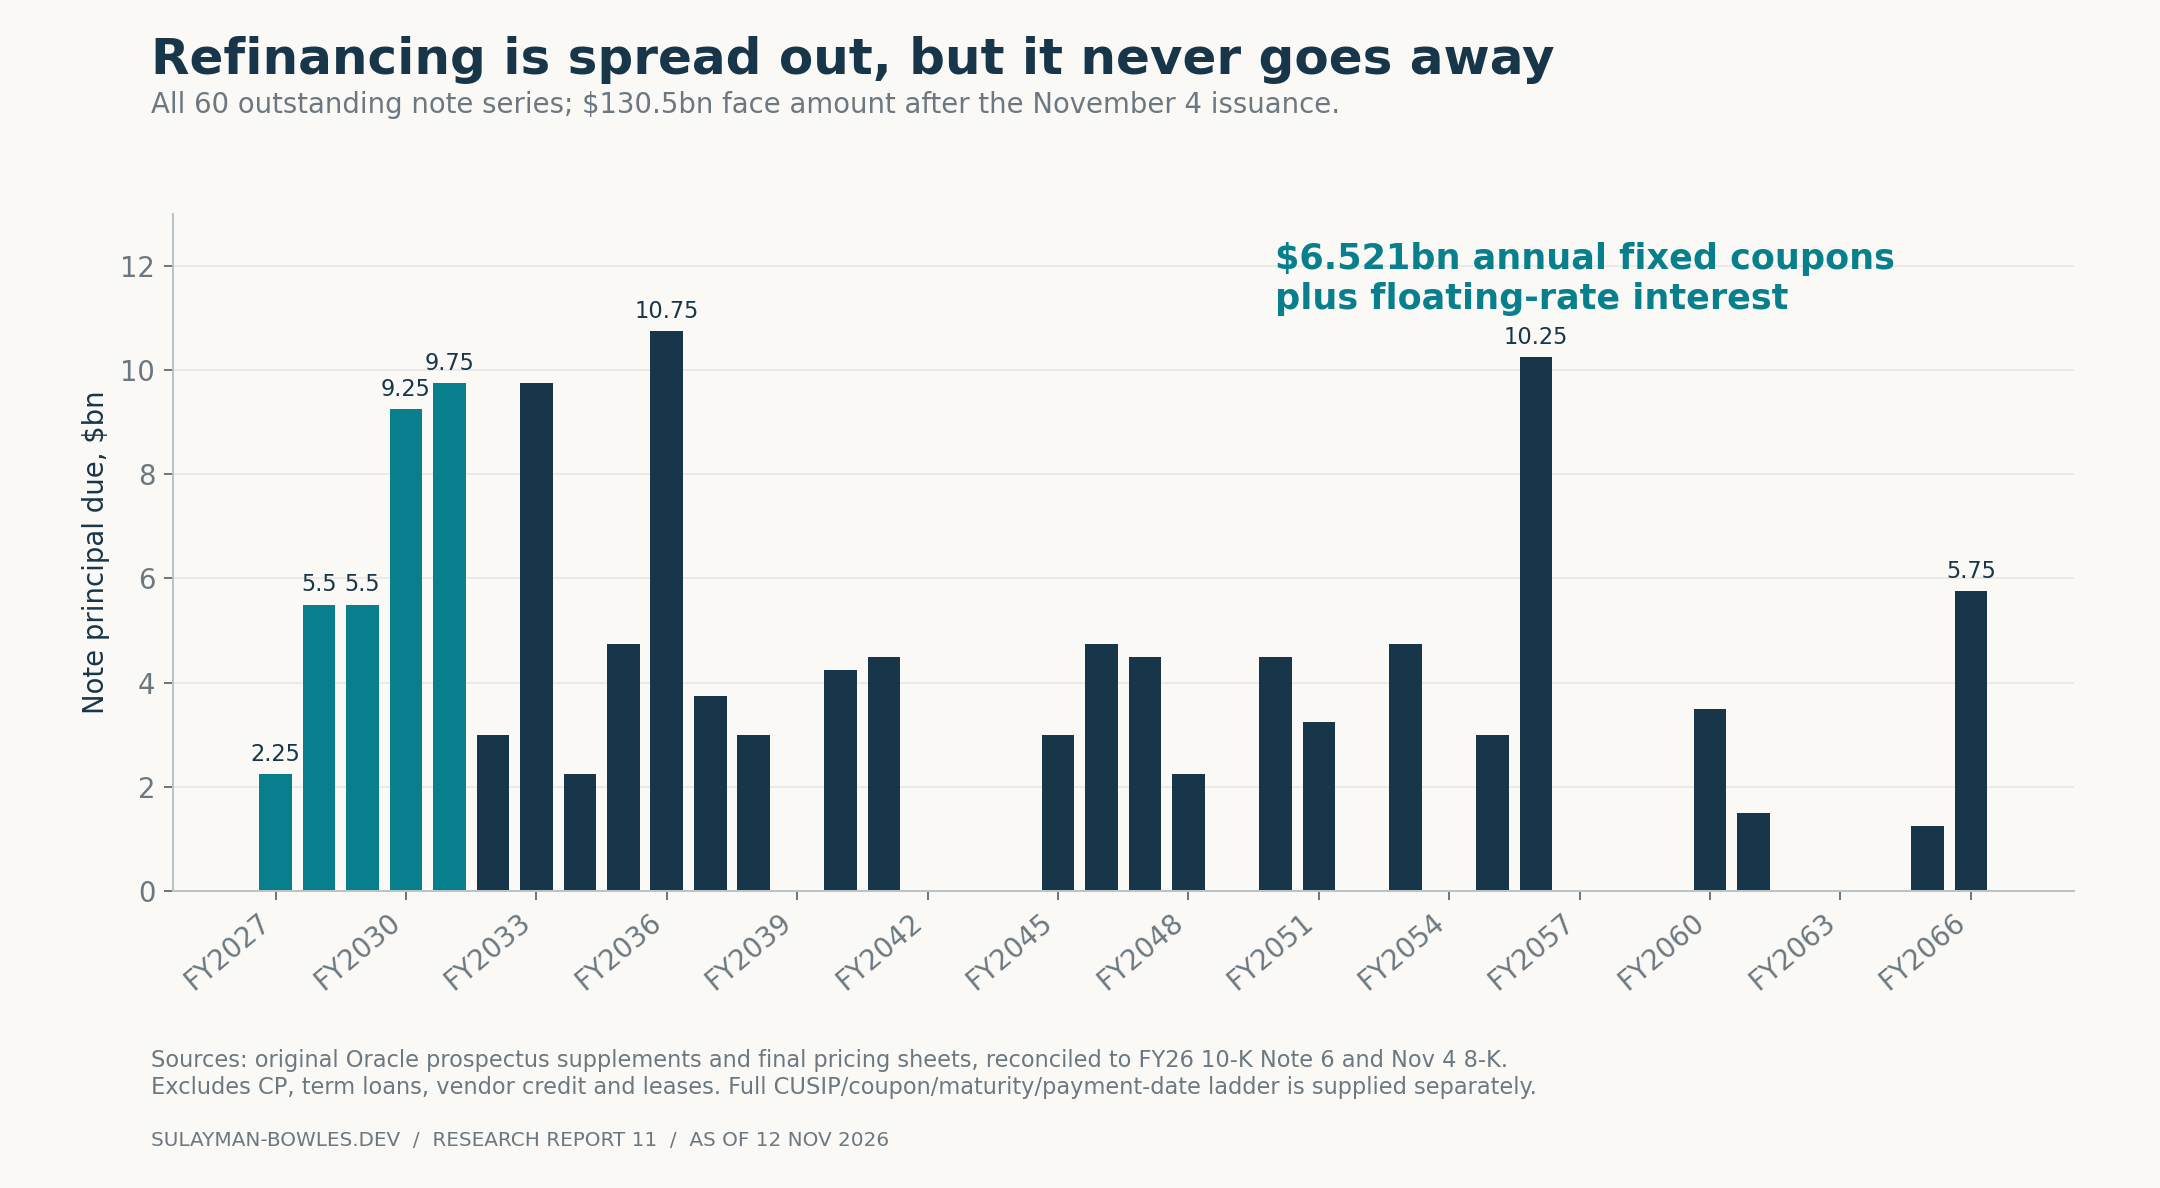
Figure 5. Sources: original prospectus supplements, reconciled with FY2026 10-K Note 6 and the November closing 8-K. The chart covers the notes. The analysis accounts for term loans, commercial paper, vendor credit and leases elsewhere.
The November transaction has already closed. It issued $10 billion of common stock and $10 billion face amount of notes, producing approximately $19.836 billion combined proceeds after underwriting discounts and before issuer expenses. The new debt’s annual coupon burden is $776.75 million.closing
| New maturity | Face amount | Coupon | Treasury spread at pricing |
|---|---|---|---|
| 4 Nov 2029 | $2.00bn | 7.000% | +240bp |
| 4 Nov 2031 | $1.75bn | 7.450% | +275bp |
| 4 Nov 2033 | $2.25bn | 7.850% | +305bp |
| 4 Feb 2037 | $2.50bn | 8.000% | +310bp |
| 4 Nov 2046 | $1.50bn | 8.650% | +335bp |
Simply adding the debt face to August carrying debt produces $135.337 billion; adding the proceeds to August liquidity produces $56.913 billion. These are financing-only bridges. The August opening liquidity already reflects $19.909 billion in net proceeds from first-quarter share sales under Oracle’s at-the-market program. Oracle also reported $6.247 billion of unpaid capital expenditures. The model has no opening schedule for vendor principal, due dates, or overlap with projected capital spending. September–November operating cash use, vendor obligations and ordinary financing movements are not yet observable in quarterly accounts.
Outside the note ladder, the bank term loan matures on 16 August 2027, subject to extension options. Its estimated August balance is $5.067 billion; scheduled FY2028 principal is about $4.645 billion, including the final balloon. Commercial paper also requires rolling access. The model assumes these bank and CP balances are continually refinanced. It refinances every note maturity, uses exact note maturity dates, and assumes a 7.5% refinancing rate. Floating notes use an assumed 4.5% SOFR plus their contractual spread. These rate assumptions are explicit; they are not forward-market quotes. Higher refinancing costs progressively replace the benefit of older low-coupon debt.
Public notes provide limited protection against the balance sheet expanding. They are unsecured parent obligations without subsidiary guarantees, have no general maintenance leverage covenant or overall debt cap, and sit structurally behind subsidiary liabilities. The prospectus reports $107.2 billion of subsidiary liabilities. Its lien and sale-leaseback restrictions contain scope limits and baskets; they should not be described as group-wide security protection.bondterms
The $10 billion committed revolver matures in March 2031 and has a defined EBITDA/net-interest test of at least 3.0 times. A combined revolver-plus-commercial-paper capacity figure is not the same thing as committed liquidity: commercial paper must still find buyers. That reliance on buyers becomes critical when credit spreads widen.revolver
6. Ratings and spreads already price a more demanding credit
The ratings table uses expected issue ratings and outlooks printed in final pricing documents, and identifies the intervening S&P downgrade. It records ratings at the dates shown.ratings
| Pricing date | Moody’s | S&P | Fitch |
|---|---|---|---|
| 30 Jan 2025 | Baa2 / stable | BBB / stable | BBB / stable |
| 24 Sep 2025 | Baa2 / negative | BBB / negative | BBB / stable |
| 2 Feb 2026 | Baa2 / negative | BBB / negative | BBB / stable |
| 2 Nov 2026 | Baa2 / negative | BBB− / stable | BBB / stable |
S&P’s July 2026 move leaves Oracle at its lowest investment-grade category at that agency. The November issue nevertheless demonstrates that investors will provide long-dated funding at a price. Both facts belong in the recommendation.
The approximately five-year new-issue spread increased 160 basis points, from Treasury plus 115 in February to plus 275 in November. Approximately seven-year pricing moved from plus 130 to plus 305. The comparison uses executed issuance terms at similar tenors.pricing
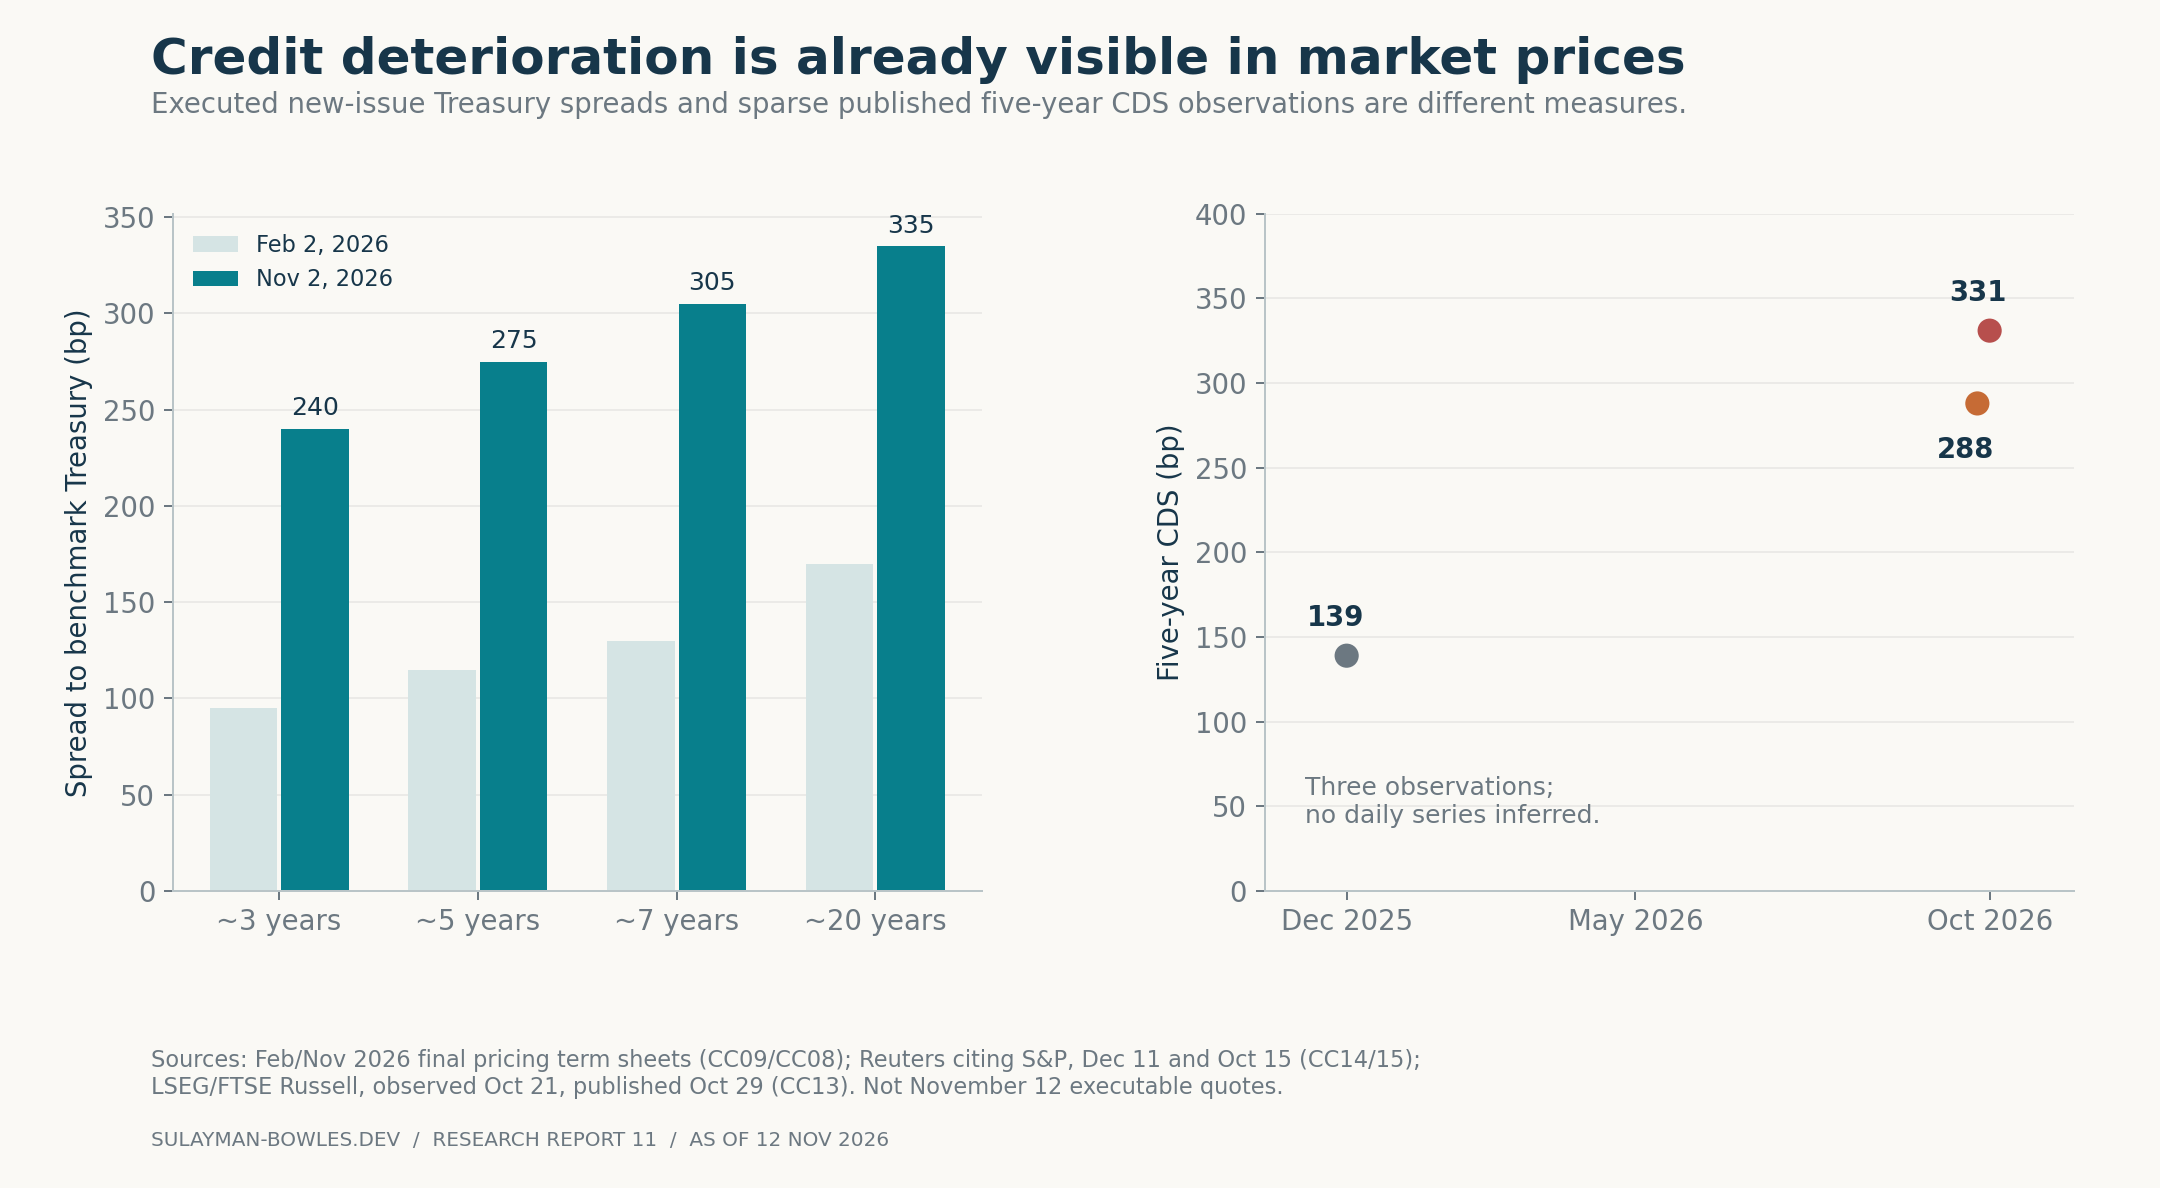
Figure 6. Primary bond sources: February and November 2026 final pricing sheets. CDS: Reuters quoting S&P data on 11 December 2025 and 15 October 2026; LSEG/FTSE Russell’s 21 October observation published on 29 October. Sparse observations are not connected into an invented daily series.
The free published five-year CDS observations located were 139bp on 11 December 2025, 288bp on 15 October 2026, and 331bp on 21 October 2026. The first two are secondary reporting of market-provider data; the last is published by LSEG. No complete free daily series or 12 November executable quote was available.cds
CDS and bond spreads contain different liquidity, contractual and market-basis effects. They should not be averaged or converted mechanically into an objective probability of default. Their common message is that marginal creditors now demand materially more compensation than they did before the spending acceleration.
An issuer can keep market access while becoming a less attractive unsecured borrower at its offered spread. Extra yield compensates for some risk. A lender still needs access to customer contracts, cost-to-complete evidence or a credible funding bridge.
7. Five-year model: the base case works because several assumptions work together
Oracle’s current October guidance is total revenue of at least $90 billion in FY2027 and at least $225 billion in FY2030, a FY2030 non-GAAP operating margin of at least 40%, positive FCF during the second half of FY2028, at least $30 billion FCF in FY2029 and defined net debt/adjusted EBITDA below 3.5 times in FY2029.guidance
There is no current public annual OCI schedule matching this model. OCI revenue of $38/$74/$120/$160/$190 billion is allocated by the analyst. The other revenue assumptions are $52/$56/$60/$65/$70 billion. Only the FY2027 and FY2030 totals are anchored to the current company targets; intermediate totals and FY2031 remain estimates. Earlier OCI forecasts should not silently be presented as fresh guidance.
The decisive assumptions are:
| Driver | Base assumption | Why it matters |
|---|---|---|
| Remaining hardware investment | $95bn in remaining FY2027; $125bn in FY2028 | Allocates the modeled $220bn build by fiscal year |
| Later equivalent hardware | $95bn/$90bn/$100bn in FY2029–31 | Allows growth and replacement; exact equipment refresh schedule is unknown |
| Project funding mix | 30% customer hardware, 30% vendor-financed, 40% Oracle-funded | Determines immediate cash requirements and asset ownership |
| Vendor funding | 70% of its project cohort; five-year amortization; 7.5% interest | Rate, security and amortization are assumptions |
| Additional advances | $12bn in remaining FY2027, $15bn FY2028 | Funding receipts, followed by service delivery without duplicate collections |
| Other margins | Non-AI OCI operating margin 45%; non-OCI 50% | Sustains a strong cash contribution outside the largest AI projects |
| Tax and liquidity | 20% cash-tax reserve; $15bn year-end unrestricted cash floor | Creates a transparent funding gap; does not certify intrayear liquidity |
| Distributions | $6.6bn rising to $7.0bn annual cash dividends; no buybacks | Preserves a cash outflow even during construction |
The forecast begins with reported Q1 and a remaining nine-month stub. It includes the November proceeds once. It does not invent an existing vendor-debt balance: new vendor credit is incremental, and undisclosed opening balances remain an omission to resolve before lending.
The opening prepaid-service balance of $15.955 billion uses cumulative disclosed financing receipts to approximate opening advance balances. Remaining customer-level liabilities are undisclosed. Five-year delivery amortization is assumed. Opening in-service equipment and construction in progress follow their own depreciation schedules, with six-year equipment lives and phased commissioning. Extra equipment ownership reduces operating profit for the additional depreciation, preventing the depreciation addback from creating artificial cash profit.
Base cash and capital conversion
| Base case | FY2027 | FY2028 | FY2029 | FY2030 | FY2031 |
|---|---|---|---|---|---|
| Total revenue | 90.0 | 130.0 | 180.0 | 225.0 | 260.0 |
| OCI revenue — assumption | 38.0 | 74.0 | 120.0 | 160.0 | 190.0 |
| Owned equipment acquisitions | 99.6 | 93.6 | 71.1 | 67.4 | 74.9 |
| New vendor credit | 19.9 | 26.2 | 19.9 | 18.9 | 21.0 |
| Immediate cash capex | 79.7 | 67.3 | 51.2 | 48.5 | 53.9 |
| Cash capex / OCI revenue | 2.10 | 0.91 | 0.43 | 0.30 | 0.28 |
| Owned acquisitions / OCI revenue | 2.62 | 1.26 | 0.59 | 0.42 | 0.39 |
| Operating cash flow estimate | 64.3 | 73.1 | 86.9 | 113.2 | 134.9 |
| Cash surplus before equipment principal | -15.3 | 5.8 | 35.8 | 64.7 | 81.0 |
| Cash after vendor/finance-lease principal | -17.1 | -1.1 | 24.1 | 49.1 | 61.4 |
| Cash interest estimate | 7.7 | 9.8 | 11.2 | 11.7 | 12.3 |
| Common + preferred cash dividends | 6.6 | 6.7 | 6.8 | 6.9 | 7.0 |
| Closing unrestricted cash | 40.2 | 32.4 | 49.7 | 91.9 | 146.3 |
| Funded debt incl. new vendor credit | 153.8 | 173.4 | 182.1 | 185.9 | 187.8 |
| Net debt + committed leases / EBITDAR | 5.01× | 3.44× | 2.30× | 1.60× | 1.09× |
| Adjusted EBITDA / cash interest | 7.25× | 8.63× | 10.80× | 12.81× | 14.23× |
USD billions except ratios. “Owned acquisitions” uses Q1 cash capital expenditures for the reported quarter and excludes noncash asset additions. Cash capex is after assumed new vendor financing. Forecast CFO includes the net effect of customer advances. The after-principal row deducts modeled incremental vendor principal and finance-lease principal; FY2027 excludes the disclosed $0.830bn Q1 net repayment of short-term capex financing. That outflow is already reflected in opening August cash, so the forecast funding gap is unaffected.
The annual equipment-to-OCI ratios decline as capacity converts, but the five-year cash-capex/revenue ratio remains 51.6%, versus 69.9% before new vendor financing. The portfolio ratios include investment for revenue earned later. The project’s 46.25% ratio spans its lifetime. BYOH economics are already reflected in the assumed revenue path; the model is not a detailed engineering reconciliation of every gigawatt.
In FY2028, vendor credit is the difference between $93.581 billion of owned equipment and $67.331 billion of immediate cash purchases. CFO of $73.124 billion produces $5.793 billion before equipment principal, but negative $1.135 billion after vendor and finance-lease principal. Treating newly vendor-financed equipment as an acquisition cash requirement gives negative $20.457 billion. The programme is not yet self-funding on every cash-flow measure shown.
FY2029 produces $35.766 billion before principal and $24.127 billion afterward. The first measure is directionally compatible with management’s $30 billion FCF aspiration, but accounting presentation and funding classifications must be reconciled before claiming the target has been independently replicated.
Cash-interest estimates rise from $7.7 billion in FY2027 to $12.3 billion in FY2031. The dividend budget includes common and preferred distributions. The existing $5 billion mandatory convertible preferred carries $325 million annual dividends while outstanding; it converts into common equity in 2029 and is not a $5 billion ordinary debt maturity.preferred
Low, base and high cases
Low combines slower OCI growth, 10% higher investment, three percentage points lower AI gross margins, 20% BYOH and 20% vendor project shares, and reduced advances. High combines faster growth, 5% lower investment, two points better AI gross margins, 40% BYOH and 35% vendor shares, and larger advances. Both cases change several related assumptions together.
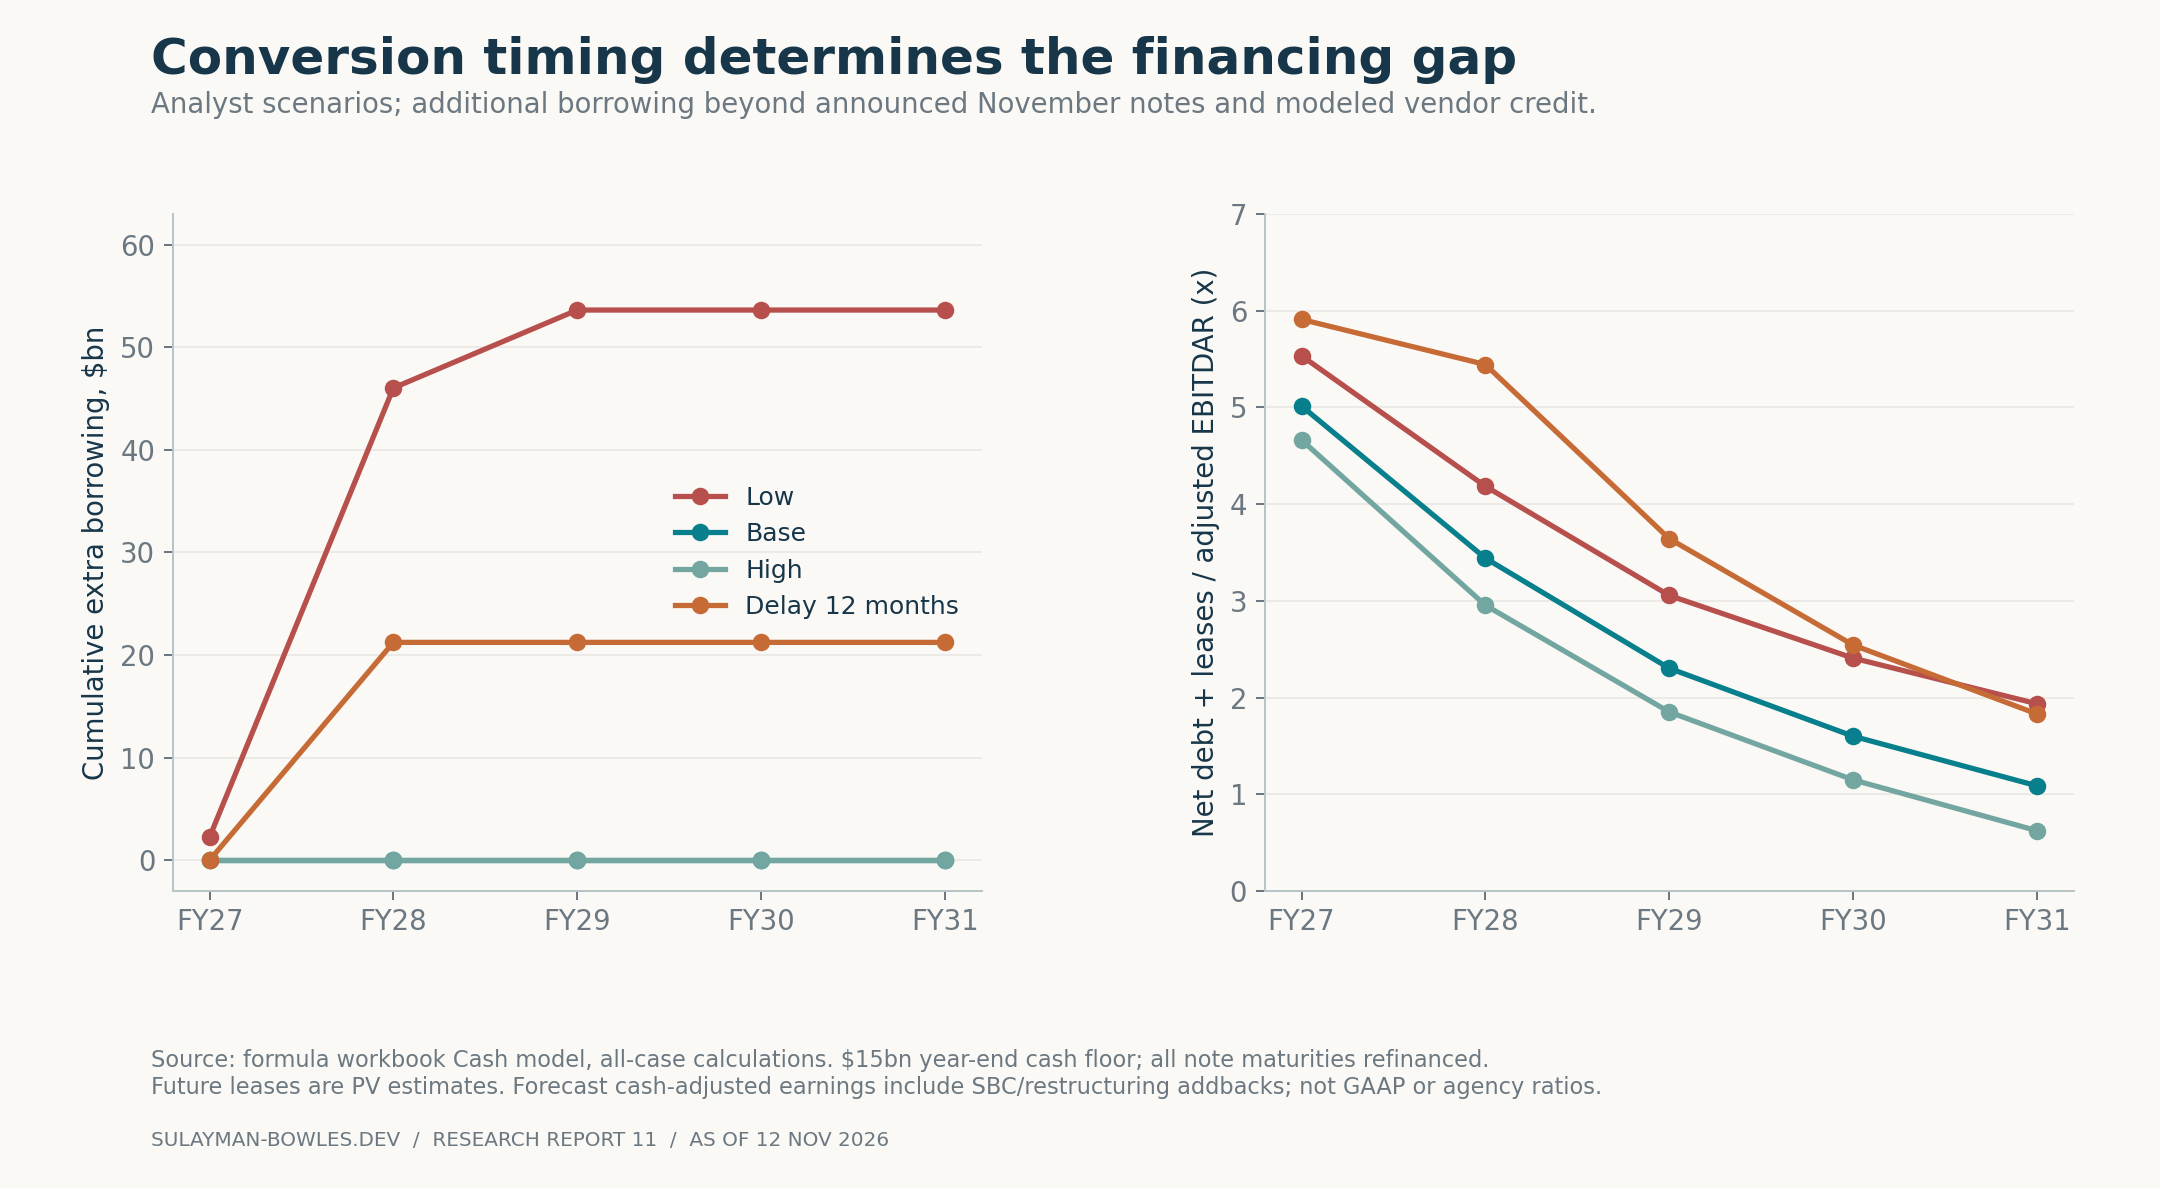
Figure 7. Source: formula workbook. Additional borrowing excludes the known November debt and modeled vendor credit. Lease leverage includes all modeled committed-lease PV; forecast earnings use the adjusted basis described below.
The low case requires $53.6 billion of extra borrowing; base and high require none beyond their specified funding programmes. High can carry more gross vendor debt than base while holding more cash. The annual credit outputs are shown together so that lower leverage is not confused with lower gross debt.
| Debt / lease-adjusted net leverage | FY2027 | FY2028 | FY2029 | FY2030 | FY2031 |
|---|---|---|---|---|---|
| Low | 151.1 / 5.53× | 209.3 / 4.18× | 223.3 / 3.06× | 226.1 / 2.41× | 227.4 / 1.94× |
| Base | 153.8 / 5.01× | 173.4 / 3.44× | 182.1 / 2.30× | 185.9 / 1.60× | 187.8 / 1.09× |
| High | 155.8 / 4.66× | 177.6 / 2.95× | 187.2 / 1.85× | 191.4 / 1.15× | 193.5 / 0.62× |
| Delay 12 months | 153.8 / 5.91× | 194.7 / 5.44× | 203.4 / 3.64× | 207.2 / 2.54× | 209.0 / 1.83× |
| Customer pays half | 153.8 / 5.01× | 173.4 / 4.18× | 182.1 / 3.02× | 185.9 / 2.34× | 187.8 / 1.86× |
| Customer funding stops | 153.8 / 5.01× | 185.2 / 4.34× | 204.3 / 3.23× | 204.9 / 2.59× | 204.5 / 2.15× |
| Re-tenant | 153.8 / 5.01× | 191.2 / 4.85× | 216.5 / 3.54× | 217.2 / 2.66× | 216.7 / 2.13× |
Each cell: funded debt in $bn / net debt including all committed lease PV divided by adjusted EBITDAR. “Funded debt” includes incremental vendor credit but excludes leases; the model adds leases to the ratio and keeps surplus cash, with no discretionary debt repayment.
| Earnings / cash charges | FY2027 | FY2028 | FY2029 | FY2030 | FY2031 |
|---|---|---|---|---|---|
| Low | 4.05× | 3.17× | 3.05× | 3.22× | 3.43× |
| Base | 4.04× | 3.32× | 3.34× | 3.55× | 3.70× |
| High | 4.06× | 3.34× | 3.39× | 3.61× | 3.76× |
| Delay 12 months | 3.60× | 2.26× | 2.34× | 2.76× | 3.12× |
| Customer pays half | 4.04× | 2.86× | 2.80× | 2.92× | 3.01× |
| Customer funding stops | 4.04× | 2.89× | 2.85× | 3.02× | 3.22× |
| Re-tenant | 4.04× | 2.60× | 2.62× | 2.95× | 3.25× |
Coverage is adjusted EBITDAR divided by cash interest, operating rent, vendor principal and finance-lease principal. It excludes taxes, capex, dividends and ordinary bond refinancing. The test compares earnings with cash charges. A free-cash-flow test would also need a full debt service schedule.
Historical GAAP-based EBITDA is $33.938 billion; adding stock compensation and restructuring produces $40.269 billion, before rent. Forecast EBITDA starts from adjusted operating profit and adds modeled depreciation; EBITDAR then adds cash rent. This differs from historical lease-expense treatment, Oracle’s definitions and agency methods. The large forecast improvement is conditional on earnings growth and the chosen adjustments.
8. Customer quality matters twice: payment and construction funding
Oracle disclosed no customer representing 10% or more of recognized total revenue in FY2024–26. The revenue mix leaves concentration in future backlog unresolved. The same annual report warns about concentration in particular OCI offerings, potentially highly leveraged customers and lease commitments that can survive customer nonperformance.concentration
Oracle has named AMD, Meta, Nvidia, OpenAI, TikTok and xAI among contracted customers. The company identifies its customers. The filings leave some legal obligors and parent guarantees undisclosed. Credit assessment must distinguish a listed company’s own obligation from a subsidiary, special-purpose entity or private company reliant on future funding.customers
OpenAI’s official announcement describes an Oracle partnership exceeding $300 billion over five years and up to 4.5 gigawatts of additional capacity. This is primary reporting by the customer. It is not a customer-level reconciliation to Oracle’s current RPO. Dividing $300 billion by five gives $60 billion annually as arithmetic only; no flat annual payment schedule was disclosed.openai
The customer’s March 2026 announcement reported $122 billion of committed funding, $2 billion monthly revenue and an undrawn $4.7 billion revolver. The figures describe the balance at that financing and operating checkpoint. SoftBank’s October confirmation that its $30 billion follow-on investment was completed is evidence of funded support, but it is part of the earlier round and must not be added again. A confidential S-1 announcement does not supply public audited financial statements.customerfunding
The appropriate conclusion is that significant financial support exists while current liquidity, burn, competing commitments and enforceable recourse remain insufficiently transparent for ordinary single-name investment-grade underwriting. The exact cash available to pay Oracle remains undisclosed. The stress therefore uses an assumed 40% OCI billing concentration. Oracle has not disclosed OpenAI’s share.
Payment-only stress versus funding withdrawal
From FY2028, the half-payment case without new customer advances assumes the customer pays half of amounts still due after prepaid services. Costs remain fixed, and its future advances stop, but existing BYOH and vendor support continue. This case does not require additional gap borrowing; it nearly exhausts the cushion, with FY2028 closing cash of $16.6 billion against the $15 billion floor.
The combined funding-stop case also reduces BYOH and vendor project shares from 30% each to 18% each. Oracle replaces missing customer equipment and finances more of the build itself. Peak additional borrowing becomes $36.6 billion. This is the more informative stress when a customer is simultaneously the buyer and part of the financing plan.
The twelve-month delay case instead keeps investment and rents on schedule while new OCI conversion arrives one year late, after reported Q1. It avoids operating costs equal to 20% of missed revenue and shifts advances later. The scenario delays equipped capacity and acceptance while some construction costs continue. The resulting $21.2 billion funding gap appears in FY2028.
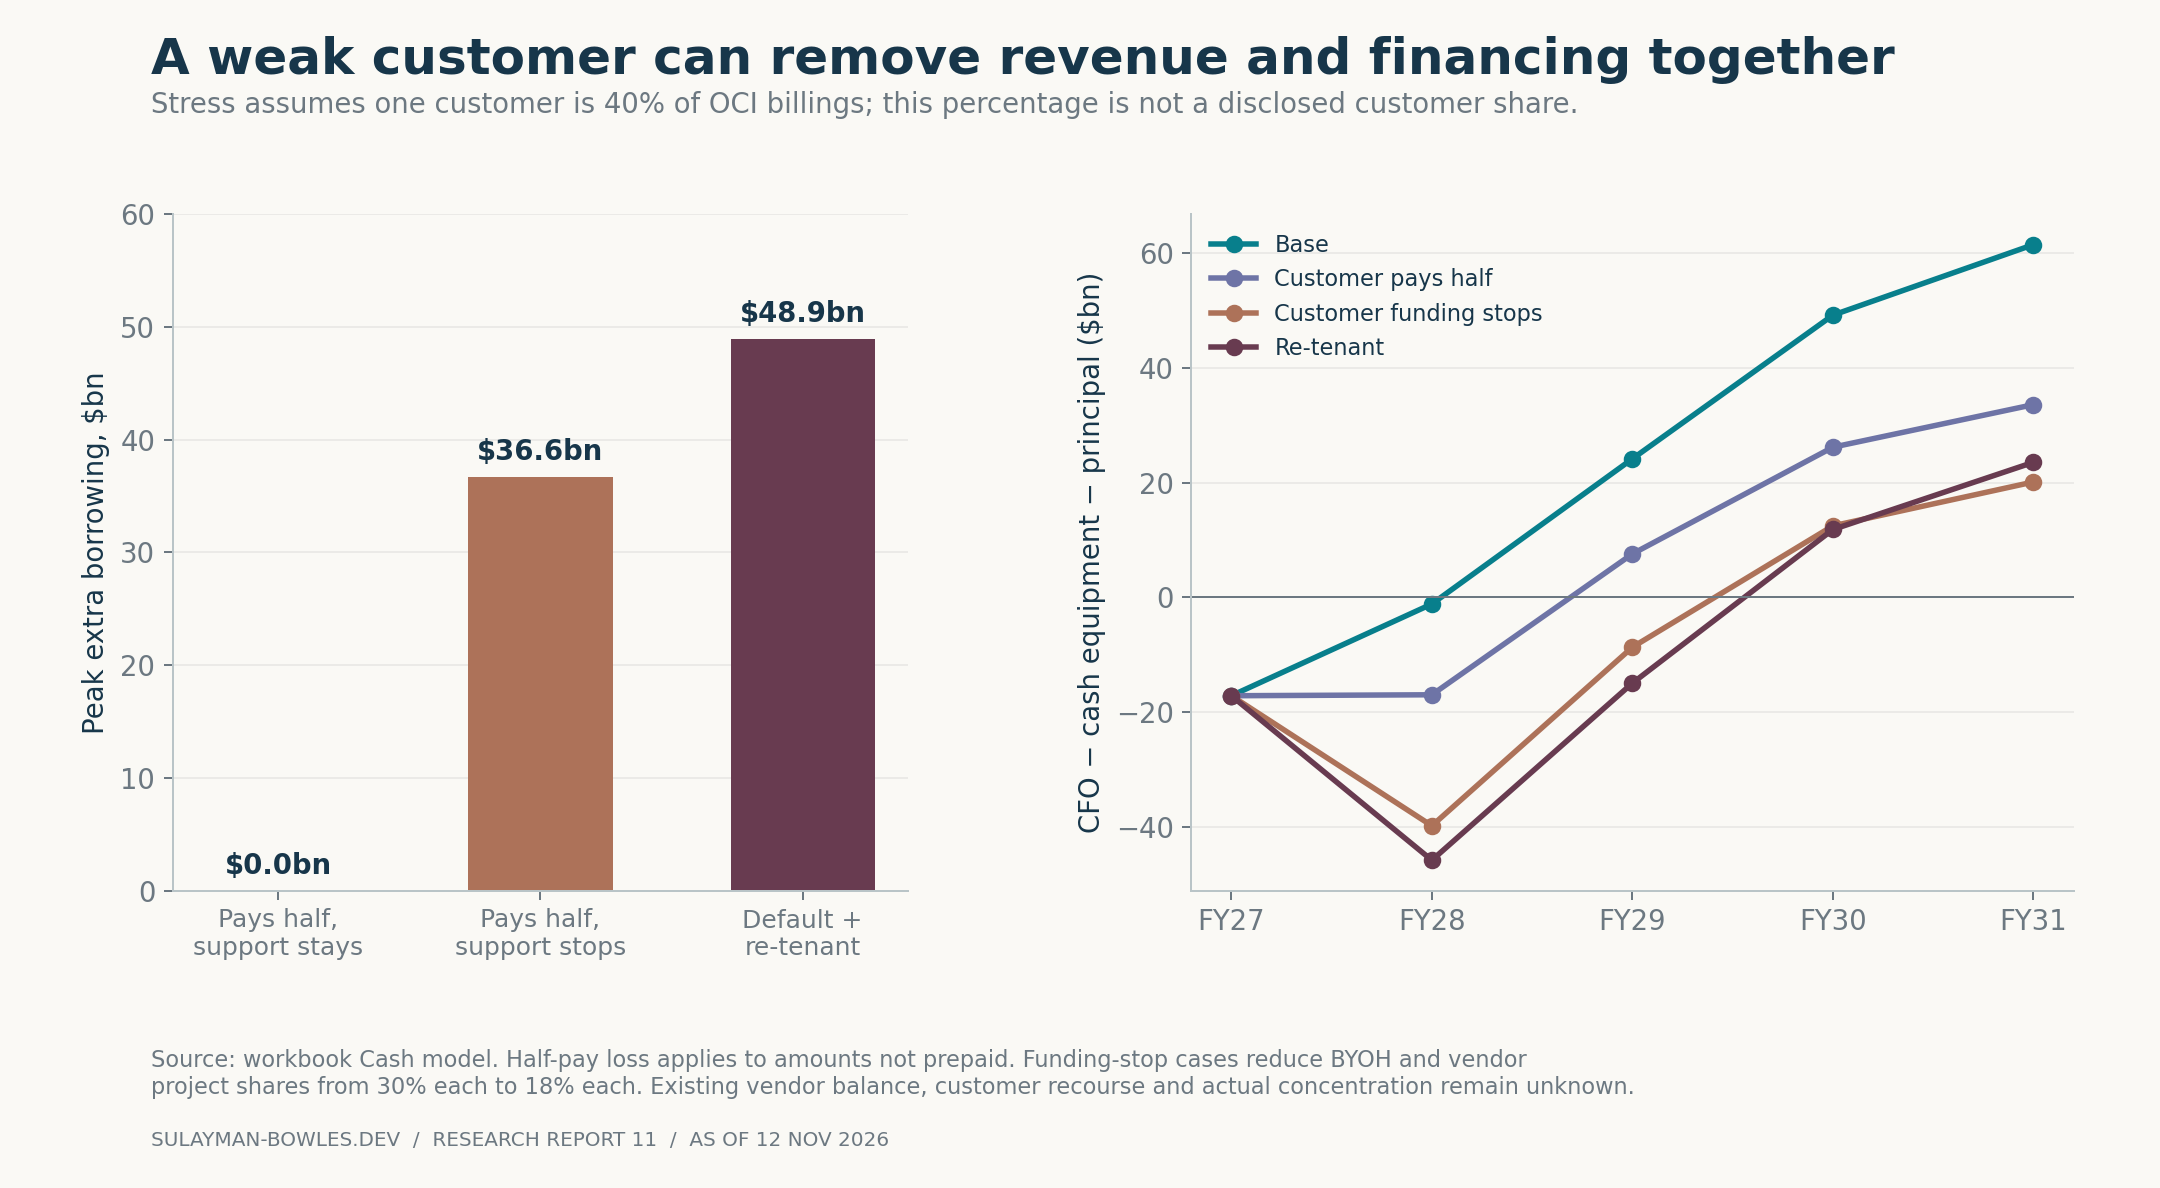
Figure 8. Source: workbook Cash model. Customer concentration, collections, funding withdrawal and recovery timing are analyst stress assumptions. They are not allegations about any customer’s conduct or predicted default.
Several direct sensitivities expose the funding dependence:
| Change to the $220bn build | Extra immediate cash requirement, before interest/tax effects |
|---|---|
| 10% cost overrun, unchanged base funding mix | $11.9bn |
| BYOH share falls by 10 percentage points; Oracle replaces equipment | $18.4bn |
| Vendor-financed project share falls by 10 percentage points | $15.4bn |
| $10bn planned customer advance is not received | $10.0bn |
At FY2029 volumes, a customer paying half of unprepaid bills would remove approximately $11.3/$22.5/$33.8 billion at assumed 20%/40%/60% OCI concentration. The amounts show lost annual receipts before costs and taxes respond. They show why exact ultimate-payer concentration is an essential underwriting input.
9. Re-tenant value exists, but it is not equivalent to collateral recovery
There is evidence of equipment reuse. Management reported 97.5% GPU utilization and substantial GPU renewal activity in June; the October OCI presentation describes reallocating 8,000 GPUs within hours and approximately 1,000 AI infrastructure customers. These observations support operational flexibility. Replacing a gigawatt-scale customer remains uncertain at the original price during a stressed market.reuse
The re-tenant case assumes default in FY2028, no replacement receipts that year, then utilization/price combinations of 50%/70%, 75%/75% and 85%/80% of the original level. Only the assumed 70% Oracle-controlled portion generates replacement receipts; customer-owned GPUs receive no Oracle recovery credit. Existing vendor obligations remain serviced, and continued access to that equipment is assumed.
This case requires $48.9 billion of additional borrowing at peak. It also assumes the same loss of future equipment and funding support as the combined customer stress, plus reconfiguration spending. The scenario assumes Oracle continues operating. Acceleration, foreclosure, consent failures and litigation costs are not modeled.
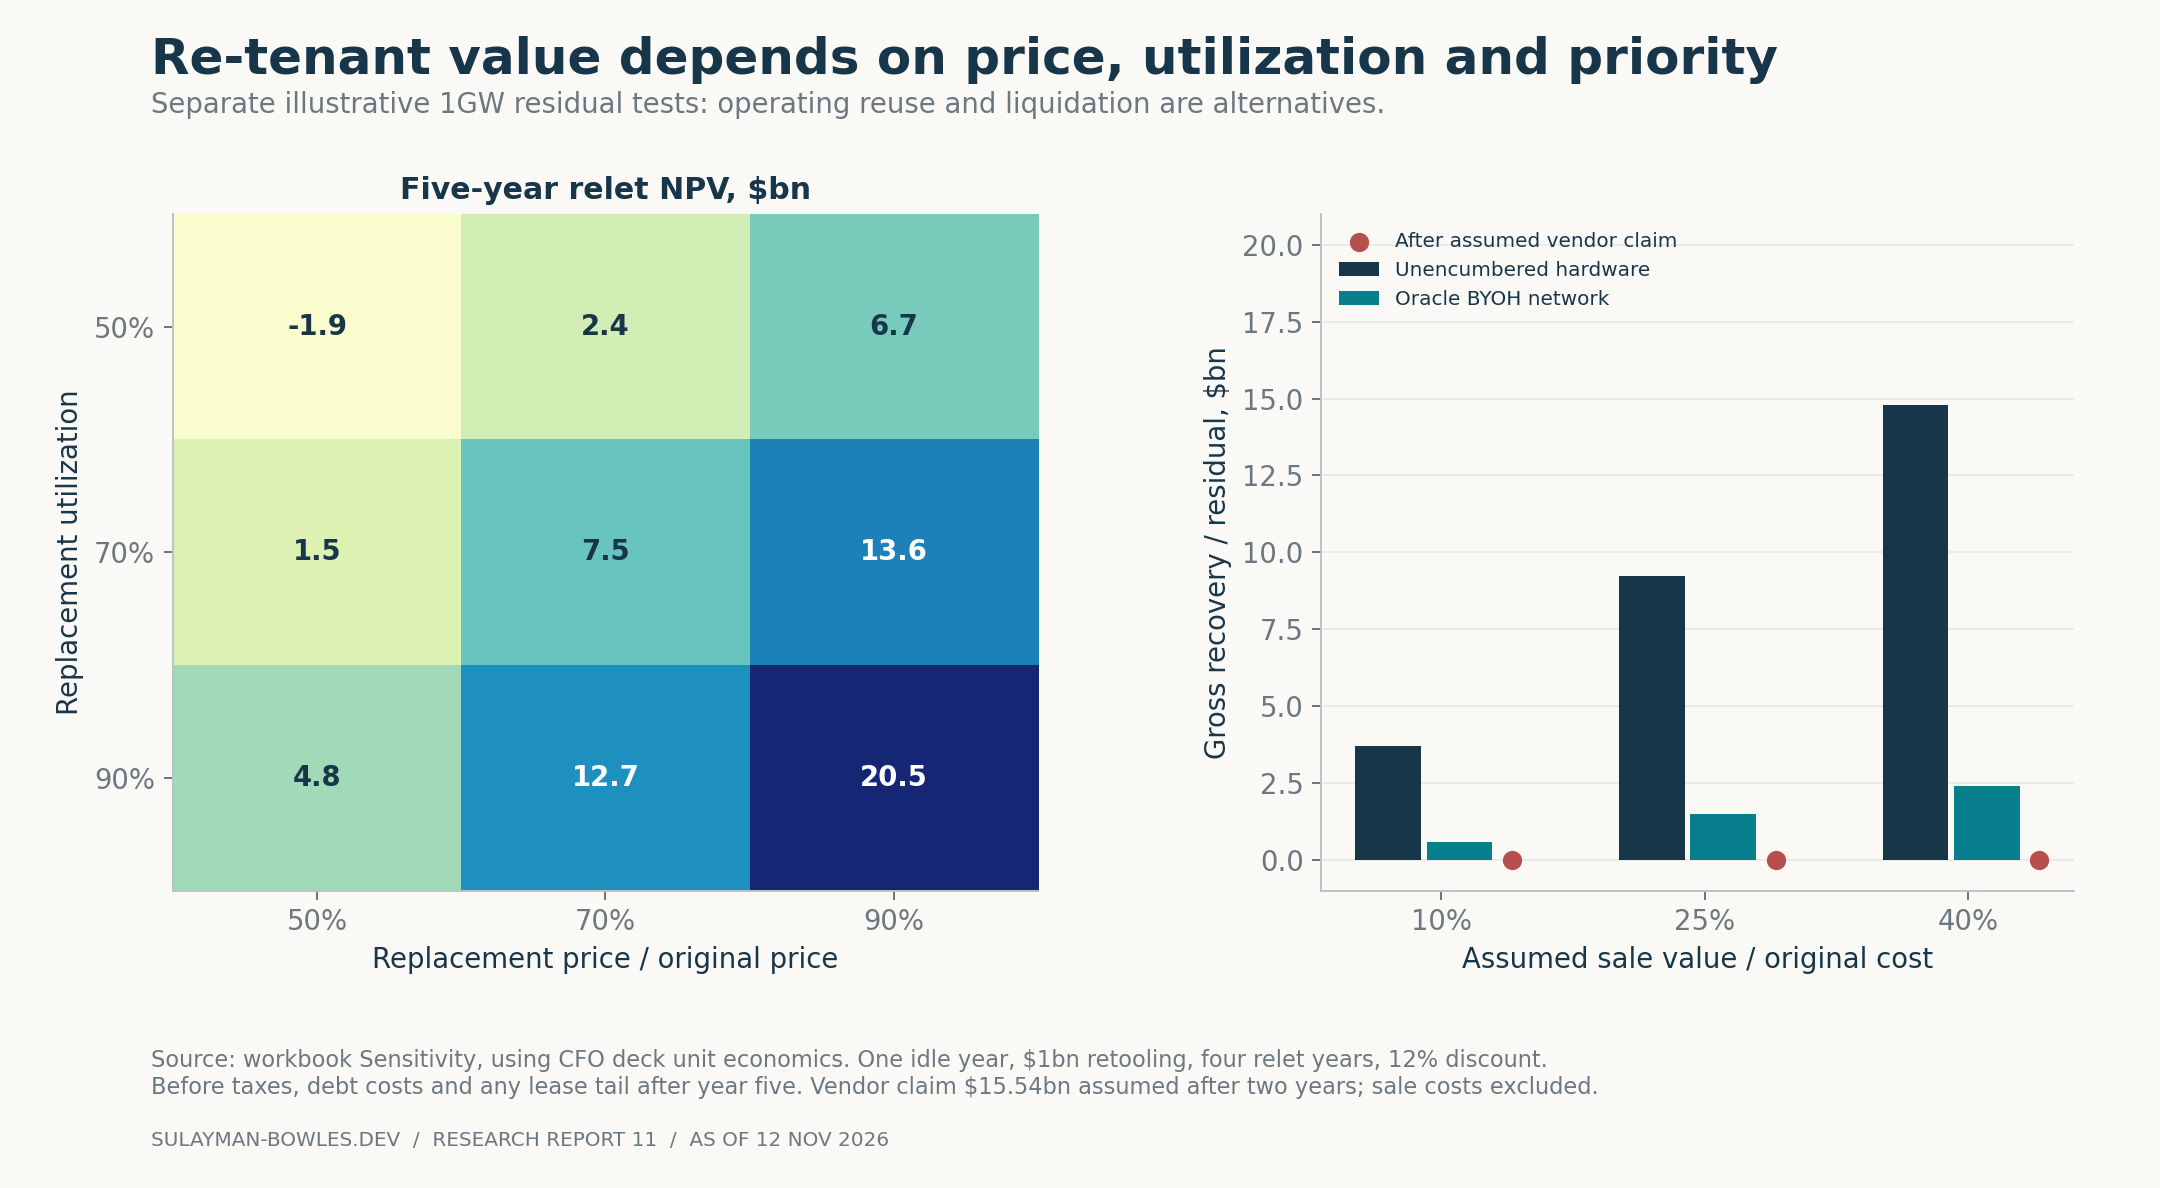
Figure 9. Source: workbook Sensitivity. One-gigawatt illustration using Oracle’s project baseline; all residual assumptions are analytical. Reletting and liquidation values are alternatives and are never added together.
The residual-value grid assumes one idle year, $1 billion of retooling, four earning years, 60% fixed cash operating costs and a 12% discount rate. At 70% price and 70% utilization, estimated five-year operating NPV is $7.5 billion; at 50%/50%, it is negative $1.9 billion. These values precede taxes, debt costs and any lease tail beyond year five, so they are not lender recovery valuations.
For liquidation, assumed hardware proceeds of 10%, 25% or 40% of original $37 billion cost produce $3.7/$9.25/$14.8 billion before costs and priority claims. If 70% was vendor-financed over five years, the assumed outstanding claim after two years is $15.54 billion. All three sale assumptions then leave zero residual for junior creditors on that equipment. Liens and title rights remain undisclosed.
A building that Oracle leases is not Oracle-owned real estate to sell. A customer’s GPU is not an Oracle asset to pledge. Powered capacity, networking and reusable equipment may have substantial value, but their availability depends on ownership, prior claims, assignability and continued funding. Finding another tenant can reduce a loss. Underwriting still depends on customer payment quality.
Lender decision, terms and evidence that would change it
I would consider a $3–5 billion, five-year facility with a two-year staged draw period, sized within a broader lender exposure limit. It should fund verified conversion milestones, with independent cost-to-complete checks and evidence that customer deposits, hardware and vendor commitments are in place. This is a proposed negotiated facility; Oracle may prefer the flexibility of public bonds and decline these terms.
The pricing proposal is SOFR plus 350–425bp, with a proposed 75bp annual fee on undrawn commitments. The alternative five-year unsecured underwriting hurdle is Treasury plus 325–375bp. Treasury and SOFR spreads are different bases and are not interchangeable. Pricing should be refreshed at commitment; the public observations used here are dated.
The minimum covenant and reporting package would be:
| Requirement | Proposed credit condition |
|---|---|
| Liquidity | At least $15bn unrestricted cash, tested monthly, plus committed sources covering 125% of the next twelve months’ forecast cash deficit and maturities not already refinanced |
| Commitment-adjusted leverage | Explicit debt, vendor and recognized/unstarted lease definitions; ceiling 6.75× initially, 6.0× FY2027, 4.25× FY2028, 3.25× FY2029 and 2.75× thereafter |
| Cash-charge coverage | At least 2.75× on the model’s defined EBITDAR/interest/rent/equipment-principal test, alongside a capex funding test |
| Draw gates | Energized and accepted capacity, signed cash-payment terms, verified remaining costs, no material customer-payment or funding shortfall |
| Pipeline control | No material new lease or equipment commitment without matched funding and an updated downside conversion plan |
| Distributions | Suspend buybacks and restrict common dividends when liquidity, leverage, acceptance or pipeline tests fail; sweep defined excess cash into repayment |
| Security, where available | Only verified Oracle-owned assets and assignable contracts; borrowing base after prior claims and independent valuations; required landlord/customer/vendor consents; subject to existing lien and negative-pledge restrictions |
| Information | Monthly capacity conversion and cash reporting; quarterly contract, concentration, lease, equipment and vendor-credit reconciliations |
The leverage step-down starts above the estimated opening 6.38 times on the adjusted earnings basis. An immediate 3.5-times covenant on this expanded definition would fail at inception and would be incoherent. The proposed tests differ from Oracle’s existing revolver definition. Documentation must prohibit double-counting cash, inflating adjustments with forecast savings, or treating uncommitted customer funding as committed liquidity.
The reporting schedule should reconcile contracted megawatts to energized, accepted, billed and paid capacity; identify the largest ultimate payers; show aging, disputes and prepaid balances; and a breakdown of vendor principal, interest, collateral and recourse. It should list each lease’s commencement, fixed payments, termination and assignment terms, and each hardware cohort’s ownership and expected refresh date. Aggregate RPO is insufficient for these purposes.
Evidence that would improve the decision: sustained accepted-capacity conversion; collections matching invoices after advances are consumed; signed non-refundable customer deposits or strong parent guarantees; a funded vendor schedule; demonstrated cash generation after equipment principal and replacement spending; and leases whose start dates and termination rights align with customer obligations.
Evidence that would reverse approval: missed acceptance without matching cost deferral; a major customer’s receivables aging while future advances are assumed; dependence on uncommitted vendor credit; additional leases without funded cost-to-complete protection; or capex and refresh costs materially exceeding the contracted revenue economics. A further rating downgrade would matter most through collateral, liquidity or funding-cost consequences.
The lender’s central condition is therefore concrete: Oracle must turn the installed and contracted pipeline into collectible cash before advances, vendor credit and long leases become a larger fixed claim than the operating business can support. The base case achieves that. The delay and customer-funding cases show how narrow the financing path becomes when those conditions no longer coincide.
Model audit and source notes
The workbook labels sourced historical inputs, editable assumptions, formula calculations, a complete note ladder, lease schedules, case outputs and sensitivities. All thirty-five case-year outputs reconcile to an independent numerical calculation. The three headline checks were also recomputed independently:
- RPO: $664bn × 13% = $86.320bn, appropriately rounded in the headline.
- Future leases: summing 51 discounted annual payments across three cohorts gives $145.845986bn; adding reported debt and leases and subtracting cash gives $277.911986bn.
- Delay financing: FY2028 cash before additional borrowing is negative $5.170365bn. Funding a $15bn floor and half-year 10% interest requires $(15 + 5.170365)/(1 − 0.05) = $21.231963bn. Its $1.061598bn interest cost leaves exactly $15bn.
FY2027 cash-interest estimates use Q1 interest expense of $1.428 billion as a cash proxy. Q1 finance-lease principal of $0.060 billion is estimated from $0.186 billion of disclosed principal-and-interest payments less $0.126 billion of interest expense; Oracle does not disclose principal.
The model is annual, with a bridge from reported Q1 to the forecast stub. Intrayear funding peaks, exact customer contract rights, existing vendor liabilities, some cash-versus-accrual interest timing and precise lease commencements remain UNKNOWN. The lender would need these disclosures to complete underwriting. No inferred intent, misconduct or wrongdoing is necessary to reach the credit conclusion.
- Oracle Q1 FY2027 10-Q, filed 11 September 2026, revenue-recognition/RPO disclosure, printed p. 7;
RevenueRemainingPerformanceObligationand recognition-period discussion. Dollar conversion uses rounded inputs. ↩ - Oracle FY2024 10-K, filed 20 June 2024; FY2025 10-K, filed 18 June 2025; FY2026 10-K and intervening 10-Qs. The source registry supplies all thirteen filing URLs. Relevant tags:
NetCashProvidedByUsedInOperatingActivities,PaymentsToAcquirePropertyPlantAndEquipment,InterestExpense,RevenueRemainingPerformanceObligation; contexts identify the correct period. Q4 uses annual less nine-month cash flow. ↩ - Oracle FY2026 10-K, filed 22 June 2026, consolidated cash flows and supplemental cash-flow information, printed p. 68, and Note 1. Cash-interest tag:
InterestPaidNet; interest expense appears on the income statement. FY2024/FY2025 annual controls trace to the preceding 10-Ks in the registry. ↩ - Q1 FY2027 10-Q, printed pp. 5 and 7, cash-flow statement and Note 1: significant-financing customer prepayments, including $11.363bn in Q1; FY2026 cash flows: $4.592bn. Financing-component interest was immaterial in Q1. The TTM receipt proxy is not a disclosed unconsumed prepaid balance. ↩
- Oracle Q1 FY2027 earnings release, 10 September 2026, supplemental capex/net-cash-outlay table and footnotes; GAAP/non-GAAP reconciliation. The $0.830bn financing figure is a negative period flow, with no closing vendor-debt balance disclosed. ↩
- Q1 FY2027 10-Q, printed pp. 1 and 5, consolidated balance sheet and cash-flow reconciliation. Cash $36.369bn plus securities $0.708bn; restricted cash reconciles to total cash in the cash-flow statement. Debt is carrying value, including current and noncurrent amounts. ↩
- Q1 FY2027 10-Q, lease disclosures and maturity table, printed pp. 12–13; recognized operating $34.621bn, finance $9.185bn and uncommenced nominal $288bn. FY2026 10-K lease note supplies the $260bn prior observation. New-start timing within the disclosed windows is an analyst assumption. ↩
- Q1 FY2027 10-Q, Note 6, printed p. 13, unconditional purchase/other obligations. FY2026 10-K, printed p. 90, lease/guarantee disclosure, contingent lessor borrowing guarantee up to $3.3bn due September 2026. The later omission does not confirm discharge. ↩
- Oracle CFO Investor Day presentation, 28 October 2026, printed pp. 14–18, including cost-plus, margin, capex and ROI footnotes. Values are illustrative non-GAAP project economics. ↩
- Oracle, From the Q3 earnings call, 24 March 2026, AI Infrastructure/Execution and Economics: 32% gross margin for capacity delivered in Q3 FY2026; management-reported cohort observation. ↩
- CFO Investor Day presentation, printed p. 24, approximately 6GW, $220bn equivalent hardware capex and approximately 50% upfront funding reduction. Annual allocation and funding mix in this report are assumptions. ↩
- Individual original prospectus supplements and final pricing sheets are linked in
debt_ladder.csv, with CUSIPs and cover/summary locators. Balances reconcile to FY2026 10-K Note 6, printed pp. 83–84, Q1 debt disclosure, and the November issuance. Fixed coupons are reconstructed from each series’ payment terms; floating future coupons depend on SOFR. ↩ - Oracle 4 November 2026 closing 8-K, Item 8.01; note prospectus, 2 November, cover; common-share prospectus, 2 November, cover. Net proceeds before issuer expenses: $9.9573225bn notes and $9.878500051bn common equity. ↩
- November note prospectus, pp. S-3, S-5–S-6 and S-11, and accompanying base prospectus pp. 13–16; structural subordination disclosure, subsidiary liabilities, limitation-on-liens and sale/leaseback provisions, including exceptions and 25%-of-consolidated-net-worth basket. ↩
- FY2026 10-K Note 6, printed pp. 85–86, credit agreements, term-loan amortization and extension provisions; Q1 FY2027 liquidity discussion. $10bn revolver, maturity 6 March 2031; defined EBITDA/net interest at least 3.0×. Access to the commercial-paper programme depends on finding buyers. A committed bank facility provides a different form of access. ↩
- Oracle final pricing sheets dated 30 January 2025, 24 September 2025, 2 February 2026 and 2 November 2026, each tranche’s expected-ratings row. S&P’s 9 July 2026 downgrade notice confirms the action in its public title; its restricted body is not used for detailed attribution. ↩
- February and November 2026 final pricing sheets above, spread, coupon and maturity rows. “Five-year” is approximate tenor; February 2031 and November 2031 bonds are not the same security. Pricing on November 2, 2026 for the note maturing February 4, 2037 has a term of approximately eleven years. ↩
- Reuters, 11 December 2025, 139bp; Reuters, 15 October 2026, 288bp, both quoting S&P Global Market Intelligence. LSEG/FTSE Russell, published 29 October 2026, reports 331bp on 21 October. These are the limited secondary-source exceptions to primary-document financial inputs. ↩
- Oracle Investor Day release, 28 October 2026, headline guidance and leverage-definition footnote; CFO deck pp. 24–28. Oracle’s debt definition includes vendor financing and recognized leases; this report adds estimated uncommenced leases. ↩
- Oracle mandatory convertible preferred prospectus, 2 February 2026, cover and pp. S-24 onward; FY2026 10-K Note 10, pp. 90–91. $5bn preference, 6.5% cumulative dividend, cash/share settlement options and January 2029 conversion. Q1 total cash dividends already include common and preferred amounts despite the legacy common-dividend XBRL tag. ↩
- FY2026 10-K, Note 1 “Concentrations of Risk,” printed p. 75; risk factors pp. 18–19. Recognized-revenue concentration is historical and does not disclose customer-specific forward RPO. ↩
- Oracle financing plan announcement, 1 February 2026, named OCI customers. Its earlier financing plan is superseded by the transactions that followed. Legal recourse depends on the contract terms. ↩
- OpenAI, Five new Stargate sites, 23 September 2025, updated 22 October 2025, Oracle partnership paragraph. The private company describes its Oracle partnership. ↩
- OpenAI funding announcement, 31 March 2026, funding, revenue and revolver paragraphs; SoftBank completed third tranche, 1 October 2026; OpenAI confidential S-1 announcement, 8 June 2026. No current audited unrestricted cash balance was available in these sources. ↩
- Oracle From the Q4 earnings call, 12 June 2026, utilization and renewal figures; OCI Investor Day deck, 28 October 2026, printed pp. 20–21, multi-tenancy and reallocation. Management describes reuse and operating conditions. ↩
Supporting material
- Excel model ↗Sourced inputs, live calculations and reported outputs.
- Source and model data (CSV collection) ↗Data tables, source references and calculation exports.