Hyperliquid can win without HYPE being cheap.
A $30 central case can still assume an excellent business. The difference is what reaches the token, how long growth lasts, and how many claims share it.

What operating economics would make HYPE worth its price?
Trace retained trading and reserve flows separately, then divide the discounted token-directed cash by the economic claims that share it. In this conditional central case, strong exchange growth supports about $30 per token; dilution and the required return determine how that differs from the illustrative $80 reference.
Evidence: Hyperliquid parent dashboard · Hyperliquid perpetuals dashboard · Perpetuals adapter, pinned implementation
Read this alongside Who owns the cash flow?.
Hyperliquid's next customer may never open its website. A broker can own the interface, a specialist can operate a market, and Hyperliquid can execute the trade. That is the more interesting future: an exchange becoming infrastructure beneath other businesses. Builder codes and permissionless perpetual markets already provide the technical means. S5 S18
But an expanding network is not the same thing as an inexpensive token. My central case assumes $20 trillion of annual perpetual-futures turnover and $4.24 billion of token-directed economic flows in 2031. Growth continues for another five years before maturity. At an 18% required return and conservative full dilution, that supports approximately $30 per HYPE, against an illustrative $80 reference.
The disagreement is about more than growth. Distribution can increase volume while taking a larger share of fees. More efficient collateral can support trading without proportionate reserve income. And token allocations outside the current float can still compete for economic value. Hyperliquid can win on all the product measures that matter and leave an investor with too little return for the price paid.
Scope and assumptions
Research cutoff: October 14, 2026. Dashboard observations are provider-defined rolling windows, not an audited or synchronized accounting close. The $80 reference is rounded, not an executable quote. Future volumes, fees, balances and growth paths are author assumptions. Forecast years end on October 14. Values represent policy-dependent token-directed economic flows, not legal equity, guaranteed dividends, liquidation floors or twelve-month price targets.
What the strongest bullish writing gets right
Artemis's July 2025 valuation separated the exchange from HyperEVM. CoinShares later built a seven-stream framework, with a $147 base-case outcome in 2031 and 707 million tokens. Multicoin's June 2026 report projected roughly $8 billion of 2028 earnings and a $319 token price using approximately 502 million tokens. These are different future outcomes and frameworks, not competing measurements of present value. S12 S13 S14
Their strongest insight is that applications can build around trading activity and collateral that already exist. A blockchain does not have to invent demand after launch. I agree. The harder question is how a larger addressable market becomes a durable stream per token. Market growth, on-chain adoption, preserved fees and favorable dilution can each look plausible; buying their joint realization is a stronger bet.
Multicoin holds trading monetization at 3.28 basis points and grows USDC balances approximately with turnover. It discloses a substantial HYPE investment. CoinShares explicitly avoids a separate future-buyback reduction to supply; that is a useful safeguard, not an error. My principal disagreements concern fee durability, capital efficiency and economic claims. S12 S13
Damodaran's Nvidia analysis after DeepSeek provides the better discipline: translate a changed story into changed market, economic and risk assumptions. Admiration does not settle price. The story tested here is an increasingly useful execution network whose marginal dollar of turnover may earn less than its earlier dollar. S15
A real fee engine, with an accounting trap
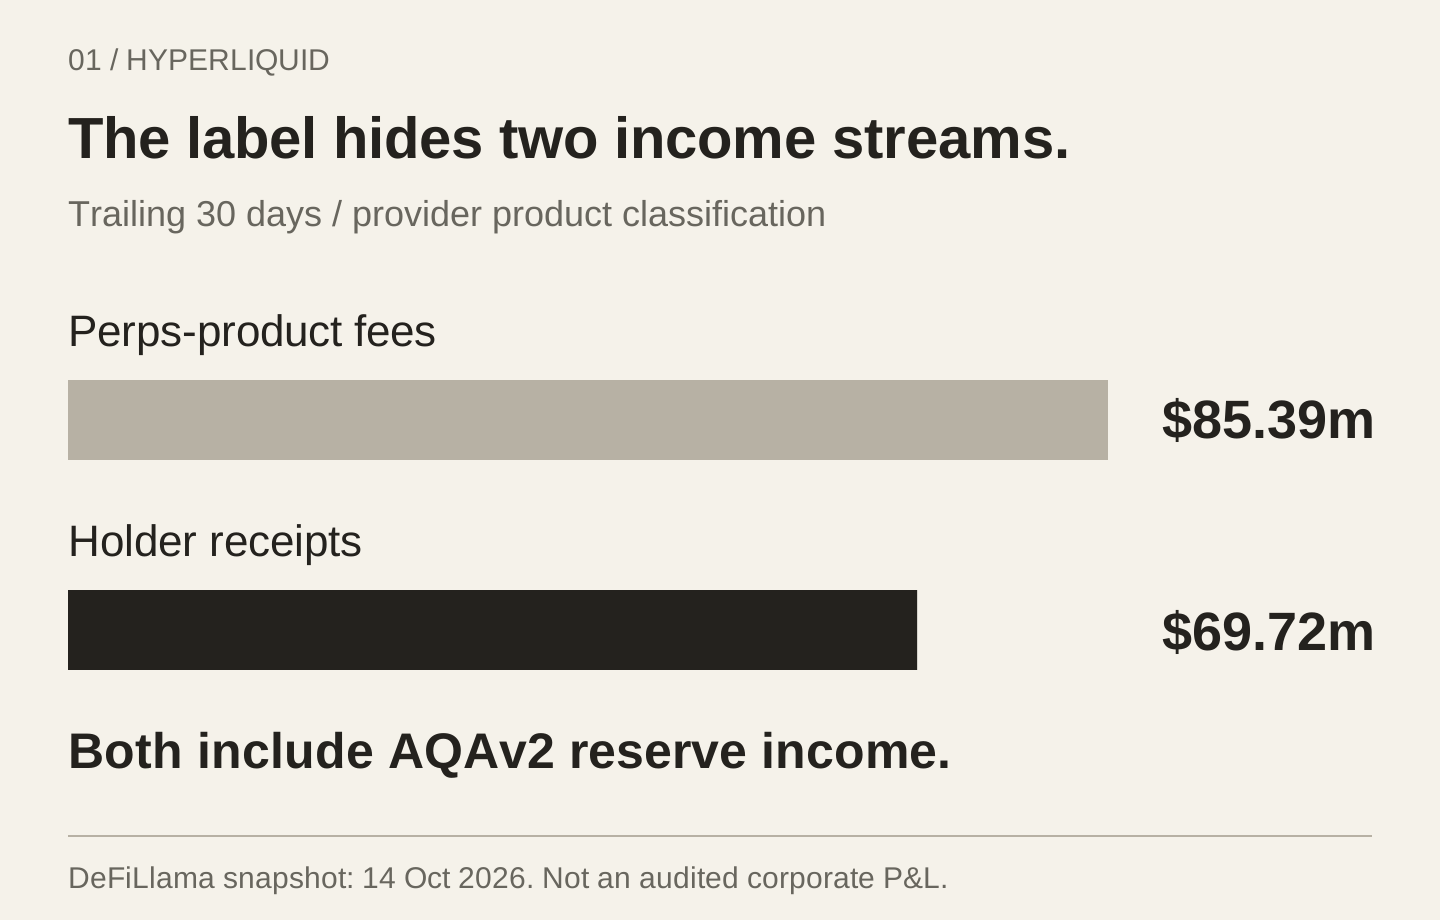
DeFiLlama's perpetuals page displayed $208.687 billion of trailing-30-day turnover, $85.39 million of fees and $69.72 million of holder revenue. The adapter behind that page also adds AQAv2 stablecoin reserve yield to fees and holder revenue. The product label says perpetuals; the numerator contains more than trading. S2 S3
Dividing $69.72 million by $208.687 billion gives 3.34 basis points. That is a mixed-product receipts ratio, not an identified trading take rate. Extrapolating it into trading income and then adding stablecoin yield would count some economics twice. The forecast instead rebuilds each stream independently; its trading rates are assumptions.
Builder payments, deployer economics, maker rebates and the HLP allocation also separate user fees from HYPE-directed receipts. Applying the headline 99% allocation again to an already-net series is another mistake. Neither series establishes corporate payroll, taxes or maintenance investment. On-chain receipts are not an audited company's free cash flow. S3
The parent dashboard also fails a reconciliation: Q3 gross protocol revenue of $224.23 million less $45.42 million of costs exceeds the displayed $173.97 million gross profit by $4.84 million. That remains unexplained, not an invented expense. Even current price fields differ between the page header and FAQ. $80 is therefore a rounded reference, not a purported exact close. S1
| Measure | Value | Boundary |
|---|---|---|
| Perpetual turnover · 30 days | $208.687bn | Crypto and HIP-3 markets |
| Perps-product fees · 30 days | $85.39m | Includes reserve yield |
| Perps-product holder receipts · 30 days | $69.72m | Already net under provider methodology |
| Receipts / turnover | 3.34 bps | NOT a pure trading take rate |
| Turnover × 365 / 30 | $2.54tn | Annualized activity, not a full-year result |
The matched 30-day reserve component has not been independently isolated. S2 S3
Today's buybacks do not underwrite the price
The parent dashboard's $71.65 million of 30-day holder receipts annualizes to approximately $872 million. Against $76.4 billion of fully diluted value, that is 1.14% of value per year. Against circulating value, it is 4.90%. Both ratios describe the same receipts. Neither is a dividend yield paid into a holder's account. S1
A flat-perpetuity thought experiment makes the growth premium visible. Hold that $872 million stream constant indefinitely, allocate it across 955.31 million claims and require 18%: supported value is approximately $5.07 per token. This is not an alternative forecast or a liquidation floor. It strips away growth to show that most of the central valuation already pays for an expansion that has not happened.
The actual mechanics matter. A buyback benefits a selling holder through cash received and a continuing holder through greater scarcity; it does not give both holders the same dollar twice. At a higher repurchase price, a fixed dollar budget retires fewer tokens. Strong buyback announcements can therefore coexist with modest reductions in the remaining claim base.
That also weakens a common comparison with mature exchanges. An equity owner can assess a residual claim after operating costs and corporate obligations. HYPE's observable receipts depend on protocol routing, and a continuing holder receives no contractual distribution. The analogy is useful for understanding monetization; it does not make the legal rights or the return requirement interchangeable.
The next user may never visit Hyperliquid
Builder codes let an interface attach its own fee to an order. HIP-3 lets another operator deploy a perpetual market and control its specifications and pricing inputs. Customer acquisition, product design and execution can consequently belong to different businesses. S5 S18
I expect that separation to matter more than loyalty to a trading homepage. The useful adoption measure becomes persistent fee-paying order flow, not how many customers consciously choose a blockchain. A broker can make the infrastructure disappear from view without making it economically unimportant.
The price of execution is nevertheless larger than the posted exchange fee. It includes spread, slippage, funding, collateral requirements and the risk of an interrupted position. Deeper liquidity can make a higher-fee venue cheaper for a sufficiently large order. That is a credible source of pricing power. Matching software alone is not.
Automation strengthens the distribution opportunity while making routing more price-sensitive. An agent does not care whose interface is familiar. It can compare execution costs across venues. More automated activity can therefore raise turnover without creating proportionate fee income or independent new customers.
Nor are distributors necessarily captive. A broker that owns customers can route elsewhere; market makers can allocate capital across venues. Hyperliquid's defensible advantage must be valuable execution and trusted collateral infrastructure. Assuming both rapid intermediary adoption and unchanged pricing power gives the network the benefit of two potentially conflicting trends.
Fee compression is a disputed premise, not a law. If more applications deepen one shared order book, better execution could outweigh a higher protocol fee. Distributors might then compete away their own margins while Hyperliquid preserves its share. That is the strongest version of the infrastructure thesis: the network owns the scarce liquidity, while interfaces become interchangeable. I would move toward the dominant case if execution quality and retained receipts improved together across changing market conditions. Growing activity by itself cannot distinguish that outcome from cheaper trading bought with lower monetization.
More markets need not mean the same margin
S&P Dow Jones Indices has licensed the S&P 500 to Trade[XYZ] for perpetual contracts on Hyperliquid, describing access for eligible investors. Established data providers can participate in this network. An index license is not stock ownership or permission for every customer in every jurisdiction to trade. S8
The fee rules expose the economic catch. HIP-3 growth mode applies a 0.1 multiplier to protocol fee rates, with deployer settings affecting the all-in customer charge. New markets can produce large notional volume at much lower monetization. Builder and deployer income do not automatically belong to HYPE. S4 S5
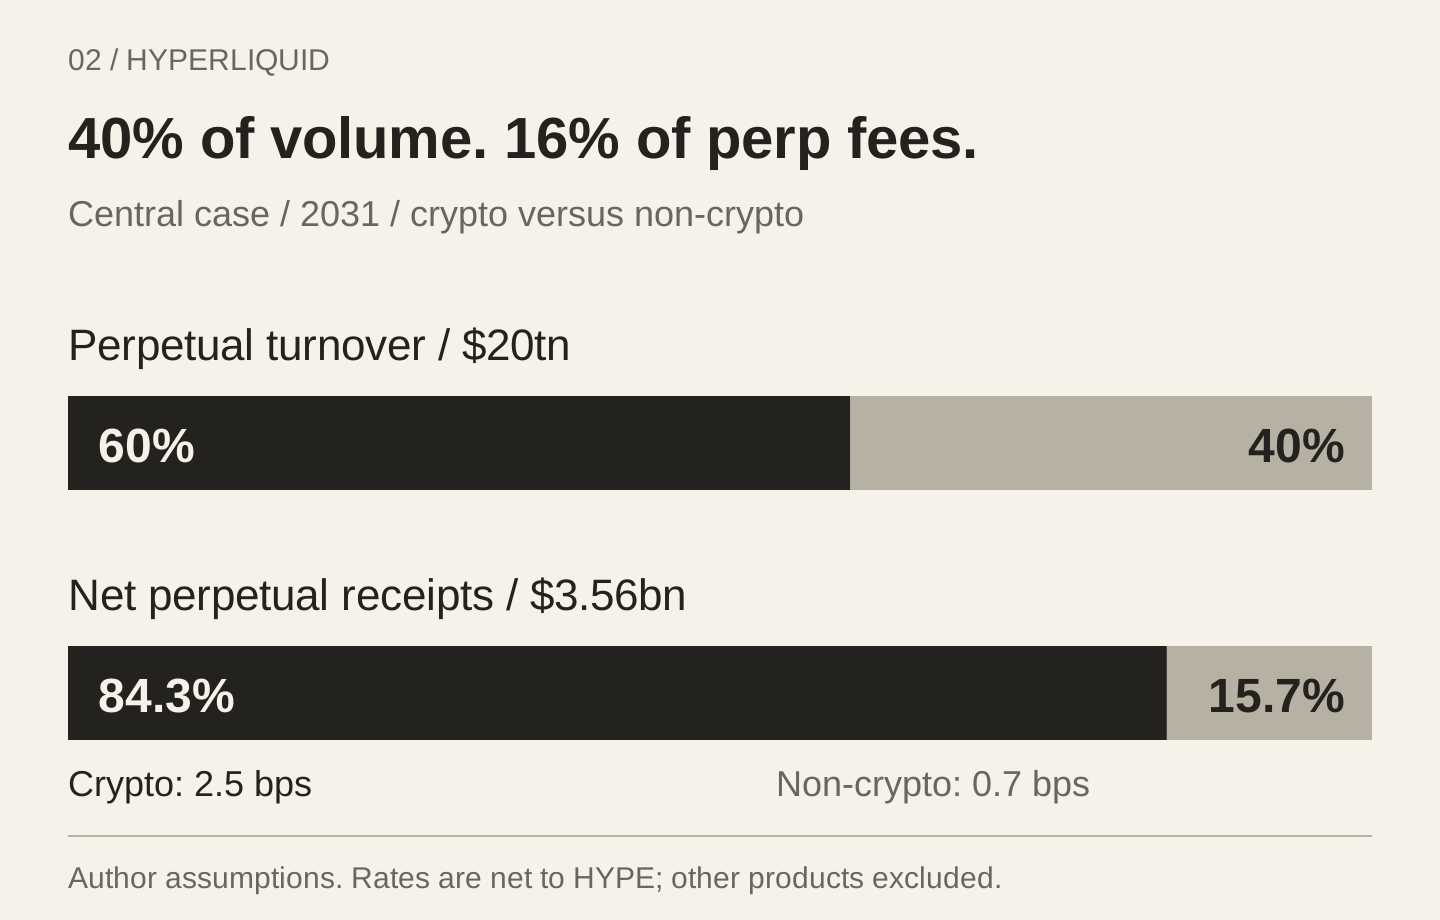
In the central 2031 case, $12 trillion of crypto perpetual turnover at 2.5 net basis points earns $3 billion. Another $8 trillion of non-crypto turnover at 0.7 basis points earns $560 million. Non-crypto markets supply 40% of perpetual turnover but only 16% of its fee stream. The blended rate assumes neither permanent universal subsidies nor effortless repricing.
Removing a 90% fee reduction cannot automatically multiply receipts by ten. Customers can trade less or route elsewhere. At one-tenth the volume, a tenfold fee earns the same revenue before other changes. The investment question is demand after repricing.
HIP-3 also requires 500,000 HYPE of deployer stake, a requirement the documentation says may fall. At $80, that is $40 million tied to entry. It supports token utility but is neither annual revenue nor a permanent burn. A higher token price can make adding markets harder. S5
Collateral is a business. Turnover is not a balance
Coinbase announced in May 2026 that it would become the official USDC treasury deployer on Hyperliquid. Under AQAv2, approximately 90% of cost-adjusted reserve yield associated with eligible on-network supply goes to the protocol. This is income on a defined balance, not ownership of customers' principal. S6 S7
The central case assumes $20 billion of eligible average balance, a 2.5% cost-adjusted yield and a 90% protocol share: $450 million in 2031. The yield is after reserve costs but before the protocol split. Total value locked is not substituted for eligible average stablecoin supply.
Collateral does not grow mechanically with turnover. Better netting and margin efficiency can let the same dollar support more trading. A venue that reduces customer capital requirements can improve its product while earning less reserve income per dollar traded. That possibility is absent from a forecast that scales deposits directly with volume.
A one-percentage-point reserve-yield decline costs $180 million annually at the modeled balance. Trading may offset part of that loss, but no offset is assumed. AQAv2 accrues over 30-day intervals and pays eight days after each interval; accrued yield and cash received are different observations. The dashboard already incorporates this stream. S6
The supply denominator is part of the thesis
At $80, the provider's 222.45 million circulating tokens imply $17.8 billion of circulating value; 955.31 million total tokens imply $76.4 billion. Neither is equity enterprise value. Choosing the denominator can change the apparent bargain before a single business assumption changes. S1
The central allocation recognizes all 955.31 million potential claims. It does not predict that every token circulates by 2031. This is conservative, and a legitimate source of disagreement: allocations might be distributed later, receive no economic participation, or never be issued. A smaller denominator requires evidence for those outcomes.
Locked is not the same as economically nonexistent. A vested owner who cannot sell today may still benefit from future burns. Delaying a transfer does not necessarily eliminate dilution. Conversely, an unallocated incentive reserve is not identical to a legally vested employee grant. Without a reconciled allocation and participation schedule, a precise annual dilution curve would manufacture knowledge.
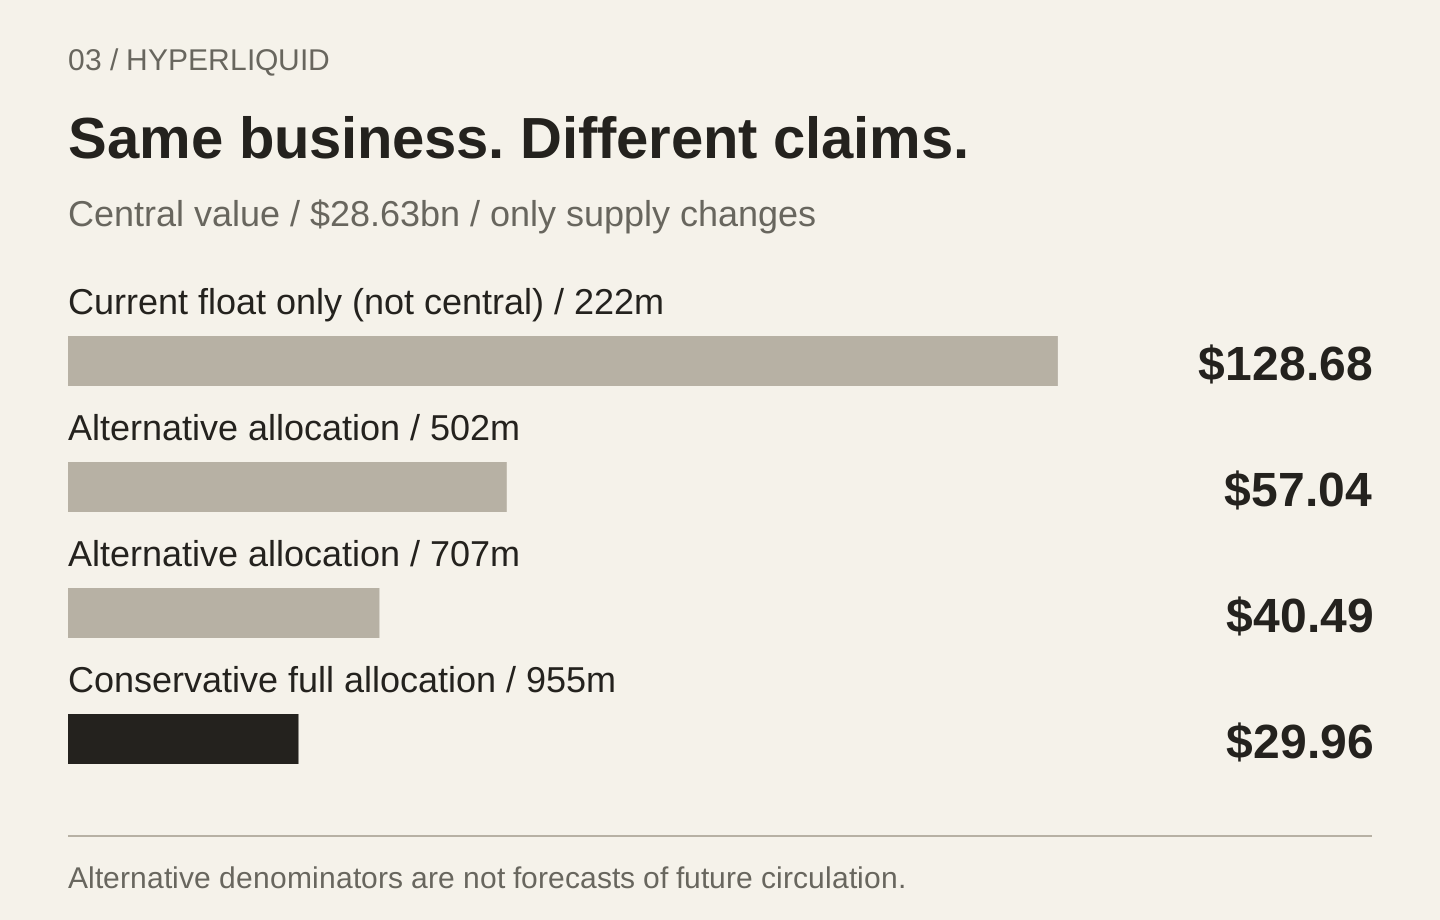
On unchanged operating assumptions, the model yields approximately $30 at 955 million claims, $40 at 707 million and $57 at 502 million. Assigning everything to the current float gives $129, but that ignores competing allocations. The sensitivity is an argument about claims, not a prediction of future free float.
Staking rewards come from the future emissions reserve; they redistribute tokens rather than create external earnings. Unstaking is permitted. Similarly, I capitalize future HYPE-directed flows without also subtracting projected buybacks from supply. A repurchase model can be valid, but issuance, purchase prices and ownership must all reconcile. Customer collateral and HLP assets are not added as treasury cash. S10
A model that lets the business keep growing
The first five annual periods end in 2027–2031. Each separately forecasts crypto perpetuals, non-crypto perpetuals, spot, reserve income, other net fees and hypothetical outcome fees. For unit checking, $1 trillion at one basis point produces $100 million. Modeled trading rates are already net to HYPE. The model values those economic flows conditional on the allocation policies continuing, not a legally enforceable corporate dividend.
The $12 trillion crypto endpoint is $200 trillion of assumed annual crypto-derivatives turnover, multiplied by 20% on-chain penetration and a 30% Hyperliquid share. For scale, CoinGecko measured $86.2 trillion at its top ten centralized perpetual exchanges and $6.7 trillion at its top ten decentralized venues in 2025. Their combined $92.9 trillion is a coverage sample, not a complete global census. S19
Decentralized volume is 7.2% of that combined sample, not the 7.8% DEX-to-CEX ratio: the denominators differ. The central case's 20% assumption therefore demands considerably greater on-chain participation. Its $200 trillion market is a little over twice that historical sample; it is not established by extrapolating the report's incentive-driven growth. The separate $8 trillion non-crypto opportunity is not added into the crypto market denominator.
Spot adds $180 million, reserves $450 million and other fees $50 million to the $3.56 billion perpetual stream, reaching $4.24 billion in 2031. This is already strong execution: annual perpetual turnover approaches eight times the retrieved annualized activity.
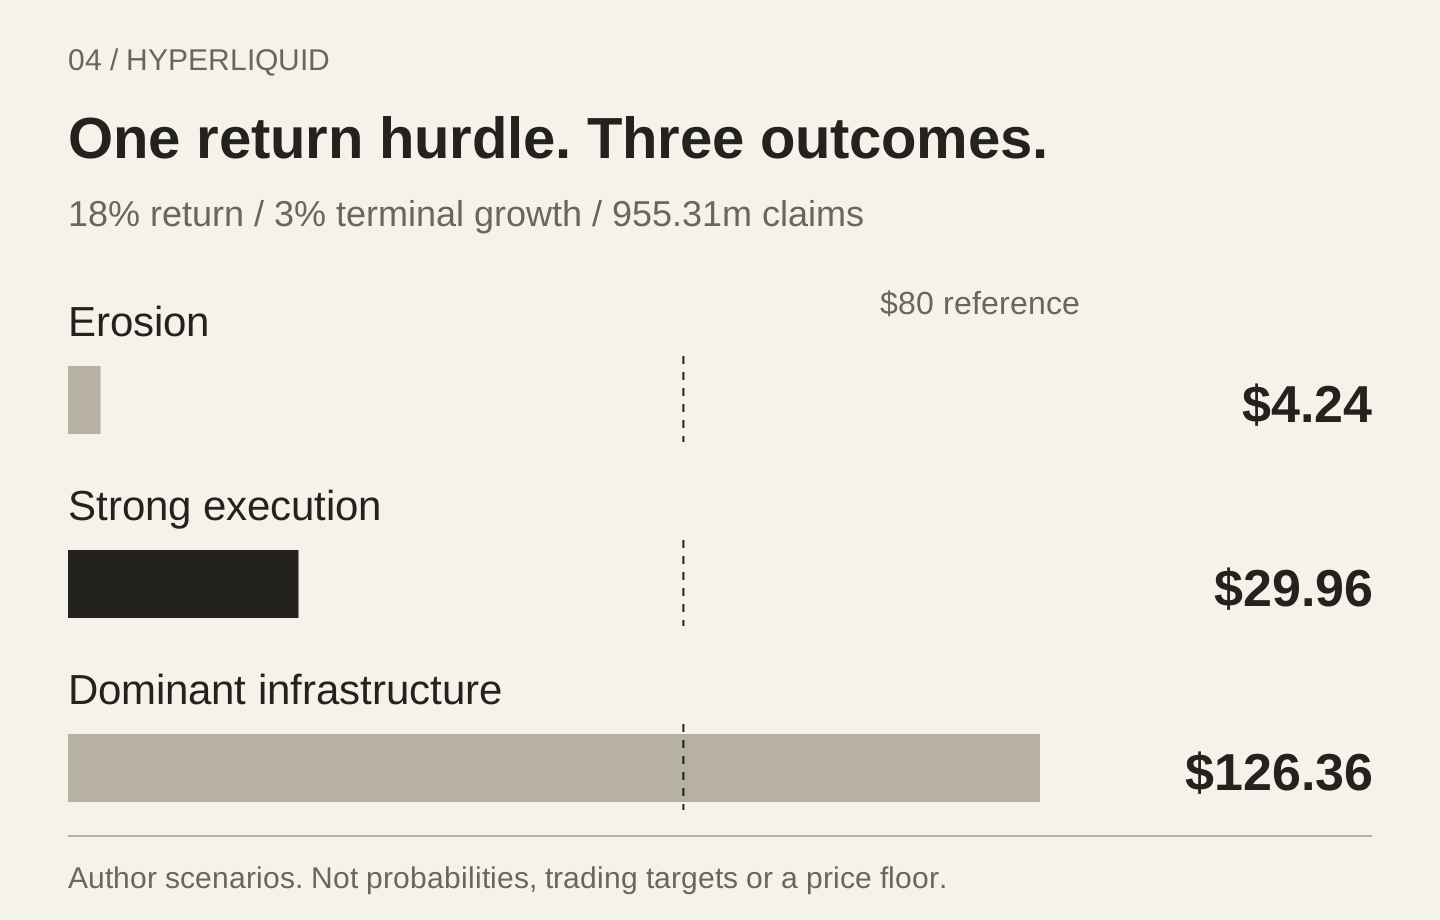
Growth does not abruptly stop there. The central final-year growth rate is 36.7%; a five-year fade to 3% produces $8.94 billion in 2036. All three operating cases use an 18% required return, not a measured public-company WACC, and the same supply allocation. The dominant case reaches $15.03 billion of annual flow in 2031 and $43.30 billion in 2036. The erosion case is not a liquidation floor.
| Driver / output | Erosion | Central | Dominant infrastructure |
|---|---|---|---|
| Crypto perpetual turnover | $2.5tn | $12tn | $28tn |
| Crypto retained fee | 2.2 bps | 2.5 bps | 3.2 bps |
| Non-crypto perpetual turnover | $1.2tn | $8tn | $30tn |
| Non-crypto retained fee | 0.35 bps | 0.7 bps | 1.2 bps |
| Eligible average stablecoin balance | $4bn | $20bn | $50bn |
| Cost-adjusted reserve yield | 1.8% | 2.5% | 3.2% |
| Annual token-directed flow | $0.69bn | $4.24bn | $15.03bn |
| Present value · all modeled claims | $4.0bn | $28.6bn | $120.7bn |
| Value per HYPE | $4.24 | $29.96 | $126.36 |
Same 18% return, 3% terminal growth and 955.31m claims. No probability weights. All annual inputs are downloadable.
Three-quarters of the value arrives after 2031
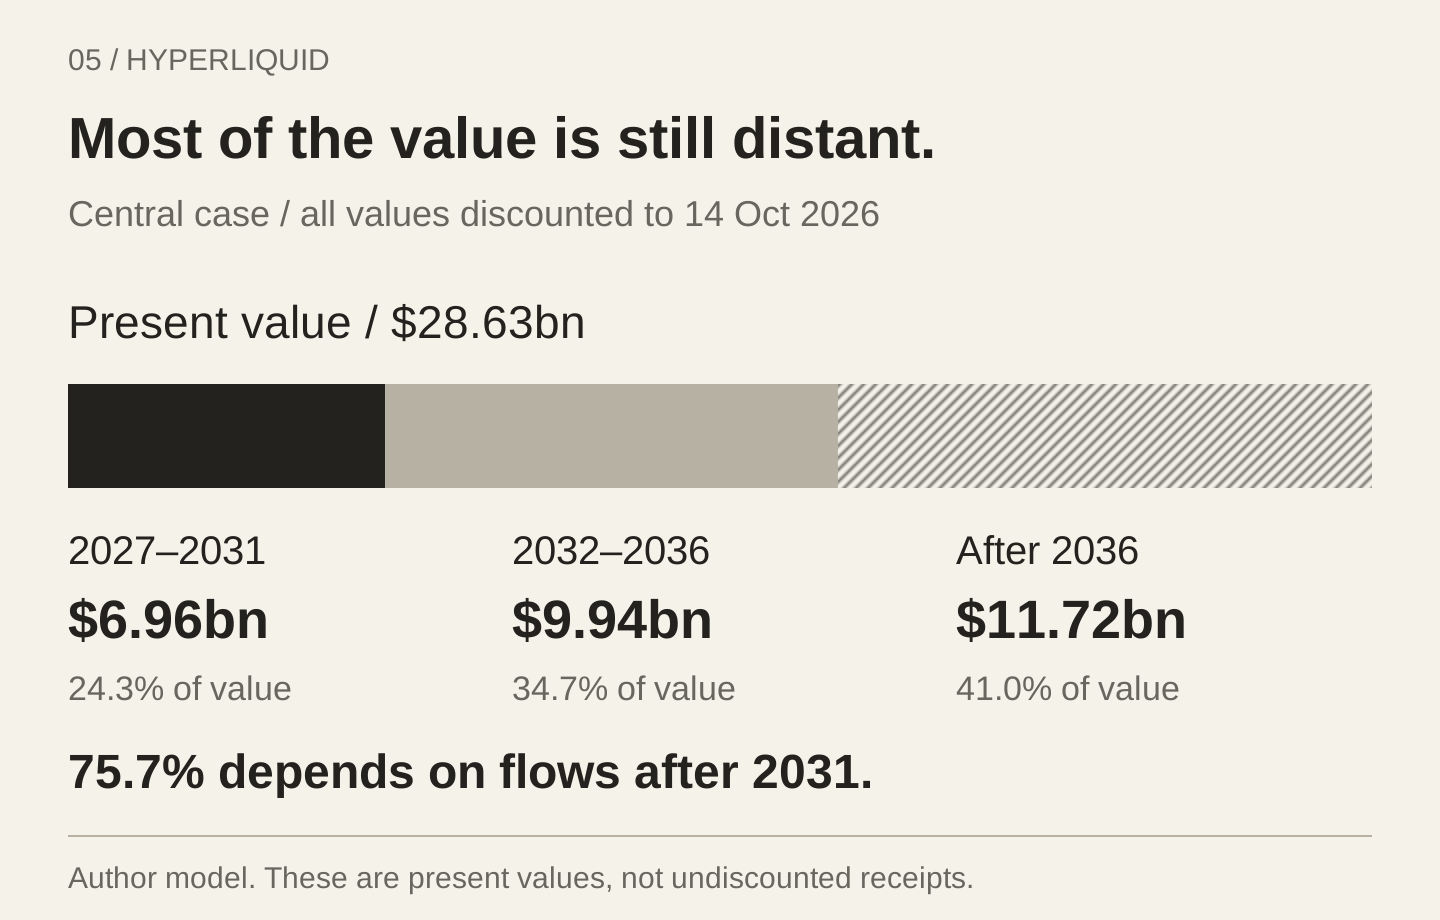
The central value is $28.63 billion. Only $6.96 billion comes from the first five driver-based years. The next five contribute $9.94 billion, and the terminal stream contributes $11.72 billion. Saying that terminal value is 41% of the model understates its dependence on distant assumptions: 75.7% arrives after 2031.
The growth fade is doing investment work, not just smoothing a spreadsheet. Moving straight to 3% growth after 2031 reduces value to $20.61. Postponing the entire original stream by two years gives $21.52 at the same return requirement. That delay test is deliberately mechanical, not a forecast of two years without business activity.
The operating stresses also distinguish scale from economics. Reducing crypto retained fees by one basis point in every explicit year lowers value to $21.59. A one-percentage-point reserve-yield cut produces $28.68. In both tests, the original post-2031 growth path stays fixed; otherwise changing one year's receipts could spuriously change every later year's growth.
A separate 20% diversion of future modeled receipts gives $23.97. This does not deduct today's recipient shares twice. It asks what happens if future security, development or distribution requires an additional claim on the stream. Full dilution recognizes a finite token budget; it cannot finance an infinite operating life by itself. The necessary eventual funding mix remains unknown.
The stresses are not probabilities and should not be stacked into an apparent confidence interval. Fee cuts can stimulate volume; a product delay can preserve scarce development resources; a better-funded network might warrant a lower return requirement. The isolated tests deliberately hold those responses constant to expose first-order valuation sensitivity. They answer what each assumption costs, not how the entire business would react. Likewise, the 18% return requirement is not a measured annual failure probability. Combining a punitive discount rate with a separately invented collapse probability would need an explicit risk framework, not another arbitrary haircut.
| Change | Value / HYPE |
|---|---|
| Unchanged central case | $29.96 |
| Crypto retained fees −1 bp | $21.59 |
| Non-crypto retained fees −0.25 bp | $28.61 |
| Reserve yield −1 percentage point | $28.68 |
| 20% of future receipts redirected | $23.97 |
| Entire stream delayed two years | $21.52 |
| Stable growth immediately after 2031 | $20.61 |
Fee/yield shocks affect each of the first five years; the unshocked growth-fade anchor stays fixed. Tests are independent, not cumulative.
What $80 asks the network to earn
At $80 and 955.31 million claims, reference value is $76.4 billion. Starting with $872 million of annualized parent holder receipts, the reverse model requires approximately 60% annual flow growth for five years, followed by the same fade method. Flow reaches $9.1 billion in 2031 and $27.6 billion in 2036. That starting benchmark already contains reserve income. S1
This is an equivalent aggregate growth path, not a product forecast. Earning $9.1 billion entirely at 2.5 basis points would require approximately $36.5 trillion of annual turnover. Reserves reduce that trading requirement; a lower-fee market mix increases it.
There is a less spectacular route to $80: keep the central operating forecast, use a 12% required return and allocate value across 707 million claims. The result is $79.62. A lower return hurdle alone gives $58.92; the smaller denominator alone gives $40.49. Neither individually explains the reference price.
That is the strongest counterargument to the central valuation. The market might be anticipating a safer claim and fewer participating tokens, rather than vastly more trading. I would need evidence for both concessions before accepting them together. The $30 estimate is conditional on conservative claim allocation, not a claim that the market must converge to it.
An additional reverse check leaves every central operating and supply assumption intact and solves for the return requirement instead. The $80 reference clears at approximately 10.04%, versus the 18% hurdle used here. That is the discount rate consistent with this conditional stream, not a forecast of realized token returns. A buyer comfortable with that return requirement can rationally reach a different conclusion without changing the volume forecast.
The distinction prevents a valuation gap from becoming a false trading signal. Price can also reflect utility, a different path of token participation or a different assessment of the opportunity. The model does not identify a catalyst that forces convergence. My objection is the compensation for uncertainty under the modeled claim, not a prediction that the token must fall to $30 on a particular date.
HYPE also has utility through staking, deployment and fee discounts. Those benefits are not assumed worthless. They are simply not an unmeasured plug for the valuation gap. A discount saves a trader money; it is not another dollar of exchange profit. Utility, buybacks and economic flows must not be capitalized repeatedly.
| Required return | 955.31m claims | 707m claims |
|---|---|---|
| 12% | $58.92 | $79.62 |
| 15% | $40.55 | $54.80 |
| 18% | $29.96 | $40.49 |
| 21% | $23.20 | $31.35 |
| 24% | $18.58 | $25.10 |
3% terminal growth. Economic-supply alternatives are not circulating-supply forecasts. Full terminal-growth sensitivities remain in the original results file.
The failure modes that matter
The largest operating risk is not running out of assets to list. It is losing retained economics as professional distributors and market makers gain bargaining power. On $12 trillion of annual crypto turnover, one basis point is $1.2 billion of annual receipts. A new listing matters less than the price of persistent execution.
Market design can also affect retention. Auto-deleveraging can close profitable counterparties against an underwater account. That supports platform solvency without making customer disruption costless. HIP-3's slashable deployer stake is not customer insurance: the documentation says slashed tokens are burned. A loss of confidence can reduce trading and deposits together, so reserve income is not fully independent diversification. S11 S5
The incumbents can respond. CME reported $1.7 billion of Q2 2026 revenue, $1.1 billion of operating income and $238 million of market-data revenue, alongside initiatives including 24/7 one-ounce gold contracts. Those are not HYPE valuation multiples. They demonstrate diversified monetization and an ability to change the product rather than remain a static target. S16
Outcome markets deserve similar restraint. The main fee documentation describes outcome charges, while the HIP-4 proposal page still discusses zero-fee testing. DeFiLlama displays small outcome receipts. The central case grants no material contribution; that is a conservative forecast choice, not a claim that no fees exist. The bull case includes hypothetical future income. S4 S9 S1
A better business is not a margin of safety
My expectation is a larger network, more third-party distribution and a broader set of traded exposures, with turnover growing faster than retained fees. That can be an excellent infrastructure business. The question is which economic claims an investor actually buys, and how much future success the price requires.
The forecasts imply observable milestones. By 2028, the central crypto case requires $4.2 trillion of annual turnover at 3.0 net basis points, or $1.26 billion of annual receipts before the separately modeled reserves. That corresponds to roughly $105 million per month of crypto-only trading receipts. A headline protocol number that includes reserve income or non-crypto activity cannot establish that milestone.
For non-crypto markets, the 2031 case requires about $21.9 billion of average daily turnover at the assumed fee mix. I would look for sustained trading after incentives change, not simply more deployed tickers. In collateral, the needed measure is average eligible stablecoin supply, not a quarter-end balance or a broad TVL total. If the reported data cannot isolate those measures, the forecast remains less testable rather than more convincing.
These checks separate three different reasons to revise value. More persistent fee-paying activity changes the business forecast. A documented reduction in competing allocations changes the denominator. Better evidence of durable market access, security and fee policy changes the risk assessment. Raising all three together after a strong month would silently triple-count the same encouraging news. The interactive model keeps those assumptions separate so each favorable revision has to earn its place.
I would upgrade the operating case for fee-paying activity that survives incentive removal, more resilient all-in execution costs, and retained fees that hold as distributors expand. I would reduce the dilution assumption only for documented changes in participating allocations. Improved security and market access would support a lower return requirement; record volume alone would not.
The central $30 value already depends heavily on the distant future. Against $80, it does not establish a margin of safety. A favorable view of the network is defensible. Calling its token cheap requires a separate argument about durable monetization, economic supply and risk.
Assumptions
- Five driver-based annual forecasts end in 2027–2031. Five further years fade growth to 3% in 2036; terminal flows begin in 2037.
- All operating scenarios use an 18% required return and 955.31 million economic claims. Supply and return assumptions are tested separately.
- Trading rates are already net to HYPE. Reserve yield is modeled once. Future buybacks do not receive a second benefit through a shrinking denominator.
- Isolated fee and reserve shocks retain the unshocked scenario’s growth-fade anchor. A diversion is an additional hypothetical future policy change, not a second deduction of existing recipient shares.
- 955.31 million is a conservative total-supply allocation, not a prediction of 2031 circulation. Unstaking, vesting, transfer and sale are different events.
Sources
- Hyperliquid parent dashboard
DeFiLlama · Accessed 2026-10-14
Verified Oct 14, 2026
Rolling receipts, supply conventions and unreconciled Q3 totals; fields are not synchronized or audited.
- Hyperliquid perpetuals dashboard
DeFiLlama · Accessed 2026-10-14
Verified Oct 14, 2026
30-day turnover $208.687bn, fees $85.39m and holder receipts $69.72m; includes reserve yield.
- Perpetuals adapter, pinned implementation
DeFiLlama · Accessed 2026-10-14
Verified Oct 14, 2026
AQAv2 yield enters fees, revenue and holder revenue. Code inspection is not an independent indexer rerun.
- Trading fees
Hyperliquid · Accessed 2026-10-14
Verified Oct 14, 2026
Fee tiers, growth-mode multiplier, recipient allocation and outcome-fee rules; not a measured blended take rate.
- HIP-3: builder-deployed perpetuals
Hyperliquid · Accessed 2026-10-14
Verified Oct 14, 2026
Market deployment, 500k HYPE bond and burn treatment of slashed stake; not universal regulatory authorization.
- Aligned quote assets: AQAv2
Hyperliquid · Accessed 2026-10-14
Verified Oct 14, 2026
Approximately 90% of cost-adjusted reserve yield; eligibility, accrual and payment mechanics. Forecast balances are assumptions.
- Coinbase and Hyperliquid: USDC integration
Coinbase · Accessed 2026-10-14
Verified Oct 14, 2026
May 14, 2026 company announcement; not a guarantee of forecast reserve income.
- S&P 500 licensing to Trade[XYZ]
S&P Dow Jones Indices · Accessed 2026-10-14
Verified Oct 14, 2026
Licensed perpetual exposure for eligible investors; not equity ownership or universal market access.
- HIP-4: outcome markets
Hyperliquid · Accessed 2026-10-14
Verified Oct 14, 2026
Proposal testing language differs from the fee page and provider receipts. Zero central contribution is a forecast choice.
- HYPE staking
Hyperliquid · Accessed 2026-10-14
Verified Oct 14, 2026
Unstaking mechanics and emissions-funded rewards; locked tokens are not permanently burned.
- Auto-deleveraging
Hyperliquid · Accessed 2026-10-14
Verified Oct 14, 2026
Profitable counterparties may be closed to support solvency; customer disruption remains possible.
- Hyperliquid primer and five-year valuation framework
CoinShares · Accessed 2026-10-14
Verified Oct 14, 2026
June 2, 2026 research; 2031 outcome, 707m denominator and no second future-buyback benefit.
- Hyperliquid analysis and valuation
Multicoin Capital · Accessed 2026-10-14
Verified Oct 14, 2026
June 25, 2026, pages 39–41; 2028 forecast and ~502m claims. Authors disclose a substantial HYPE investment.
- Hyperliquid: a valuation model and bull case
Artemis · Accessed 2026-10-14
Verified Oct 14, 2026
July 2, 2025 exchange/HyperEVM framework; not a current multiple source.
- DeepSeek crashes the AI party
Aswath Damodaran · Accessed 2026-10-14
Verified Oct 14, 2026
January 2025 Nvidia valuation essay; methodological context, not a trading comparable.
- CME Group Q2 2026 results
CME Group · Accessed 2026-10-14
Verified Oct 14, 2026
July 22, 2026 results; corporate operating income is not comparable to protocol holder receipts.
- Builder codes
Hyperliquid · Accessed 2026-10-14
Verified Oct 14, 2026
Interface fees are a separate recipient stream, not automatically HYPE income.
- 2025 Annual Crypto Industry Report
CoinGecko · Accessed 2026-10-14
Verified Oct 14, 2026
Top-ten centralized and decentralized perpetual-exchange samples, not a global census or synchronized 2026 baseline. Incentives affect volume quality.
Supporting material
- Explore and stress-test the valuation
Change fees, reserve yield, future allocations, timing and growth maturity; share an exact assumption set.
- Reproduce the original valuation
Standard-library Python. Save inputs.json alongside the script.
- Reproduce the operating stresses
Independent Python implementation of fee, yield, timing, allocation and duration tests.
- Model assumptions
Original annual driver assumptions and observed-field boundaries.
- Original calculated results
Baseline cases, reverse valuation and discount/terminal-growth sensitivities.
- Stress-test results
Full-precision independent stress calculations and present-value decomposition.
- Annual scenario cash flows
Original ten-year annual flows for the three scenarios.