Financial systems
Can Dell earn its cost of capital on AI servers?
At a 5% operating margin, Dell’s AI server business can earn its cost of capital if customer financing stays modest.
Dell’s AI server business can create substantial economic value at a mid-single-digit operating margin, provided customer financing and other invested capital remain modest relative to annual sales. The public accounts do not disclose enough AI-specific capital or profit to prove its return on invested capital. That limit is the central finding of this report.
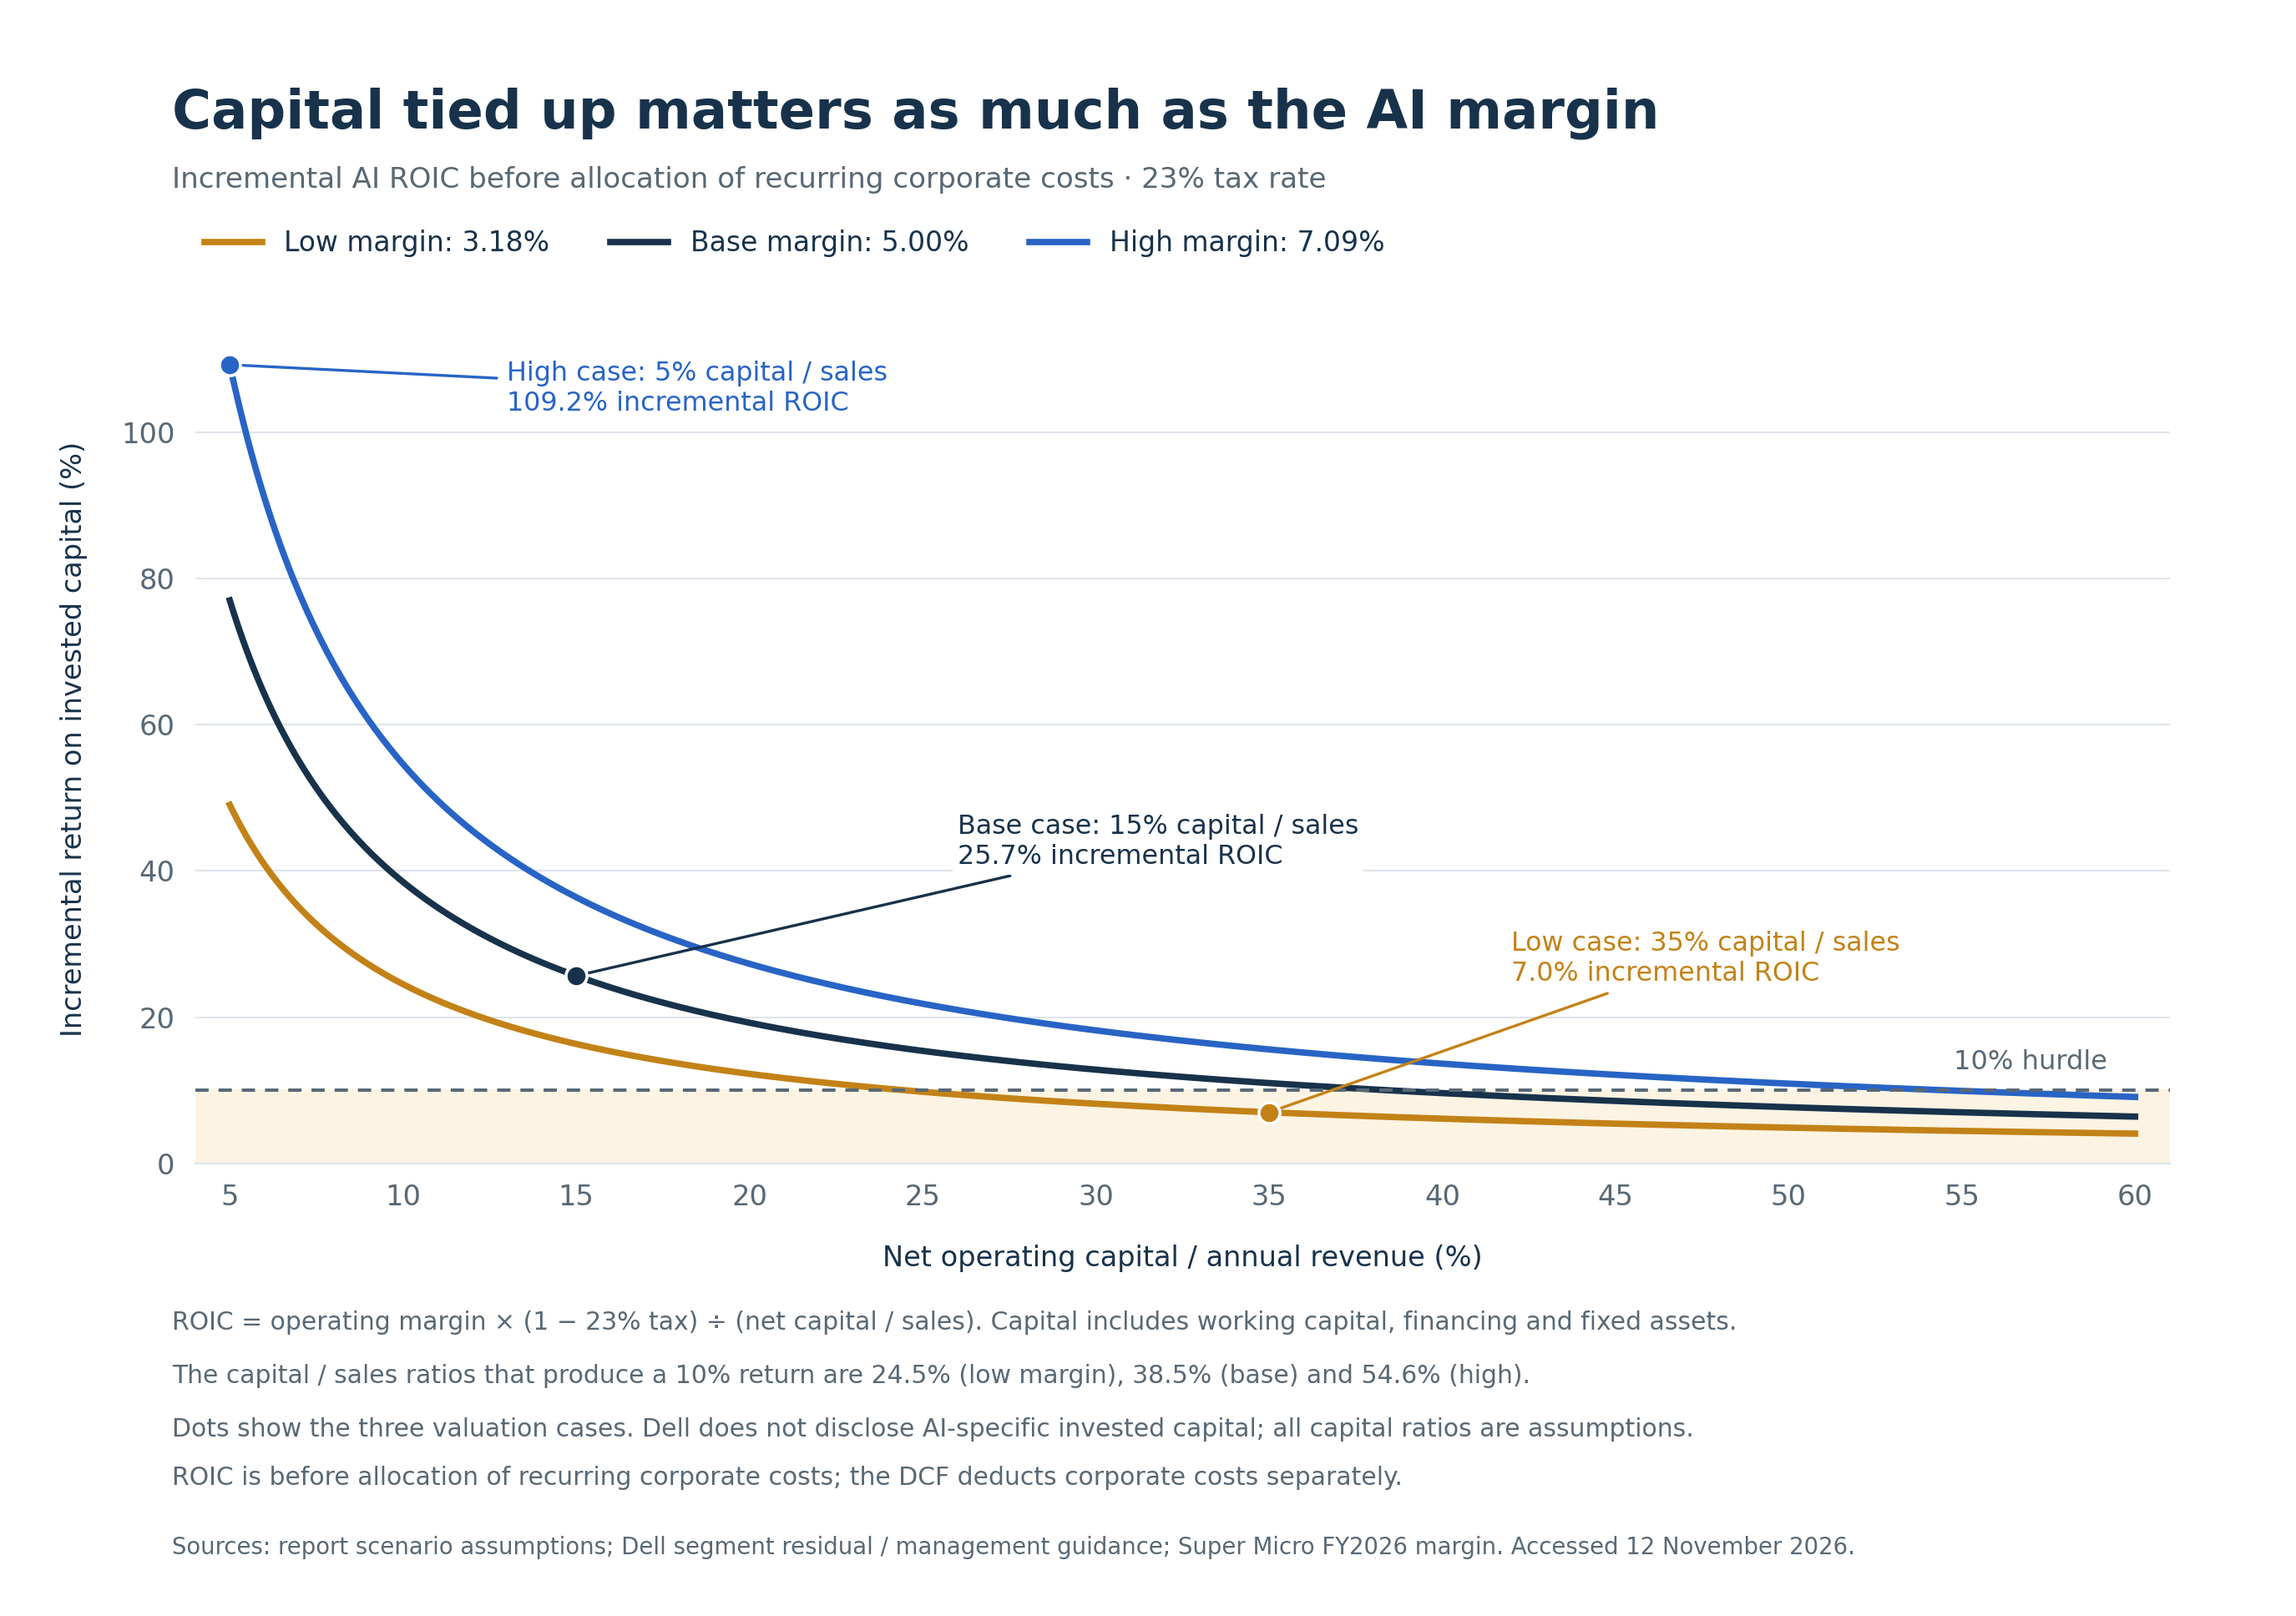
At a modeled 5% operating margin, a 23% tax rate, and net capital equal to 15% of annual sales, incremental after-tax return on invested capital is 25.7%, comfortably above the report’s 10% hurdle. At a 3.18% margin and capital equal to 35% of sales, it falls to 7.0%. These returns are before allocation of recurring corporate costs, which the full valuation deducts at the company level. Both calculations are reproducible model assumptions. Dell leaves those returns undisclosed.
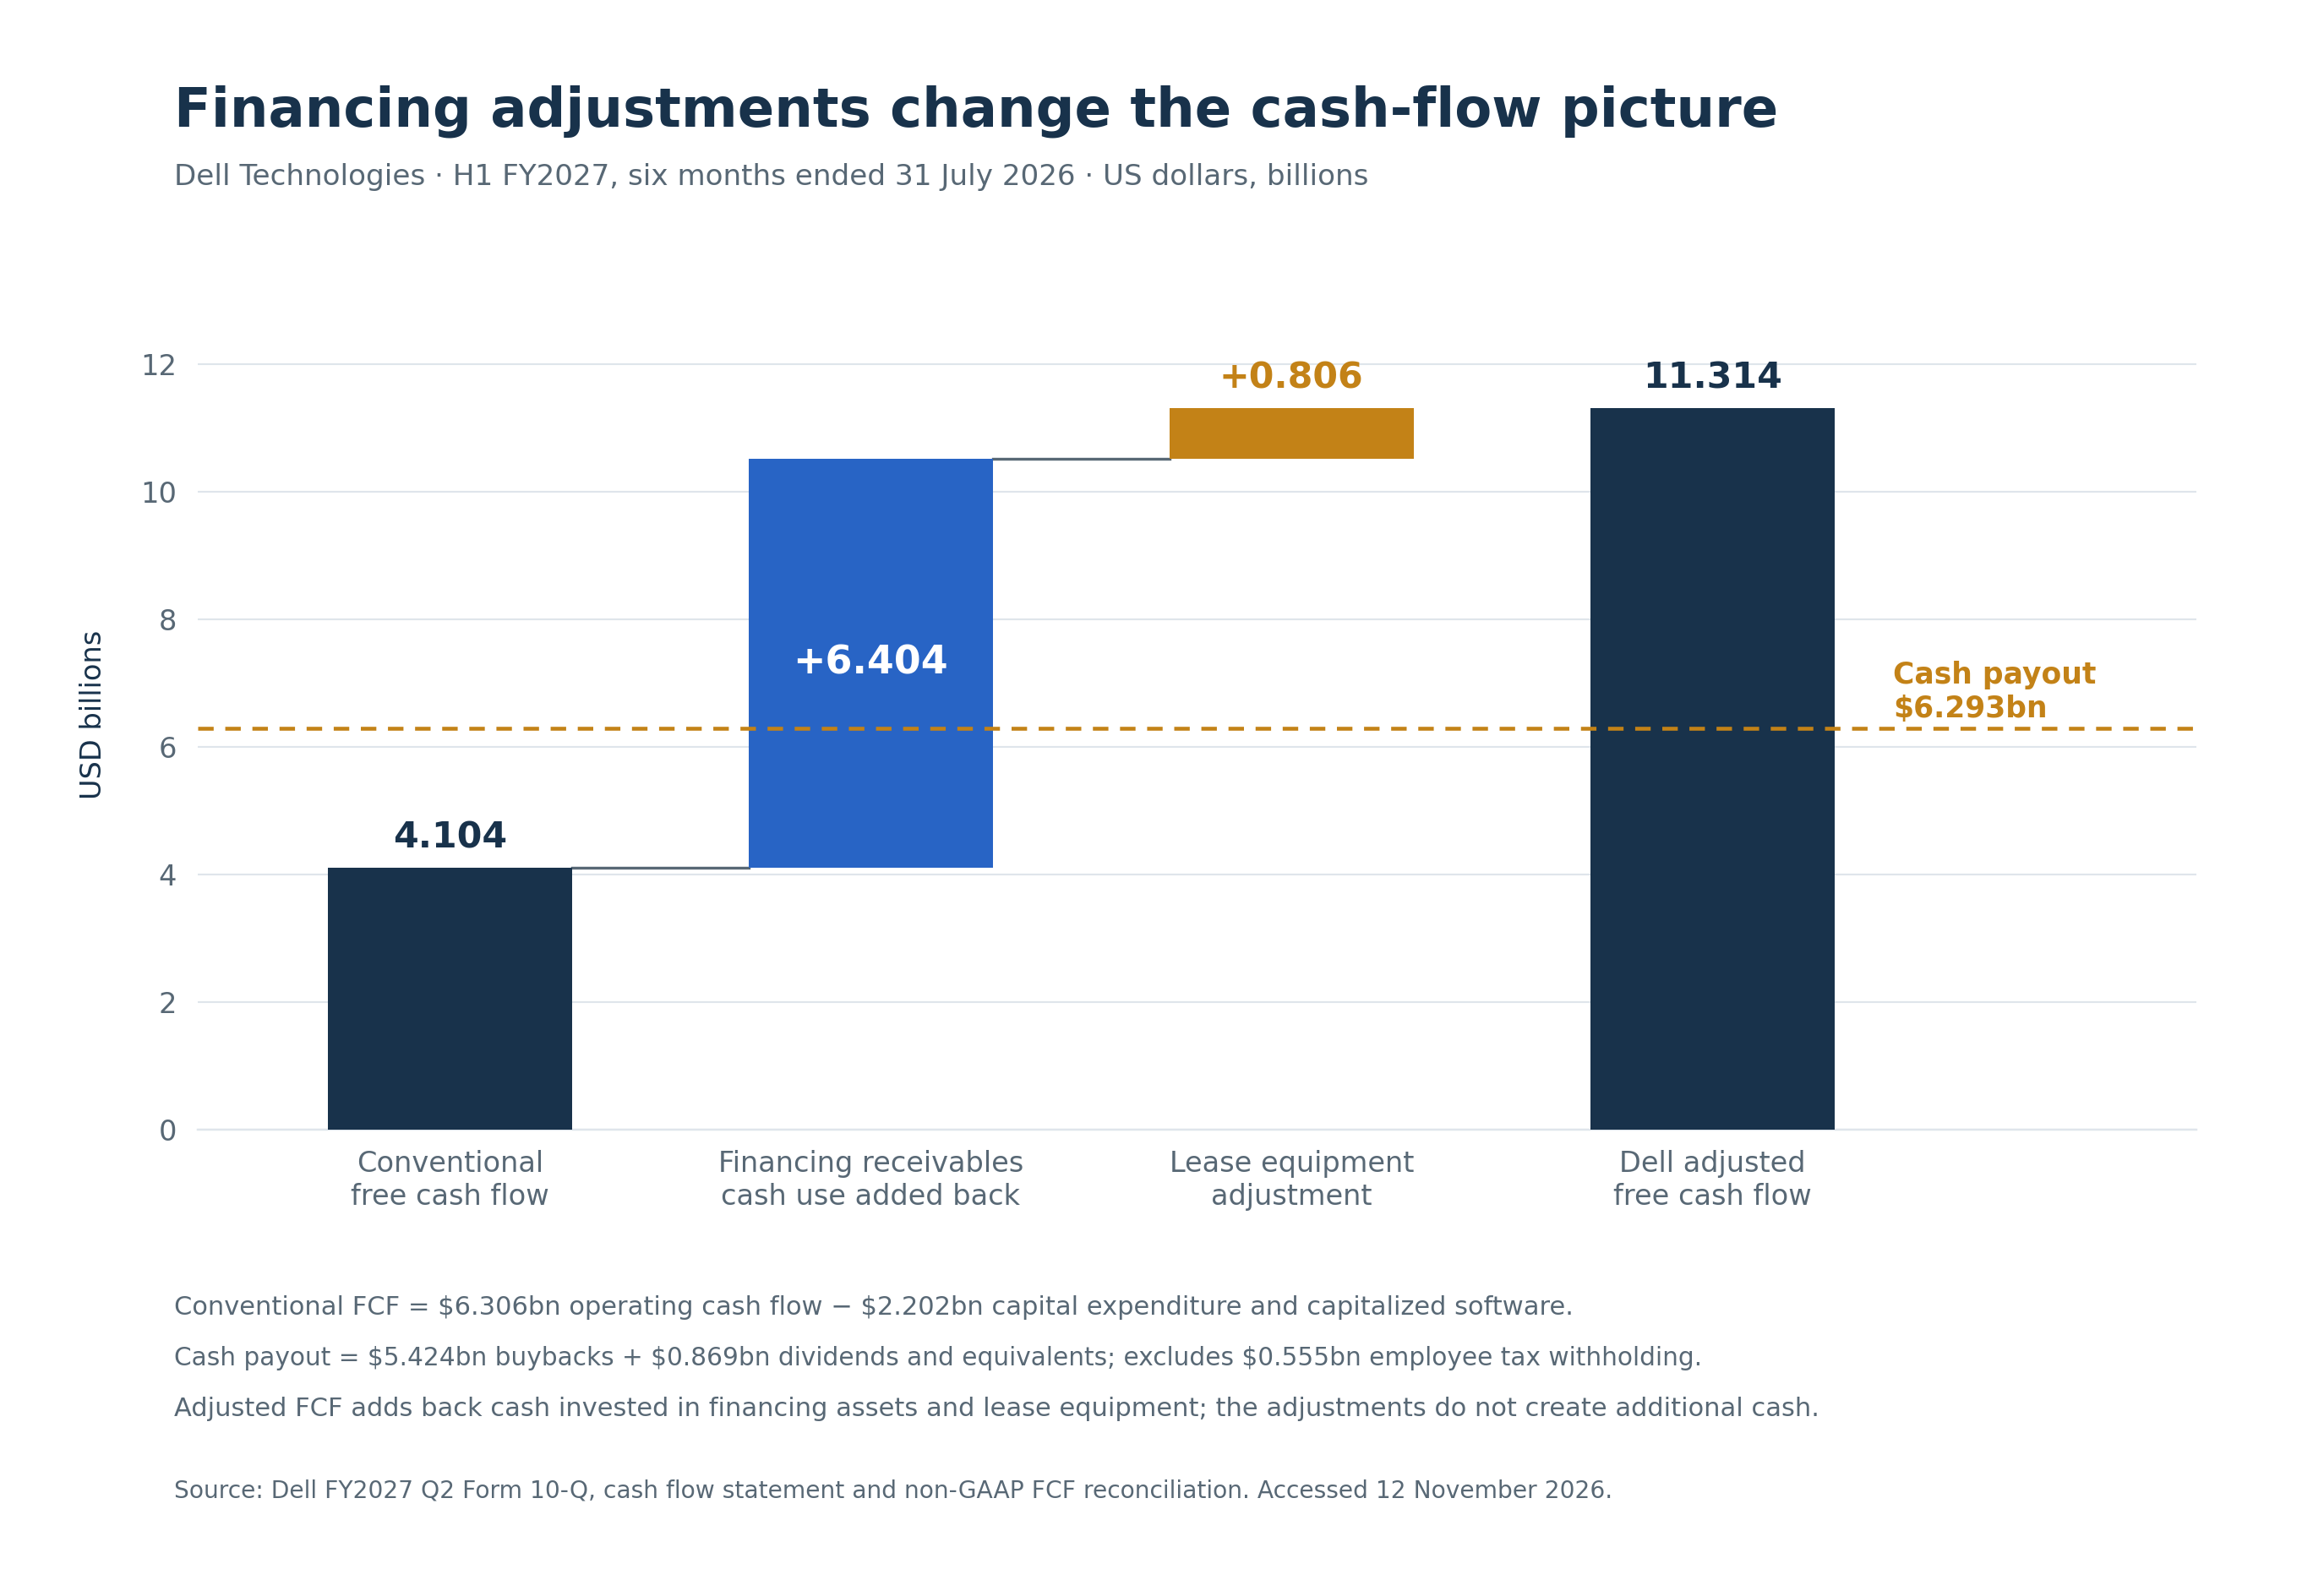
There is real cash generation, but the financing adjustment is material. In the first half of fiscal 2027, Dell reported $6.306 billion of operating cash flow and $4.104 billion of free cash flow after capital expenditure. Dell reaches $11.314 billion of adjusted free cash flow by adding $6.404 billion for financing receivables and $806 million for leased equipment. The leased-equipment adjustment nets capital expenditure against depreciation. Buybacks, dividends and dividend equivalents consumed $6.293 billion, exceeding the half’s unadjusted free cash flow. Dell’s disclosures explain the adjustment; it should not be mistaken for cash left after funding customers.q27
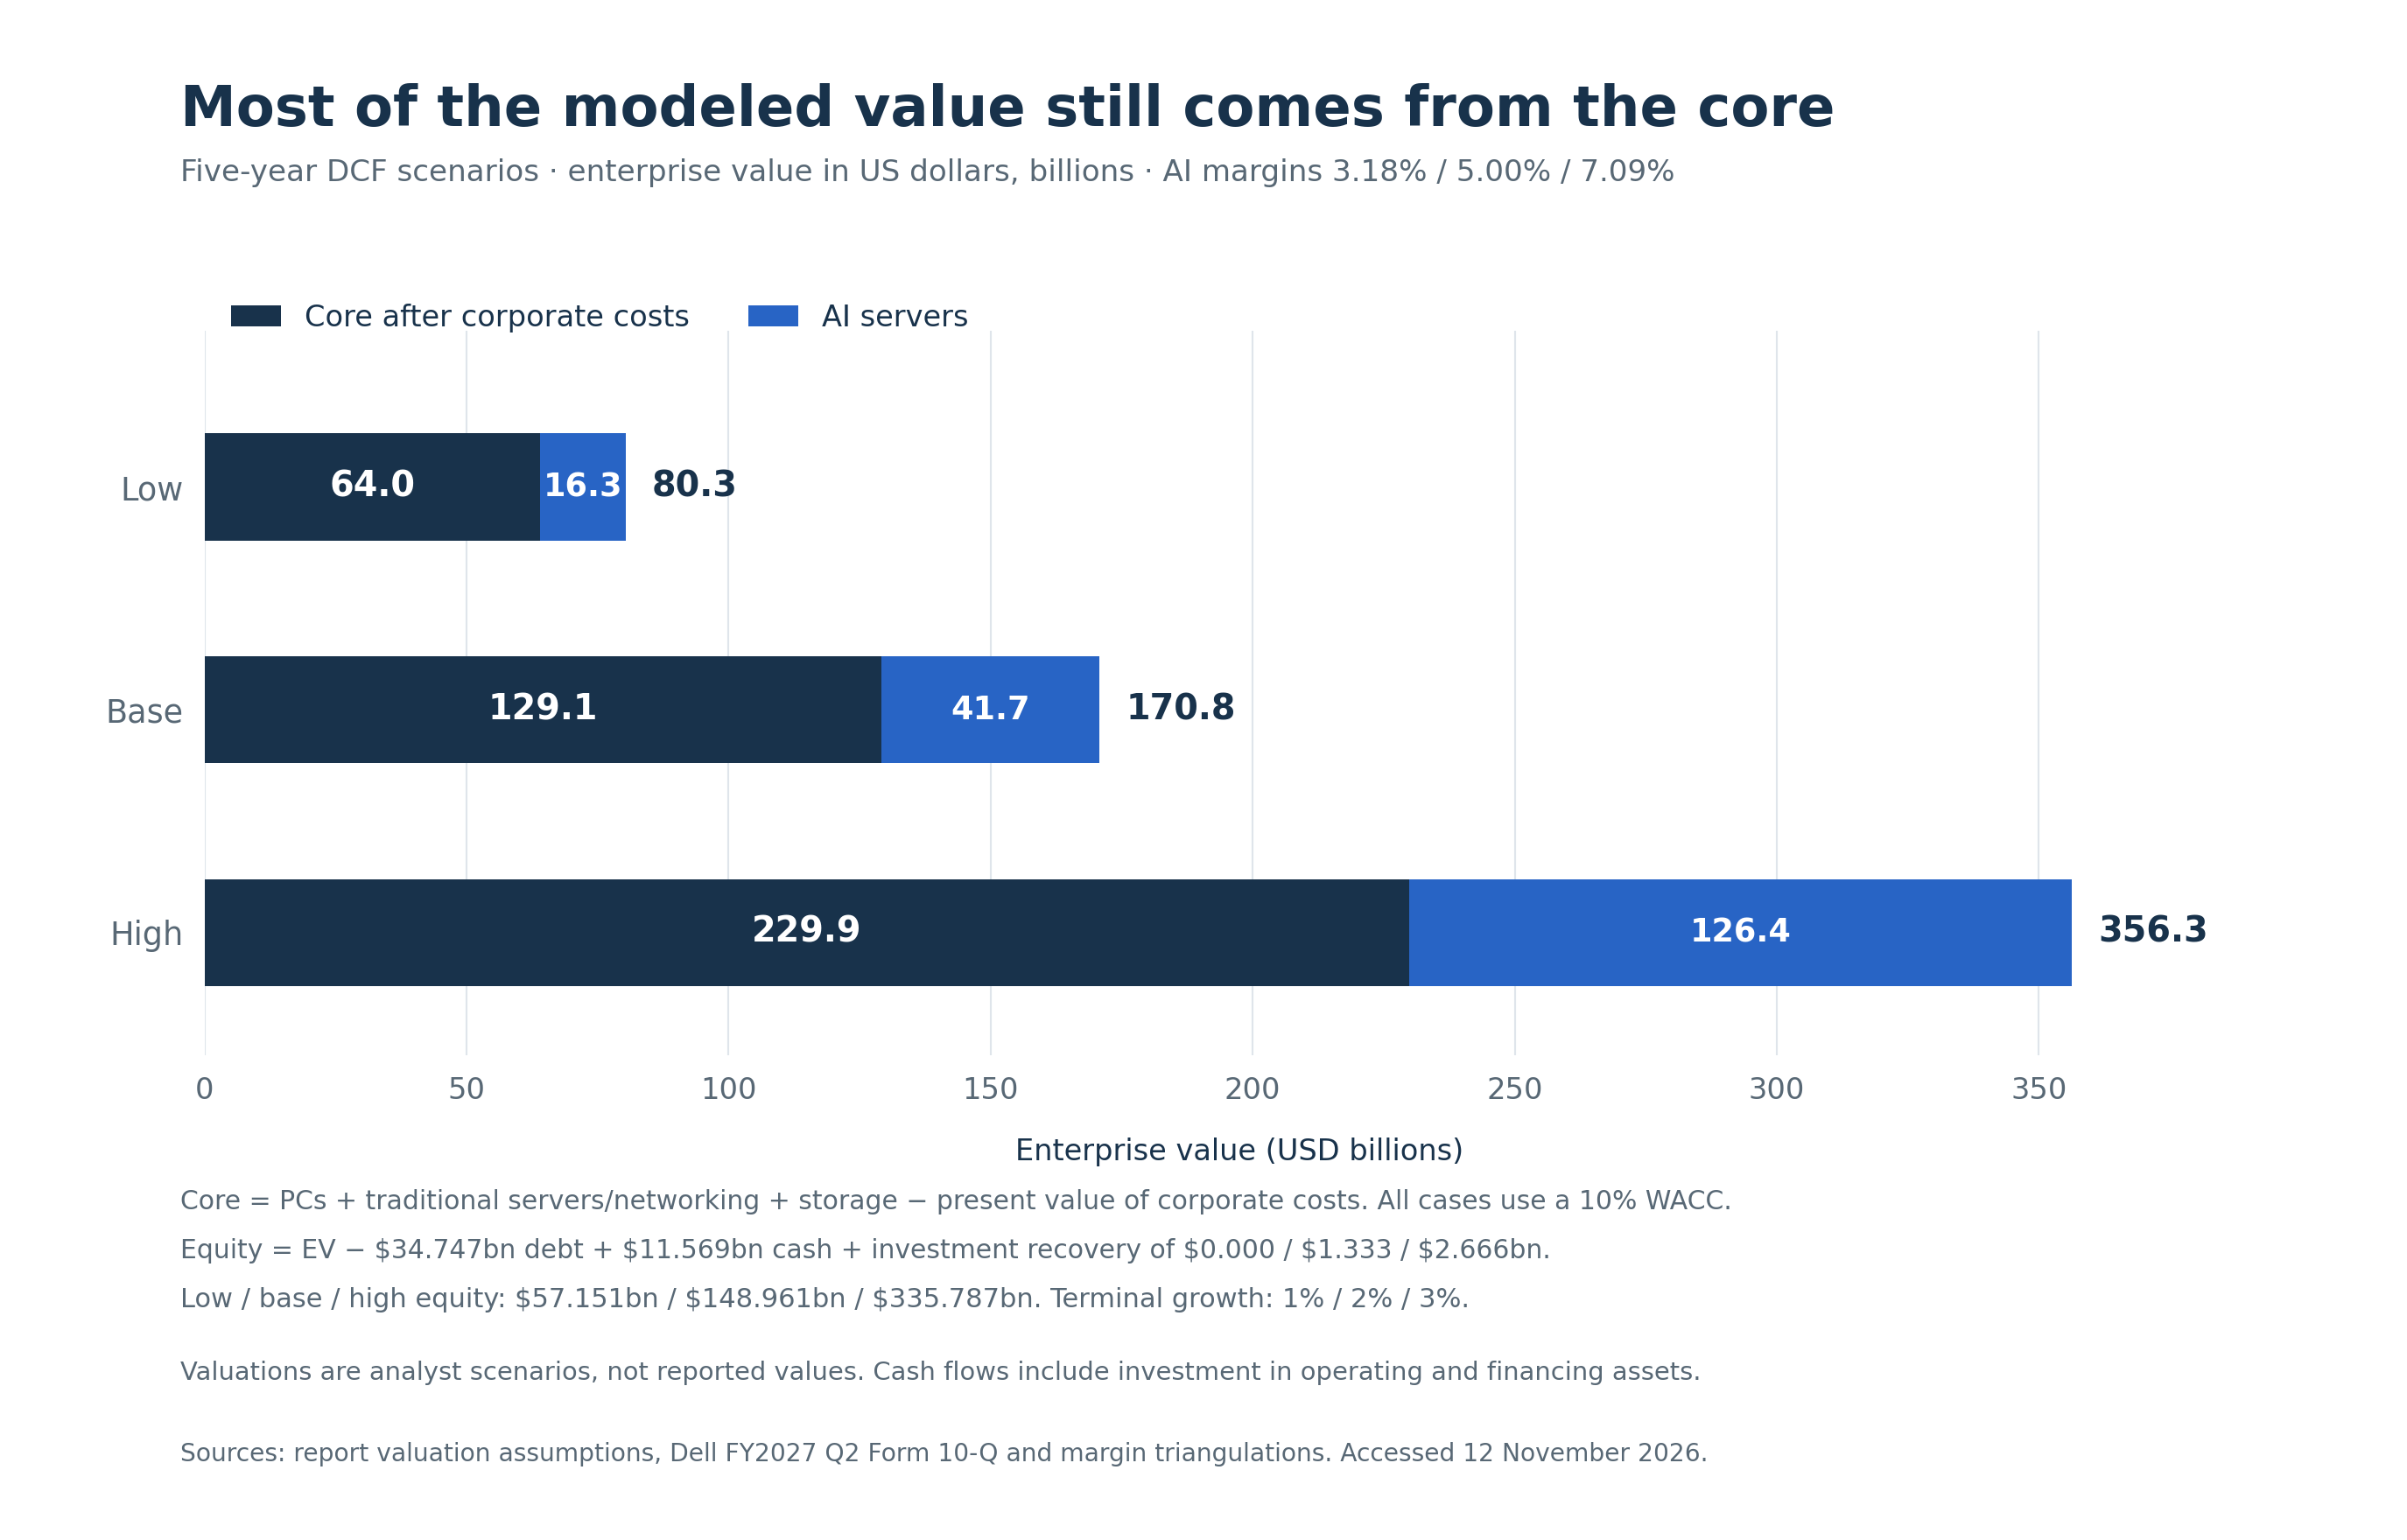
The rest of Dell is valuable. The model values PCs, traditional servers and storage, after recurring corporate costs, at $64–230 billion of enterprise value, with a $129 billion base case. AI contributes $16–126 billion, with a $42 billion base case. After all debt, cash, an explicit investment-recovery assumption and a dilution allowance, total equity value is approximately $89 / $232 / $522 per share in the low/base/high cases. Each scenario shows the outcome under its stated assumptions.
The decisive assumptions are the persistence of traditional-server pricing, normalized PC profitability, AI operating margin, and how much capital must accompany AI revenue. Higher orders alone do not settle those questions.
1. What changed in the record
As of this report’s cutoff, Dell’s latest published financial statements cover the quarter and six months ended July 31, 2026, its second quarter of FY2027. Dell scheduled the third-quarter results for November 24, after the cutoff. FY2026 ended January 30, 2026. Fiscal labels in this article refer to Dell unless another company is named.schedule
Two older premises need correction. First, AI server revenue is no longer entirely hidden inside combined server sales. Dell now gives individual revenue figures for AI-optimized servers, traditional servers and networking, and storage within ISG. The FY2026 filing supplies annual AI revenue comparatives back to FY2024. It still does not report AI gross profit, AI operating profit, or AI capital employed as standalone figures.k26
Second, a low-margin AI product does not imply that the whole infrastructure division has a low operating margin. In the latest quarter, ISG generated $31.782 billion of revenue and $4.781 billion of segment operating income, a 15.0% margin. Its traditional-server and storage businesses, pricing changes and shared operating costs matter greatly to that result.q27
Dell’s current product split is economically useful, but it is not a fully separable set of companies. Support, software, services, financing and shared selling infrastructure sit around the hardware. The valuation therefore includes these activities within the businesses to which Dell reports them and charges recurring corporate costs at the company level. It does not add a second, freestanding “services value” on top of earnings that already contain services.
The five-year operating record
Amounts below are USD billions. Segment operating income excludes certain corporate items, stock compensation and acquisition-related amortization. The supporting workbook carries the unrounded million-dollar inputs.
| Dell fiscal year | AI revenue | Traditional servers and networking | Storage revenue | ISG revenue | ISG operating income | CSG revenue | CSG operating income |
|---|---|---|---|---|---|---|---|
| FY2022 | UNKNOWN | UNKNOWN | 16.465 | 34.366 | 3.736 | 61.464 | 4.365 |
| FY2023 | UNKNOWN | UNKNOWN | 17.958 | 38.356 | 5.045 | 58.213 | 3.824 |
| FY2024 | 1.873 | 15.751 | 16.261 | 33.885 | 4.286 | 48.916 | 3.712 |
| FY2025 | 9.286 | 17.850 | 16.457 | 43.593 | 5.579 | 48.393 | 2.972 |
| FY2026 | 24.683 | 19.512 | 16.631 | 60.826 | 7.111 | 50.984 | 2.833 |
For FY2022 and FY2023, combined servers and networking revenue was $17.901 billion and $20.398 billion. The figures stay under combined servers and networking. Dell did not disclose an AI revenue breakdown for those years. Sources are the latest comparable annual-report tables, using the revised figures where applicable.k24, k25, k26
The history also requires an accounting correction. Dell revised FY2024 CSG results for supplier credits that had been omitted or recorded in the wrong period. Revised CSG operating income is $3.712 billion, versus $3.512 billion originally reported. The revision increased FY2024 net income by $177 million and reduced year-end payables by $163 million, while leaving operating cash flow unchanged. This report uses the revised series and the company’s disclosed explanation.revision
CSG’s cycle is visible. Revenue moved from $61.5 billion in FY2022 to $48.4 billion in FY2025, then recovered to $51.0 billion in FY2026. CSG operating income nevertheless declined in FY2026. A sales rebound alone did not guarantee greater profit.
2. Orders, shipments, backlog and revenue answer different questions
An order measures demand booked during a period. Backlog is an outstanding stock of business at a date. Shipments measure goods sent. Recognized revenue follows the contractual transfer of control. They can diverge because of timing, delivery terms, cancellations, configuration changes and rounding.
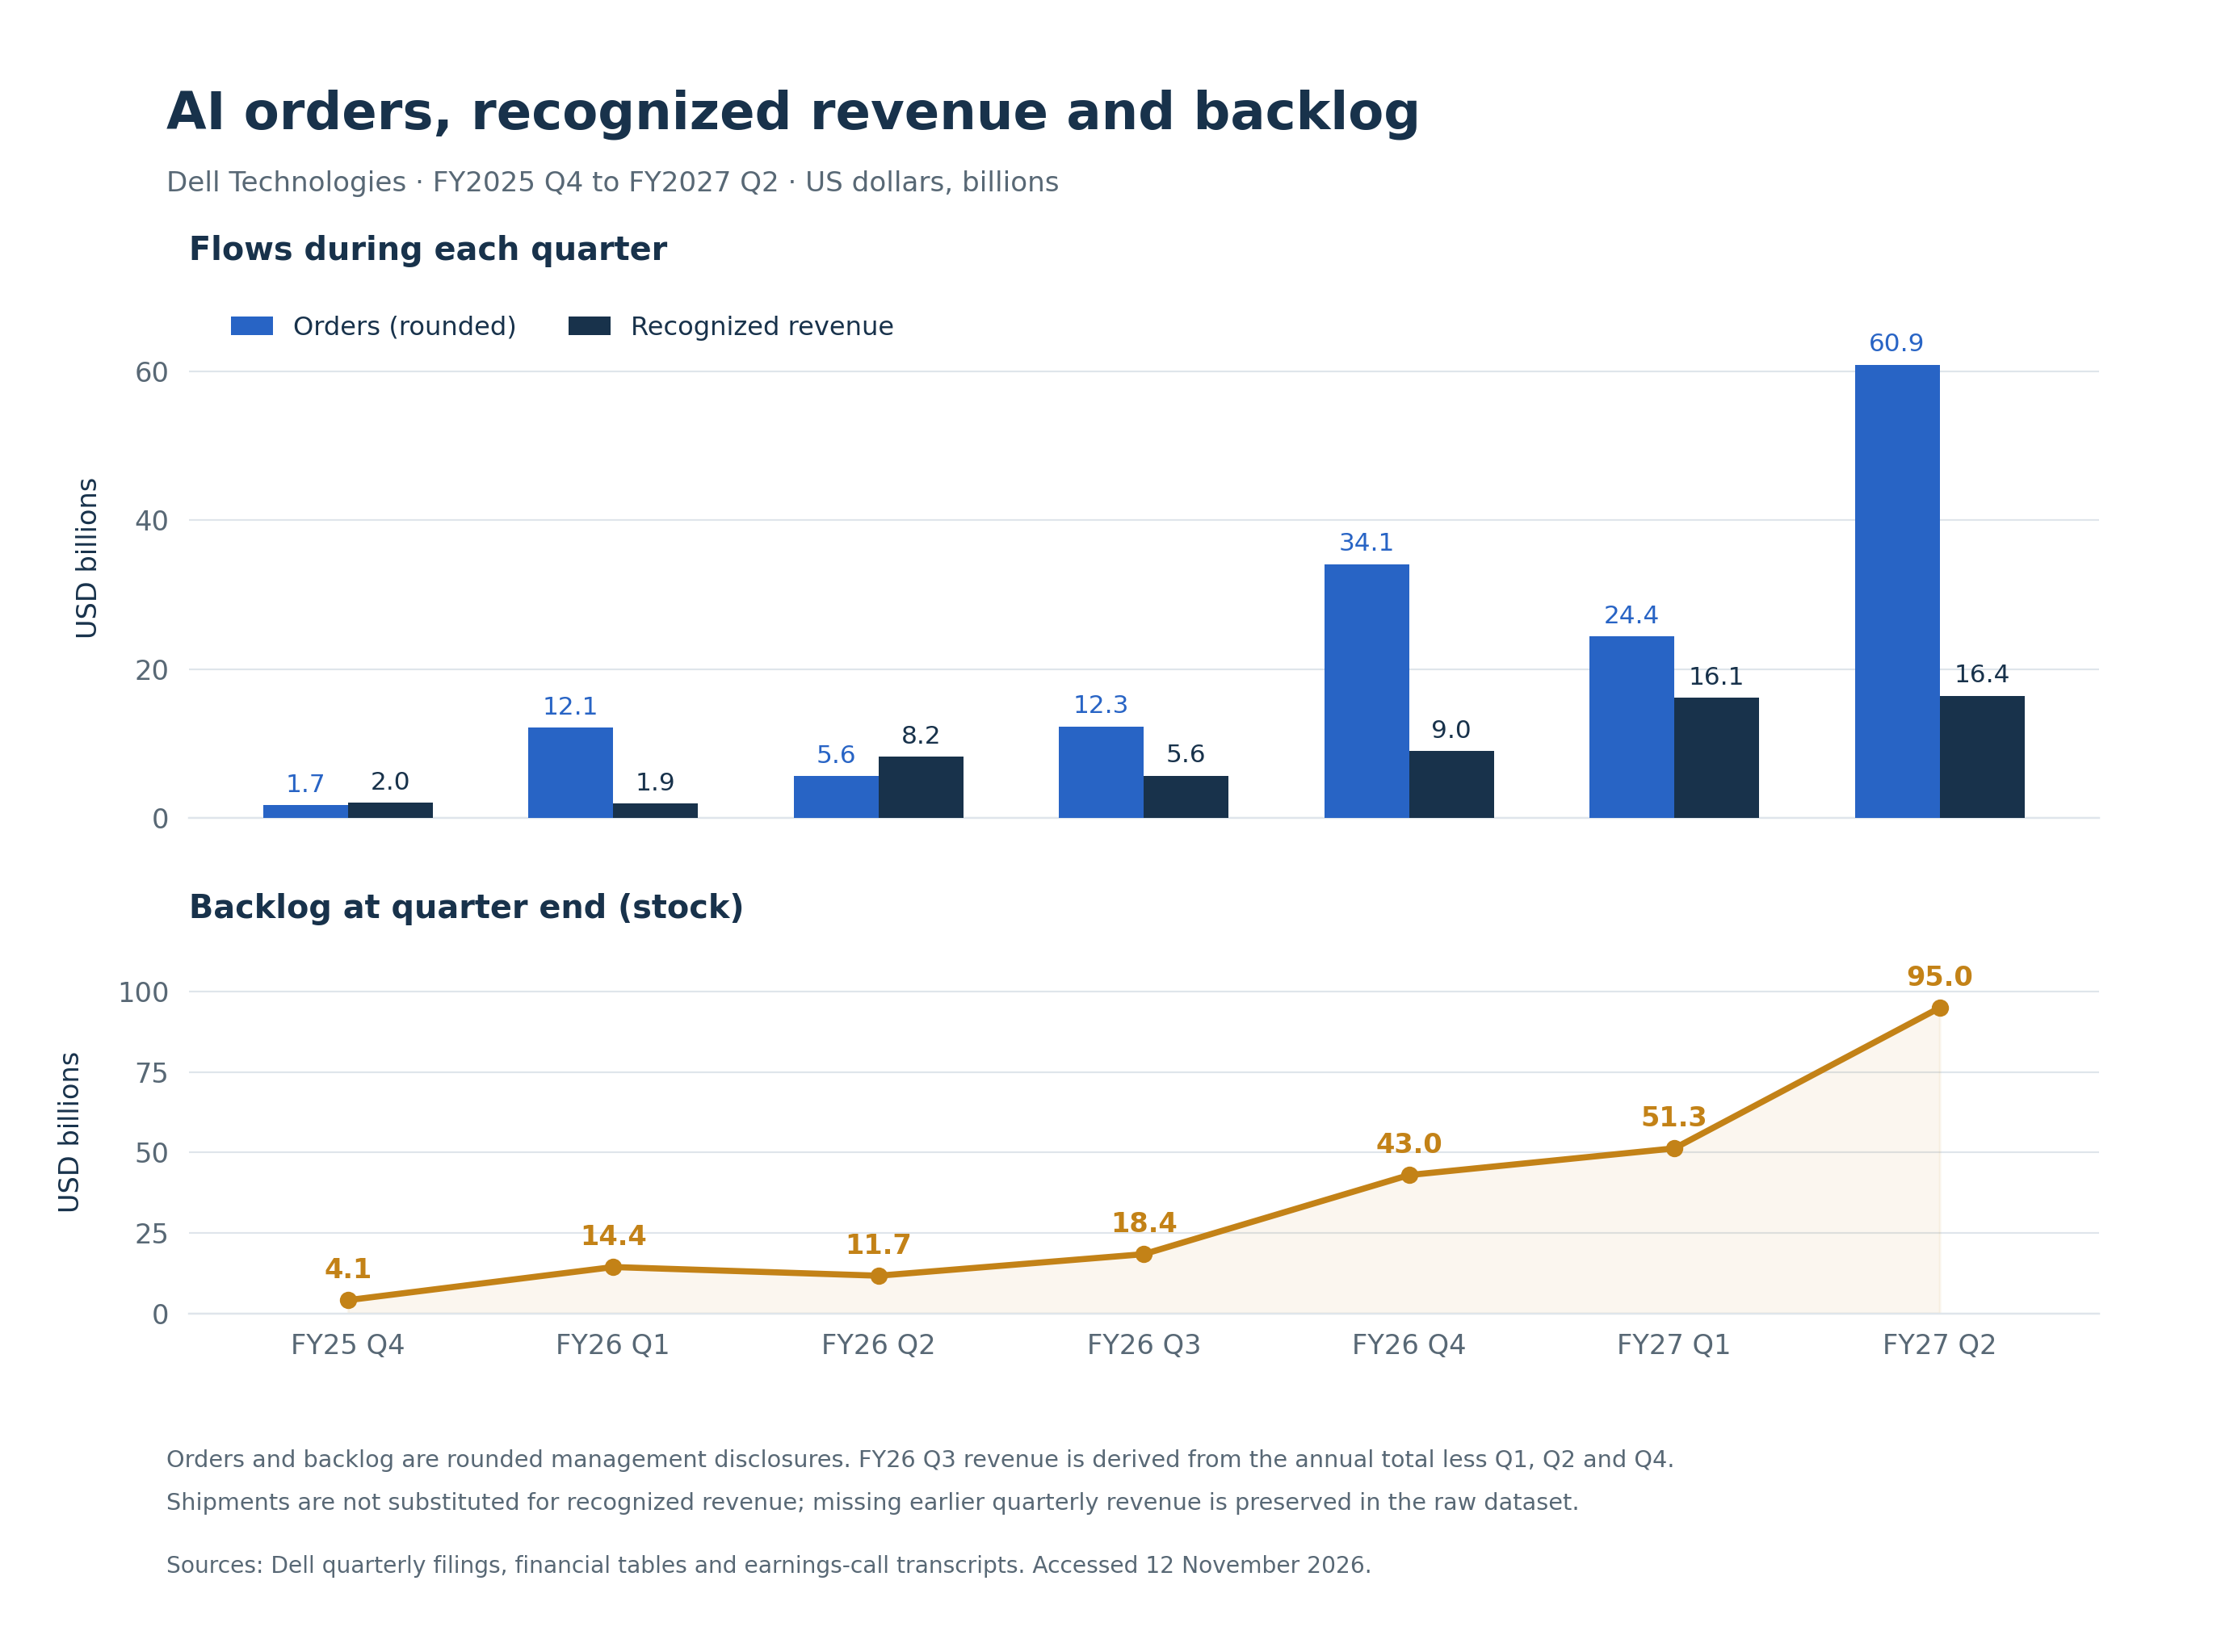
Dell’s FY2026 AI shipments were approximately $25.2 billion, while recognized AI revenue was $24.683 billion. In the fourth quarter, management discussed $9.5 billion of shipments against $8.952 billion of revenue and explained the difference as goods in transit. The timing difference is operationally ordinary and essential to correct margin calculations.t26
The table gives each measure its own column. Amounts are USD billions. Orders, shipments and backlog are rounded management disclosures; revenue is the precise reported figure or a specifically identified calculation.
| Quarter | AI orders | AI shipments | AI recognized revenue | Ending AI backlog |
|---|---|---|---|---|
| FY2025 Q1 | 2.6 | 1.7 | UNKNOWN | 3.8 |
| FY2025 Q2 | 3.2 | 3.1 | UNKNOWN | 3.8 |
| FY2025 Q3 | 3.6 | 2.9 | UNKNOWN | 4.5 |
| FY2025 Q4 | 1.7 | 2.1 | 2.026 | 4.1 |
| FY2026 Q1 | 12.1 | 1.8 | 1.882 | 14.4 |
| FY2026 Q2 | 5.6 | 8.2 | 8.208 | 11.7 |
| FY2026 Q3 | 12.3 | 5.6 | 5.641* | 18.4 |
| FY2026 Q4 | 34.1 | 9.5 | 8.952 | 43.0 |
| FY2027 Q1 | 24.4 | No standalone shipment figure | 16.132 | 51.3 |
| FY2027 Q2 | 60.9 | No standalone shipment figure | 16.401 | 95.0 |
FY2026 Q3 revenue is calculated as annual revenue less Q1, Q2 and Q4. Earlier quarterly recognized-revenue cells remain UNKNOWN where an exact disclosure was not recovered. In Q1 FY2027, the CFO once called the rounded $16.1 billion amount “shipments,” while the prepared discussion called it revenue; Dell supplied no shipment-to-revenue reconciliation. Q2 disclosed $16.4 billion of revenue without a quantified shipment figure. The shipment cells therefore remain blank to avoid duplicating revenue. The raw quarterly file includes FY2024 and maps each observation to exact pages in its company-hosted financial table or transcript.quarterly
The latest $95 billion backlog is substantial. It is not $95 billion of profit or immediate cash. Revenue recognition will bring product costs, customer collections, warranty obligations and potentially financing receivables with it. Nor is backlog added to the DCF as another asset: its potential conversion is already represented in future sales.
The current FY2027 AI revenue guidance is $74 billion. The base model uses that amount as its first future twelve-month sales assumption and excludes a second contribution from backlog. The model uses current guidance to anchor a twelve-month period. Dell’s fiscal year may end on a different date.release27
3. Three margin estimates, shown step by step
Dell does not disclose AI profit. Any apparent precision requires an assumption about profit because Dell discloses product revenue without product-level income statements. The three approaches below provide complementary evidence, with different weaknesses.
Estimate one: subtract an assumed legacy profit contribution from ISG
FY2026 provides a clean annual starting point:
- ISG operating income was $7.111 billion.
- AI revenue was $24.683 billion.
- Traditional-server plus storage revenue was $19.512 + $16.631 = $36.143 billion.
- Assign a clearly stated blended operating margin to those legacy businesses.
- Divide the residual profit by AI revenue.
The formula is:
m_(AI)=(7.111-36.143m_(core)) / (24.683).
| Assumed legacy margin | Implied legacy operating profit, $bn | Residual AI profit, $bn | Estimated AI operating margin |
|---|---|---|---|
| 17.50% | 6.325 | 0.786 | 3.184% |
| 16.25% | 5.873 | 1.238 | 5.015% |
| 15.00% | 5.421 | 1.690 | 6.845% |
The arithmetic is exact given the assumptions. The attribution is not identified by the filings. For context, applying a 5% AI margin to FY2025 would imply approximately a 14.9% margin on its traditional-server and storage revenue. That makes the FY2026 legacy assumptions intelligible, without proving which one is correct.
Gross margin requires another bridge. With an assumed AI operating-expense allocation of three percentage points of sales, the corresponding gross-margin estimates are 6.18%, 8.01% and 9.85%. Changing that allocation from two to four points changes each gross estimate by one point in either direction. Dell has not disclosed the allocation. These are modeled gross margins under the stated assumptions.
The latest quarter provides a useful consistency check. At an assumed 5% AI operating margin, AI contributes $0.820 billion of Q2 FY2027 ISG income. The residual is:
(4.781-(16.401 × 5%)) / (10.531+4.850)=25.75%
for traditional servers and storage combined. Applying an old 16% legacy margin to this quarter would instead force a much higher residual AI margin. That would follow from the assumption. Dell has not disclosed a sudden AI-margin breakthrough. The filing describes higher traditional-server selling prices and operating leverage across ISG.q27
Estimate two: translate management’s language into an explicit range
The Q4 FY2026 call described AI profitability as consistent with a mid-single-digit operating-margin target. The Q1 FY2027 prepared discussion reiterated that characterization. The latest Q2 call did not supply a replacement AI-specific numeric margin.t26, t127, t227
For modeling, this report interprets that language as 4% / 5% / 6%. These endpoints are my numerical interpretation of management’s qualitative wording.
At $74 billion of revenue:
| Assumed AI operating margin | Implied operating income, $bn | Gross margin if allocated OpEx is 3% |
|---|---|---|
| 4% | 2.96 | 7% |
| 5% | 3.70 | 8% |
| 6% | 4.44 | 9% |
This is the strongest direct evidence for a central Dell-specific operating-margin assumption. It remains a management statement about segment-style profitability. It is not an audited standalone AI profit figure, and it does not include the report’s subsequent corporate-cost allocation, taxes or capital charge.
Estimate three: use Supermicro as a cross-check
Supermicro supplies a publicly reported comparison, but its entire company is not identical to Dell’s AI server business. Product configurations, customer mix, services, expense allocations and fiscal periods differ. Its GAAP figures also include stock compensation, whereas Dell’s segment operating income excludes it.
For Supermicro FY2026, ended June 30, 2026, the calculation is:
Gross margin=4.227251/39.063072=10.82%
Operating expense rate=1.456765/39.063072=3.73%
Operating margin=(4.227251-1.456765)/39.063072=7.09%.
The latest quarter, ended September 30, is stronger:
| Supermicro period | Revenue, $bn | Gross profit, $bn | Operating expense, $bn | Gross margin | Operating margin |
|---|---|---|---|---|---|
| FY2025 | 21.972 | 2.430 | 1.177 | 11.06% | 5.70% |
| FY2026 | 39.063 | 4.227 | 1.457 | 10.82% | 7.09% |
| FY2026 Q1 | 5.018 | 0.467 | 0.285 | 9.31% | 3.63% |
| FY2027 Q1 | 19.946 | 2.541 | 0.477 | 12.74% | 10.35% |
The latest operating margin is 12.7397% minus 2.3892% = 10.3505%. Its filing attributes the gross-margin increase principally to product and customer mix, with tariff recoveries also contributing. It reports a $148 million year-over-year increase in tariff-recovery refunds net of tariff expense, equivalent to about 0.74% of current-quarter revenue. The improvement should not automatically become Dell’s steady-state margin.smk, smq
The integrated valuation therefore uses 3.184% / 5.0% / 7.092%: a residual downside, management midpoint and annual peer upside. The supporting sensitivity carries both the full residual range and the latest 10.35% peer outcome through valuation. There is no defensible reason to average all three methods mechanically: two use Dell-specific evidence, and one measures a different company.
The peer upside uses Supermicro’s GAAP expense basis while the valuation charges Dell’s recurring stock compensation. That is conservative with respect to stock-compensation treatment and is not a fully harmonized segment-margin comparison.
4. The working-capital advantage survives, but moves the financing question elsewhere
Between January 30 and July 31, 2026, Dell’s balance sheet expanded rapidly:
| USD billions | FY2026 year-end | H1 FY2027 end | Change |
|---|---|---|---|
| Trade receivables | 17.585 | 22.918 | 5.333 |
| Inventory carrying amount | 10.437 | 21.290 | 10.853 |
| Accounts payable | 33.630 | 49.723 | 16.093 |
| Receivables + inventory − payables | −5.608 | −5.515 | 0.093 |
| Total deferred revenue | 26.930 | 29.718 | 2.788 |
| Net DFS receivables | 14.280 | 20.430 | 6.150 |
| DFS operating-lease equipment | 2.459 | 3.182 | 0.723 |
| Total DFS-owned assets | 16.739 | 23.612 | 6.873 |
The selected trade-working-capital measure barely deteriorated despite a doubling of inventory. Suppliers financed much of the increased product investment. On the cash-flow statement, receivables and inventory used $16.368 billion, almost offset by $16.203 billion from payables. Balance-sheet changes differ from cash-flow changes because of currency, noncash items and reclassifications. The cash analysis uses the cash-flow statement.q27
This is a meaningful operational advantage, but it has limits. Inventory is the reported GAAP carrying amount; an unreserved gross inventory total is not disclosed. Payables must eventually be settled. Deferred revenue largely represents services and support Dell still owes. The filing leaves any AI deposit pool unidentified. The filings do not allocate those balances completely to AI.
The calculated trade cash-conversion proxy remains negative, but becomes less favorable:
| Period | Trade DSO | Inventory days | Payables days | Cash-conversion proxy |
|---|---|---|---|---|
| FY2023 | 46.05 | 24.87 | 106.57 | −35.66 |
| FY2024 | 44.92 | 22.69 | 102.20 | −34.59 |
| FY2025 | 37.40 | 25.32 | 98.10 | −35.38 |
| FY2026 | 44.70 | 34.37 | 109.13 | −30.06 |
| H1 FY2027 | 40.59 | 39.44 | 103.62 | −23.59 |
DSO equals average opening/closing trade receivables divided by revenue, multiplied by period days. Inventory and payable days use average balances divided by cost of revenue. The proxy is DSO plus inventory days less payable days. It uses 371 days for the 53-week FY2023, 364 for ordinary full years and 182 for the half. It excludes financing receivables and deferred revenue, uses cost of revenue as a purchasing proxy and cannot capture intraperiod peaks. The comparison measures the adjustments made here. Dell reports cash conversion on its own basis.
The main capital absorption occurs in DFS. Product sales can be recognized before the customer has paid cash when Dell finances the purchase. The resulting receivable is a real asset, but it has to be funded and collected. Supplier credit does not eliminate that requirement.
5. DFS funding: why “core debt” is an incomplete answer
At July 31, 2026, Dell reported $34.747 billion of debt principal. Its management presentation divides that into $13.983 billion of core debt, $20.660 billion of DFS-related debt and $104 million of other debt. The DFS-related category itself contains two very different things:
| USD billions | January 30 | July 31 | Change |
|---|---|---|---|
| Debt issued by DFS | 9.139 | 9.618 | 0.479 |
| Corporate debt allocated to DFS | 5.507 | 11.042 | 5.535 |
| Total DFS-related debt | 14.646 | 20.660 | 6.014 |
| Core debt | 17.018 | 13.983 | −3.035 |
| Total debt principal | 31.763 | 34.747 | 2.984 |
Dell estimates the corporate funding assigned to DFS by applying a 7-to-1 debt-to-equity ratio to financing receivables plus operating-lease equipment. Thus $23.612 billion of owned assets supports approximately $20.660 billion of assigned debt and $2.952 billion of implied equity. Management uses the ratio to allocate funding internally.q27
The allocation explains how core debt can fall by $3.035 billion while total debt rises by $2.984 billion. It would be wrong to describe the change as equivalent consolidated deleveraging.
Much of the DFS securitization and structured debt is nonrecourse to Dell beyond the transferred assets. That protection does not turn the $11.042 billion of allocated corporate debt into nonrecourse debt. Overcollateralization also leaves Dell with economic exposure to credit losses and collateral shortfalls.
The filings disclose $2.7 billion of first-half transfers into consolidated securitization structures. Those transfers differ from outright sales that remove receivables from the group. Disclosed third-party nonrecourse sales for concentration management were immaterial. The record therefore does not support treating a large, undisclosed receivable-sale program as the explanation for cash generation.
Credit measures deserve attention without being overstated. The finance-receivable allowance increased from $213 million to $314 million. Dell’s reported half-year principal charge-off rate rose from 0.2% to 0.4%. These figures cover the financing portfolio. Dell has not disclosed AI-customer loss rates. A stronger claim about AI credit quality would require AI customer concentrations, aging, collateral values and realized recoveries that the public tables do not provide.
For valuation, the treatment is deliberately consistent. Dell records interest on debt in interest and other, net. That line is excluded from segment operating income. Starting from segment EBIT, the model therefore does not add back DFS interest again. It includes financing assets in reinvestment and subtracts all debt when converting enterprise value into equity. A model subtracting only core debt would need a DFS equity valuation using the same funding assumptions and funding analysis.q27
6. Free cash flow, shareholder returns and dilution
Three cash-flow definitions matter here:
- Conventional FCF: operating cash flow less gross capital expenditure and capitalized software.
- Dell FCF: operating cash flow less capital expenditure net of proceeds from asset sales.
- Dell adjusted FCF: Dell FCF plus its financing-receivable and operating-lease-equipment adjustments.
The first two differ modestly in some years. The third can differ substantially when customer financing grows.
| USD billions | FY2022† | FY2023 | FY2024 | FY2025 | FY2026 | H1 FY2027 |
|---|---|---|---|---|---|---|
| Operating cash flow | 10.307 | 3.565 | 8.676 | 4.521 | 11.185 | 6.306 |
| Gross capex and capitalized software | 2.796 | 3.003 | 2.756 | 2.652 | 2.633 | 2.202 |
| Conventional FCF | 7.511 | 0.562 | 5.920 | 1.869 | 8.552 | 4.104 |
| Dell FCF | 7.552 | 0.572 | 5.923 | 1.958 | 8.555 | 4.104 |
| Dell adjusted FCF | 8.187 | 1.533 | 5.607 | 3.097 | 11.508 | 11.314 |
| Buybacks | 1.496 | 2.883 | 2.080 | 2.588 | 6.014 | 5.424 |
| Dividends and equivalents | 0 | 0.964 | 1.072 | 1.275 | 1.459 | 0.869 |
| Stock compensation, cash-flow statement | 1.622 | 0.931 | 0.878 | 0.785 | 0.723 | 0.373 |
†FY2022 cash-flow figures include discontinued VMware and must not be interpreted as continuing Dell alone. Dell also reported approximately $7.1 billion of operating cash flow excluding VMware. The workbook preserves the scope difference to avoid implying a continuous series.fy22, k24, k26
For H1 FY2027, the adjusted bridge is particularly clear:
6.306-2.202=4.104; ; 4.104+6.404+0.806=11.314.
The addbacks describe funding investments. They do not make the investments unnecessary. Capital returned of $6.293 billion equals 153.3% of conventional FCF, or 55.6% of adjusted FCF. The ordinary-dividend subtotal was $814 million; the $869 million cash-flow figure also includes dividend equivalents. Another $555 million went to employee share-tax withholding. Net cash borrowing was $3.046 billion, while cash remained approximately flat.q27
A single half does not determine sustainable distributions. In FY2026, Dell FCF of $8.555 billion covered $7.473 billion of buybacks and dividends/equivalents. Across FY2023–FY2026, however, those returns totaled $18.335 billion against $17.008 billion of Dell FCF. Cash balances, asset transactions and borrowing matter across the cycle.
Buybacks have reduced the share count. Rounded fiscal-year-end common shares fell from 757 million in FY2022 to 652 million in FY2026, with 640 million at July 31, 2026. The later 10-Q cover reports 635,812,750 shares at September 1. These are not the same measure as FY2026’s 684 million weighted diluted shares or the latest quarter’s 652 million weighted diluted shares.
The valuation uses the September 1 outstanding count plus a seven-million-share allowance based on the latest quarterly dilutive award effect: 642.81275 million shares. This approximates the diluted share count at the valuation date. No future buyback benefit is assumed. Recurring stock compensation is charged within corporate costs, avoiding the practice of both ignoring compensation expense and treating every repurchased share as a free gain.
7. Valuing the businesses without treating today’s revenue as permanent
PCs: replacement demand helps, but price and volume tell different stories
The commercial PC replacement cycle provides a reason for demand to recover. Windows 10’s ordinary support ended October 14, 2025, although extended-support arrangements and compatible upgrades mean replacement is not instantaneous or universal.windows
Dell’s latest statements also prevent a simplistic volume story. CSG first-half revenue grew 19%, and the latest-quarter segment margin was 7.6%. Yet the company attributes much of the revenue growth to higher average selling prices; second-quarter commercial unit sales declined, as did consumer units. Higher memory costs, richer configurations and pricing discipline can lift nominal sales without proportionate unit growth.q27
The model starts from annualized H1 CSG revenue of $59.286 billion and applies first-year factors of 85%, 95% and 105%. That produces approximately $50.4 billion, $56.3 billion and $62.3 billion of future annual revenue. Operating margins are 5%, 6.5% and 8%. The base case then holds revenue flat for one year before 2% annual growth. This values a replacement-cycle business with normalization and avoids extrapolating 19% growth indefinitely.
Result: CSG enterprise value of $20.5 / $34.1 / $53.2 billion.
Traditional servers and storage: profitable, but current pricing is a major assumption
Annualized H1 traditional-server and networking revenue is $38.148 billion, nearly double FY2026’s reported revenue. The latest filing says much of the increase came from average selling prices. The model therefore applies first-year revenue factors of 75%, 90% and 105%, with operating margins of 14%, 20% and 26%.
The base traditional-server margin is above earlier blended infrastructure experience but below the latest implied legacy margin. The low case allows pricing and margins to normalize more sharply. The high case preserves a substantial portion of the current benefit. These are future scenarios; they must not be confused with the legacy-margin assumptions used to reconstruct historical AI profit.
Storage begins at annualized H1 revenue of $18.368 billion. First-year factors are 95%, 105% and 112%, with margins of 20%, 25% and 30%. Dell-IP mix and support economics justify a standalone storage analysis, while the absence of disclosed standalone storage profit keeps these margins explicitly estimated.
Result: traditional-server enterprise value of $32.7 / $65.9 / $123.3 billion, and storage value of $29.3 / $47.4 / $71.5 billion.
AI: value the cash left after growth investment
The AI model uses first-year sales of $60 / $74 / $90 billion. After year one, annual growth assumptions are:
| Scenario | Year 2 | Year 3 | Year 4 | Year 5 | Operating margin | Total net capital / sales |
|---|---|---|---|---|---|---|
| Low | 0% | −10% | 0% | 2% | 3.184% | 35% |
| Base | 20% | 15% | 10% | 7% | 5.000% | 15% |
| High | 35% | 25% | 20% | 15% | 7.092% | 5% |
“Total net capital” includes net operating working capital, customer-financing assets and net fixed operating assets. The capital ratios are scenario assumptions, because Dell does not allocate those assets to AI. The high case’s small denominator yields a very high marginal return; it is an optimistic turnover assumption used to calculate modeled ROIC.
For every $1 billion of additional annual AI revenue, before allocation of recurring corporate costs:
| Metric, $ millions except percentages | Low | Base | High |
|---|---|---|---|
| Operating profit | 31.84 | 50.00 | 70.92 |
| After-tax operating profit at 23% tax | 24.52 | 38.50 | 54.61 |
| Required net capital | 350 | 150 | 50 |
| Incremental ROIC | 7.0% | 25.7% | 109.2% |
| Capital charge at 10% | 35 | 15 | 5 |
| Annual economic profit | −10.48 | 23.50 | 49.61 |
The base break-even capital ratio is:
(5% × (1-23%)) / (10%)=38.5%.
At a 5% operating margin, invested capital exceeding 38.5 cents per dollar of annual sales would miss the 10% hurdle, before further adverse effects. At a 3.184% margin, that threshold is only 24.5 cents. Customer payment terms and financing therefore determine whether rapid shipment growth creates or consumes economic value.
A 6% illustrative financing rate on the base case’s $150 million of capital implies $9 million of annual interest equivalent. That helps make the financing burden tangible. It is not deducted again in the enterprise DCF: the unlevered model already prices funding through its discount rate and debt bridge. DFS-specific interest expense is unavailable at the precision needed for a standalone financing ROE.
The DCF visibly calculates revenue, EBIT, taxes, depreciation, capital expenditure and changes in working capital/financing assets. Net fixed assets are part of total capital. Capital expenditure equals depreciation plus the change in those fixed assets, so fixed investment is not subtracted twice. Terminal cash flow also funds capital growth.
In the base case, AI sales reach $120.2 billion in year five, but the first year’s free cash flow is only about $1.51 billion: $2.849 billion of after-tax operating profit less $1.340 billion of incremental capital. Positive accounting profit and heavy growth funding can coexist.
The complete valuation
All cases use a 10% discount rate and 23% normalized tax rate. Terminal growth is 1%/2%/3%. The recurring corporate and SBC charge starts at $2.1/$1.9/$1.7 billion before tax and grows 2% annually. The base charge is grounded in annualizing H1 excluded corporate expenses and SBC, with normalization. Acquisition-intangible amortization is not treated as a second cash investment; ongoing reinvestment remains in the model.
| USD billions unless stated | Low | Base | High |
|---|---|---|---|
| PCs / CSG | 20.5 | 34.1 | 53.2 |
| Traditional servers and networking | 32.7 | 65.9 | 123.3 |
| Storage | 29.3 | 47.4 | 71.5 |
| Present value of corporate costs and SBC | −18.6 | −18.3 | −18.1 |
| Core enterprise value | 64.0 | 129.1 | 229.9 |
| AI enterprise value | 16.3 | 41.7 | 126.4 |
| Total enterprise value | 80.3 | 170.8 | 356.3 |
| All debt principal | −34.747 | −34.747 | −34.747 |
| Cash | 11.569 | 11.569 | 11.569 |
| Strategic investment recovery | 0 | 1.333 | 2.666 |
| Equity value | 57.2 | 149.0 | 335.8 |
| Value per diluted-share proxy | $88.91 | $231.73 | $522.37 |
The cash bridge adds all reported cash. If an investor requires an additional $2 billion operating-cash reserve, subtract approximately $3.11 per share. The investment-recovery line applies 0%/50%/100% to the reported $2.666 billion strategic-investment carrying value. Neither line is disguised as operating profit.
The model uses normalized operating balances and estimates the components that enter the valuation. Opening business capital is the assumed capital ratio multiplied by annualized H1 sales, consistently carried forward; it does not pretend to be disclosed AI assets. Corporate capital allocation, financing duration and collateral recovery remain missing inputs. In the base case, about 71.6% of enterprise value comes from terminal value, so modest differences in long-run margins or required returns have large effects.
8. Sensitivity and the price comparison
The requested range is wider than a small discount-rate adjustment:
| Discount rate | Low value/share | Base value/share | High value/share |
|---|---|---|---|
| 8% | $122 | $324 | $754 |
| 9% | $103 | $271 | $619 |
| 10% | $89 | $232 | $522 |
| 11% | $77 | $201 | $450 |
| 12% | $68 | $177 | $394 |
Rounded; the workbook recalculates the exact results through native case/discount sensitivity tables.
The margin cross-check also matters. Holding the base revenue path, core valuation, 15% AI capital ratio and 10% hurdle constant, the annual peer margin of 7.09% lifts total value to approximately $265 per share. The latest peer quarter’s 10.35% raises it to approximately $316. Reducing capital intensity to 5% at the same 10.35% margin produces about $326. These calculations show that margin optimism alone does not reproduce the full high case: its much stronger legacy economics and AI growth also contribute.
For market context, the November 11 closing-price reference was $373.68, cross-checked between two public market-data distributors. At the latest disclosed 635.813 million outstanding shares, that implies approximately $237.6 billion of equity value. This price is the report’s explicitly identified secondary-data exception: the exchange’s free historical table did not return a usable primary closing-price record. All operating and transaction financial inputs are taken from primary records, and the valuation itself does not depend on the quote.quote
Using the base core value, all debt and the base investment recovery, the quoted equity value leaves approximately $130.3 billion beyond the modeled core businesses. The model’s base AI value is $41.7 billion. That residual is not a direct observation of what “the market assigns to AI.” It also captures disagreement about core margins, growth, discount rates, capital needs and future businesses. A reader convinced that current legacy pricing will persist can justify much more value without assigning the entire difference to AI.
9. Reconstructing investor returns across four restructurings
A continuous-looking stock chart conceals changes in what investors owned. Public Dell investors, private sponsors, EMC holders and DVMT holders did not all experience the same investment.
2013: old public Dell investors were cashed out
The completed buyout paid $13.75 per old Dell share plus a $0.13 special dividend: $13.88. Against the January 11 unaffected price of $10.88, that is a 27.57% premium, excluding ordinary dividends. It is not a full holding-period return for every investor. The old public shares were canceled; ownership did not automatically continue into today’s Dell Technologies.buyout
Silver Lake’s initial $1.4 billion equity commitment is not enough to calculate a fund IRR. Final funded amounts, subsequent equity contributions, intermediate sales, distributions, co-investors, fees and carry matter. Multiplying a current ownership percentage by current market capitalization and dividing by an initial commitment would manufacture precision the public cash-flow record does not support.
2016: EMC investors received cash and a tracking security
Each EMC share received $24.05 cash plus 0.11146 DVMT shares. DVMT tracked an interest associated with VMware; it was not direct ownership of VMware shares. Dell’s tax document uses a $47.20 DVMT high-low midpoint on the transaction date. The package’s reference value was therefore:
24.05+0.11146 × 47.20=$29.310912.
Against EMC’s $27.86 close immediately before the formal October 2015 announcement, that represents a 5.21% increase, excluding ordinary EMC dividends and using the transaction-date midpoint, which differs from the official close. That pre-announcement date should not be represented as unquestionably unaffected by earlier speculation.emc
Dell’s FY2017 filing describes approximately $45.9 billion of new debt and $4.4 billion of new private equity supporting the EMC financing. Those amounts describe the transaction’s financing. An investor’s per-share cost basis depends on the purchase terms. The transaction’s scale and subsequent debt reduction should be evaluated independently of the return on any one sponsor fund.emcfin
2018: the $120 headline was not everyone’s realized cash
The completed DVMT exchange gave a stock-electing holder 1.8066 Class C Dell shares per DVMT share. Cash elections were oversubscribed against a $14 billion cap. The reported rounded result for a cash-electing share was $76.97 cash plus 0.6479 Dell shares. The cash component fell short of the $120 headline.dvmt
Using Dell’s $45.64 first regular-way trading-day tax-reference midpoint, the stock-election package was worth $82.45 per DVMT share; the prorated cash-election package was worth $106.54. These are reference market values. Each investor’s return depends on the price paid.
An original EMC share that followed the all-stock path became:
0.11146 × 1.8066=0.201363636 Dell shares,
with the original $24.05 cash kept outside the exchange. Dell corporation’s $8.87 billion receipt of VMware’s 2018 dividend helped fund the exchange; adding it again to the investor’s consideration would double-count value.dvmtk
2021: keep the distributed VMware leg
Each Dell share still held after the spin-off was accompanied by 0.440626 VMware shares. Dell’s superseding tax document uses post-distribution reference prices of $55.18 for Dell and $130.73 for VMware:
55.18+0.440626 × 130.73=$112.78303698.
Compared with the December 2018 Dell reference price of $45.64, the combined package increased 147.11%, versus 20.90% from Dell’s price alone. These are consistent reference returns calculated from midpoint market values.spin
The $27.40 VMware special dividend was paid to pre-distribution VMware owners, including Dell corporation. Dell received approximately $9.3 billion. It was not another $27.40 cash payment on every newly distributed VMware share received by a Dell stockholder.spin8k
Following the original EMC all-stock path through the spin, with the original cash uninvested, produces:
$24.05+0.201363636 DELL+0.088726053476136 VMW.
At the November 2021 reference marks, that package was $46.760402 per original EMC share, before taxes and fractional-share settlement. This is the correct economic lineage; it is not a sponsor IRR.
Extending returns to today requires another corporate action. In the 2023 Broadcom acquisition, a VMware cash election received $142.50. A stock election was prorated to approximately 52.1% stock and 47.9% cash. After Broadcom’s subsequent ten-for-one split, one stock-elected VMware share approximately became $68.2575 plus 1.31292 current Broadcom shares. A through-today total return must also include subsequent Dell and Broadcom dividends and a stated reinvestment convention. This report does not label a Dell-only price series as that complete return.avgo
10. Ownership and the next evidence that matters
The proxy record shows declining economic ownership percentages for the principal holders, with important denominator and attribution qualifications:
| Proxy ownership date | Michael Dell reported beneficial interest | Silver Lake | Total common shares, millions |
|---|---|---|---|
| April 28, 2022 | 47.0% | 12.8% | 748.146 |
| April 26, 2023 | 48.2% | 13.1% | 729.869 |
| May 1, 2024 | 46.3% | 10.7% | 710.455 |
| April 30, 2025 | 41.4% | 9.1% | 683.478 |
| April 27, 2026 | 40.9% | 7.4% | 649.568 |
Michael Dell’s reported row excludes the SLD Trust holding, which was 4.8% in the 2026 proxy, and includes foundation holdings when specified. The filings disclose beneficial ownership. They leave the individuals’ total wealth unknown. Class A and Class B shares carry ten votes each, versus one for Class C, so economic ownership and voting control differ.proxies
Silver Lake’s September amendment subsequently reported 42,809,317 Class-C-equivalent beneficial shares, or approximately 6.7% of all outstanding common shares using the stated denominator. Its 11.9% class-specific percentage is not comparable to the proxy’s 7.4% all-common economic interest. The dated proxy and amendment snapshots should not be passed off as exact November 12 holdings.slp
The evidence most likely to change this report’s conclusion is concrete:
- AI-specific capital and cash collections. Receivable aging, customer concentrations, deposits, inventory and vendor terms would narrow the 5–35% capital-intensity range far more than another backlog headline.
- A disclosed AI profit bridge. Gross profit, allocated operating expense and financing income would distinguish repeatable economics from mix-driven residual estimates.
- Several quarters of post-financing cash generation. FCF after customer-financing growth would demonstrate whether the current payout rate can be maintained without greater borrowing.
- Persistence of legacy pricing and margins. Current traditional-server and storage profitability makes a large contribution to equity value. Normalization would matter even if AI shipments continue to rise.
- Credit losses and recoveries on financed AI systems. Portfolio-wide historical loss rates are helpful, but rapidly changing customers and equipment values require current evidence.
The business question is whether Dell can repeatedly collect more after-tax operating profit than the cost of the capital required to support its sales. The public record supports a credible positive answer under reasonable turnover assumptions. The investment question adds a second test: how much of that success the purchase price already requires. This model finds a profitable base business and a substantial range of possible equity values, with financing discipline and legacy-margin persistence deciding much of the difference.
Appendix A. Definitions, model conventions and reproducibility
ISG is Infrastructure Solutions Group. CSG is Client Solutions Group, including PCs and related products. DFS is Dell Financial Services. EBIT is operating profit before interest and tax. NOPAT is operating profit after normalized tax. FCFF is cash flow available to all providers of capital after reinvestment. Enterprise value values the operating businesses before the stated debt/cash bridge. Incremental ROIC is additional annual NOPAT divided by additional net invested capital; it is not net income divided by book equity.
The workbook organizes source inputs, calculations and outputs into dedicated sheets. Its valuation uses one active forecast controlled by a case selector, with native case/discount tables. Blue inputs distinguish assumptions and reported values; calculation links remain live. Raw CSVs contain original reported inputs, units, periods, source locations, URLs and access dates. Derived quarterly revenue is marked as derived. Chart-data CSVs reproduce each figure.
Forecast years are consecutive future twelve-month model periods, discounted at year-end. Historical statements remain on Dell’s fiscal dates. The model uses the latest reported balance sheet as its capital bridge; it does not claim to know unreported August–November balance-sheet changes. The opening operating-capital allocation uses normalized balances because Dell does not report the allocation. These choices support an interpretable valuation but do not replace a full three-statement forecast.
After-tax operating profit less reinvestment determines FCFF. For a business with constant net-capital ratio k, the model’s displayed depreciation/capex/working-capital schedules reduce to:
FCFF_t=Revenue_t × margin × (1-tax)-k(Revenue_t-Revenue_(t-1)).
The terminal cash flow is:
FCFF_(6)=Revenue_5(1+g) × margin × (1-tax)-kRevenue_5g.
No backlog asset is added on top. No future buyback accretion is assumed. No exact private-fund IRR or observed AI ROIC is supplied because the necessary inputs are unavailable. The normalizations and sensitivity ranges are valuation judgments that the reader can replace.
Appendix B. Three headline checks against the primary documents
| Headline input | Primary location | Independent reconciliation | Result |
|---|---|---|---|
| FY2026 AI revenue: $24.683bn | FY2026 10-K, Note 18 p129; us-gaap:Revenues, context c-466, fact f-1871 | MD&A p52 and annual segment total | Exact match |
| H1 FY2027 FCF: $4.104bn | FY2027 Q2 10-Q, cash-flow statement p8 | $6.306bn CFO − $2.202bn capex; non-GAAP reconciliation p52 | Exact match |
| DFS-owned assets: $23.612bn | FY2027 Q2 10-Q, MD&A p63 | Note 4 pp16–18: $20.430bn receivables + $3.182bn lease equipment | Exact match |
An additional debt check gives $9.618bn debt issued by DFS + $11.042bn allocated corporate debt = $20.660bn DFS-related debt. Applying seven-eighths to rounded owned assets produces a $0.5 million rounding difference. The data package includes the verification records and the full financial-input mapping.
Source notes
All sources were accessed November 12, 2026. Page numbers refer to printed filing pages unless identified as PDF pages. The raw files provide finer field-level locators and dates for each source.
- Dell, FY2027 Q2 Form 10-Q, quarter ended July 31, 2026, filed September 8. Balance sheet p5; cash flows p8; DFS Note 4 pp16–21; debt Note 6 p25; capitalization/EPS pp36–38; segment Note 14 pp39–41; non-GAAP cash reconciliation p52; business results pp58–59; debt allocation pp63–64. Field-level XBRL tags, contexts and fact IDs are in financial_inputs.csv. ↩
- Dell, third-quarter results calendar, November 10 announcement of November 24 FY2027 Q3 results. ↩
- Dell, FY2026 Form 10-K, year ended January 30, 2026; MD&A pp52–53 and segment Note 18 pp127–129; cash-flow statement and liquidity reconciliation. ↩
- Dell, FY2025 Form 10-K, MD&A pp56–58 and segment Note 18 pp136–139. ↩
- Dell, FY2024 Form 10-K, business-unit results, cash-flow statement, free-cash-flow reconciliation and Note 19. FY2022/FY2023 balances also use FY2023 Form 10-K. ↩
- Dell FY2025 10-K, Note 1 pp83–84 and Note 22 pp146–149; revised prior-period financial statements. Revised quarterly CSG values also appear in the FY2025 Q4 financial tables, pp12–17. ↩
- Dell, Q4 FY2026 earnings-call transcript, February 26, 2026, PDF p6 on AI margins and p12 on shipments/revenue. ↩
- Dell, Q1 FY2027 earnings-call transcript, May 28, 2026, PDF p4. ↩
- Dell, Q2 FY2027 earnings-call transcript, September 1, 2026; ISG profitability discussion and outlook. ↩
- Dell, financial-results archive, quarterly financial tables and earnings transcripts. quarterly_segments.csv provides the exact URL, locator and status for each quarter and each AI measure. Orders and backlog are rounded operating disclosures outside the GAAP income statement. ↩
- Dell, FY2027 Q2 financial results, September 1, 2026, latest revenue, orders, backlog and outlook. ↩
- Supermicro, FY2026 Form 10-K, consolidated statements of operations p59. Source amounts in thousands are divided by 1,000 for workbook millions. ↩
- Supermicro, FY2027 Q1 Form 10-Q, filed November 5, 2026; operations p3, cash flow p7, margin explanation p45. ↩
- Dell, FY2022 full-year results, continuing-Dell operating-cash-flow disclosure. ↩
- Microsoft, Windows 10 lifecycle announcement, ordinary support ending October 14, 2025. Extended-support arrangements follow different terms. ↩
- Yahoo Finance DELL historical prices and StockAnalysis historical prices, latter identifying S&P Global Market Intelligence as provider. November 11, 2026 close $373.68. Secondary market-data reference; company/exchange dynamic quote tables did not supply a usable primary print during retrieval. ↩
- Dell, final Schedule 13E-3 amendment, October 29, 2013, introduction; amended merger proxy, market-price section p76; initial financing commitment filing, Item 1.01. ↩
- Dell, 2016 EMC transaction Form 8937, attachment lines 14 and 16; EMC final merger proxy, comparative market-price information. ↩
- Dell, FY2017 Form 10-K, capital resources and Note 3, EMC financing. ↩
- Dell, 2018 Class V transaction Form 8937, attachment lines 14 and 16 and reference valuation. ↩
- Dell, FY2019 Form 10-K, pp12–13 Class V transaction and Note 14 capitalization. ↩
- Dell, superseding 2021 VMware spin-off Form 8937, attachment lines 14–16 and reference prices. ↩
- Dell, November 1, 2021 Form 8-K, Items 1.01 and 2.01. ↩
- Broadcom/VMware, final election results, Exhibit 99.1; Broadcom, 2024 stock-split Form 8-K, Item 5.03. ↩
- Dell proxies: 2022 pp55–57, 2023 pp65–67, 2024 pp66–68, 2025 pp63–65, 2026 pp113–115, beneficial ownership tables and footnotes. ↩
- Silver Lake, Schedule 13D/A amendment 15, filed September 11, 2026, Item 5(a), ownership as of September 9. ↩
Supporting material
- Excel model ↗Sourced inputs, live calculations and reported outputs.
- Source and model data (CSV collection) ↗Data tables, source references and calculation exports.
- Source index ↗Download as CSV.