Financial systems
Anthropic IPO: what does the valuation require?
At the $74 midpoint, Anthropic’s proposed IPO implies $968 billion in legally outstanding equity. A model including contingent claims needs about $1.03 trillion in 2035 revenue.
The short version
- At $74 a share, Anthropic’s IPO implies $968 billion of equity on legally outstanding shares and $1.33 trillion counting options, RSUs and conditional claims.
- At $74, the base case needs about $1.03 trillion of annual revenue in 2035; across cash-conversion cases the range is $401.867 billion to $6,138.260 billion.
- Anthropic describes $900.9 billion of broad committed compute spending but gives a complete dated ladder for only $319.993 billion of it.
- The $80.7 billion first-half net loss mostly reflects accounting increases in the value of financing claims that can become shares; the nine-month operating loss is $1.260 billion.
At $74 a share, Anthropic’s proposed IPO implies $968 billion of legally outstanding equity and $1.33 trillion if options, restricted stock units, rollover notes, and specified conditional claims are included. Under the base assumptions below, supporting the larger valuation requires about $1.03 trillion in annual revenue by 2035 and a 30% operating margin.19
Anthropic recorded $33.242 billion of revenue and a $1.260 billion operating loss in the nine months through September 2026. The 2035 figure is what the proposed price requires under my assumptions, not a forecast.1
Tools used for this report were GPT-6 Pro for research and Claude for the brief.
When is the Anthropic IPO?
Anthropic expects to price on November 18, 2026, and begin trading on November 19, 2026, Eastern time, subject to regulatory clearance, according to its November 12 filing. The price is still preliminary.2
The original S-1 was filed October 26, followed by amendments on November 2 and November 10. An S-1 is the registration statement containing the business, risk factors, financial statements and offering terms. The latest amendment proposes 825 million public shares at $70–$78, on the Nasdaq Global Select Market under ANT. The offer includes 801,351,354 newly issued shares and 23,648,646 shares sold by existing holders. The company receives no proceeds from those secondary sales.3
The underwriters have an option to buy another 123.75 million newly issued shares. The figures below use the base offering unless noted.3
The S-1 in ten numbers
Annual 2023–2025 statements are audited; the 2026 nine-month and quarterly statements are unaudited. Page references are printed prospectus pages (F- for financial statements) in the November 10 amendment.1
| Number | What it measures and when | Printed page |
|---|---|---|
| $33.242bn | Revenue, nine months ended September 30, 2026 | F-7 |
| 85.5% | Calculated gross margin, same nine months | F-40 and F-7 |
| $19.240bn | Research and development expense, same nine months | F-40 |
| $1.260bn loss | Operating result, same nine months | F-7 |
| $104.039bn loss | Net result, same nine months | F-7 |
| $6.569bn inflow | Cash from operations, same nine months | F-12 |
| $131.845bn | Cash and short-term investments, September 30, 2026 | F-5 |
| $70.7bn | Broad commitments due October 2026–September 2027 | 178 |
| $900.9bn | Broad committed-spending disclosure, including agreements after September 30 | 177 |
| $1.333tn | Modeled equity value including expanded claims at the $74 midpoint | 24 |
How much revenue does Anthropic make?
Anthropic recorded $16.956 billion of revenue in the third quarter of 2026, up 46.7% from the previous quarter. The trailing four quarters brought in $35.282 billion. The valuation model starts from $67.824 billion, four times Q3 revenue. Anthropic’s own run-rate measure was $71 billion at September 30 and $81 billion at October 31.5, 4
| Period | Revenue, $bn | Operating income / (loss), $bn | Net income / (loss), $bn |
|---|---|---|---|
| 2023, audited | 0.041 | (0.551) | (1.531) |
| 2024, audited | 0.386 | (2.980) | (8.309) |
| 2025, audited | 4.585 | (8.060) | (41.965) |
| Nine months to September 30, 2025, unaudited | 2.545 | (5.224) | (25.107) |
| Nine months to September 30, 2026, unaudited | 33.242 | (1.260) | (104.039) |
Source: November 10 S-1/A, F-7. Parentheses indicate losses.
| Quarter, unaudited | Revenue, $bn | Compute and infrastructure, $bn | Operating income / (loss), $bn | Stock compensation, $bn |
|---|---|---|---|---|
| Q1 2025 | 0.376 | 0.944 | (0.935) | 0.105 |
| Q2 2025 | 0.787 | 1.390 | (1.200) | 0.181 |
| Q3 2025 | 1.382 | 2.047 | (3.089) | 0.305 |
| Q4 2025 | 2.040 | 2.945 | (2.836) | 0.574 |
| Q1 2026 | 4.731 | 3.387 | (1.667) | 0.924 |
| Q2 2026 | 11.555 | 5.558 | 0.974 | 1.261 |
| Q3 2026 | 16.956 | 9.863 | (0.567) | 1.070 |
Source: November 10 S-1/A, pages 164 and 167. The reported expenses include stock compensation.
Anthropic’s quarterly revenue rose from $0.4 billion to $17.0 billion in six quarters
Quarterly revenue, USD billions, unaudited, Q1 2025 to Q3 2026
Show the numbers
| USD billions | Revenue |
|---|---|
| Q1 2025 | 0.4 |
| Q2 2025 | 0.8 |
| Q3 2025 | 1.4 |
| Q4 2025 | 2.0 |
| Q1 2026 | 4.7 |
| Q2 2026 | 11.6 |
| Q3 2026 | 17.0 |
Operating income was positive in only one of those seven quarters
Quarterly operating income (loss), USD billions, unaudited, Q1 2025 to Q3 2026
Numbers and method
| USD billions | Operating income (loss) |
|---|---|
| Q1 2025 | −0.9 |
| Q2 2025 | −1.2 |
| Q3 2025 | −3.1 |
| Q4 2025 | −2.8 |
| Q1 2026 | −1.7 |
| Q2 2026 | 1.0 |
| Q3 2026 | −0.6 |
Source: November 10 S-1/A, pp. 164 and 167; workbook Financials. Unaudited quarters through September 30, 2026; retrieved November 12, 2026.
Nine-month revenue included $26.306 billion from usage-based charges and $6.936 billion from subscriptions. The filing provides no complete revenue breakdown by product or named cloud marketplace.6
I calculated Q3 2026 functional costs from the nine-month and first-half figures, and Q4 2025 from the full-year and nine-month figures. The filings do not disclose the Q1 and Q2 2026 functional splits or quarterly 2023–2024 results.7
Is Anthropic profitable?
Anthropic has reported a profitable quarter, but not a nine-month operating profit: Q2 2026’s $974 million operating profit was followed by Q3’s $567 million operating loss. Operating profit measures revenue after the costs of running the business, before financing-related gains, losses and taxes.5
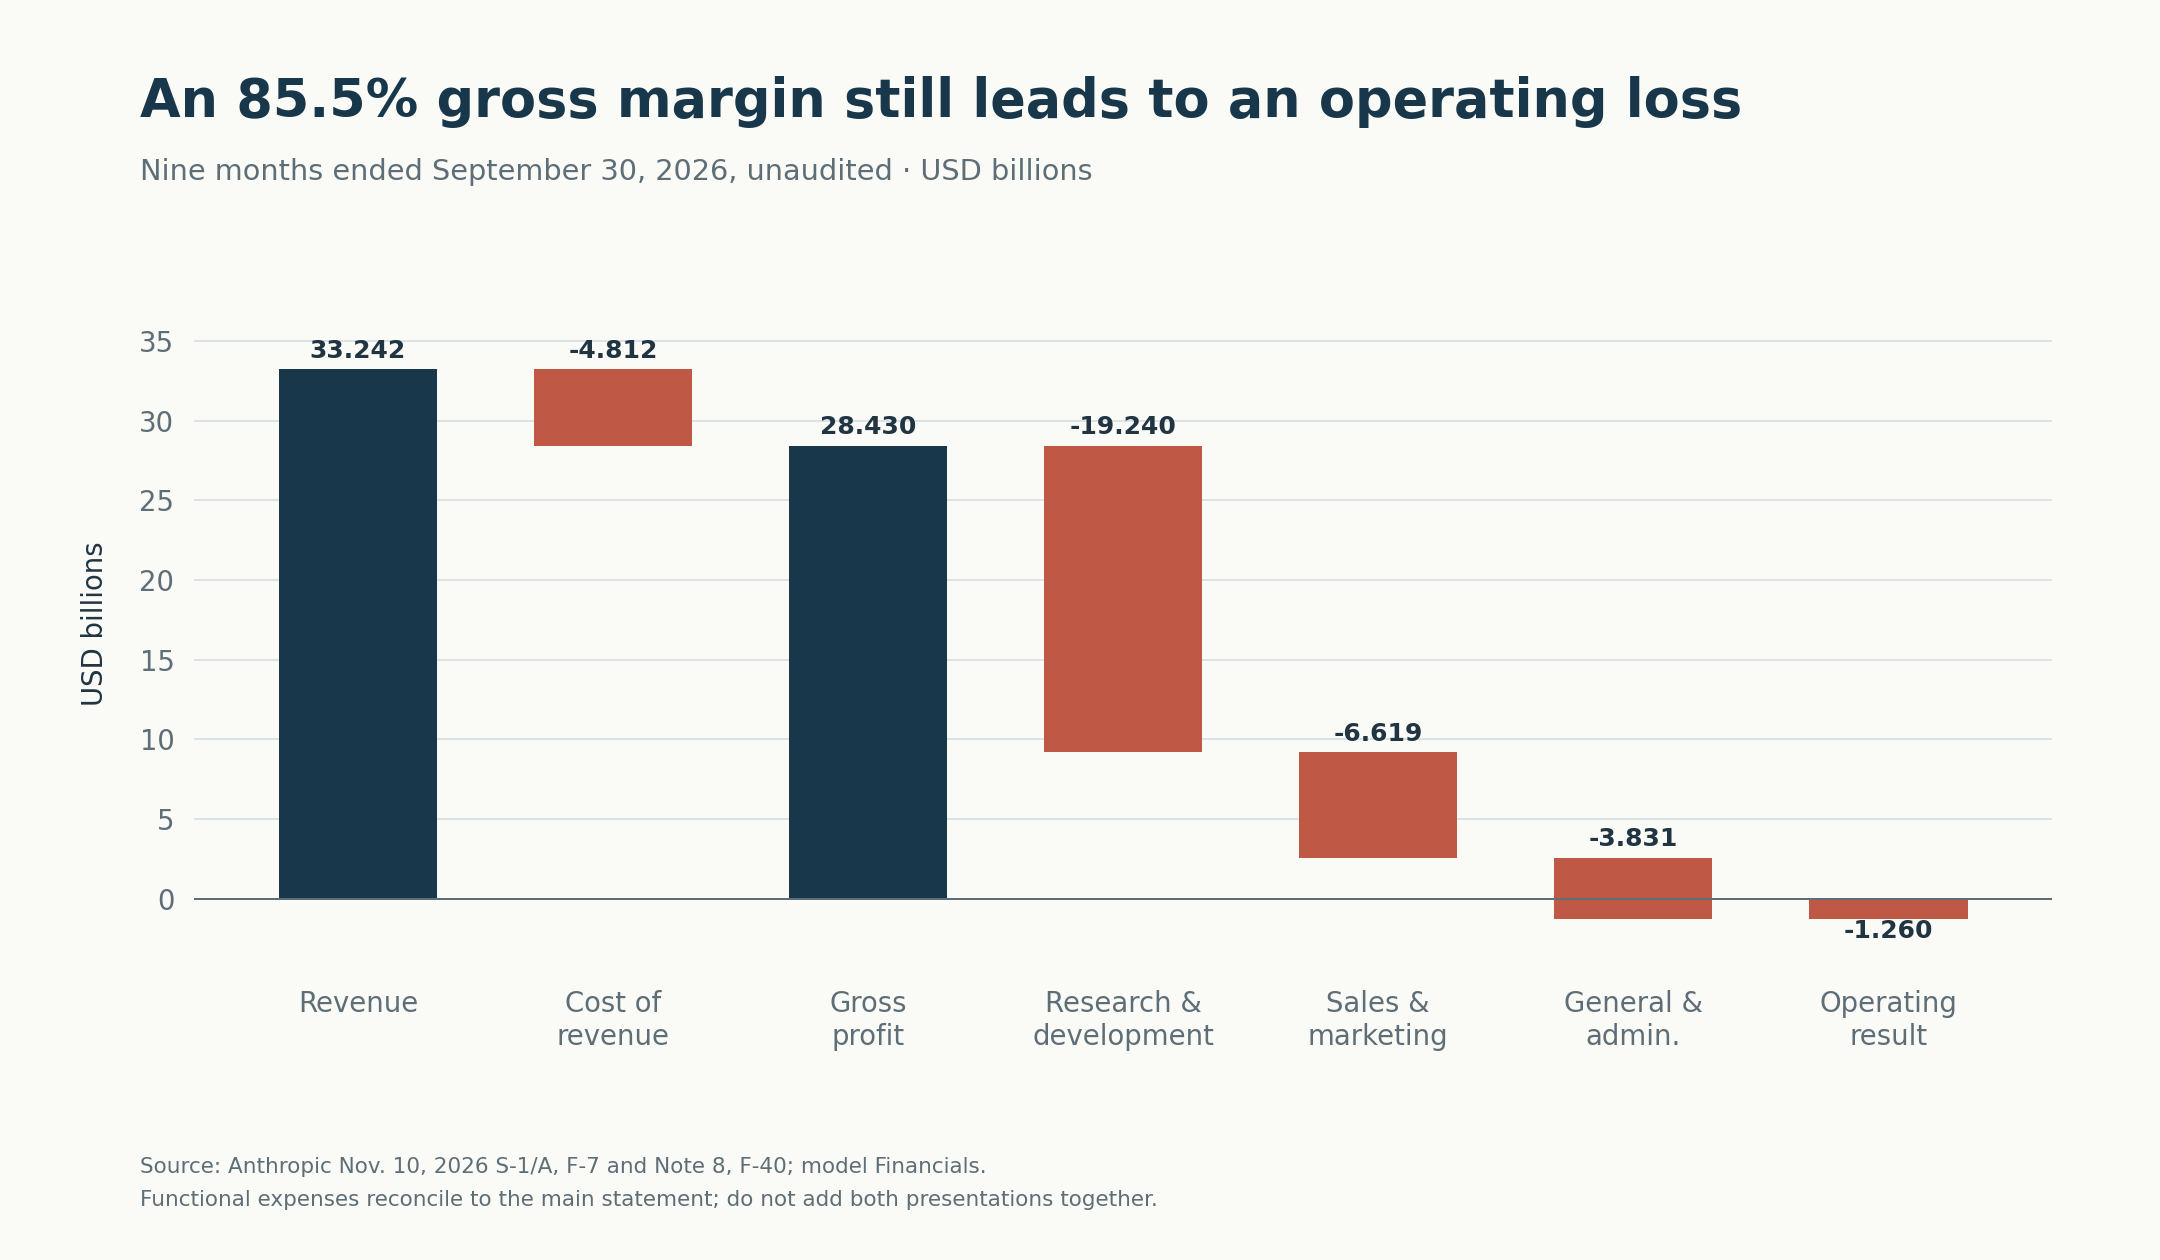
For the nine months ended September 30, 2026, revenue of $33.242 billion less $4.812 billion of cost of revenue leaves $28.430 billion of gross profit, or 85.5% of revenue. Subtract $19.240 billion of research and development, $6.619 billion of sales and marketing, and $3.831 billion of general and administrative expense and the result is the $1.260 billion operating loss.7
 (opens the full-size image)
The main income statement groups costs by their nature—compute, personnel and other categories. The footnote groups them by function—serving customers, research, selling and administration. Both presentations sum to the same $34.502 billion of operating expenses. Adding the two presentations together would count the same spending twice.
Cost of revenue predominantly includes customer-serving compute, with related personnel and overhead. Research and development includes model-development, research and internal-use compute, but also labor, software and overhead. Sales and marketing includes some free-access compute and distribution costs. Consequently, training compute alone is not disclosed: subtracting cost of revenue from total compute does not isolate it.7
The filing attributes part of Q3’s pressure to $5.0 billion of higher-cost short-term compute. Q3 adjusted operating profit of $2.463 billion adds back $1.070 billion of stock compensation and $1.960 billion of noncash charitable matching expense to the reported loss. Stock compensation still transfers value to employees.8
The filing estimates a $14.2 billion IPO-related restricted-stock-unit catch-up charge. A restricted stock unit, or RSU, is a promise to deliver shares when its conditions are met. The catch-up is the award expense Anthropic expects to book at the IPO. The filing also calculates a hypothetical expense for the historical period.9
Why did Anthropic lose $80.7 billion?
The $80.748 billion first-half 2026 net loss mostly reflects increases in the accounting value of financing claims that can become shares. The largest adjustment was a $72.4 billion fair-value charge. The updated nine-month net loss is $104.039 billion, and because only some claims convert at the IPO, the filing still shows a $96.799 billion pro forma loss after its specified conversion and compensation adjustments.10
| Nine months ended September 30, 2026 | Effect on net income, $bn |
|---|---|
| Operating loss | (1.260) |
| Interest income | 2.359 |
| Convertible-note, derivative and SAFE fair-value changes | (94.324) |
| Other income / expense, net | (10.397) |
| Income-tax provision | (0.417) |
| Net loss | (104.039) |
A SAFE is a financing contract that can deliver equity under specified future conditions. Fair-value remeasurement updates what a claim is worth for accounting purposes. When the value of an equity-linked claim rises, the issuer can record an expense even though no cash equal to that expense leaves the business. The obligation and dilution remain economically relevant.
The $10.397 billion other-expense line includes $11.008 billion of partner-financing recognition and remeasurement losses, $52 million of holdback losses, $783 million of gains on warrant rights the company owns, and $120 million of other expense. These warrants are assets Anthropic holds.11
A $94.3 billion fair-value charge on convertible instruments drives most of the $104.0 billion nine-month net loss
Effect on net income by item, nine months ended Sep 30, 2026, USD billions, unaudited
Numbers and method
| USD billions | Effect on net income |
|---|---|
| Operating loss | −1.3 |
| Interest income | 2.4 |
| Convertible-instrument fair-value expense | −94.3 |
| Other expense, net | −10.4 |
| Income taxes | −0.4 |
| Net loss | −104.0 |
Source: November 10 S-1/A, F-7, F-39 and p. 27; workbook Financials and Reference inputs. Nine months ended September 30, 2026, unaudited; retrieved November 12, 2026.
“Pro forma” means a counterfactual calculation that applies specified transaction assumptions to a historical period. The filing starts with the $104.039 billion loss, removes $14.727 billion of remeasurement associated with specified converted notes, and adds $7.487 billion of RSU compensation: −104.039 + 14.727 − 7.487 = −96.799, in billions.10
Amazon’s ownership cap leaves substantial rollover notes outstanding. Only $579.3 million of principal is assumed to convert into 276,827,518 Class N shares at the IPO. Remaining notes continue to be remeasured until conversion, repayment or settlement, so they can still affect reported earnings after listing.12
How much does Anthropic owe for computing?
The filing describes $900.9 billion of broad committed spending, but supplies a complete dated ladder for only $319.993 billion of that scope.13
| Payment bucket | Operating leases, $bn | Finance leases, $bn | Purchases, $bn | Dated total, $bn | Dated total / September 30 cash and investments |
|---|---|---|---|---|---|
| Remainder of 2026 | 0.057 | 0.121 | 5.053 | 5.231 | 4.0% |
| 2027 | 0.303 | 0.438 | 28.424 | 29.165 | 22.1% |
| 2028 | 0.462 | 0.422 | 43.473 | 44.357 | 33.6% |
| 2029 | 0.445 | 0.406 | 46.901 | 47.752 | 36.2% |
| 2030 | 0.466 | 0.390 | 44.214 | 45.070 | 34.2% |
| Thereafter | 2.491 | 0.173 | 145.754 | 148.418 | 112.6% |
| Total | 4.224 | 1.950 | 313.819 | 319.993 | — |
Source: November 10 S-1/A, p. 178 and F-5. The percentages compare each bucket with cash and investments on September 30, 2026.
The bridge to the broader total adds $17.4 billion of short-term arrangements, $451.2 billion of leases not yet commenced, $105.7 billion of subsequent longer-term agreements, and $6.6 billion of subsequent short-term agreements. These components total $900.893 billion, which rounds to the disclosed $900.9 billion. The additional $580.9 billion lacks a complete annual allocation in the published ladder.13
Dated commitments reach $44 billion to $48 billion a year in 2028 to 2030, with $148 billion due after 2030
Dated payments by year, USD billions, as of Sep 30, 2026 plus subsequent agreements
Show the numbers
| USD billions | Dated payments |
|---|---|
| Rest of 2026 | 5.2 |
| 2027 | 29.2 |
| 2028 | 44.4 |
| 2029 | 47.8 |
| 2030 | 45.1 |
| Thereafter | 148.4 |
Only $320 billion of $901 billion in commitments has a year-by-year schedule
Dated ladder against additional components without a complete annual allocation, USD billions
- Dated ladder
- Additional components without a complete annual allocation
Numbers and method
| USD billions | Dated ladder | Additional components without a complete annual allocation |
|---|---|---|
| Commitments | 320.0 | 580.9 |
Source: November 10 S-1/A, pp. 177–180; workbook Commitments. September 30, 2026 balances plus subsequent agreements described in the November 10 filing; retrieved November 12, 2026.
The filing also identifies $70.7 billion due over October 2026–September 2027, including a $4.2 billion conditional subset, and $451.6 billion expected to be incurred before December 31, 2030 under the broader scope. The next-12-month amount is larger than calendar 2027’s dated bucket because it covers more arrangements and a different period.13
In the base revenue path below, the dated 2027–2030 totals equal 31.8%, 35.7%, 28.5% and 19.9% of modeled annual revenue. These cover only the dated part of the commitments; the company has not disclosed enough annual timing to compute the ratio for the entire $900.9 billion.
The broad total includes $186.2 billion subject to termination rights or commencement contingencies. Management also estimates $150–$175 billion for arrangements without fixed dollar commitments, outside the fixed total. That range depends on capacity, delivery, pricing and deployment conditions, so it is not an exact debt figure.13
How much revenue comes through Amazon and Google?
The disclosed figure is 44% of nine-month 2026 revenue through all cloud-service-provider marketplaces, or $14.626 billion at the rounded percentage. The filing gives no vendor-level breakout for that revenue, computing costs, or distribution fees.14
The accounting policy says “the Company is the principal” for these transactions. That means Anthropic records the customer revenue gross and records partner costs as expenses. A net-basis restatement would require the amount paid to each intermediary.15
This matters because cost of revenue and partner distribution expense sit in different functions. Anthropic’s 85.5% gross margin follows from those definitions. Comparing it with another lab’s requires knowing which costs the other lab deducts from revenue.
| Relationship disclosed as of November 10, 2026 | Amazon | |
|---|---|---|
| Class N shares after the assumed IPO at $74 | 1,920,511,218 | 1,789,598,269 |
| Additional shares from full rollover-note conversion | 1,563,617,444 potential shares | No comparable rollover line identified |
| Named fixed compute agreement | $110.0bn minimum, May 2026–April 2036 | $121.3bn minimum, April 2026–July 2033 |
| Named channel revenue, nine months to September 30 | UNKNOWN | UNKNOWN |
| Named recognized compute cost, same period | UNKNOWN | UNKNOWN |
Source: November 10 S-1/A, pp. 119–120, 172–179 and Note 1. Both named agreements fall within the commitments total.16
Amazon’s September 2026 10-Q corroborates its investment and notes, but the fair values differ: Amazon estimates its Anthropic convertible-note assets at $146.2 billion, while Anthropic reports a $130.502 billion liability for outstanding Amazon notes. The filings leave the difference unexplained. Alphabet’s 10-Q describes an unnamed $20 billion funding commitment through 2030 that could refer to Anthropic’s Google arrangement.17, 18
The five largest customers supplied approximately 25% of nine-month revenue, with each accounting for 10% or less. Anthropic describes its marketplace partners as agents that collect payments from end customers.14, 15
What is Anthropic’s IPO valuation?
At $74, the legally outstanding Class A and Class N shares imply $968.414 billion of equity value. Counting options, remaining RSUs, rollover-note conversion and specified conditional claims implies $1,332.962 billion.19
| Share-count convention at $74, no overallotment | Economic shares or claims, billions | Equity value, $bn |
|---|---|---|
| Accounting outstanding A + N, excluding subsidiary-held shares | 12.239832 | 905.748 |
| Legal outstanding A + N, including subsidiary-held benefit shares | 13.086673 | 968.414 |
| Expanded economic claims used in the model | 18.012993 | 1,332.962 |
The share bridge ends with 7,430,143,944 Class A shares, 7,804,580,273 Class N shares, 1,704,567,865 net option shares and 1,073,701,297 RSUs. The two non-economic founder/trust control shares are excluded from the value calculation.19
The bridge begins with historical common shares, adds converted preferred shares, the notes converting at the offer, net-settled RSUs, newly issued IPO shares and the concurrent placement. It then adds subsidiary-held public-benefit shares, net option dilution, outstanding and subsequent RSUs, full future rollover-note conversion, acquisition shares/holdbacks and specified donation-matching claims. Unawarded future plan reserves are excluded. The capitalization disclosure lists no issuer warrants.
At $74 a share, Anthropic’s equity is $906 billion to $1,333 billion depending on which shares are counted
Equity value by share count, hypothetical IPO at $74, no overallotment, USD billions
Numbers and method
| USD billions | Equity value |
|---|---|
| Accounting outstanding (12.24bn A + N shares) | 906 |
| Legally outstanding (13.09bn A + N shares) | 968 |
| Expanded economic claims (18.01bn shares and claims) | 1,333 |
Source: November 10 S-1/A, pp. 19–25 and 130; workbook Ownership. Hypothetical IPO at $74, no overallotment; retrieved November 12, 2026.
Anthropic’s May 28 announcement described a $65 billion round at a $965 billion post-money valuation. The later SEC note reports $65.2 billion of gross proceeds closed in Q2: the first figure is the rounded funding announcement, the second the filing’s account of the closed round.20
For the valuation model, the reported pro forma cash and investments of $212.684 billion are deducted from expanded equity value and the $1.674 billion present value of finance-lease liabilities is added. That yields a $1,121.952 billion enterprise-value target at $74. Enterprise value is the value attributed to operations after this cash-and-financing adjustment.21
Rollover notes are already represented as future shares in this denominator, so their remaining fair-value liability is not added again. Nor is every future cloud payment added as debt while its operating or investment cost is also included in cash flow.
What must revenue and margins become to support the price?
In the base scenario, supporting the preliminary $70–$78 range requires $964 billion–$1.091 trillion of annual revenue in 2035. At the $74 midpoint, the model requires 35.3% annual revenue growth from the $67.824 billion annualized starting scale, reaching $227.008 billion in 2030 and $1,027.691 billion in 2035.
A reverse discounted cash flow, or reverse DCF, starts with a valuation and solves for the business performance that would support it. It discounts future cash available to all capital providers to today. Faster early growth or a different investment cycle can change the 2035 revenue requirement.
Three assumptions carry most of this result: the eventual operating margin, the cash needed to build and replace computing assets, and the discount rate used to value distant cash flows.
| Base assumption, set November 12, 2026 | 2030 | 2035 and terminal period |
|---|---|---|
| Operating margin, after recurring stock compensation | 25% | 30% |
| Economic capital spending / revenue | 18.75% | 15% |
| Depreciation and amortization / revenue | 7% | 10% |
| Normalized cash tax rate | 21% | 21% |
| Working capital needed per extra dollar of revenue | 5% | 5% |
| Discount rate | 11% | 11% |
Capital spending includes cash purchases and newly capitalized finance-leased assets. The model adds back depreciation and amortization and deducts new investment. Operating leases remain operating costs. Finance-lease principal is financing and is not deducted a second time from this unlevered cash flow.
Revenue grows at one solved annual rate through 2035. Operating margin and depreciation rise as shares of revenue. The capital-spending ratio falls from 22.5% in 2027. After 2035, revenue grows at 3% annually with terminal ratios held constant. There is no assumed tax-loss benefit or recurring stock-compensation addback. Existing award dilution is included, which can be conservative during the vesting transition.
What must be true at three offer prices?
All revenue and spending entries below are annual USD billions, calculated as of November 12, 2026. Each price uses the same base operating assumptions.
| Preliminary price | Expanded equity value | Required 2030 revenue | 2030 operating margin | 2030 capital spending | Required 2035 revenue | 2035 operating margin | 2035 capital spending |
|---|---|---|---|---|---|---|---|
| $70 | 1,262.036 | 220.689 | 25% | 41.379 | 964.442 | 30% | 144.666 |
| $74 | 1,332.962 | 227.008 | 25% | 42.564 | 1,027.691 | 30% | 154.154 |
| $78 | 1,403.887 | 233.121 | 25% | 43.710 | 1,091.015 | 30% | 163.652 |
The $26 billion concurrent placement is a fixed-dollar investment, so its share count changes with the offer price. The option treasury-stock adjustment also changes with price. The model recalculates both instead of holding the share count fixed.19
Supporting a $74 IPO price in the base case takes about $1.03 trillion of annual revenue by 2035
Annual revenue required by a reverse DCF at three prices, USD billions; 30% mature operating margin, 15% capital spending to revenue, 11% discount rate
Numbers and method
| USD billions | 2030 annual revenue | 2035 annual revenue |
|---|---|---|
| $70 preliminary price | 221 | 964 |
| $74 midpoint | 227 | 1,028 |
| $78 preliminary price | 233 | 1,091 |
Source: analyst reverse DCF dated November 12, 2026; workbook Valuation. Starting inputs: November 10 S-1/A, pp. 24, 130 and 164. Revenue requirements are conditional on the model assumptions.
How much do the assumptions change the answer?
At $74, the modeled 2035 revenue requirement ranges from $401.867 billion under high cash conversion to $6,138.260 billion under low cash conversion. This wide range shows that an IPO price cannot identify a unique future revenue number.
| Economics at $74, analyst scenarios | Low cash conversion | Base | High cash conversion |
|---|---|---|---|
| Discount rate | 13% | 11% | 9% |
| 2035 operating margin | 20% | 30% | 40% |
| 2035 capital spending / revenue | 20% | 15% | 12% |
| Required 2030 revenue, $bn/year | 502.355 | 227.008 | 149.556 |
| Required 2035 revenue, $bn/year | 6,138.260 | 1,027.691 | 401.867 |
| Required 2035 capital spending, $bn/year | 1,227.652 | 154.154 | 48.224 |
Under the low-conversion assumptions, cash flows through 2035 have negative present value. Cash flows after 2035 then have to support more than the entire valuation. Lower margins and higher investment drive the unusually large revenue requirement.
Holding capital spending at the base path isolates the margin and discount-rate sensitivity:
| Discount rate / 2035 operating margin | 20% margin | 30% margin | 40% margin |
|---|---|---|---|
| 9% | 1,251 | 677 | 458 |
| 11% | 1,921 | 1,028 | 691 |
| 13% | 2,762 | 1,463 | 978 |
Required 2035 annual revenue in USD billions at $74; analyst calculations dated November 12, 2026. All other inputs use the base case.
In the base case, 84.4% of enterprise value comes from cash flows after 2035. The valuation hinges on how much of each dollar in sales Anthropic can keep after operating costs and reinvestment for years beyond 2035.
The model starts from the filing’s hypothetical IPO-adjusted September 30 cash balance. For each $1 rise in offer price, it adds $793 million in net proceeds and deducts $52 million in added RSU withholding. The capitalization note gives a $793 million cash sensitivity. The model uses the $741 million change implied by the use-of-proceeds section.21
How does that compare with software and cloud companies?
Large software and cloud businesses have reached operating margins around or above the base case’s 30% target. Anthropic would have to sustain that margin while funding model research and computing commitments.
| Business and fiscal year ending | Annual revenue, $bn | Annual revenue growth | Reported operating margin |
|---|---|---|---|
| AWS, December 2019 | 35.026 | 36.5% | 26.3% |
| Google Cloud, December 2023 | 33.088 | 25.9% | 5.2% |
| Microsoft Intelligent Cloud, June 2019 | 38.985 | 21.0% | 35.7% |
| Salesforce, January 2024 | 34.857 | 11.2% | 14.4% |
| AWS, December 2021 | 62.202 | 37.1% | 29.8% |
| Microsoft Intelligent Cloud, June 2021 | 60.080 | 24.2% | 43.5% |
Sources are the respective SEC annual filings and the Benchmarks workbook tab. The comparison uses historical fiscal years with similar revenue (retrieved November 12, 2026).22
At $33 billion to $62 billion of annual revenue, peer operating margins ranged from 5.2% to 43.5%
Reported operating margin, % of revenue, selected cloud and software businesses at comparable revenue (revenue in brackets)
Numbers and method
| % operating margin | Operating margin |
|---|---|
| Microsoft IC 2021 ($60.1bn) | 43.5% |
| Microsoft IC 2019 ($39.0bn) | 35.7% |
| AWS 2021 ($62.2bn) | 29.8% |
| AWS 2019 ($35.0bn) | 26.3% |
| Salesforce FY2024 ($34.9bn) | 14.4% |
| Google Cloud 2023 ($33.1bn) | 5.2% |
Source: SEC annual filings listed in benchmarks_inputs.csv; workbook Benchmarks. Fiscal years are identified in the chart; retrieved November 12, 2026.
The lower-scale rows are annual periods near the dollar amount of Anthropic’s nine-month revenue, so their periods are not identical. The larger-scale rows are closer to Anthropic’s annualized Q3 scale.
AWS is a segment with allocated costs. Google Cloud includes Workspace and excludes certain shared general-AI research and corporate costs. Microsoft’s management accounting gives one Intelligent Cloud margin for Azure, server products, and enterprise services together. Salesforce is a consolidated GAAP result including stock compensation. None of the rows is a normalized AI-lab margin.
OpenAI announced a confidential S-1 submission on June 8. Its operating-company statements remained private as of the November 12 SEC check, leaving too little data for a comparison on the same accounting basis.23
How much cash runway does Anthropic have?
A historical cash-burn runway does not apply because cash from operations was positive $6.569 billion. The open question is whether collections, financing and cash reserves can fund the coming investment and commitment schedule.24
Subtracting $925 million of cash capital expenditure, $1.955 billion of leased-asset and equipment prepayments, and $88 million of finance-lease principal payments leaves a $3.601 billion historical cash subtotal for the nine months ended September 30. The subtotal precedes other investing items and excludes new noncash lease commitments.
At the $74 midpoint, the filing estimates $84.6 billion of net issuer proceeds, already including the concurrent placement, with approximately $3.8 billion used for RSU tax withholding. It describes general corporate purposes, including working capital, operating expenses and capital expenditures, and potential acquisitions or investments without a complete dollar allocation. Adding the placement a second time would overstate financing.25
The $131.845 billion September 30 cash-and-investments balance and $212.684 billion pro forma adjusted balance are dated snapshots. Dividing either by future commitments would omit customer receipts and other spending. The filing also describes undrawn financing that depends on borrowing or investment conditions.
Who controls Anthropic after the IPO?
Economic ownership does not give every class the same control. The Long-Term Benefit Trust’s non-economic Class T share elects four of seven authorized directors, while the founders’ non-economic Class F share carries 50.1% of general voting power. One trust-elected board seat was vacant.26
Class N generally has no vote but participates economically and can convert in qualifying transfers. Class A and the founder control structure select the other board seats under the filed arrangements. The Trust therefore has substantial board-appointment authority without a corresponding economic share value to add to market capitalization.
Lock-ups—the contractual limits on selling existing shares—are staged and vary by holder. Certain employees outside the founder group can transfer up to 10% of covered shares on the first trading day and up to 35% more at 6 a.m. Eastern on the second full trading day after fiscal 2026 results. Other holders follow different earnings-based or day-count schedules, and underwriters can waive restrictions. The lock-up lookup lists the categories and triggers. The final prospectus and the earnings release dates will set the calendar.27
What evidence would change this answer?
The next decisive documents are a final prospectus, any new amendment and the first public-company quarterly report. Each can change a different part of the calculation.
| New evidence | What gets recalculated |
|---|---|
| Final price, issued shares, placement and overallotment | Dilution, proceeds, cash and enterprise-value target |
| Updated operating results and post-IPO stock compensation | Starting revenue scale and sustainable operating margin |
| Serving, training, free-access and distribution cost detail | Comparable gross margin and cash conversion |
| Annual timing of uncommenced leases and later contracts | Commitment coverage and financing needs |
| Current cash, actual capex and new finance leases | Cash bridge and economic reinvestment assumptions |
| Different conversion terms or retained note exposure | Dilution and the financing remeasurement explanation |
The first public earnings report can show whether new compute capacity improves operating margins. That matters more to the valuation than another quarter of financing remeasurement. The base case depends on Anthropic sustaining a 30% operating margin while investing 15% of annual revenue in computing assets by 2035.
The figures are current as of November 12, 2026. The next scheduled review is November 18, the expected pricing date.
Method and sources
The Excel model holds the historical statements, share bridge, and valuation scenarios. The historical data, valuation cases, and source register give periods, units, document links, and printed page references. The calculation index points to the arithmetic behind each figure. The SEC company-facts feed returned filing-fee facts at the November 12 cutoff.
Is Anthropic profitable? examines the operating results and run-rate disclosures in more detail. The AI commitments ledger traces major compute contracts and financing across the sector.
Frequently asked questions
Is Anthropic going public? Anthropic has filed to list on Nasdaq under ANT. Its November 12 filing gives November 18 for expected pricing and November 19 for expected trading, subject to regulatory clearance.
What is the Anthropic IPO price? The November 10 amendment proposes $70–$78 per share. Final pricing was pending on November 12.
Is Anthropic profitable? Anthropic reported $974 million of operating profit in Q2 2026 and a $567 million operating loss in Q3. It recorded a $1.260 billion operating loss on $33.242 billion of revenue over the first nine months.
Why is Anthropic’s net loss so large? Anthropic’s $104.039 billion net loss for the first nine months includes $94.324 billion of fair-value expense on convertible notes, derivative liabilities, and SAFEs. The expense measures the change in the accounting value of those claims.
Can I buy Anthropic stock before the IPO? The proposed public listing was pending on November 12. The filing describes a $26 billion placement with named investors and an IPO offering, with allocation dependent on the applicable terms.
Appendix: the complete share-count bridge
At the proposed $74 midpoint, with zero overallotment. Values are in millions of shares or claims. Source documents are the November 10 S-1/A, p. 24, and the Ownership tab of the workbook.
| Step | Shares / claims, millions | Timing or condition |
|---|---|---|
| Historical A + N common | 2,199.431287 | September 30, 2026 |
| Preferred conversion | 8,561.115159 | IPO |
| Notes converting at IPO | 276.827518 | IPO |
| Net RSU settlement | 49.754965 | IPO |
| Primary IPO shares | 801.351354 | IPO |
| Concurrent placement | 351.351348 | IPO at $74 |
| Accounting outstanding subtotal | 12,239.831631 | Excludes subsidiary-held shares |
| Public-benefit subsidiary shares | 846.840960 | Legally outstanding |
| Legal outstanding subtotal | 13,086.672591 | No overallotment |
| Options, net treasury method | 1,704.567865 | Dilutive economic claims |
| Remaining and subsequent RSUs | 1,073.701297 | Dilutive economic claims |
| Future rollover-note conversion | 1,563.617444 | Future contingent conversion |
| Acquisitions and holdbacks | 3.001035 | Includes contingent holdback |
| Donation matching claims | 581.433147 | Includes contingent maximum |
| Expanded economic claims | 18,012.993379 | Model valuation denominator |
The treasury-stock method estimates net option dilution by subtracting shares that option exercise proceeds could buy at the offer price.
- Anthropic November 10, 2026 S-1/A, consolidated statements F-5, F-7 and F-12; interim basis F-14 (retrieved November 12, 2026). ↩
- Anthropic IPO-website FWP, Exhibit A, filed November 12, 2026, communication dated November 10; Documents and FAQs, IPO timeline; SEC submissions record for CIK 2130357, checked November 12, 2026, 17:52:52 UTC. The FWP provides expected Eastern-time dates, subject to regulatory clearance. No 424B4 was in the retrieved record. ↩
- November 10 amendment, cover and pp. 19–20; October 26 original; November 2 amendment (retrieved November 12, 2026). ↩
- November 10 S-1/A, run-rate revenue p. 203 and quarterly revenue p. 164 (retrieved November 12, 2026). ↩
- November 10 S-1/A, quarterly statements p. 164 and adjusted operating reconciliation p. 167 (retrieved November 12, 2026). ↩
- November 10 S-1/A, Note 2, F-26 (retrieved November 12, 2026). ↩
- November 10 S-1/A, Note 8, F-40; October 26 original, Note 8, F-39 for first-half functional costs (retrieved November 12, 2026). ↩
- November 10 S-1/A, quarterly discussion p. 166 and adjusted operating reconciliation p. 167 (retrieved November 12, 2026). ↩
- November 10 S-1/A, stock-compensation discussion p. 182 (retrieved November 12, 2026). ↩
- November 10 S-1/A, F-7 and pro forma explanation p. 27; October 26 original, F-7 (retrieved November 12, 2026). ↩
- November 10 S-1/A, Note 8, F-39 (retrieved November 12, 2026). ↩
- November 10 S-1/A, p. 22, capitalization p. 130 and convertible-note discussion pp. 172–175 (retrieved November 12, 2026). ↩
- November 10 S-1/A, contractual obligations pp. 177–180, dated table p. 178; broad spending through 2030 p. 143 (retrieved November 12, 2026). ↩
- November 10 S-1/A, cloud-provider concentration note F-16 and customer concentration p. 59 (retrieved November 12, 2026). ↩
- November 10 S-1/A, revenue-recognition policy F-21 (retrieved November 12, 2026). ↩
- November 10 S-1/A, partner share ownership pp. 120–121, financing pp. 172–175 and infrastructure arrangements p. 179 (retrieved November 12, 2026). ↩
- Amazon September 2026 Form 10-Q, Note 3, pp. 11–12 (retrieved November 12, 2026). ↩
- Alphabet September 2026 Form 10-Q, Note 5, p. 26 (retrieved November 12, 2026). ↩
- Anthropic May 28, 2026 Series H announcement; November 10 S-1/A, Note 10, F-47 (retrieved November 12, 2026). ↩
- November 10 S-1/A, use of proceeds p. 127, capitalization p. 130 and finance leases F-35 (retrieved November 12, 2026). ↩
- Amazon FY2019 10-K, Note 10, p. 67; Amazon FY2021 10-K, Note 10, p. 65; Alphabet FY2023 10-K, Note 15, p. 86; Microsoft FY2019 10-K, Note 20, p. 90; Microsoft FY2022 10-K, Note 19, p. 94; Salesforce FY2024 10-K, p. 62 (retrieved November 12, 2026). ↩
- OpenAI announcement of confidential S-1 submission, June 8, 2026; SEC company-name and S-1-family searches captured in the search appendix, November 12, 2026. The November 12 search found no public S-1 for the operating company. ↩
- November 10 S-1/A, F-5, F-12–F-13 and supplemental cash-flow information F-40 (retrieved November 12, 2026). ↩
- November 10 S-1/A, use of proceeds p. 127 (retrieved November 12, 2026). ↩
- November 10 S-1/A, board composition p. 264 and Description of Capital Stock (retrieved November 12, 2026). ↩
- November 10 S-1/A, lock-up arrangements pp. 333–335 (retrieved November 12, 2026). ↩
Supporting material
- Excel model (XLSX file) Sourced inputs, live calculations and reported outputs.
- Source and model data (CSV collection) (ZIP file) Data tables, source references and calculation exports.
- Source register (CSV file) Download as CSV.
- Historical financials (CSV file) Download as CSV.
- Valuation cases (CSV file) Download as CSV.
- Share bridge (CSV file) Download as CSV.
- Lockups (CSV file) Download as CSV.
- Quoted numbers (CSV file) Download as CSV.