Financial systems
What will ACA coverage cost in 2027?
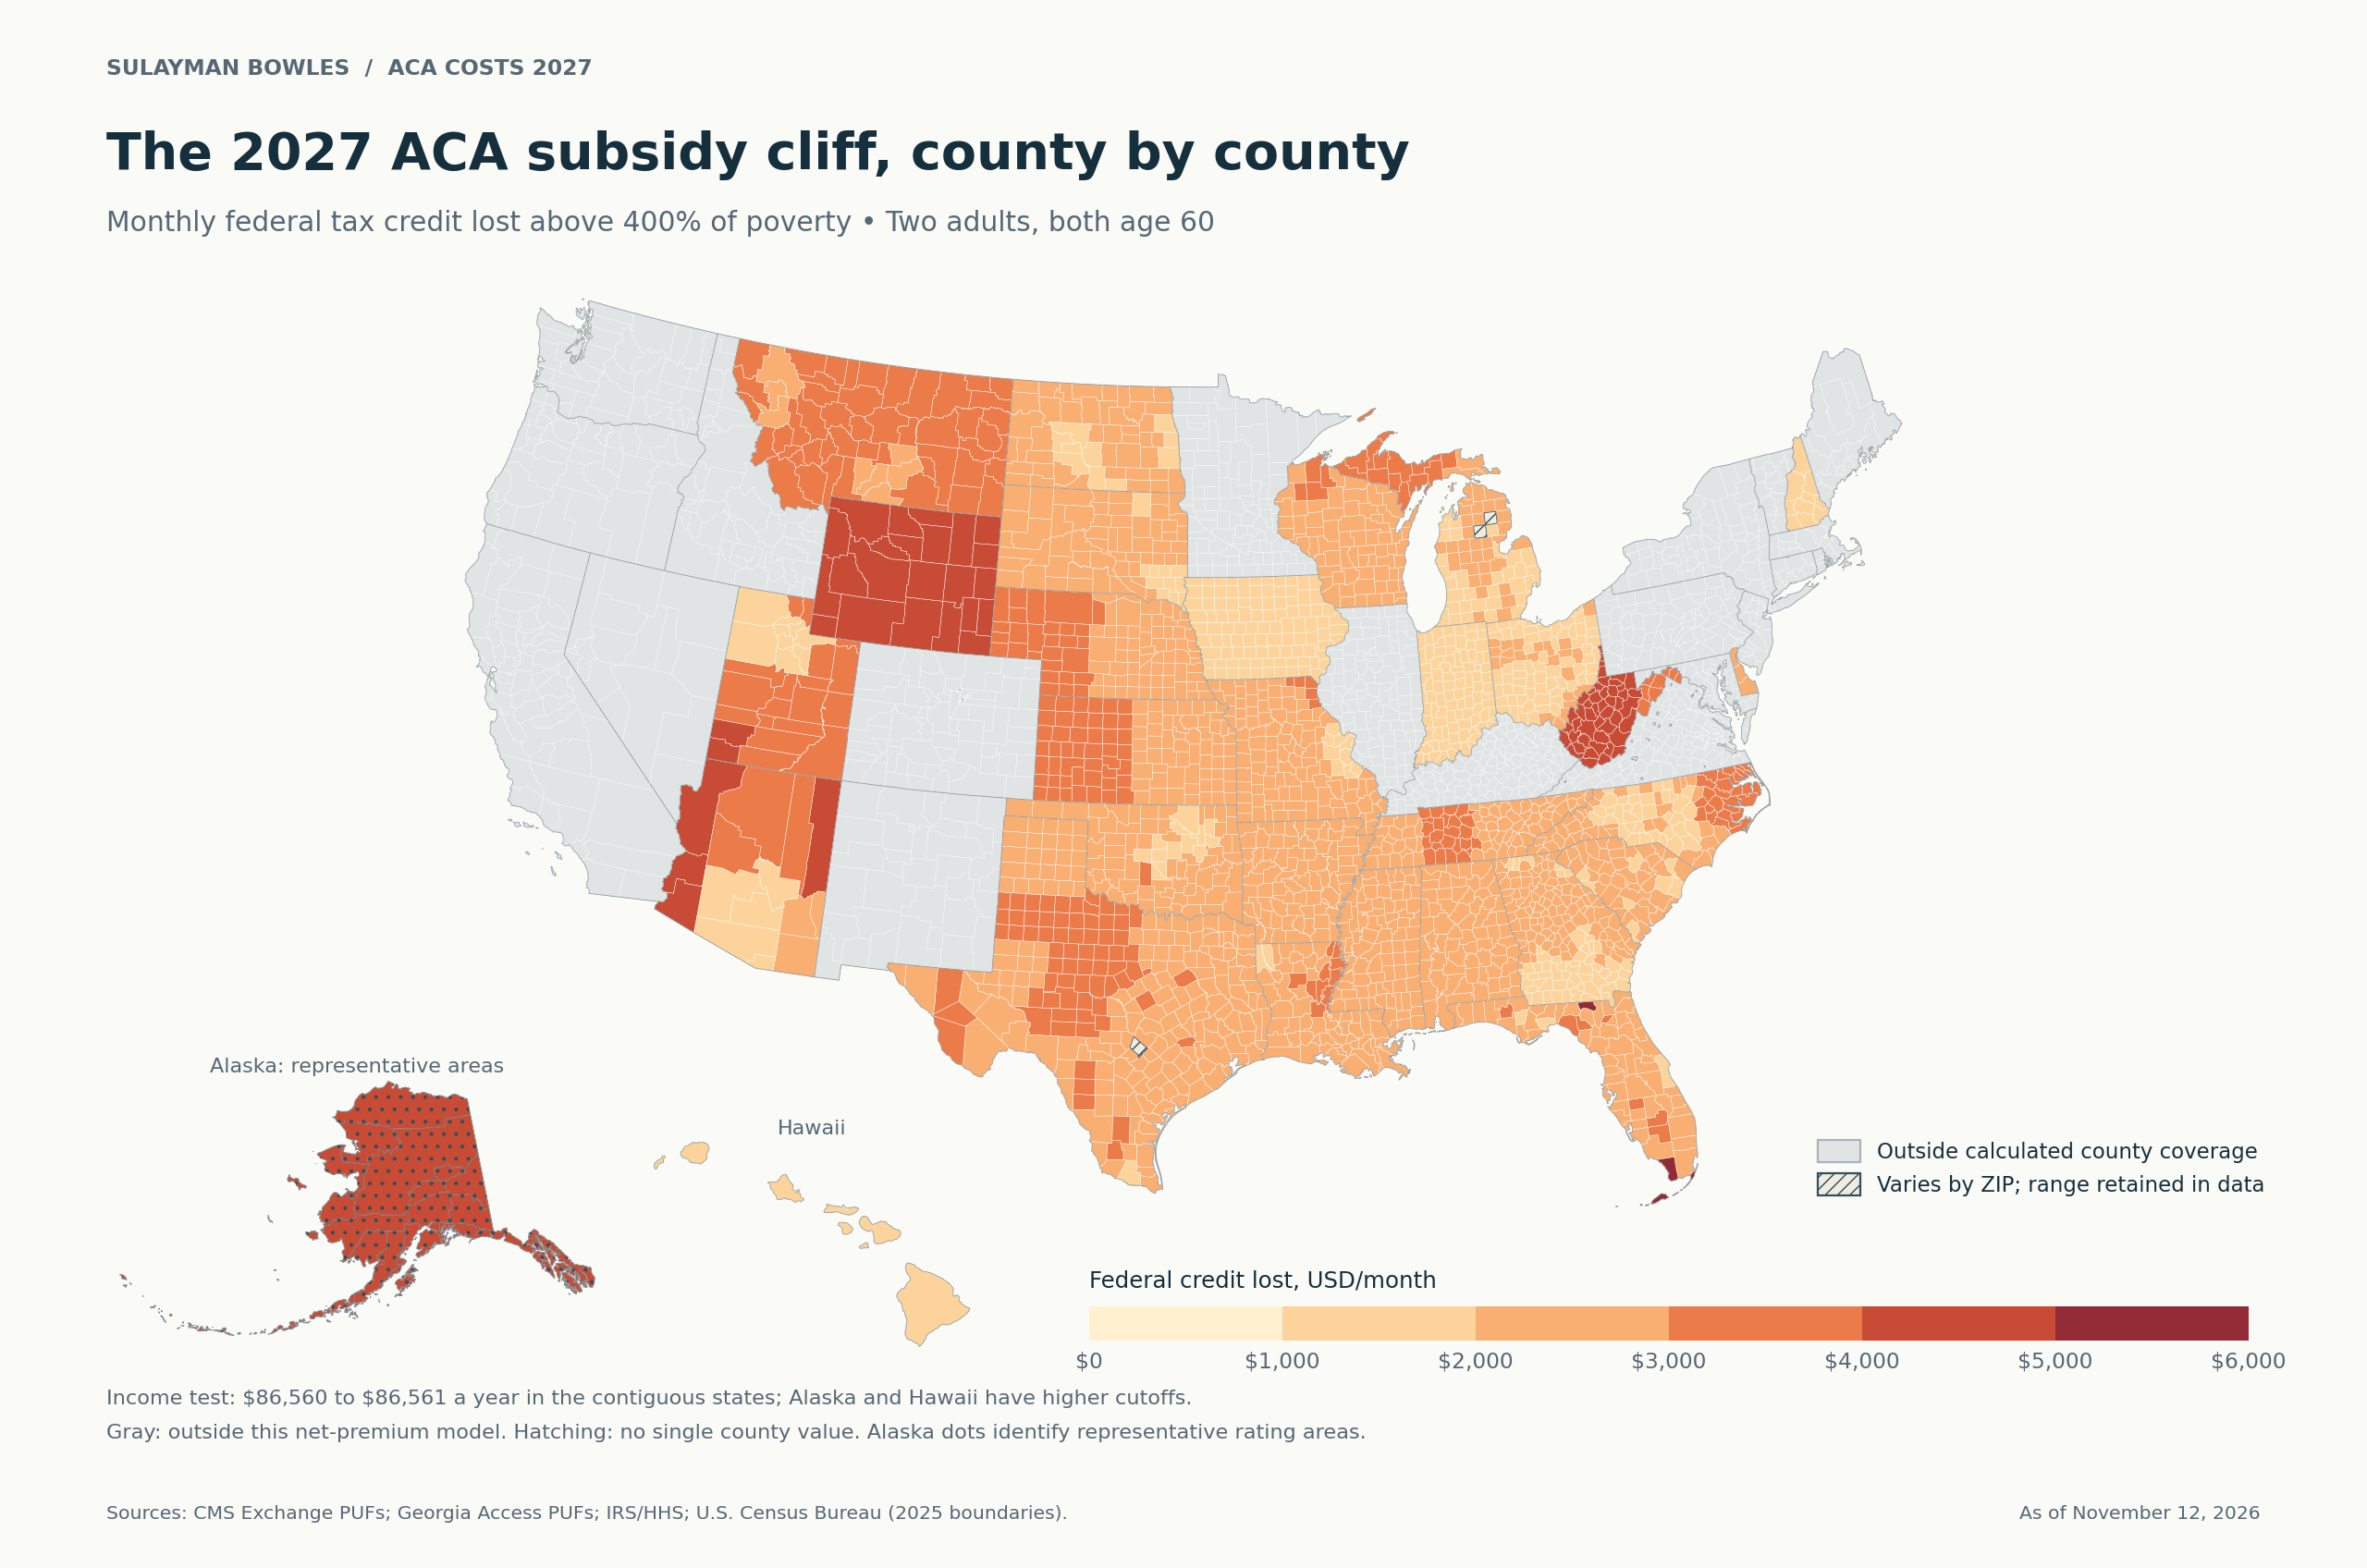
Compare what households paid in 2025 with the 2027 subsidy cliff across 2,178 counties and county equivalents.

The short version
- Crossing the $86,560 income limit in 2027 costs a Travis County couple, both 60, an estimated $2,389.60 a month in credits.
- Monroe County, Florida has the largest estimated increase for a two-adult, age-60 household at 410% of the poverty guideline: $5,855.31 a month.
- Paid Marketplace enrollment fell 11.97%, from 21,776,626 people in February 2025 to 19,169,147 in February 2026.
- Open enrollment runs November 1, 2026 through January 15, 2027; December 15 is the deadline for January 1 coverage.
As of November 12, 2026, two 60-year-olds in Travis County at 410% of the poverty guideline face an estimated $3,126.80 monthly benchmark (second-lowest silver) premium in 2027, versus $593.61 in 2025. Crossing the 2027 income cutoff of $86,560 removes $2,389.60 a month in credits. The county calculator below estimates both years using the same share of the poverty guideline or the same dollar income.1
Download the formula workbook · Download county comparisons · Download the subsidy-cliff data
The federal-credit model for Affordable Care Act (ACA) coverage spans 2,178 counties and county equivalents: all 29 HealthCare.gov states plus Georgia. The state-exchange appendix lists additional published gross rates and identifies gaps in comparable net prices. County-only results are ranges when plans serve only part of a county; Alaska uses the representative rating area in the federal landscape file.2
Compare 2025 and 2027 benchmark premiums by county
How much does marketplace insurance cost by income?
Income relative to the poverty guideline determines the credit schedule; the local benchmark and the covered household determine how many dollars that credit is worth. Below the restored income ceiling, a larger benchmark often produces a larger credit; above it, the household pays the entire medical premium.3
The six fixed examples in Travis County, Texas use the second-lowest silver plan for each covered household. These are monthly medical premiums after federal credits, for otherwise eligible, non-smoking applicants with unchanged full-year coverage.1
| Household and income as a share of the poverty guideline | Annual income, 2025 | Annual income, 2027 | Monthly payment, 2025 | Monthly payment, 2027 |
|---|---|---|---|---|
| Single adult, age 27; 150% | $22,590.00 | $23,940.00 | $0.00 | $85.79 |
| Single adult, age 27; 250% | $37,650.00 | $39,900.00 | $125.50 | $287.95 |
| Tax family of four; two age-40 adults covered; 200% | $62,400.00 | $66,000.00 | $104.00 | $372.90 |
| Two age-40 adults and two children; 420% | $131,040.00 | $138,600.00 | $928.20 | $2,353.74 |
| Two adults, both age 60; 390% | $79,716.00 | $84,396.00 | $548.05 | $718.77 |
| Two adults, both age 60; 410% | $83,804.00 | $88,724.00 | $593.61 | $3,126.80 |
Source: CMS medical, rate and plan-attribute files; IRS contribution schedules; HHS poverty guidelines. Children in the four-person coverage example are ages 0–14.
In Travis County, the 410%-of-poverty couple aged 60 goes from $594 to $3,127 a month
Monthly benchmark-plan premium after federal tax credits, six fixed households, 2025 and 2027; ages and share of poverty held fixed
Show the numbers
| USD per month | 2025 | 2027 |
|---|---|---|
| Single adult, 27 · 150% of poverty | $0 | $86 |
| Single adult, 27 · 250% | $126 | $288 |
| Family of four, 200% (two adults priced) | $104 | $373 |
| Family of four, 420% | $928 | $2,354 |
| Two adults, 60 · 390% | $548 | $719 |
| Two adults, 60 · 410% | $594 | $3,127 |
The income percentages stay fixed in this table, so the dollar incomes change. For example, the two-person household at 410% moves from $83,804 in 2025 to $88,724 in 2027. The calculator also offers a same-dollar-income comparison.4
The family at 200% needs an additional distinction. It has four people in its tax household, but this example prices only the two adults on the Marketplace. Children may qualify for Medicaid or the Children’s Health Insurance Program (CHIP), particularly under Texas eligibility rules. The $372.90 figure is the adults’ medical premium, before any cost of children’s coverage. A tax household and a Marketplace coverage household are not always identical.7
These numbers are premiums, the monthly charge for keeping coverage. They are not deductibles, copayments, prescription spending or the value of a hospital network. A zero premium does not mean healthcare is free.
How does the ACA subsidy cliff work in 2027?
The federal premium tax credit ends above 400% of the applicable poverty guideline in 2027. For a two-person household in the contiguous states, the ceiling is $86,560 of annual household income. A positive credit available there disappears when whole-dollar annual income rises to $86,561.3, 4
The calculation uses the poverty guideline available before open enrollment. Thus, 2027 coverage uses the 2026 guideline: $21,640 for two people in the contiguous states. Alaska and Hawaii have their own guidelines. Use annual household modified adjusted gross income for this calculation.4, 6
At the top of the eligible 2027 schedule, the required contribution is 10.22% of income. This is the household’s contribution toward the tax benchmark. For the Travis County couple, the income cutoff implies these monthly costs.5
| Step | Monthly amount or calculation |
|---|---|
| Age-60 benchmark medical rate per person | $1,563.40 |
| Two adults’ medical premium | $1,563.40 × 2 = $3,126.80 |
| Annual income at the ceiling | $21,640 × 4 = $86,560 |
| Required monthly contribution | $86,560 × 10.22% ÷ 12 = $737.202667 |
| Federal credit at the ceiling | $3,126.80 − $737.202667 = $2,389.597333 |
| Federal credit at $86,561 annual income | $0 |
Source: original CMS 2027 Rate public use file (PUF), plan 87226TX0070011; Plan Attributes PUF, 100% essential-health-benefit share; IRS Revenue Procedure 2026-26 §3.01; 2026 HHS guideline.
That is an estimated $28,675.17 annual loss of assistance at the cutoff. The jump equals the credit available at the ceiling in that county. A household whose benchmark is already below its required contribution has no credit to lose.1
The dollar test comes before the income percentage is truncated on the current tax worksheet, so the model does not turn a household just above the ceiling back into an eligible one by rounding its income ratio down. Monthly estimates keep extra decimal precision; final annual tax reconciliation can differ because of tax-form rounding and changes during the year.8
 (opens the full-size image)
What are the low, middle and high cost cases?
For the stated Travis County couple, the 2027 benchmark payment ranges from $718.77 at 390% of the poverty guideline to $3,126.80 at 410%. The middle scenario sits exactly at the ceiling, where the payment is $737.20 at the filed benchmark rate.1
Three inputs carry most of the result: whether annual household income is above the ceiling, who is covered and their ages, and which eligible silver plan ranks second in the actual service area.
| 2027 income scenario, two-person tax household | Annual household income | Both adults age 27 | Both adults age 40 | Both adults age 60 |
|---|---|---|---|---|
| Low: 390% of poverty | $84,396 | $718.77 | $718.77 | $718.77 |
| 395% of poverty | $85,478 | $727.99 | $727.99 | $727.99 |
| Middle: exactly 400% | $86,560 | $737.20 | $737.20 | $737.20 |
| One dollar above the ceiling | $86,561 | $1,207.40 | $1,472.38 | $3,126.80 |
| 405% of poverty | $87,642 | $1,207.40 | $1,472.38 | $3,126.80 |
| High: 410% of poverty | $88,724 | $1,207.40 | $1,472.38 | $3,126.80 |
Source: calculated from original plan rates and statutory inputs. Federal-credit eligibility apart from income is assumed. All three age examples receive sufficient credit at or below the ceiling to reach the displayed contribution.
In 2027, one more dollar of income above 400% of poverty costs a Travis County couple $2,389.60 a month
Monthly benchmark premium after federal credit, two adults aged 60, income as a share of the poverty guideline; 2025 and 2027
Show the numbers
| USD per month | 2025 | 2027 |
|---|---|---|
| 350% | $432 | $645 |
| 360% | $460 | $663 |
| 370% | $488 | $682 |
| 380% | $518 | $700 |
| 390% | $548 | $719 |
| 400% | $579 | $737 |
| 410% | $594 | $3,127 |
| 420% | $608 | $3,127 |
| 430% | $623 | $3,127 |
| 440% | $637 | $3,127 |
| 450% | $652 | $3,127 |
The table also explains why age matters much more after the cliff. At eligible incomes, the credit absorbs the difference between these local benchmarks and the required contribution. Above the ceiling, the older couple faces the larger age-rated price directly. The model uses filed rates for each age.
What does health insurance cost in Texas?
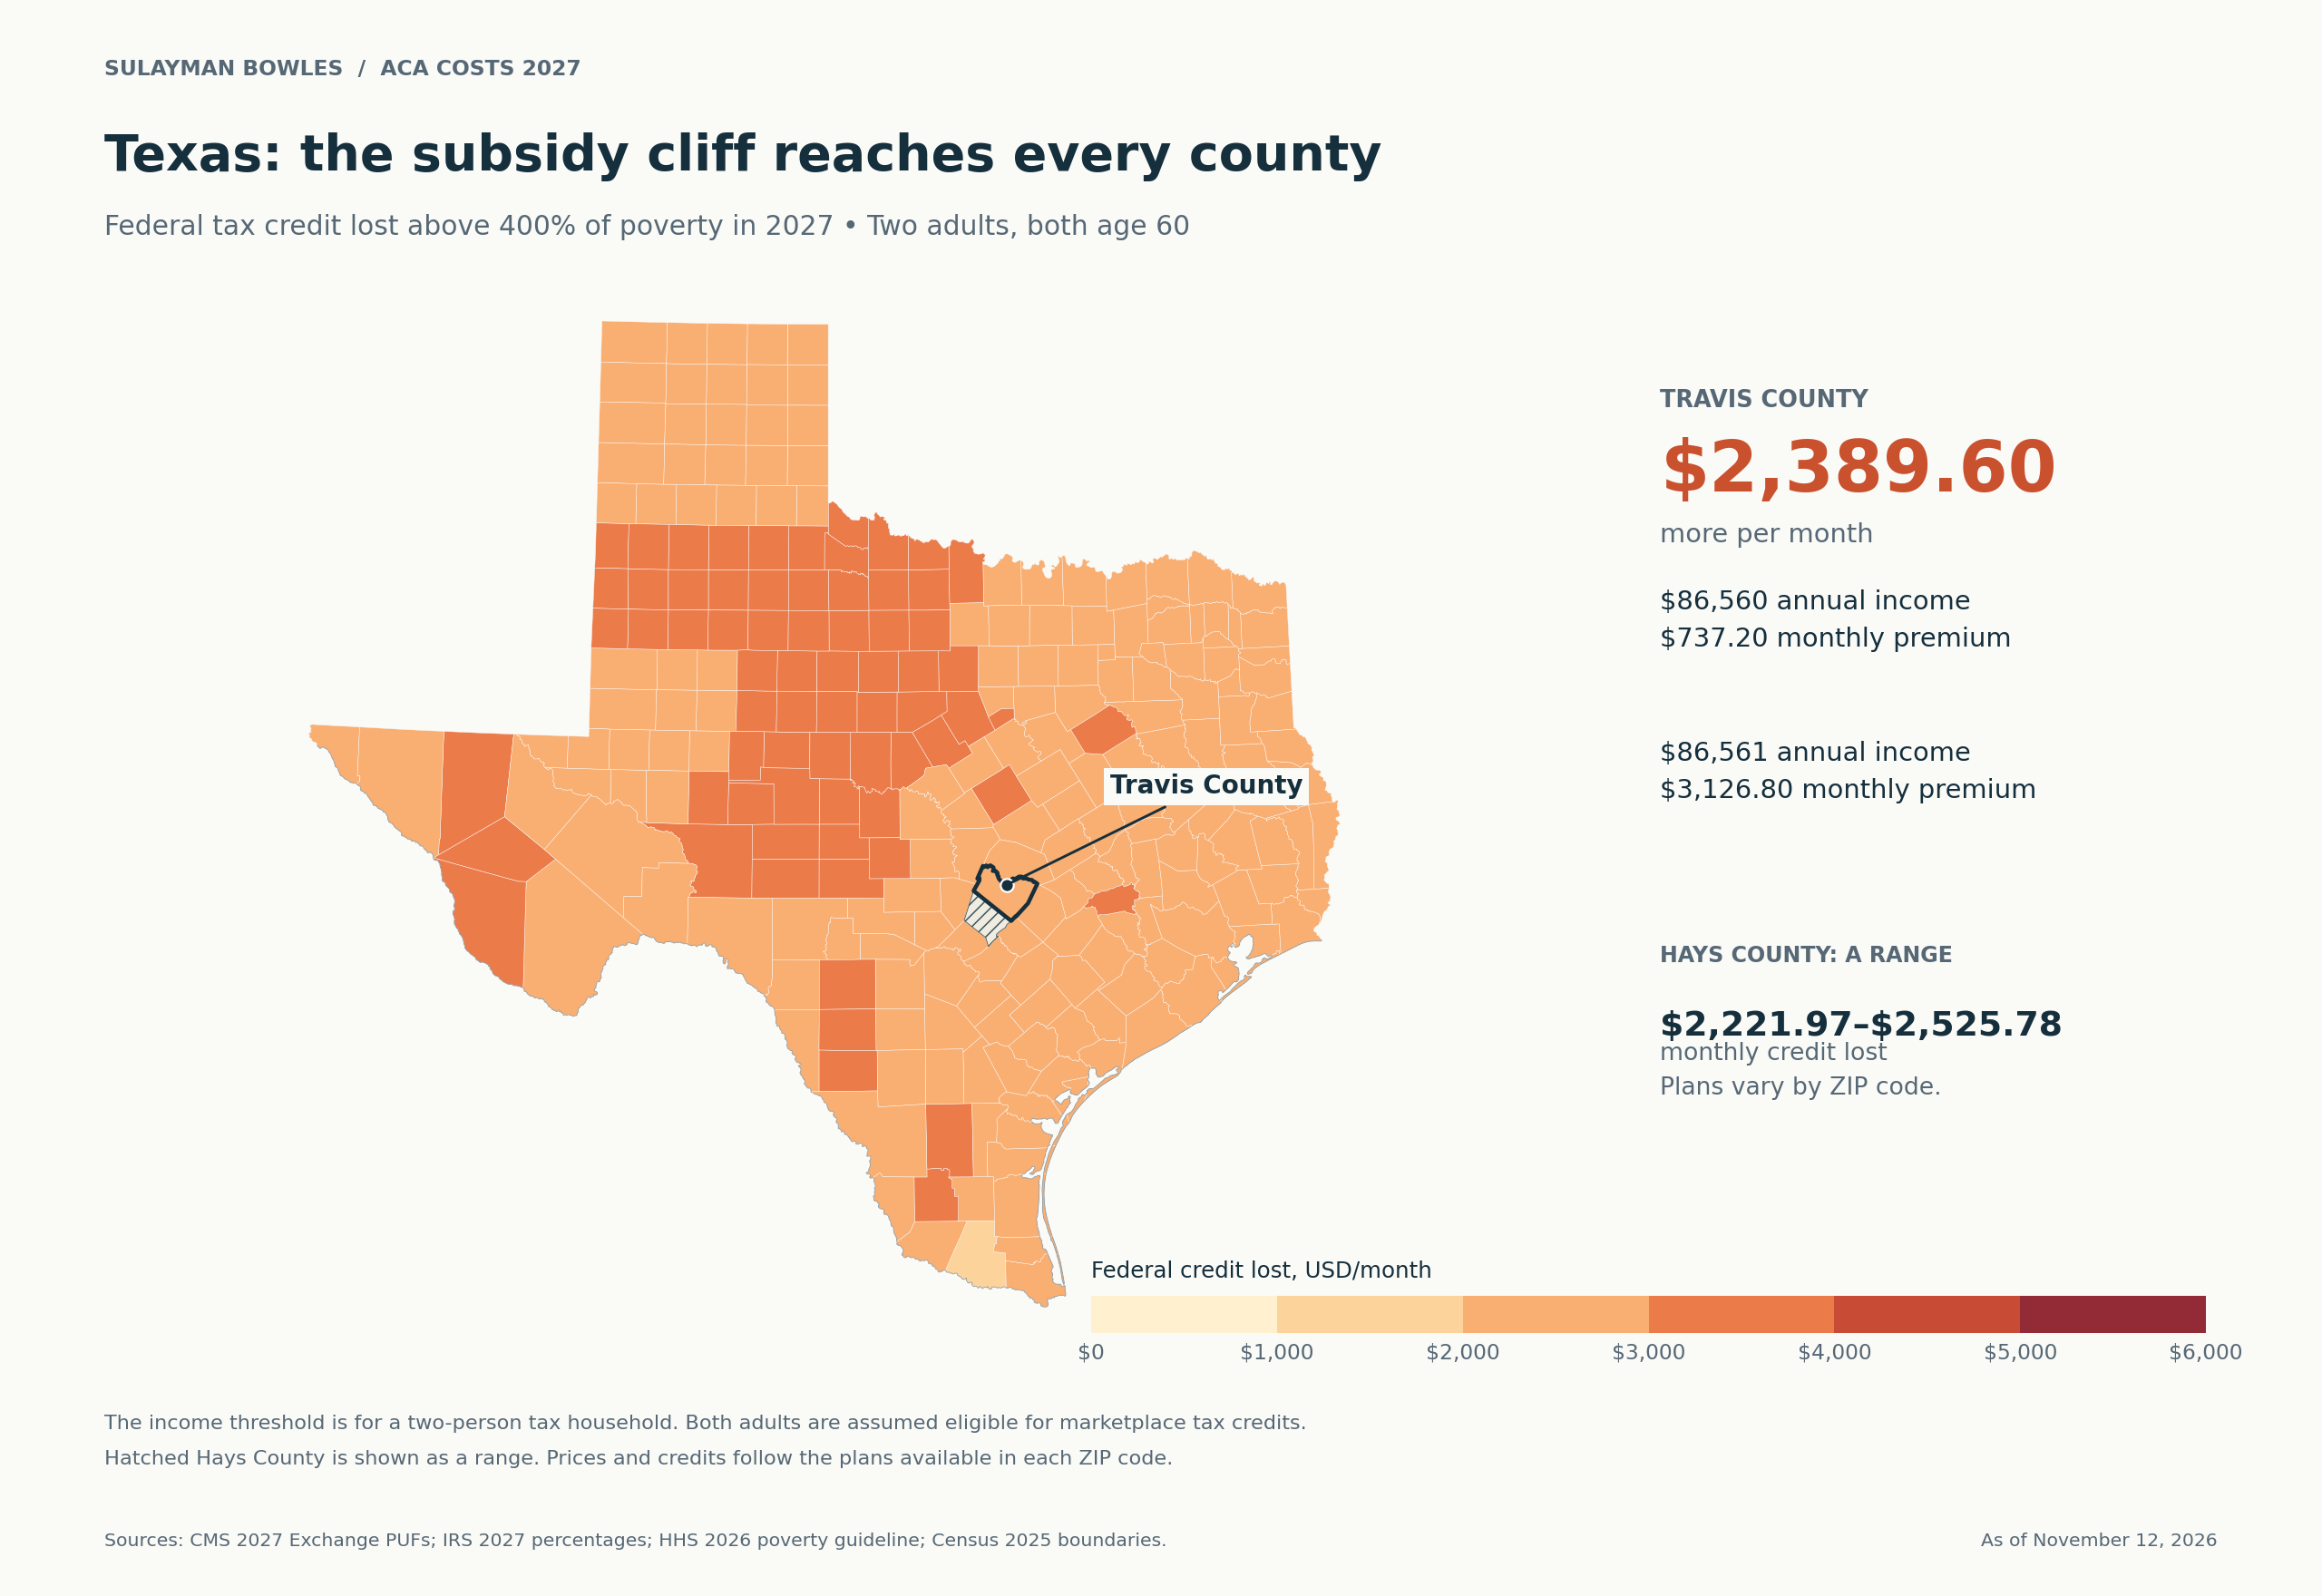
Texas has no single Marketplace price: the model covers all 254 counties, with local plan availability preserved. For two age-60 adults, the 2027 monthly cliff ranges from $1,998.34 in Hidalgo County to $3,720.28 in Duval and Jim Hogg counties; Travis County’s cliff is $2,389.60.9
 (opens the full-size image)
In Travis County, the benchmark changed from Sendero plan 71837TX0010001 in 2025 to Ambetter from Superior HealthPlan plan 87226TX0070011 in 2027. The two-adult age-60 medical price rose from $2,223.34 to $3,126.80. The eligible medical issuer count also changed from 10 to 9. The count uses issuer identifiers.10
For the 410% example, the $2,533.19 monthly increase has two visible parts: $903.46 more in gross medical premium, plus $1,629.73 of 2025 assistance that is absent in 2027. The annual increase is $30,398.26. By contrast, the couple at 390% pays $170.73 more a month, because it still receives a federal credit. Applying a single average rate increase to either household’s old payment would miss the result.10
Is the cheapest health insurance always bronze?
Bronze has the lowest medical premium in these Travis County examples. The credit is calculated from the silver benchmark and can then reduce an eligible selected plan’s essential health benefits (EHB) premium, the part eligible for federal-credit calculations.6
| Adult age, Travis County | Lowest bronze, 2027 | Benchmark silver medical premium, 2027 | Lowest gold, 2027 |
|---|---|---|---|
| 27 | $416.55 | $603.70 | $532.84 |
| 40 | $507.97 | $736.19 | $649.78 |
| 60 | $1,078.73 | $1,563.40 | $1,379.89 |
Gross medical premiums per person per month, before credits. Source: original CMS Rate/Attributes files.
For a single age-27 adult at 250% of the poverty guideline, the 2027 silver benchmark produces an estimated $315.76 monthly federal credit in this example. Gross Bronze, Silver and Gold prices alone answer only part of the cost question.1
“Silver” is a cost-sharing category. Cost-sharing reductions lower eligible silver enrollees’ deductibles and other out-of-pocket costs. This premium comparison does not price those differences or rank plans by overall value.6
Which counties have the biggest premium increases?
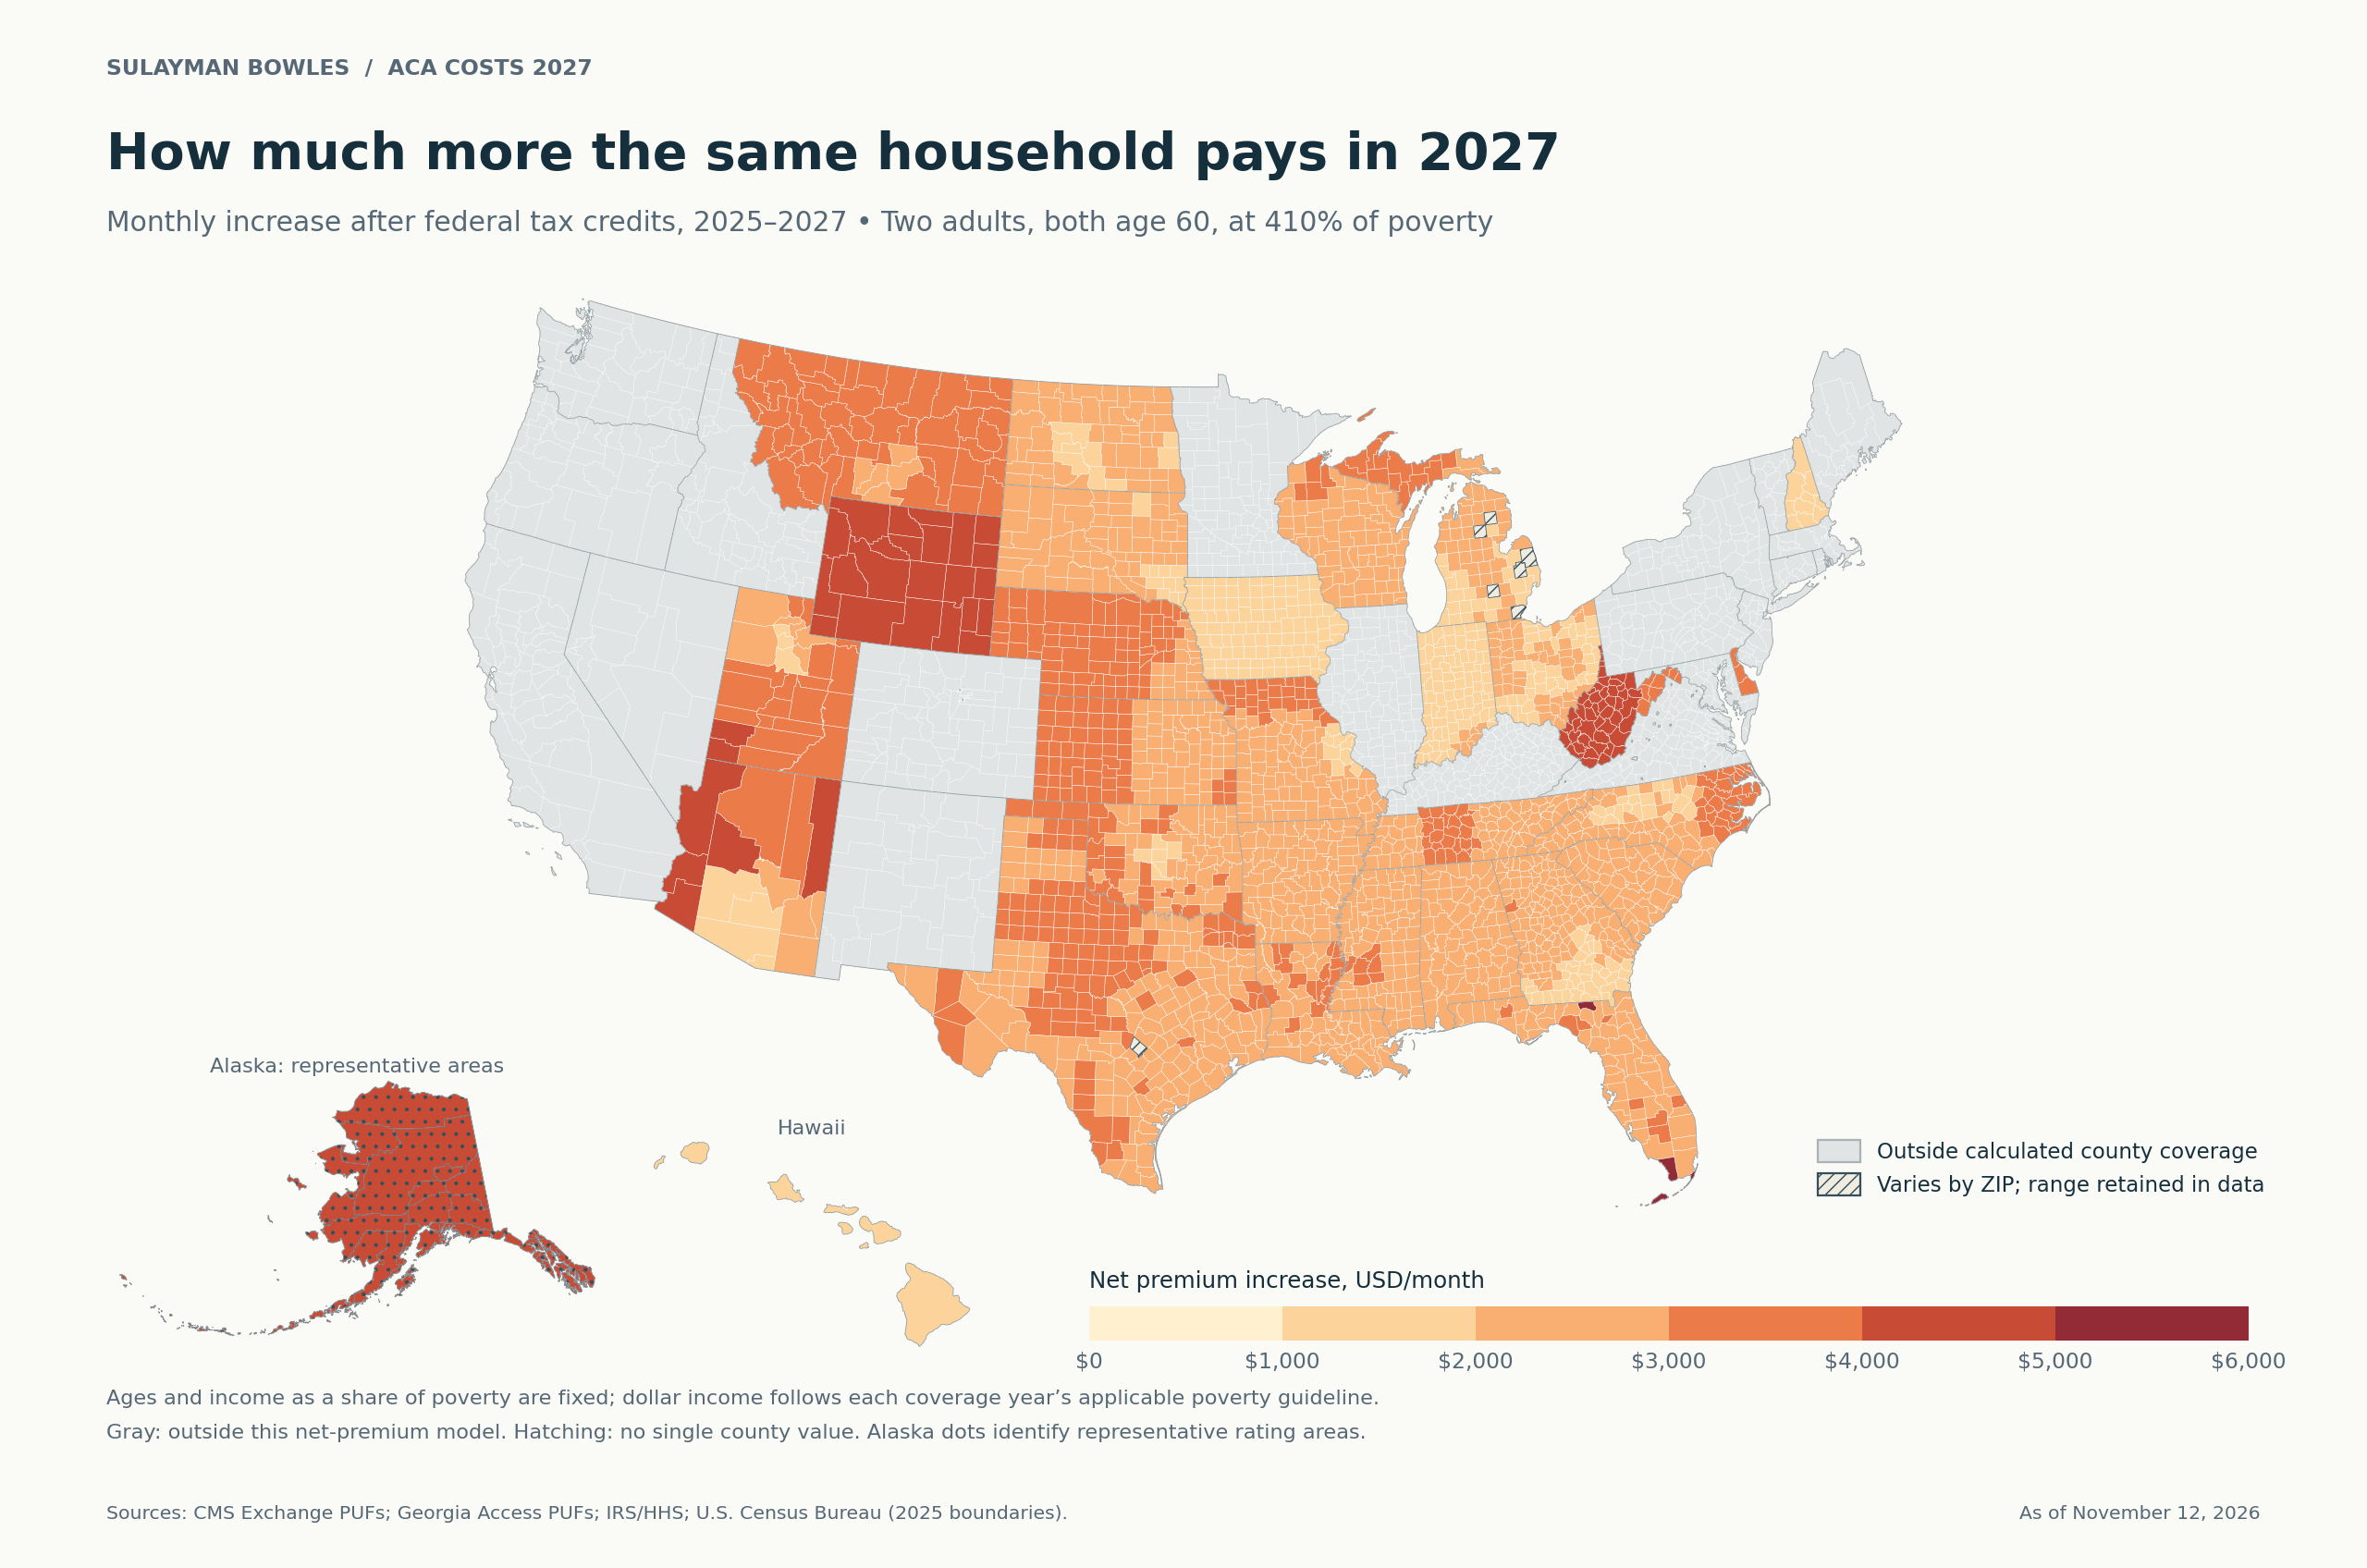
Among counties with a unique comparable result in this model, Monroe County, Florida, has the largest 2025-to-2027 increase for the two-age-60, 410% household: $5,855.31 a month. Its estimated payment rises from $593.61 in 2025 to $6,448.92 in 2027.11
| County | State | 2025 monthly net premium | 2027 monthly net premium | Monthly increase |
|---|---|---|---|---|
| Monroe | Florida | $593.61 | $6,448.92 | $5,855.31 |
| Hamilton | Florida | $673.70 | $6,153.08 | $5,479.38 |
| Cabell | West Virginia | $593.61 | $5,457.26 | $4,863.65 |
| Mason | West Virginia | $593.61 | $5,457.26 | $4,863.65 |
| Putnam | West Virginia | $593.61 | $5,457.26 | $4,863.65 |
Source: original CMS plan/rate files and statutory inputs. Ranking includes 2,141 unique county comparisons for this household. The county data include representative Alaska prices and counties with a range of prices.
 (opens the full-size image)
County files show minimum and maximum amounts where service areas differ within a county. An increase envelope compares the smallest 2027 value with the largest 2025 value, and vice versa. The calculator shows a range for these counties, so a plan available in one corner of a county is not presented as available to everyone there.12
Why is my health insurance going up?
The documents show both rising expected medical costs and insurers’ expectations about who remains enrolled. The end of enhanced federal credits changes what a customer pays even when a plan’s gross rate is unchanged.3, 13
UnitedHealthcare of Texas’s finalized 2027 submission reports a 27.32% average increase for its submitted individual products. Its consumer explanation cites provider reimbursement, service use and intensity, technology, and the way fixed deductibles cover less of higher medical bills. It also states: “Premiums reflect the expected increase in average cost per member due to healthier members leaving the market.”13
That sentence is an insurer’s pricing assumption. It does not measure how many healthier people left nationally, and 27.32% is not the increase in the Travis County benchmark. Celtic’s actuarial filing makes a similar selection argument, but redacts its numerical morbidity adjustment, the adjustment for the covered group’s expected health risk.14
Centene’s September 2026 Form 10-Q discusses the higher expected morbidity baseline after credit expiration and enrollment changes. It says corrective pricing covered 95% of Marketplace membership in 2026. Oscar says: “Any resulting market contraction could negatively impact market morbidity.” Molina expects further 2027 enrollment reductions while restoring margins and estimates a $1 billion decline in Marketplace premium revenue from 2026. A smaller revenue base is not a reduction in a customer’s premium.15
The household model uses approved or filed plan prices from current public datasets and the operative credit schedule. It does not allocate a share of a household’s increase to adverse selection.
Did marketplace enrollment fall in 2026?
Yes: the same CMS monthly-data release reports 21,776,626 people with paid, effectuated coverage in February 2025 and 19,169,147 in February 2026, a decline of 2,607,479 people, or 11.97%.16
Paid Marketplace enrollment fell 12% in a year, from 21.78 million to 19.17 million
People with effectuated (premium-paid) coverage in February, all 50 states and Washington, DC
Numbers and method
| people, millions | Effectuated enrollment |
|---|---|
| February 2025 | 21.78 million |
| February 2026 | 19.17 million |
Source: CMS Health Insurance Exchanges Monthly Effectuated Enrollment, data as of May 5, 2026; catalog updated June 26, 2026; retrieved November 12, 2026. Workbook: Enrollment calc.
“Effectuated” means coverage took effect after the required premium payment. Open-enrollment plan selections are a different count: CMS reports 24,319,713 in the 2025 open-enrollment period and 23,130,860 in 2026. They are not part of the paid-enrollment series.17
The selection files show fewer selections among adults ages 18–34 and in the above-400%-to-500% income category. They do not follow individuals into employer coverage, Medicaid or an uninsured status, or report departing members’ health. CMS also flags missing Minnesota subgroup records following a reporting change. The files measure the decline in recorded enrollment, not its causes.17, 16
What changed for bronze plans, HSAs and excess credits?
Two enacted changes affect the comparison: qualifying exchange-available bronze and catastrophic plans can receive special health-savings-account treatment starting in 2026, and the cap on repaying excess advance premium credits is gone for tax years after 2025. Neither change converts every household into an eligible credit recipient.18, 19
A health savings account, or HSA, is a tax-favored account with its own eligibility rules. The 2025 law treats specified bronze and catastrophic coverage as high-deductible health coverage for this purpose. Other HSA conditions still apply, including rules about additional coverage. Catastrophic plans have their own enrollment and premium-credit rules.18
Advance credits are paid during the year using estimated household information. The IRS now states: “There is no repayment cap for tax years after 2025.” If advance assistance exceeds the final allowable credit, the excess is subject to full repayment. A household near the income ceiling can therefore face a different final credit from its initial monthly estimate.19
Court stays affect some announced enrollment-rule changes. CMS’s August 4, 2026 statement describes the stay affecting specified 2027 provisions. Its July 27 statement directs exchanges to stop denying or removing advance credits for failure to file and reconcile for 2026 and 2027; the underlying tax filing and reconciliation duties remain. A final-rule announcement alone does not show which enrollment restriction is operating; the current HealthCare.gov instructions and CMS’s implementation statements govern this report’s dates and rule descriptions.20
When is the open enrollment 2027 deadline?
HealthCare.gov’s current enrollment period runs November 1, 2026 through January 15, 2027. December 15, 2026 is the deadline for coverage starting January 1, 2027, provided the first premium is paid; enrollment from December 16 through January 15 generally starts February 1.21
State marketplaces can have their own deadlines. Use the calculator’s stated household and year, then check the relevant Marketplace’s available plans, network and eligibility determination.
What could change these estimates?
An enacted subsidy change, a corrected plan-rate or service-area file, or an operative court order could change the answer. A different annual income, household composition or eligibility determination can change an individual result immediately, even if every published rate remains the same.
The next editorial check is December 14, 2026, before the January-coverage enrollment deadline. The annual rate refresh is in October 2027 after final 2028 rates are released. Earlier legislation, a CMS correction or controlling court action can change the estimates before then.
Questions readers ask
Are enhanced ACA subsidies available in 2027?
As of November 12, 2026, the enhanced federal premium credits ended after 2025. The 2027 schedule restores the income ceiling at 400% of the applicable poverty guideline.
What is the 2027 ACA subsidy income limit for a couple?
For a two-person household in the contiguous states, the 2027 coverage-year limit is $86,560 of annual household income. Alaska and Hawaii use different poverty guidelines; other eligibility conditions also apply.
What happens if income is one dollar above the ACA limit?
Above the dollar ceiling, the federal premium tax credit is zero under the current rules. For the stated two-age-60 Travis County example, moving from $86,560 to $86,561 raises the monthly payment from about $737.20 to $3,126.80.
Can gold insurance cost less than benchmark silver?
The benchmark ranks silver plans by the premium for essential health benefits. In Travis County, the 2027 gross age-40 gold minimum is $649.78, below the $736.19 benchmark silver medical price.
When must I enroll for January 2027 coverage?
HealthCare.gov says to enroll by December 15, 2026 for January 1, 2027 coverage and pay the first premium. Its full open-enrollment window ends January 15, 2027. State exchanges set their own dates.
Methods and files for rebuilding the results
The model first identifies the individual-market, on-exchange medical universe from the federal landscape files, excluding catastrophic and child-only policies from the adult comparisons. It joins the most recent available January-effective non-tobacco rates, Plan Attributes EHB fractions and Service Area coverage. Georgia’s original Rate, Plan, Benefits and Service Area files supply the parallel state-exchange inputs. The workbook separates the source inputs, credit calculations and county outputs.12
Essential health benefits, or EHB, are the covered benefits whose premium portion can enter the federal-credit calculation. Silver plans are ranked on that portion; a tied lowest price can also be the second-lowest price. Benefits outside EHB remain payable. For a household with children, a plan lacking the required pediatric dental benefits receives the prescribed second-lowest stand-alone dental EHB adjustment when the tax benchmark is constructed. The reported selected medical premium still excludes a separate dental purchase. This is why “benchmark used for credits” and “medical bill before credits” appear as different fields.12
For an eligible household, the monthly model is:
Required contribution = annual income × applicable IRS percentage ÷ months in year. Credit = the smaller of the selected plan’s eligible medical premium and the positive difference between benchmark and required contribution. Net medical premium = full selected medical premium − credit.
Above the restored ceiling, the federal credit is zero. The calculations assume no disqualifying employer or public coverage and do not determine Medicaid, CHIP, immigration or other eligibility. The calculator covers the household ages and compositions shown in its menu.
Related reading
How a Fed rate hike changes household interest costs · Social Security after retirement reserves run out
Sources
- Author calculations from CMS Marketplace public use files, HealthCare.gov medical landscape downloads and Georgia Access public use files, retrieved November 12, 2026; IRS/HHS sources below. Exact records: data/selected_plan_inputs.csv; workbook Summary/Premium calc/Policy calc; evidence/report_number_register.csv. ↩
- data/county_coverage.csv, geographic_profiles.csv, county_comparison.csv and state-exchange source inventory. The main comparison uses common counties; the underlying years have different platform footprints. Official CMS state-based exchange PUF page and state links appear in the state-exchange appendix (retrieved November 12, 2026). ↩
- 26 USC §36B(c)(1)(A), (E) and HealthCare.gov renewal information, checked November 12, 2026. Temporary enhanced eligibility applied through 2025. ↩
- HHS poverty guidelines for 2024, pp.2961–2963, 2025, pp.5917–5918, and 2026, pp.1797–1798. The preceding year’s guideline applies to each modeled coverage year; retrieved November 12, 2026. ↩
- IRS Revenue Procedure 2026-26, §3.01, IRB 2026-31 p.131, 2027 applicable-percentage table. Historical tables: Revenue Procedure 2025-25 §3.01 and Revenue Procedure 2024-35 §2.01 (retrieved November 12, 2026). ↩
- IRS premium tax credit questions and answers, household income, eligible coverage, benchmark and credit limits; HealthCare.gov cost-sharing reductions (checked November 12, 2026). ↩
- Texas Works Handbook D-110, general CHIP policy, effective January 1, 2026, and federal PTC rules excluding people eligible for qualifying public coverage (retrieved November 12, 2026). ↩
- IRS Form 8962 instructions, Worksheet 2, actual dollar-income test before the entered FPL percentage. The final 2027 form was not available in this research; the model follows the operative statute and current instructions, checked November 12, 2026. ↩
- Original CMS files; county FIPS 48215 (Hidalgo), 48131 (Duval), 48247 (Jim Hogg), 48453 (Travis). data/subsidy_cliff.csv and county_rank_subsidy_cliff_couple60.csv, calculated November 12, 2026; original-file outlier check in qa/. ↩
- Original CMS 2025 and 2027 Rate/Plan Attributes files; plans 71837TX0010001 and 87226TX0070011. Independent reconstruction and source-record locators in qa/ and evidence/. Gross metal references in data/metal_plan_reference.csv (calculated November 12, 2026). ↩
- Author calculations from original CMS inputs; data/county_rank_net_increase_couple60_410.csv and workbook County outputs/Summary. FIPS 12087, 12047, 54011, 54053, 54079. The ranking is conditional on the stated household and exact county geography, calculated November 12, 2026. ↩
- CMS 2025 QHP premiums and choice methodology, pp.3–5; original 2025–2027 Rate, Plan Attributes, Benefits and Service Area files; landscape instructions included in evidence/primary_documents. All three pediatric dental benefit fields were checked in the original benefit files. County map geometry: Census 2025 cartographic boundary KML. ↩
- UnitedHealthcare of Texas 2027 Part II, August 13, 2026, PDF p.2 and final public rate-review record (retrieved November 12, 2026). ↩
- Celtic Insurance Company Texas 2027 actuarial memorandum, redacted, PDF p.5, impact of enhanced-credit expiration (retrieved November 12, 2026). ↩
- Centene September 2026 Form 10-Q, pp. 20, 25; Oscar September 2026 Form 10-Q, p.29; Molina September 2026 Form 10-Q, p.28. Retrieved November 12, 2026; company outlooks, not model price inputs. ↩
- CMS monthly effectuated enrollment CSV, as of May 5, 2026, February national rows and all state/DC rows; methodology, Minnesota footnote. Catalog updated June 26, 2026; retrieved November 12, 2026. ↩
- CMS 2025 OEP state PUF, 2026 OEP state PUF, 2026 FAQ and definitions.
Cnsmr,Age_18_25,Age_26_34,FPL_400_500fields; retrieved November 12, 2026. ↩ - Public Law 119-21 §71307 and IRS Notice 2026-5, §III.B, HSA eligibility for bronze and catastrophic coverage (checked November 12, 2026). ↩
- Public Law 119-21 §71305 and IRS premium tax credit Q&A, excess advance credits (checked November 12, 2026). ↩
- CMS August 4, 2026 court-stay implementation statement, pp.1–2 and 2026/2027 failure-to-reconcile enforcement statement (checked November 12, 2026). ↩
- HealthCare.gov current enrollment dates and deadlines, checked November 12, 2026. ↩
Supporting material
- Excel model (XLSX file) Sourced inputs, live calculations and reported outputs.
- Source and model data (CSV collection) (ZIP file) Data tables, source references and calculation exports.
- Source registry (CSV file) Download as CSV.
- County comparison (CSV file) Download as CSV.
- Subsidy cliff (CSV file) Download as CSV.
- County calculator inputs (JSON) (JSON file) Source-derived medical rates and benchmark inputs for the 2,178 counties.