Financial systems
Social Security 2032: how much will benefits be cut?
The Trustees project 78% of scheduled retirement and survivor benefits would be financeable when reserves run out in late 2032.
The short version
- The Trustees project retirement reserves run out in Q4 2032, leaving tax revenue to cover 78% of scheduled benefits.
- I calculate a $538 monthly loss in 2032 dollars if checks fall proportionately by 22%, using the estimated January 2027 average benefit of $2,170 and five assumed 2.4% increases.
- Removing the wage cap without adding benefits closes about 58% of the 75-year combined shortfall; a 17% payroll-tax rate closes about 101%.
- The 3.6% 2027 COLA adds $75.42 to a $2,095 benefit; after the projected $6.60 Part B increase, the check rises $68.82 a month.
The 2026 Trustees project that Social Security’s retirement reserves will run out in Q4 2032, leaving tax revenue to cover 78% of scheduled benefits. I calculate a $538 monthly loss in 2032 dollars if checks fall proportionately, using the estimated January 2027 average of $2,170 and five assumed 2.4% annual increases.1, 4, 5
The example leaves about $1,906 a month against a scheduled benefit of about $2,443. The law leaves the payment procedure after reserve depletion unspecified.23
Download the Excel model · Household calculations · Source register
Social Security benefits at published financing checkpoints
| Period | Scheduled | Payable share | Illustrative payable |
|---|---|---|---|
| 2027 | $2,170.00 | 100% | $2,170.00 |
| 2028 | $2,170.00 | 100% | $2,170.00 |
| 2029 | $2,170.00 | 100% | $2,170.00 |
| 2030 | $2,170.00 | 100% | $2,170.00 |
| 2031 | $2,170.00 | 100% | $2,170.00 |
| Before depletion in 2032 | $2,170.00 | 100% | $2,170.00 |
| At depletion, Q4 2032 | $2,170.00 | 78% | $1,692.60 |
| 2100 | $2,170.00 | 62% | $1,345.40 |
Example arithmetic for general information. Enter the scheduled benefit at the chosen claim age. The projection holds that benefit constant in the stated dollars and applies the reported OASI payable shares.
Will Social Security run out?
The Trustees project that retirement reserves will run out in 2032. Payroll taxes and taxes on benefits would continue to finance most scheduled payments.1
The retirement and survivors program is Old-Age and Survivors Insurance, or OASI. Disability Insurance has its own trust fund. “Scheduled” means the benefit promised by the statutory formula. “Payable” means the amount available financing could cover.1, 23
| June 2026 intermediate projection, checked November 12, 2026 | OASI: retirement and survivors | Hypothetical combined OASDI |
|---|---|---|
| Reserve depletion | Q4 2032 | Q3 2034 |
| Scheduled benefits financeable at depletion | 78% | 83% |
| Scheduled benefits financeable in 2100 | 62% | 65% |
| 2026–2100 actuarial deficit, percentage points of taxable payroll | 4.55 | 4.42 |
The Trustees project that Disability Insurance alone stays solvent through 2100. Combining its reserves with OASI would require a change in law.1, 2, 23
The 75-year actuarial deficit compares the present value of financing and scheduled costs, including a target ending reserve, as a percentage of the present value of taxable payroll.3
How much will my Social Security be cut?
A proportional 22% reduction would cost $220 for every $1,000 of scheduled monthly benefits at depletion. On SSA’s estimated January 2027 average, the example comes to $477.40 a month in January 2027 benefit dollars, or $537.50 after five assumed COLAs.
Multiply the January 2027 benefit by five years of compounded COLAs and then by 22%.
A cost-of-living adjustment, or COLA, increases benefits to reflect the specified consumer-price index. The announced 3.6% January 2027 COLA is already inside the starting averages below. The five additional increases, January 2028 through January 2032, use the Trustees’ 2.4% intermediate assumption.4, 5
| Continuing-beneficiary example | January 2027 starting benefit, $/month | 2032 scheduled benefit, $/month | 78% illustration, $/month | Monthly loss, 2032 dollars | Loss in January 2027 benefit dollars |
|---|---|---|---|---|---|
| Retired worker | 2,170.00 | 2,443.20 | 1,905.70 | 537.50 | 477.40 |
| Aged couple, both receiving benefits | 3,355.00 | 3,777.39 | 2,946.37 | 831.03 | 738.10 |
| Aged widow or widower alone | 2,005.00 | 2,257.43 | 1,760.79 | 496.63 | 441.10 |
Source: SSA October 2026 fact sheet. Amounts are before taxes and Medicare. The underlying 78% projection is rounded.4
The examples follow continuing beneficiaries from the January 2027 averages. SSA’s couple benchmark covers aged couples in which both receive benefits. The 2032 average across all beneficiaries will also depend on who enters and leaves the program.
A 22% cut would take $538 a month from the average retired worker in 2032
Illustrative monthly benefit in 2032 dollars after a uniform 22% reduction: financeable amount plus loss, which sum to the scheduled benefit
- Financeable (78%)
- Illustrative loss (22%)
Numbers and method
| USD per month | Financeable (78%) | Illustrative loss (22%) |
|---|---|---|
| Retired worker | $1,906 | $538 |
| Couple, both receiving | $2,946 | $831 |
| Aged widow(er) alone | $1,761 | $497 |
Source: SSA 2027 COLA fact sheet; 2026 Trustees Report; workbook Households. As of November 12, 2026. Five assumed 2.4% COLAs; proportional-cut illustration.
Reserves are projected to run out in Q4, so one to three months at the reduced rate would cost about $538–$1,613 in calendar 2032. Twelve months would cost $6,450. The law leaves the payment schedule open.2, 23
Is the cut different for smaller benefits or by birth year?
A uniform percentage costs more dollars when the benefit is larger. The December 2025 distribution shows by how much.6, 7
The Supplement’s December 2025 distribution covers 53,624,664 retired workers. I divide them into four groups of 13,406,166 by benefit size. SSA reports counts in benefit ranges, which lets me bound each group’s average monthly loss.7
| Quarter of retired workers ranked by benefit | Mean monthly benefit bounds, December 2025 dollars | Illustrative 22% monthly loss, December 2025 dollars | Same loss carried to 2032 dollars |
|---|---|---|---|
| Lowest quarter | $938–$1,043 | $206–$229 | $241–$268 |
| Second quarter | $1,627–$1,727 | $358–$380 | $417–$443 |
| Third quarter | $2,253–$2,353 | $496–$518 | $578–$604 |
| Highest quarter | $3,163–$3,467 | $696–$763 | $812–$890 |
Source: Supplement Table 5.B6 and quartile CSV. Ranges rounded to dollars. The 2032 conversion applies 3.6% once and then five 2.4% increases; December 2025 amounts already include the January 2026 COLA, so adding it again would double count.7
For the first three groups, the model allocates people at bucket boundaries by rank and uses the published lower and upper benefit bounds. The highest group includes an open-ended bucket. Its mean is bounded using the published overall mean, $2,071.30, allowing half a cent of rounding, and subtracting the first three groups’ bounded totals.
A 22% cut would take roughly $206–$229 a month from the lowest quarter and $696–$763 from the highest
Bounds on mean monthly loss at a 22% reduction, by quarter of retired-worker benefits, December 2025 dollars
- Lower bound
- Upper bound
Numbers and method
| USD per month | Lower bound | Upper bound |
|---|---|---|
| Lowest benefit quarter | $207 | $229 |
| Second quarter | $358 | $380 |
| Third quarter | $496 | $518 |
| Highest benefit quarter | $696 | $763 |
Source: SSA Annual Statistical Supplement 2026, Table 5.B6; workbook Distribution. Observations: December 2025. Social Security sources checked November 12, 2026.
The table groups people already receiving retirement benefits in December 2025 by year of birth.
| Inferred birth year | Age at December 2025 | Average benefit, $/month in December 2025 | Illustrative 22% loss, $/month on that benefit |
|---|---|---|---|
| 1963 | 62 | 1,424.40 | 313.37 |
| 1958 | 67 | 2,016.48 | 443.63 |
| 1955 | 70 | 2,274.68 | 500.43 |
| 1950 | 75 | 2,144.88 | 471.87 |
| 1945 | 80 | 2,106.29 | 463.38 |
Source: Supplement Table 5.A1.1; birth year is 2025 minus year-end age. People who had not claimed are absent. These differences are not what the same person would receive by claiming at a different age.6
Why does the depletion date keep changing?
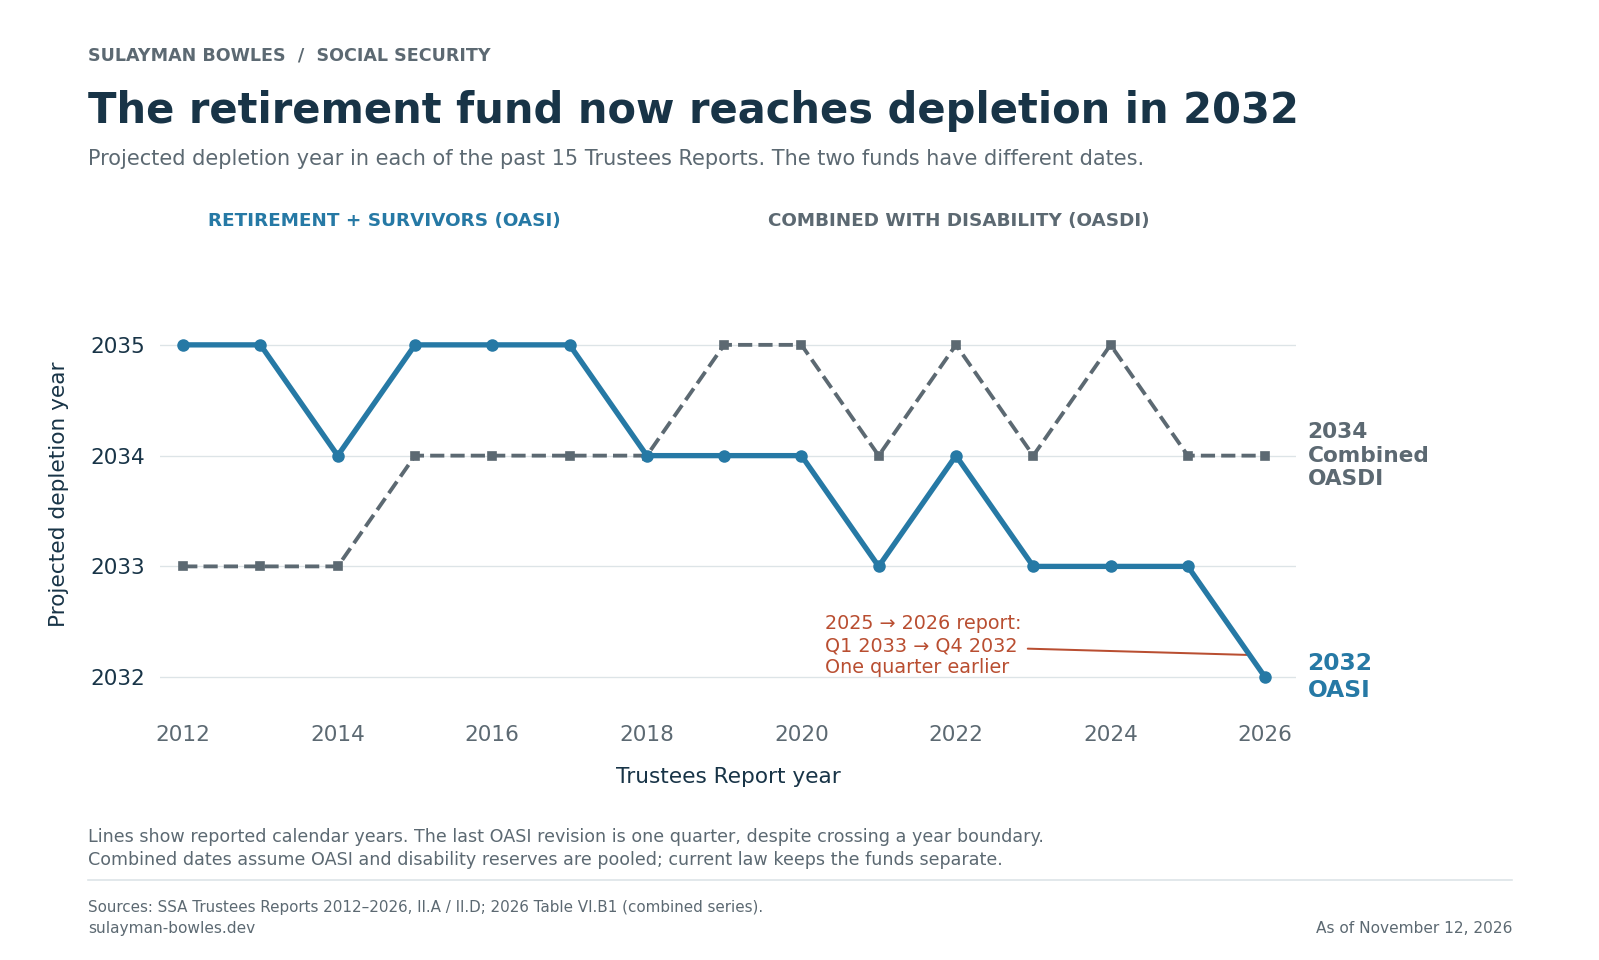
The date changes when cash flows, economic assumptions, demographic estimates or laws change. The latest retirement-fund revision is only one quarter earlier, from Q1 2033 in the 2025 report to Q4 2032 in the 2026 report.2, 9
Across the last fifteen reports, the projected OASI depletion date moved from 2035 in the 2012 report to 2032 in the 2026 report. Some forecasts along the way moved the date later.10
 (opens the full-size image)
VI.B1 for the combined history. Fifteen-report CSV with source links and revision context (retrieved November 12, 2026).The combined actuarial balance moved from −3.82 to −4.42 percentage points of taxable payroll: legislation −0.16; moving the valuation window −0.07; demographics −0.44; economics +0.10; disability assumptions +0.02; methods and program data −0.05. The components sum to the −0.60-point deterioration in the 75-year balance.11
In 2025, OASI received $1,248.780 billion, incurred $1,448.775 billion of costs and ended with $2,338.290 billion in reserves. Its annual gap used $199.995 billion of reserves. The intermediate projection continues to spend more than it collects.8
| OASI calendar year | Noninterest income, $bn | Interest, $bn | Total scheduled cost, $bn | Reconstructed year-end reserves, $bn |
|---|---|---|---|---|
| 2025 recorded | 1,187.104 | 61.676 | 1,448.775 | 2,338.290 |
| 2026 | 1,226.700 | 57.900 | 1,528.000 | 2,094.890 |
| 2027 | 1,273.600 | 52.600 | 1,619.900 | 1,801.190 |
| 2028 | 1,351.100 | 45.297 | 1,710.900 | 1,486.687 |
| 2029 | 1,422.100 | 36.897 | 1,803.100 | 1,142.584 |
| 2030 | 1,493.000 | 27.595 | 1,896.200 | 766.979 |
| 2031 | 1,566.100 | 17.395 | 1,990.000 | 360.474 |
| 2032 | 1,640.700 | 8.176 | 2,084.100 | 0.000 |
Source: SSA historical operations and Trustees IV.A1. Forecast rows are reconstructed from rounded source components.8, 2
The model starts with reserves, adds noninterest receipts and interest, subtracts scheduled costs, then floors remaining reserves at zero. Through 2031, the effective interest yield is inferred from published interest divided by the preceding published reserve; 2032 carries the 2031 yield. It reproduces 2032 depletion and places exhaustion in Q4, assuming each year’s cash flows are spread uniformly.
Historical reserve roll-forwards for 2020–2025 tie to published totals at the source’s million-dollar precision. The forecast’s small residuals come from rounded inputs and the simplified interest method; the model inserts no balancing plug.
OASI reserves fall from $2.34 trillion at the end of 2025 to zero in 2032
Year-end OASI trust fund reserves, USD trillions; observed 2020 to 2025, simple cash-flow reconstruction 2026 to 2032, nominal dollars
Numbers and method
| USD trillions | End-of-year reserves |
|---|---|
| 2020 | $2.81tn |
| 2021 | $2.75tn |
| 2022 | $2.71tn |
| 2023 | $2.64tn |
| 2024 | $2.54tn |
| 2025 | $2.34tn |
| 2026 | $2.09tn |
| 2027 | $1.80tn |
| 2028 | $1.49tn |
| 2029 | $1.14tn |
| 2030 | $0.77tn |
| 2031 | $0.36tn |
| 2032 | $0.00tn |
Source: SSA historical operations; Trustees IV.A1; workbook Fund. USD billions, year-end. As of November 12, 2026.
What could make the shortfall bigger or smaller?
Real wages and fertility drive the largest long-term swings in the cases shown. Tax receipts and benefit inflation matter more for the approaching reserve deadline.12
The official OASI cases give this range:
| June 2026 OASI case | Depletion | Initially financeable | Monthly loss on the $2,170 benchmark, in January 2027 benefit dollars |
|---|---|---|---|
| Low cost | Q3 2035 | 89% | $238.70 |
| Intermediate | Q4 2032 | 78% | $477.40 |
| High cost | Q3 2031 | 70% | $651.00 |
Source: Trustees IV.B5 and IV.A text. Fixed starting dollars allow comparison across different depletion years.3, 2
SSA publishes these one-at-a-time combined OASDI sensitivities. Each deficit is a percentage of taxable payroll over 2026–2100; the other assumptions stay at the intermediate setting.12
| Assumption and period | Lower input → deficit | Intermediate input → deficit | Higher input → deficit |
|---|---|---|---|
| Real covered-wage growth, annual average 2035–2100 | 0.53% → 5.61% | 1.14% → 4.42% | 1.74% → 3.27% |
| Fertility, ultimate children per woman from 2050 | 1.40 → 5.23% | 1.75 → 4.42% | 2.10 → 3.67% |
| Net immigration, annual average people 2036–2100 | 750,000 → 4.86% | 1,176,000 → 4.42% | 1,621,000 → 4.00% |
| CPI-W inflation, ultimate annual rate by 2028 | 1.8% → 4.57% | 2.4% → 4.42% | 3.0% → 4.28% |
Source: Trustees VI.D1, VI.D3–VI.D5. “Real” wage growth means after inflation; CPI-W is the Consumer Price Index for Urban Wage Earners and Clerical Workers.
Higher real wages increase tax receipts before the full effect on future awards arrives. More births increase the future workforce, but a baby born now cannot finance the approaching reserve deadline. All displayed fertility and immigration variations still produce 2034 combined depletion; the higher-wage case moves it to 2035.12
Wage growth and births move the 75-year Social Security deficit most; inflation barely does
Combined OASDI deficit, % of taxable payroll, 2026–2100, changing one assumption at a time; base case 4.42%
Numbers and method
| % of taxable payroll | Low | Base | High |
|---|---|---|---|
| Real wage growth | 3.27% | 4.42% | 5.61% |
| Births per woman | 3.67% | 4.42% | 5.23% |
| Net immigrants per year | 4.00% | 4.42% | 4.86% |
| Consumer-price inflation | 4.28% | 4.42% | 4.57% |
Source: Trustees VI.D1 and VI.D3–VI.D5. Combined OASDI, 2026–2100. As of November 12, 2026.
SSA does not publish an isolated unemployment solvency score in those sensitivity tables. My limited calculation moves unemployment from 4.5% to 5.5%, holding labor force, earnings per employed worker and tax treatment fixed, which reduces employment by 1 − 94.5/95.5. Applied to projected 2027 OASI payroll-tax receipts of $1,204.5 billion, that is about $12.6 billion less annual revenue. It is not a scored change in the depletion date.13, 2
Does 2026 inflation change the answer?
The announced 3.6% COLA exceeds the Trustees’ original 2.7% assumption for January 2027. On a stated $2,095 benefit, the difference adds $18.86 a month beyond the earlier projection.4, 5
Applying the entire surprise to all $1,609.4 billion of projected 2027 OASI benefits gives an upper bound:
$1,609.4 billion × (1.036 / 1.027 − 1) = $14.10 billion.
The exposure ranges from $0–$14.10 billion, depending on what share of the bill the surprise affects. I did not find that share: new eligibility and benefit timing mean the full bill does not receive the adjustment in the same way. The stress test holds wages, taxable earnings and tax receipts constant.2, 14
That differs from the Trustees’ permanent-inflation experiment, where real wage growth is held fixed. Faster nominal wages bring tax revenue forward while COLAs arrive with a lag, slightly improving the reported long-term balance. A one-time surprise and a permanently different inflation assumption answer different questions.12
For the household dollar estimate, future COLAs also matter:
| Assumed annual COLA, January 2028–2032 | 11% funding gap | 22% funding gap | 30% funding gap |
|---|---|---|---|
| 1.8% | $260.97 | $521.94 | $711.74 |
| 2.4% | $268.75 | $537.50 | $732.96 |
| 3.0% | $276.72 | $553.44 | $754.69 |
Source: monthly losses in 2032 dollars on a January 2027 $2,170 benefit. The table varies future COLAs and the funding gap.
How much would each proposed Social Security fix close?
Removing the wage cap without adding benefits closes about 58% of the current 75-year combined shortfall; raising the total payroll-tax rate to 17% closes about 101%. The timing and exact design matter: a reform can improve the distant balance substantially while barely moving the near-term depletion year.15, 16, 17
The actuary scores each proposal against the 4.42-point combined OASDI deficit. Dividing the improvement by 4.42 gives the share of the 75-year gap closed. The depletion dates in the table apply to the hypothetical combined funds. An OASI-only date is unavailable for these proposals.15
| Scored change and effective timing | Improvement, percentage points of taxable payroll | Share of combined 75-year gap closed | New combined depletion |
|---|---|---|---|
| Raise total employer-plus-employee payroll rate from 12.4% to 17% in 2027 (E1.1) | 4.47 | 101% | None through 2100 |
| Remove wage cap in 2027; no extra benefit credit (E2.1) | 2.55 | 58% | 2058 |
| Remove wage cap in 2027; full benefit credit (E2.2) | 1.98 | 45% | 2055 |
| Tax earnings above a fixed $400,000 from 2027; no extra credit; untaxed gap eventually closes (E2.17) | 2.33 | 53% | 2047 |
| Raise cap to cover 90% of earnings during 2027–2036; credit extra earnings (E3.1) | 0.82 | 19% | 2036 |
| Raise total payroll rate 0.1 point a year, 2028–2037, to 13.4% (E1.10) | 0.89 | 20% | 2035 |
| Raise full retirement age 2 months per cohort reaching 62 in 2027–2038 to 69; then 1 month every 2 years (C1.4) | 1.42 | 32% | 2034 |
| Use chained CPI-W from December 2027; assumed COLA reduction averaging 0.3 point (A3) | 0.65 | 15% | 2034 |
| Reduce factor on highest earnings segment from 15% to 5%, 2 points yearly for newly eligible 2028–2032; 5% thereafter (B3.14) | 0.39 | 9% | 2034 |
| Tax benefits like private pensions; phase thresholds out during 2027–2046 (H2) | 0.15 | 3% | 2034 |
| Tax all benefits for higher-income recipients from 2029 (H9) | 0.16 | 4% | 2034 |
| Redirect benefit-tax receipts from 2029, including the scored retrospective component (H8) | 0.83 | 19% | 2038 |
| Raise benefit-tax thresholds to $50,000/$100,000 in 2028; hold Medicare harmless (H4) | −0.05 | −1% | 2034 |
| Phase out OASDI benefit taxation during 2045–2054; retain Medicare taxation (H6) | −0.58 | −13% | 2034 |
Source: current OACT scores based on the 2026 Trustees Report (scored-provisions CSV). Whole percentages match SSA’s rounded presentation.15
Taxing additional wages closes more of the gap when those wages earn zero extra benefit credit. C1.4 phases in a higher retirement age for successive cohorts, changing their benefits over time. H8 shifts existing benefit-tax receipts and includes a retrospective transfer.15, 18
Under E2.17, the $400,000 threshold is fixed: the untaxed gap closes when the ordinary taxable maximum rises above it. H9 uses benefit-tax thresholds of $100,000 for single filers and $125,000 for joint filers, then indexes them. H2 changes the treatment of benefits toward the treatment of private pensions, under the actuary’s specified threshold phase-out.18
Only the 17% payroll tax closes the whole 75-year gap; no other scored reform closes more than 58%
Share of the 4.42%-of-payroll combined OASDI shortfall closed by each reform, SSA scores, 2026–2100
Numbers and method
| % of 75-year shortfall closed | Share of gap closed |
|---|---|
| Payroll tax to 17% total (2027) | 101% |
| Remove wage cap; no added credit | 58% |
| Remove wage cap; full benefit credit | 45% |
| Full retirement age to 69, then index | 32% |
| Payroll tax to 13.4% (2028–37) | 20% |
| Tax 90% of earnings, with credit | 19% |
| Chained CPI-W for COLAs | 15% |
| Lower factor on highest earnings | 9% |
| Tax benefits like private pensions | 3% |
Source: SSA OACT current provision scores; denominator 4.42 percentage points of taxable payroll. Combined OASDI, 2026–2100. As of November 12, 2026.
A package needs its own score because tax changes, benefit formulas and behavior interact. Under E1.1, combined reserves last through 2100 while the reserve ratio falls near the end of the projection.17
Did the 2025 tax law affect the trust fund?
The actuary estimated $168.6 billion less Social Security income over 2025–2034 from the tax law’s effect on taxes paid on benefits, using the 2025 baseline. The combined 75-year deficit widened by 0.16 percentage point of taxable payroll.19
The August 5, 2025 memo moved projected OASI exhaustion from Q1 2033 to Q4 2032 under that baseline. Its published total is $168.6 billion; its rounded annual rows sum to $168.7 billion.19
The 2026 Trustees Report includes the law in its 4.42-point combined deficit. The temporary extra deduction for older taxpayers can lower taxable income. The statute governing how Social Security benefits are taxed still applies.11, 20
How much is the Social Security increase for 2027 after Medicare?
The announced 3.6% COLA adds $75.42 to a stated $2,095 monthly benefit. Subtract the $6.60 projected increase in the standard Part B premium and the check rises $68.82 a month. The Medicare Trustees projected a $209.50 premium for 2027. CMS had yet to announce the final premium by November 12.4, 21
| January 2027 example, checked November 12, 2026 | Monthly dollars |
|---|---|
| Starting Social Security benefit | $2,095.00 |
| Gross COLA increase: $2,095 × 3.6% | +$75.42 |
| Standard Part B increase: $209.50 projected − $202.90 in 2026 | −$6.60 |
| Increase after this premium change | +$68.82 |
This example applies the standard premium only. Income-related surcharges, other Medicare premiums, taxes and individual withholding rules are outside it. SSA’s rounded estimated average after the COLA is $2,170, while a literal 3.6% increase on a specified $2,095 produces $2,170.42; the two are used for different purposes.4, 21
The standard Part B premium has sometimes absorbed part of the raise. In 2023 it fell, increasing the net gain.
| Payment year | Announced COLA | Gross monthly increase on that year’s pre-COLA average | Standard Part B change, $/month | Increase after Part B change, $/month |
|---|---|---|---|---|
| 2021 | 1.3% | $19.80 | +$3.90 | $15.90 |
| 2022 | 5.9% | $92.34 | +$21.60 | $70.74 |
| 2023 | 8.7% | $146.25 | −$5.20 | $151.45 |
| 2024 | 3.2% | $59.14 | +$9.80 | $49.34 |
| 2025 | 2.5% | $48.18 | +$10.30 | $37.88 |
| 2026 | 2.8% | $56.42 | +$17.90 | $38.52 |
| 2027 | 3.6% | $75.42 | +$6.60 projected | $68.82 projected |
Source: SSA’s annual COLA fact sheets; Medicare Trustees Table V.E2. Each row starts from that year’s published pre-COLA average.22, 21
After the Part B premium change, the 2027 raise is $68.82 a month, up from $38.52 in 2026
Monthly increase in the average retired-worker benefit: gross COLA and after the standard Part B premium change, 2021–2027
Numbers and method
| USD per month | Gross COLA increase | After standard Part B change |
|---|---|---|
| 2021 | $19.80 | $15.90 |
| 2022 | $92.34 | $70.74 |
| 2023 | $146.25 | $151.45 |
| 2024 | $59.14 | $49.34 |
| 2025 | $48.18 | $37.88 |
| 2026 | $56.42 | $38.52 |
| 2027 (projected premium) | $75.42 | $68.82 |
Source: annual SSA fact sheets; 2026 Medicare Trustees Report Table V.E2. 2027 premium is projected. As of November 12, 2026.
What legally happens when the trust fund is depleted?
The Social Security Act leaves the payment procedure after reserve depletion open. Beneficiaries keep their statutory entitlement, and the trust fund can pay only from the money available.23, 24
Congressional Research Service discusses two possible ways to handle the shortfall. The agency could issue smaller payments on time or pay full benefits on a delayed schedule.23
The next congressional term begins at noon on January 3, 2027 under the Twentieth Amendment. The date Congress meets may differ.25
Does a cut change when claiming later catches up?
A cut can change the break-even age when some checks arrive before the cut. Applying the same percentage to every payment leaves the break-even age unchanged.
Take a worker with a primary insurance amount, or PIA, of $2,000 monthly at full retirement age 67, measured in January 2027 purchasing power. For someone born in 1960 or later, SSA’s factors give $1,400 at 62, $2,000 at 67 and $2,480 at 70.26
The example starts claims in January and applies a flat 22% reduction from January 2033. It compares cumulative gross payments before taxes, without investment returns, discounting, mortality weighting, payment lags or spouse and survivor benefits.
| Worked comparison | No cut | Born 1965; flat cut from January 2033 | Born 1971; same cut |
|---|---|---|---|
| Claim at 62 versus 67: later claim catches up at age | 78.67 | 81.68 | 78.67 |
| Claim at 67 versus 70: later claim catches up at age | 82.50 | 83.68 | 82.50 |
Source: SSA adjustment factors; break-even calculation CSV. Ages are decimal years; 78.67 is about 78 years 8 months.
For the born-1965 example, the age-62 option collects $84,000 during five modeled years before the age-67 option begins. During 2032, the later option gains $7,200, leaving a $76,800 cumulative gap at the start of 2033. After the reduction, its monthly advantage is ($2,000 − $1,400) × 78% = $468. Recovering $76,800 takes 164.10 months from the age-68 model boundary, producing age 81.68. A different birth month or claim-start month changes those figures.
For someone born in 1971, all modeled claims start in or after 2033. Multiplying every payment by 78% reduces cumulative dollars but leaves the break-even calculation unchanged.
Under scheduled benefits, claiming at 70 overtakes claiming at 62 and 67 in the early 80s
Born 1965, illustrative $2,000 monthly benefit at 67; cumulative payments by age during the calendar year, January 2027 dollars, scheduled benefits
Show the numbers
| USD thousands, January 2027 dollars | Claim at 62 | Claim at 67 | Claim at 70 |
|---|---|---|---|
| 62 | $17k | $0k | $0k |
| 63 | $34k | $0k | $0k |
| 64 | $50k | $0k | $0k |
| 65 | $67k | $0k | $0k |
| 66 | $84k | $0k | $0k |
| 67 | $101k | $24k | $0k |
| 68 | $118k | $48k | $0k |
| 69 | $134k | $72k | $0k |
| 70 | $151k | $96k | $30k |
| 71 | $168k | $120k | $60k |
| 72 | $185k | $144k | $89k |
| 73 | $202k | $168k | $119k |
| 74 | $218k | $192k | $149k |
| 75 | $235k | $216k | $179k |
| 76 | $252k | $240k | $208k |
| 77 | $269k | $264k | $238k |
| 78 | $286k | $288k | $268k |
| 79 | $302k | $312k | $298k |
| 80 | $319k | $336k | $327k |
| 81 | $336k | $360k | $357k |
| 82 | $353k | $384k | $387k |
| 83 | $370k | $408k | $417k |
| 84 | $386k | $432k | $446k |
| 85 | $403k | $456k | $476k |
| 86 | $420k | $480k | $506k |
| 87 | $437k | $504k | $536k |
| 88 | $454k | $528k | $565k |
| 89 | $470k | $552k | $595k |
| 90 | $487k | $576k | $625k |
| 91 | $504k | $600k | $655k |
| 92 | $521k | $624k | $684k |
| 93 | $538k | $648k | $714k |
| 94 | $554k | $672k | $744k |
| 95 | $571k | $696k | $774k |
With a 22% cut from January 2033, every claiming age pays less and later claiming still catches up
Same household with a flat 22% cut from January 2033, cumulative payments by age, January 2027 dollars
Numbers and method
| USD thousands, January 2027 dollars | Claim at 62 | Claim at 67 | Claim at 70 |
|---|---|---|---|
| 62 | $17k | $0k | $0k |
| 63 | $34k | $0k | $0k |
| 64 | $50k | $0k | $0k |
| 65 | $67k | $0k | $0k |
| 66 | $84k | $0k | $0k |
| 67 | $101k | $24k | $0k |
| 68 | $114k | $43k | $0k |
| 69 | $127k | $61k | $0k |
| 70 | $140k | $80k | $23k |
| 71 | $153k | $99k | $46k |
| 72 | $166k | $118k | $70k |
| 73 | $179k | $136k | $93k |
| 74 | $193k | $155k | $116k |
| 75 | $206k | $174k | $139k |
| 76 | $219k | $192k | $162k |
| 77 | $232k | $211k | $186k |
| 78 | $245k | $230k | $209k |
| 79 | $258k | $249k | $232k |
| 80 | $271k | $267k | $255k |
| 81 | $284k | $286k | $279k |
| 82 | $297k | $305k | $302k |
| 83 | $310k | $324k | $325k |
| 84 | $324k | $342k | $348k |
| 85 | $337k | $361k | $371k |
| 86 | $350k | $380k | $395k |
| 87 | $363k | $398k | $418k |
| 88 | $376k | $417k | $441k |
| 89 | $389k | $436k | $464k |
| 90 | $402k | $455k | $487k |
| 91 | $415k | $473k | $511k |
| 92 | $428k | $492k | $534k |
| 93 | $442k | $511k | $557k |
| 94 | $455k | $529k | $580k |
| 95 | $468k | $548k | $604k |
Source: SSA age-adjustment factors; workbook Claiming. January 2027 purchasing power; ages during calendar years, cumulative amounts at year-end. As of November 12, 2026.
What could the funding gap mean for my check?
The calculator applies the Trustees’ published OASI financing checkpoints to a scheduled benefit in January 2027 dollars. Enter the amount at your chosen claim age. The example keeps that amount constant to show the funding effect in the same dollars.
The Trustees project 78% financeable at depletion in Q4 2032 and 62% in 2100. The annual tables publish income and scheduled costs. Those figures give a financing ratio of 63.95% for 2100, above the official payable share of 62%, in part because smaller payments reduce tax receipts on benefits.27, 1, 23
CRS cites an August 5, 2026 actuarial memo with adjusted payable percentages. The public numerical tables I reviewed give no adjusted OASI shares for 2033–2099; the annual financing CSV leaves them blank and reports the income-to-cost proxy for every year.23, 27
What would change this answer, and when should it be refreshed?
A financing law or the next Trustees Report would update the depletion scenarios. The next COLA and Medicare premium announcements change the estimates for individual checks.
| Evidence or event | Result to update | Editorial check date |
|---|---|---|
| CMS final 2027 Part B premium notice | Replace $209.50 projection; recompute $68.82 example | November 20, 2026, or immediately on release |
| New Social Security financing or benefit law | Baseline, reform scores and calculator rules | Immediately on enactment |
| 2027 Trustees Report | Both fund dates, annual cash flows, payable shares and reform denominator | June 30, 2027 check |
| October 2027 COLA announcement | Benefit benchmarks and next-year net increase | October 31, 2027 check |
| Public numerical adjusted OASI payable series | Complete the exact annual calculator path | When obtained |
Questions about the 2032 shortfall
Does Social Security stop paying in 2032?
The Trustees project that retirement reserves will run out in Q4 2032. Payroll taxes and taxes on benefits would keep coming in and cover 78% of scheduled retirement and survivor benefits at depletion.
How many dollars does the 2032 gap represent?
A proportional 22% reduction would cost $220 per $1,000 of scheduled benefits. Applying that share to the estimated January 2027 average of $2,170 gives $477.40 a month in 2027 benefit dollars, or about $538 in 2032 dollars after five assumed COLAs.
Why do some Social Security forecasts say 2034?
The Trustees project Q3 2034 depletion if retirement and disability reserves are combined, with 83% of scheduled benefits financeable. The retirement and survivor fund alone reaches depletion in Q4 2032, with 78% financeable. Combining the funds would require legislation.
What is the 2027 COLA after standard Part B?
The 3.6% COLA adds $75.42 to a stated $2,095 benefit. Subtracting the projected $6.60 standard Part B premium increase leaves $68.82 more a month. The $209.50 premium is a Trustees estimate as of November 12, 2026.
How much of the gap would removing the wage cap close?
Removing the wage cap without awarding additional benefit credit closes about 58% of the 75-year combined shortfall. The actuary projects that combined depletion would move to 2058.
Appendix: files and reconstruction
The Excel model includes inputs, calculations and reconciliation checks. The number register maps the reported figures to workbook cells. The annual financing CSV includes the income and cost series through 2100.
The Texas city balance-sheet analysis shows how five cities’ available reserves compare with long-term obligations. The Austin ISD financing analysis traces tax collections to the funding available for operations.
Statistical Supplement household benchmarks
The December 2025 Supplement also reports these groups, defined as in the source tables.
| Exact source category | Average benefit, $/month December 2025 | Illustrative 22% monthly loss, December 2025 dollars | Source table |
|---|---|---|---|
| Retired workers | 2,071.30 | 455.69 | 5.A1 |
| Nondisabled widow(er)s | 1,921.20 | 422.66 | 5.A1 |
| Worker and wife | 3,304.10 | 726.90 | 5.H2 |
| Worker and husband | 2,258.96 | 496.97 | 5.H2 |
| Nondisabled widow(er) only | 1,913.68 | 421.01 | 5.H2 |
Source: Supplement Tables 5.A1 and 5.H2; source CSV. The table applies the same share to historical benefits.6, 28
Primary sources
- Social Security and Medicare Boards of Trustees, 2026 OASDI Trustees Report, June 9, 2026,
II.AHighlights, TableII.A1. Assumptions set February 2026; accessed November 12, 2026. ↩ - 2026 Trustees Report,
IV.AShort-Range Estimates, TableIV.A1and footnotes. Separate-fund quarter dates and OASI short-range cash flows; accessed November 12, 2026. ↩ - 2026 Trustees Report,
IV.BLong-Range Estimates, TableIV.B5and actuarial-balance discussion. Accessed November 12, 2026. ↩ - SSA, October 14, 2026, 2027 COLA announcement and 2027 COLA fact sheet, estimated average monthly benefits table. Accessed November 12, 2026. ↩
- 2026 Trustees Report,
V.CProgram-Specific Assumptions, TableV.C1, footnote on effective December versus payment January; original tables XLSX,V_C!C69:C75. Original December 2026 projection 2.7%, subsequent intermediate assumptions 2.4%. Accessed November 12, 2026. ↩ - SSA, Annual Statistical Supplement 2026, Table
5.A1.1, December 2025 beneficiary counts and average benefits by age. Accessed November 12, 2026. ↩ - SSA, Annual Statistical Supplement 2026, Table
5.B6, December 2025 benefit distribution and overall mean. Accessed November 12, 2026. ↩ - SSA Office of the Chief Actuary, OASI Trust Fund historical operations, annual operations, income and cost tables. Original units millions; normalized to twelve scheduled monthly payments per year. Accessed November 12, 2026. ↩
- 2025 Trustees Report,
II.AandIV.A. Prior OASI depletion Q1 2033. Accessed November 12, 2026. ↩ - Each 2012–2026 Trustees Report’s
II.A/II.Doverview and 2026VI.B, TableVI.B1. Exact annual URLs are indata/depletion_history_2012_2026.csv; all pulled November 12, 2026. ↩ - 2026 Trustees Report,
IV.B, TableIV.B9, changes in actuarial balance from the 2025 report. Accessed November 12, 2026. ↩ - 2026 Trustees Report,
VI.D, TablesVI.D1andVI.D3–VI.D5. Accessed November 12, 2026. ↩ - 2026 Trustees Report,
II.C, TableII.C1andV.Beconomic assumptions. The unemployment example uses a stated scenario. Accessed November 12, 2026. ↩ - SSA, Federal Register annual COLA notice, October 26, 2026; Cost-of-Living Increase and Other Determinations for 2027, 91 FR 67380–67385; new-eligibility and effective-date provisions limit the full-bill inflation illustration. Accessed November 12, 2026. ↩
- SSA Office of the Chief Actuary, Summary of Provisions That Would Change the Social Security Program, current scores based on the 2026 Trustees Report; individual tables, specifications and score dates in
data/solvency_provisions_2026.csv(retrieved November 12, 2026). ↩ - OACT E2.1, table_run137, September 21, 2026; summary estimates and depletion footnote. Accessed November 12, 2026. ↩
- OACT E1.1, table_run202, September 21, 2026. Accessed November 12, 2026. ↩
- OACT H2 table_run089, H9 table_run094, H8 table_run095, H4 table_run090 and H6 table_run092. Accessed November 12, 2026. ↩
- OACT, letter to Senator Ron Wyden, August 5, 2025, p. 2 and Table
1b.n, PDF p. 5. Estimates on the 2025 Trustees baseline; accessed November 12, 2026. ↩ - Public Law 119-21, July 4, 2025, §§70101–70103; Internal Revenue Code §86 (26 U.S.C. §86) tax treatment was not repealed by the senior deduction. Accessed November 12, 2026. ↩
- CMS, 2026 Medicare Trustees Report, June 9, 2026, printed p. 87 and Table
V.E2, printed p. 207; 2026 premium determination, November 14, 2025. 2027 amounts are projections in the report. Accessed November 12, 2026. ↩ - SSA annual COLA fact sheets for 2021, 2022, 2023, 2024, 2025, 2026 and 2027. Benefit benchmarks and COLAs; retrieved November 12, 2026. ↩
- Congressional Research Service, R49500: Social Security: Trust Funds, Financing, and the Projected Shortfall, November 2, 2026, official PDF, published text. Figure 2 and printed pp. 23–27, especially payment procedure and entitlement discussion. Accessed November 12, 2026. ↩
- Social Security Act §201(h), §202(a), and 31 U.S.C. §1341(a)(1)(A), discussed in CRS R49500. Accessed November 12, 2026. ↩
- U.S. Constitution, Twentieth Amendment §§1–2, GPO House Manual, printed pp. 113–117. Term starts at noon January 3; meeting date may be changed by law. Accessed November 12, 2026. ↩
- SSA, Effect of Early or Delayed Retirement on Retirement Benefits, “1960 and later” row; When to Start Receiving Retirement Benefits, illustrative $2,000 PIA. Accessed November 12, 2026. ↩
- SSA, 2026 single-year Trustees tables, sheets
IV.B1,IV.B2andVI.G3. The income/cost ratios finance scheduled benefits and do not supply the missing adjusted annual OASI payable series (retrieved November 12, 2026). ↩ - SSA, Annual Statistical Supplement 2026, Table
5.H2, beneficiary family groups and average monthly family benefit, December 2025; notes distinguish full from actuarially reduced benefits. Accessed November 12, 2026. ↩
Supporting material
- Excel model (XLSX file) Sourced inputs, live calculations and reported outputs.
- Source and model data (CSV collection) (ZIP file) Data tables, source references and calculation exports.
- Sources (CSV file) Download as CSV.
- Annual oasi financing (CSV file) Download as CSV.
- Household results (CSV file) Download as CSV.
- Solvency provisions 2026 (CSV file) Download as CSV.
- Calculator default output (CSV file) Download as CSV.