An AI megawatt is not a megawatt.
A conditional GB300 model turns facility power into installed GPUs. A grid request alone leaves the fleet unknown.
Sulayman Bowles · · Updated
How many GPUs does a one-gigawatt AI data center contain?
There is no single conversion until you know whether the gigawatt means a grid request, facility capacity, IT power, or average consumption. The reference model here converts 1,000 MW of facility capacity into 402,574 B300 GPUs using its stated NVL72 rack assumptions, PUE of 1.145, and 10% external IT overhead. That is a scenario, not an observed fleet. Apply overhead at the correct boundary, then distinguish installed capacity from utilization and useful work.
Evidence: NVIDIA NVL72 components · NVIDIA network architecture · 2025 U.S. data-center energy report
Read this alongside What constrains physical capacity?.
The reference model converts a 1,000 MW facility into 402,574 installed B300 GPUs, using homogeneous GB300 NVL72 racks, PUE 1.145, and 10% external IT overhead. It cannot make the same conversion from a “1 GW” headline alone: that figure might describe a grid request, facility capacity, IT capacity, or average draw.
Each boundary includes different equipment and may describe a different project state. Change the boundary and the GPU count changes. If the only disclosure is a grid request, installed fleet size remains unknown.
Scope and assumptions
This is a homogeneous GB300 reference conversion, not a forecast of any named data center. The 142 kW rack value is an “up to” specification; PUE and external-IT factors are scenarios; the 50% interconnection-utilization example is illustrative; network power is incomplete beyond the documented eight-SU design; computational utilization does not equal useful work or revenue utilization.
Separate grid, facility, IT, and average power
Utility filings, construction announcements, and hardware plans use the same unit for different quantities. A grid request concerns the connection point. Facility nameplate includes cooling, power conversion, lighting, and other infrastructure. IT nameplate excludes that layer; rack nameplate excludes much of the network, storage, and control plane. Average demand measures a time-weighted flow.
LBNL warns that annual energy, average and maximum demand, facility nameplate, and requested interconnection capacity cannot be converted reliably without project-specific relationships. Its grid definition includes total facility needs and design margins. It estimates interconnection utilization around 50% because of redundancy and maintenance, but says the value is poorly documented. Use it as an illustration, not a general ratio. S8
Before converting, establish boundary, status, and time basis. Announced, requested, firm, energized, commissioned, and occupied capacity describe different states. Phasing and reserved space or power can leave the installed fleet smaller than the headline suggests.
| Term | Boundary or state | What can be calculated | What remains unknown |
|---|---|---|---|
| Announced program capacity | Corporate plan; may combine sites and phases | Nothing mechanical without further disclosure | Site, timing, boundary, firmness, equipment |
| Requested interconnection | Maximum requested at grid point, including margins | Illustrative annual energy if average utilization is assumed | Firmness, energization, facility design, installed fleet |
| Firm / energized interconnection | Contracted or physically available grid capacity | Upper electrical envelope at that boundary | Average draw, PUE, occupancy, rack mix |
| Facility nameplate | Whole-building maximum electrical capacity | IT capacity after PUE; rack capacity after external IT allowance | Actual average draw and utilization |
| IT nameplate | Servers, network, storage, and support IT | Rack capacity after external IT allowance | Facility draw unless PUE is known |
| Compute-rack nameplate | GB300 rack “up to” requirements | Rack and installed-GPU equivalents | Actual workload draw and useful work |
| Average facility demand | Time-weighted facility power | Annual MWh/TWh | Installed fleet without nameplate and utilization |
| Full-load-equivalent compute | Installed fleet × computational utilization × time | Comparable accelerator-hours within a defined generation | Useful work, service quality, and revenue |
Apply PUE once, then reserve non-rack IT power
The reference case starts with 1,000 MW of total facility nameplate. This controlled boundary allows PUE to be applied once; it does not describe how most announcements are written.
It assumes homogeneous GB300 NVL72 racks. Real campuses mix accelerators, CPUs, storage, network generations, development clusters, spares, and partially occupied halls. Holding hardware constant isolates the boundary problem; it does not forecast a company’s asset register.
Divide facility MW by PUE to obtain IT MW. Then reserve power for scale-out networking, storage, support servers, and management. NVIDIA’s rack specification converts the remainder into racks and GPUs. This sequence keeps facility overhead outside the IT allocation rather than counting it twice.
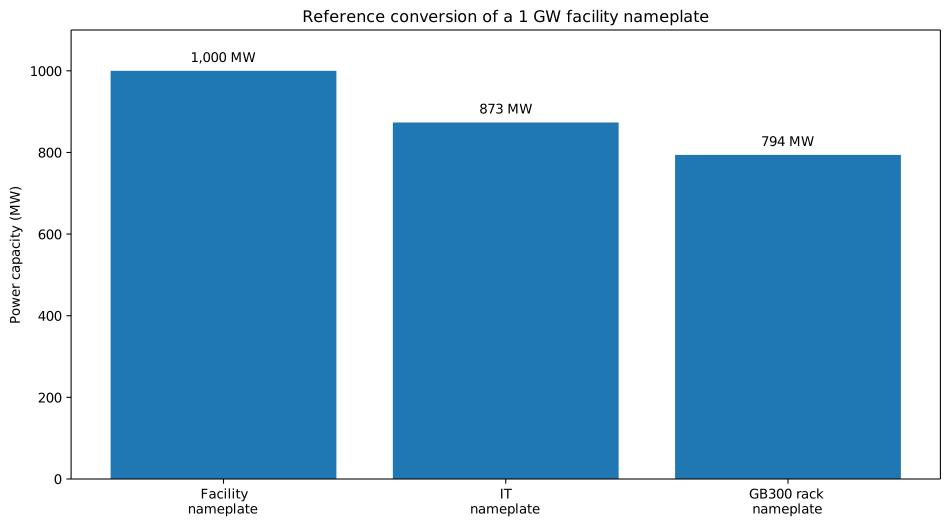
| Step | Formula | Reference input | Reference output |
|---|---|---|---|
| Facility → IT | IT MW = facility MW ÷ PUE | 1,000 MW ÷ 1.145 | 873.36 MW |
| IT → compute racks | Rack MW = IT MW ÷ (1 + external IT overhead) | 873.36 MW ÷ 1.10 | 793.97 MW |
| Rack MW → racks | Racks = rack MW × 1,000 ÷ 142 kW | 793.97 MW | 5,591.31 rack equivalents |
| Racks → GPUs | GPUs = racks × 72 | 5,591.31 × 72 | 402,574 B300 GPUs |
| Fleet → FLE hours | FLE = GPUs × 8,760 × utilization | 80% training utilization | 2.82B GPU-hours/year |
Use the whole rack
NVIDIA’s reference architecture defines one GB300 NVL72 scalable unit as a liquid-cooled rack: 18 compute trays, 72 B300 GPUs, and 36 Grace CPUs, requiring up to 142 kW. Each tray also contains ConnectX-8 adapters, a BlueField DPU, boot storage, and local cache, alongside four GPUs and two CPUs. S1S2
Dividing a gigawatt by per-GPU thermal design power omits CPUs, memory, NVLink, storage, adapters, management hardware, and conversion losses inside the cabinet. This model starts with rack power because that boundary includes them.
“Up to 142 kW” is a maximum requirement, not continuous draw. It gives a conservative rack count at fixed compute-rack nameplate. Annual energy requires a separate utilization model.
| Element | Quantity | Power or role | Treatment |
|---|---|---|---|
| GB300 rack / scalable unit | 1 | Up to 142 kW | Compute-rack nameplate denominator |
| Compute trays | 18 | 4 B300 + 2 Grace per tray | Node count and internal system boundary |
| B300 GPUs | 72 | Accelerators in one NVLink domain | Installed fleet output |
| Grace CPUs | 36 | Host compute and memory | Included inside rack nameplate |
| In-rack management switches | 2 SN2201 | OOB access; DC busbar | Included inside rack specification |
| External fabrics | Compute, converged, storage/customer, support, OOB | Scale-out and operations | Reserved in external-IT overhead |
A small-cluster network is not a gigawatt-scale measurement
NVIDIA’s eight-SU bill of materials specifies eight racks, 576 GPUs, 44 compute-core switches, 11 converged-core switches, and 16 OOB management switches. Using SN5600 passive-cable typical power plus SN2201 power gives 53.27 kW: 4.69% of the racks’ combined 1.136 MW nameplate, before storage, support servers, customer-edge equipment, or additional network tiers. S3S6S7
The documents disagree on hardware. The BOM and logical architecture name SN5600; the networking-hardware page names SN5610. Its specification gives 900 W with passive cables and 2.08 kW with 64 optical modules. Applying the optical figure to 55 high-speed switches raises the comparator to 115.97 kW, or 10.21% of rack nameplate. This is an optics comparison, not an assumption that every port is populated. S3S5S6
An eight-rack design cannot be scaled by simple multiplication. NVIDIA separates fabrics in larger designs and introduces a super-spine around 1,024 nodes. Storage, customer, support-server, and management networks also sit outside the compute fabric. The reference fleet has roughly 100,000 compute trays, far beyond the documented design point. S4
The model therefore tests external IT overhead of 6%, 10%, and 14%. Six percent sits above the passive-switch floor; ten percent approaches the optics comparator before unquantified support equipment. Fourteen percent comes from a GB200-era Epoch total-IT/server decomposition: a magnitude check, not a GB300 measurement. S9
| Component | Count | Lower typical power | Optical comparator | Notes |
|---|---|---|---|---|
| Compute-core high-speed switches | 44 | 41.36 kW | 91.52 kW | BOM says SN5600; comparator uses SN5610 with 64 optical modules |
| Converged-core high-speed switches | 11 | 10.34 kW | 22.88 kW | Same model-name contradiction |
| OOB switches | 16 | 1.57 kW | 1.57 kW | SN2201 at 98 W typical |
| Total external switches | 71 | 53.27 kW | 115.97 kW | Excludes support servers, storage, super-spine, and facility infrastructure |
| Share of eight-rack nameplate | 8 × 142 kW | 4.69% | 10.21% | Denominator is compute-rack nameplate |
The facility reference yields 402,574 B300 GPUs
LBNL estimates average PUE of 1.145 for facilities serving AI equipment in 2024. PUE divides total facility energy by IT energy. Applied to the reference case, 1,000 MW ÷ 1.145 leaves 873.36 MW for IT. A 10% external IT allowance, measured on top of compute-rack power, leaves 793.97 MW for GB300 racks. At 142 kW and 72 GPUs per rack, that supports 5,591.31 rack equivalents and 402,574 installed B300 GPUs. S1S8
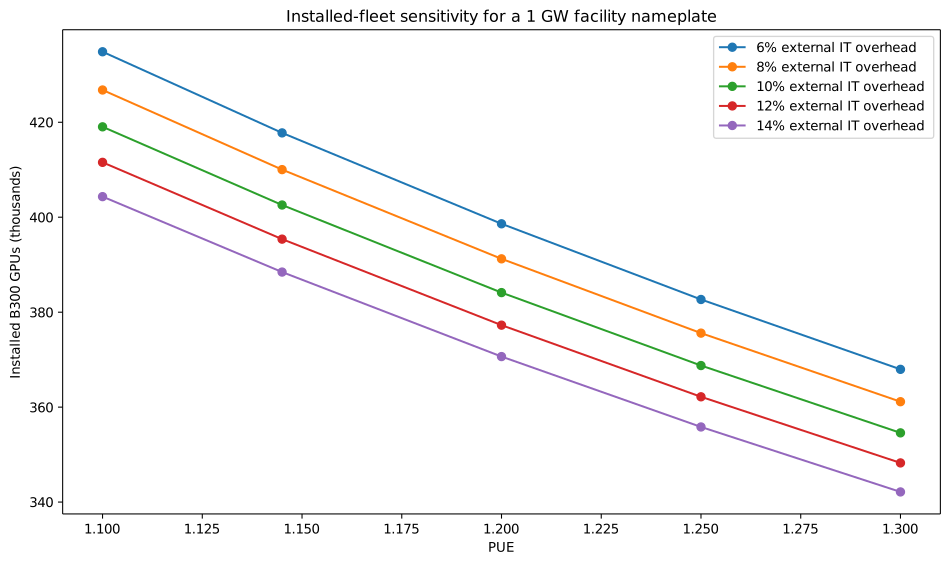
PUE 1.10 with 6% external IT overhead yields 434,856 GPUs; PUE 1.25 with 14% yields 355,819. These are engineering sensitivities, not confidence bounds. The 79,037-GPU difference equals about 1,098 GB300 racks.
A boundary error can outweigh an overhead sensitivity. Treating a grid request as installed IT power overstates what is known; applying PUE to an IT figure counts facility overhead a second time.
- Reference fleet
- 402,574 B300s
- Facility sensitivity
- 356K–435K B300s
- 1 GW IT boundary
- 461K B300s
- Research cutoff
- 2026.08.16
| Scenario | PUE | External IT overhead | IT MW | GB300 rack MW | Rack equivalents | Installed B300 GPUs |
|---|---|---|---|---|---|---|
| Efficient | 1.1 | 6% | 909.09 | 857.63 | 6,040 | 434,856 |
| Reference | 1.145 | 10% | 873.36 | 793.97 | 5,591 | 402,574 |
| Conservative | 1.25 | 14% | 800.00 | 701.75 | 4,942 | 355,819 |
An IT gigawatt and a grid request give different answers
Epoch’s one-gigawatt cost model starts with IT nameplate and applies PUE and utilization separately for operating energy. At that boundary, a 10% external IT allowance leaves 909.09 MW for racks and supports 460,948 B300 GPUs—roughly 58,000 more than the facility reference, because facility overhead sits outside the gigawatt. S10
A 1 GW grid request gives no fleet estimate. LBNL’s illustrative 50% average utilization implies 500 MW of average facility draw and 4.38 TWh per year. It reveals neither facility nameplate—1 GW, 700 MW, 500 MW, or phased halls—nor PUE, external IT share, rack density, or occupancy. S8
Time also changes the claim. Epoch’s Frontier Data Centers Hub notes that campuses open in stages and companies may not clarify incremental timelines. Announced, under-construction, energized, commissioned, and occupied capacity remain separate states. S11
| What 1 GW means | Immediate implication | Reference arithmetic | Installed GPU inference |
|---|---|---|---|
| Total facility nameplate | Whole-building maximum capacity | 873.36 IT MW after PUE | ≈ 402,574 GPUs with 10% external IT overhead |
| IT nameplate | Servers + external network/storage/support IT | 909.09 compute-rack MW after 10% allowance | ≈ 460,948 GPUs |
| Interconnection request | Maximum requested at grid point, including margins | 500 MW average and 4.38 TWh/year at 50% | Not identifiable from the request alone |
| Average facility draw | Time-weighted whole-building power | 8.76 TWh/year at 1 GW average | Not identifiable without nameplate, PUE, and loading |
GPU-hours measure intensity, not useful work
Keeping 402,574 B300 GPUs powered on for a year yields 3.53 billion powered-on GPU-hours. That counts time, not computational work.
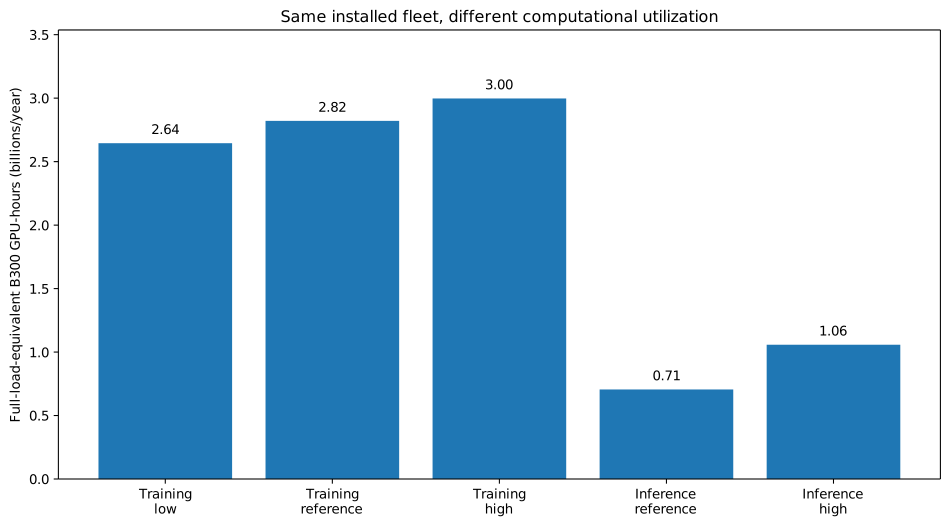
LBNL defines utilization as average computational intensity relative to maximum. It assumes 80% for training, with a 75%–85% range, and 20% for inference by 2030, with a 30% high-inference case. The reference fleet yields 2.64–3.00 billion training full-load-equivalent GPU-hours, 0.705 billion at 20% inference utilization, and 1.06 billion at 30%. S8
These hours still omit architecture, precision, sparsity, communication, checkpointing, failed jobs, software quality, throttling, and hardware-generation differences. They separate installed capacity from annual intensity; they do not measure useful work.
Revenue requires another model. Reservations, service obligations, internal workloads, customer mix, prices, credits, and peak-capacity reserves determine paid utilization. The engineering documents do not establish those economics.
| Workload case | Computational utilization | FLE B300 GPU-hours/year | Average rated-power fraction at 20% idle |
|---|---|---|---|
| Training low | 75% | 2.645B | 80.0% |
| Training reference | 80% | 2.821B | 84.0% |
| Training high | 85% | 2.998B | 88.0% |
| Inference reference | 20% | 0.705B | 36.0% |
| Inference high | 30% | 1.058B | 44.0% |
Disclose boundary, status, and time before hardware
A reconstructable claim starts with electrical boundary, status, and time, then states hardware, facility, and utilization assumptions. Unknowns and ranges are acceptable. Combining requested power, energized power, installed IT, and active compute into one figure is not.
For investors, these distinctions affect capex intensity, commissioning risk, revenue timing, depreciation, and utilization. For utilities, they affect load forecasts and reserves. For operators, they locate the constraint: interconnection, mechanical plant, white space, power delivery, networking, storage, or scheduling.
- Boundary: interconnection, facility, IT, rack, or average draw.
- Status: announced, requested, firm, energized, commissioned, occupied, or active.
- Time basis: current, phase date, full-build date, peak, or annual average.
- Redundancy and margin: what is reserved and why.
- PUE: value, period, load point, and measurement boundary.
- IT allocation: server/rack, network, storage, support, and management shares.
- Hardware: accelerator generation, rack architecture, quantity, and mix.
- Utilization: computational, electrical, scheduling, and paid utilization kept separate.
- Staging: phase-by-phase energized and occupied capacity.
- Source: utility filing, one-line, vendor order, asset register, or management estimate.
Where the reference conversion stops
This is not a campus forecast. Firm interconnection, topology, PUE curve, cooling, storage, port population, spares, power caps, rack loading, accelerator mix, occupancy, workloads, and bookings remain unknown.
A site may fit more racks if average or capped draw is lower, provided its electrical and thermal design supports that policy. Redundancy, stranded capacity, maintenance, or topology may instead prevent full occupancy. Nameplate arithmetic does not resolve either case.
The external IT range is not measured at gigawatt scale. It uses an eight-SU switch reconstruction, an optics comparator, architectural requirements, and a GB200-era magnitude check. Storage and support infrastructure are still unquantified.
A GPU is not a stable performance unit across generations, precisions, models, software, or workloads. The model reports physical B300 units and B300 GPU-hours; it does not infer H100-equivalents, FLOP/s, tokens, training runs, or revenue.
Identify the electrical boundary before comparing fleets
In this reference design, a 1 GW facility supports about 402,574 installed B300 GPUs, with 355,819–434,856 across engineering sensitivities. Those counts require the stated hardware and overhead assumptions. A grid request alone supports no fleet estimate, and installed GPUs do not establish useful work or revenue.
Sources
- System Hardware & Components — NVIDIA NVL72 AI Factory
Verified Aug 16, 2026
- Overview — NVIDIA NVL72 AI Factory
Verified Aug 16, 2026
- Appendix B – Node Configurations — NVIDIA NVL72 AI Factory
Verified Aug 16, 2026
- Network Logical Architecture — NVIDIA NVL72 AI Factory
Verified Aug 16, 2026
- Networking Hardware — NVIDIA NVL72 AI Factory
Verified Aug 16, 2026
- Spectrum-4 SN5000 Switch Systems Specifications
Verified Aug 16, 2026
- SN2201 and SN2201_M Specifications
Verified Aug 16, 2026
- United States Data Center Energy Usage Report: 2025 Update
Verified Aug 16, 2026
- GPUs account for about 40% of power usage in AI data centers
Verified Aug 16, 2026
- Total cost of ownership of a one-gigawatt AI data center
Verified Aug 16, 2026
- Introducing the Frontier Data Centers Hub
Verified Aug 16, 2026
Supporting material
- Capacity conversion model
Formula-driven facility, IT, rack, network, utilization, and sensitivity workbook.
- Source ledger
Primary and secondary sources with claims, definitions, limitations, and provenance.
- Claim ledger
Load-bearing claims classified as observed, derived, scenario, or interpretation.
- Methodology appendix
Research contract, definitions, formulas, provenance, contradictions, and calculation checks.
- Sensitivity data
PUE-by-external-IT-overhead matrix for installed B300 GPU equivalents.