Texas business
Where the Texas home insurance premium goes
Texas homeowners insurers incurred about 66 cents of claims per premium dollar from 2016 to 2025. In 2025, that figure was about 46 cents.
Texas homeowners insurance had a strong direct underwriting rebound in 2025. For each $100 of earned premium, the Texas Department of Insurance’s market overview attributes $45.60 to incurred claims, $30.80 to claim handling and other expenses, and $0.40 to policyholder dividends. The remaining $23.20 is a direct underwriting balance before the missing reinsurance and consolidated-company adjustments. It is not evidence that insurers kept $23.20 as distributable profit. A narrower TDI expense exhibit reports a comparable 23.01% pretax direct-business result excluding investment gain, also not profit after reinsurance. TDI market overview · 2025 expense exhibit
The long record is less comfortable. Across 2016–2025, statutory homeowners insurers earned $120.939 billion in Texas premium and incurred $79.422 billion in losses: 65.67 cents of claims per premium dollar, before claim handling, selling costs, administration, taxes and risk transfer. The 2021 loss ratio alone was 104.03%. TDI reports a 100.6% combined ratio for the ten-year window, indicating a small direct underwriting deficit after expenses and dividends. Over 2021–2025, the expense exhibit’s accumulated direct-business pretax result was only 0.59% of earned premium. The latest good year materially improves the historical picture; it does not erase catastrophe volatility. [S1–S3]
Public filings show how claims, expenses and related-party transfers vary.
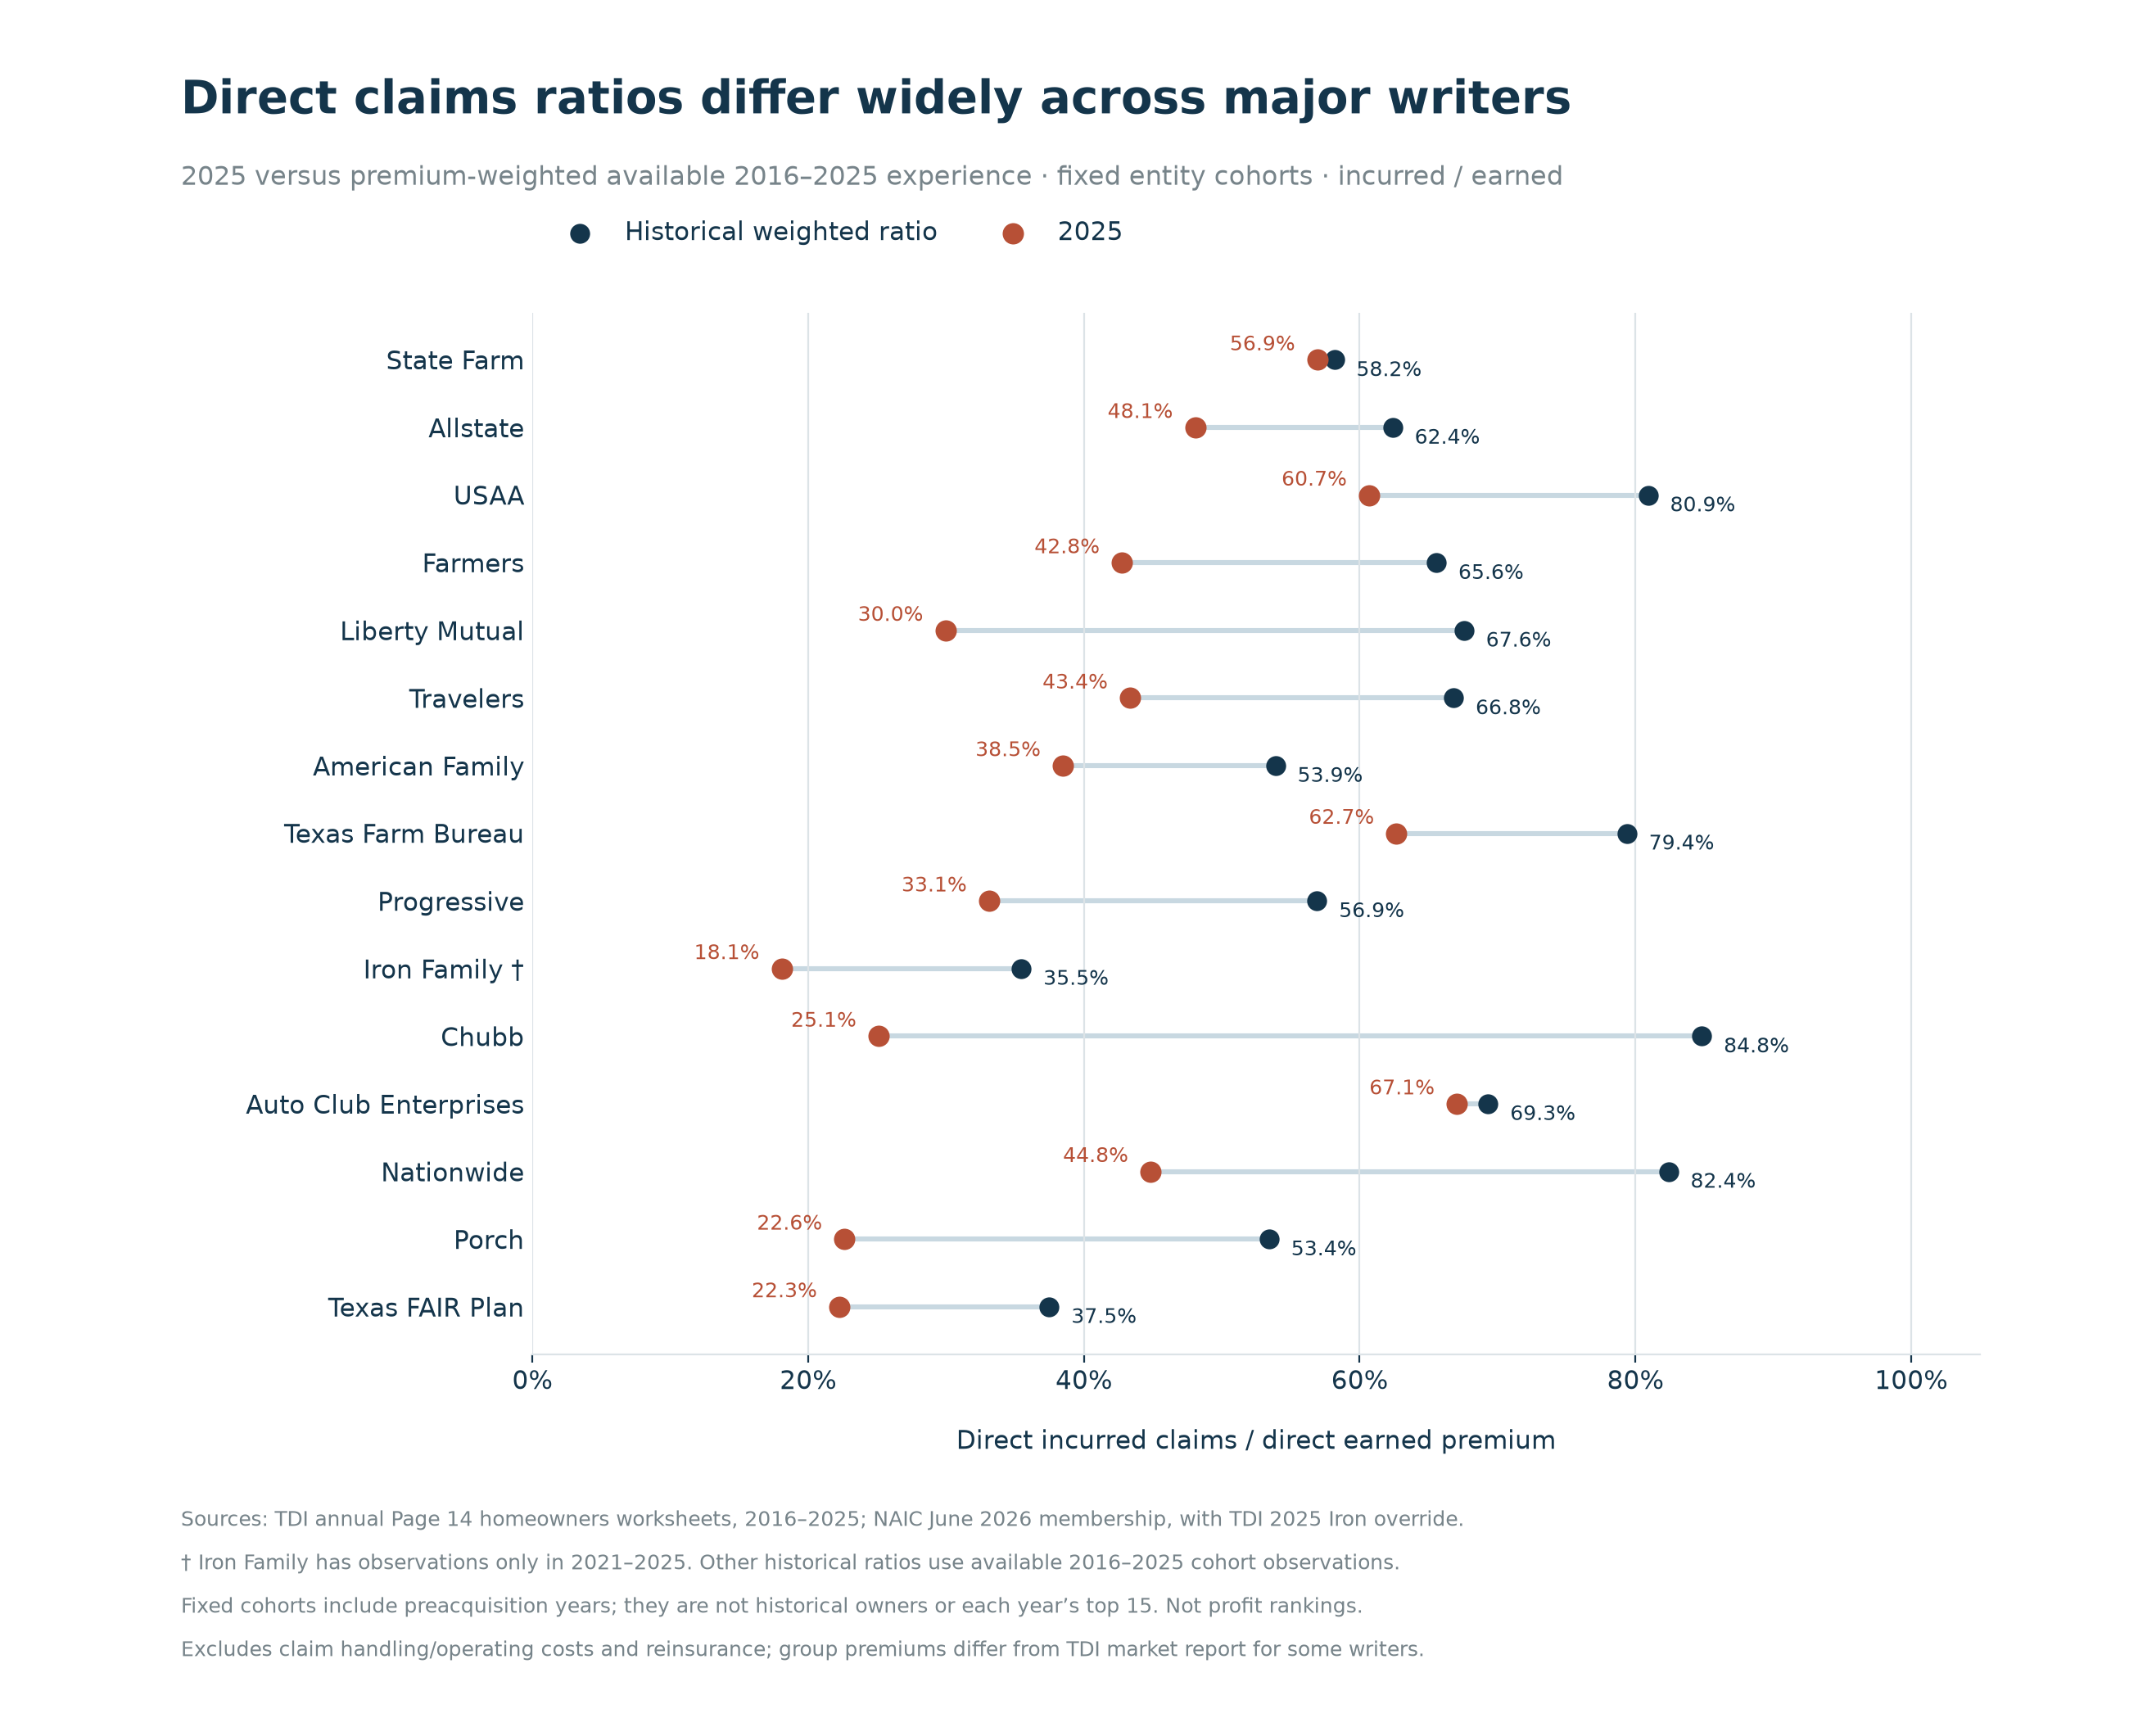
- Claims vary substantially by insurer and year. Among reconstructed 2025 leading-group cohorts, 2025 incurred-loss ratios range from 18.1% for Iron Family to 67.1% for Auto Club Enterprises. The ratios measure direct incurred claims relative to earned premium. Net profitability also depends on expenses and risk transfer.
- Related-party transfers matter. Some Texas writing companies cede premiums, losses and expenses into national pools; reciprocal managers may earn fees while policyholders own the insurance surplus. Statutory schedules document those arrangements.
- The complete private-market split remains unmeasured. The public rate register supplies selected filed changes for all ten leading groups, but this research retrieved zero of their ten supporting actuarial memoranda. Their indicated changes, catastrophe loads, reinsurance provisions and profit selections therefore remain unknown. The residual-market examples apply to those pools. The private carriers’ assumptions remain unknown. [S4–S8]
The premise also needs updating today. The latest complete statutory year is 2025; current 2026 filings contain both increases and decreases. Selected filings include State Farm Lloyds +4%, USAA +7.2%, ASI Lloyds −6%, and Texas Farm Bureau Mutual −5.2%. The changes apply to the named programs. Meanwhile, TDI’s preliminary 2025 average premium is $3,489, against $1,791 in 2016. A premium can keep rising when a filed rate stops rising because the insured amount, deductible, roof coverage or policy mix changes. [S1, S5]
Reading rule: “Reported” below means a source’s disclosed figure. “Calculated” means arithmetic using identified reported inputs. “Illustrative” identifies a scenario built from stated assumptions. All material sources were accessed on November 12, 2026.
1. What counts as a premium dollar
Written premium measures business booked during the year. Earned premium measures the portion associated with coverage already provided. A renewal collected in December is not wholly earned in December. Paid losses are cash payments; incurred losses include changes in estimates of unpaid claims. A useful retrospective loss ratio therefore divides incurred losses by earned premium, keeping the period and insurance line consistent.
“Homeowners” also changes meaning across sources. Statutory homeowners multiple peril includes renters insurance. TDI’s owner-occupied premium map, Treasury’s HO-3/HO-5 sample, a carrier’s investor presentation and TWIA’s wind-and-hail-only policies are different populations. Their denominators cannot be exchanged.
The central accounting problem is reinsurance. Gross insured losses already include losses that a reinsurer may ultimately reimburse. Adding all ceded premium to those gross losses overstates the amount spent unless recoveries and commissions are credited. A consistent presentation is:
Direct earned premium − direct incurred losses − direct claim-handling expense − gross operating expense − net reinsurance effect − policyholder dividends = underwriting result, with assumed business and other income adjustments where applicable.
Here, net reinsurance effect = ceded earned premium − ceded incurred loss/claim-expense recoveries − ceding commissions. It can be negative in a catastrophe year. Alternatively, a statement can start with net earned premium and net claims. Mixing the two approaches produces a false waterfall.
Profit has several meanings: underwriting result, pretax income including investment returns, net income after tax, or return on capital. A state expense allocation does not measure all of them. Nor does a fee paid to an affiliate equal that affiliate’s profit: staff, technology, distribution and other costs may sit on the recipient’s books. The statutory residual-market reconciliations and company schedules below demonstrate these distinctions.
2. Ten years of premiums, claims and direct expenses
The statutory reconstruction contains 2,467 insurer-year observations from the homeowners worksheets in TDI’s annual Page 14 files. Entity sums reproduce each original statewide control total exactly. The annual incurred/earned ratios independently reproduce TDI’s published rounded ratios. [S1–S2]
| Year | Written premium, $bn | Earned premium, $bn | Incurred claims, $bn | Claims / earned | Claim handling + other expense | Policyholder dividends | Direct underwriting balance* |
|---|---|---|---|---|---|---|---|
| 2016 | 8.387 | 8.246 | 7.214 | 87.5% | 36.5% | 0.6% | −24.6% |
| 2017 | 8.747 | 8.528 | 6.798 | 79.7% | 37.8% | 0.6% | −18.1% |
| 2018 | 9.348 | 9.027 | 4.033 | 44.7% | 35.8% | 0.5% | 19.0% |
| 2019 | 10.050 | 9.699 | 6.462 | 66.6% | 35.4% | 0.7% | −2.7% |
| 2020 | 10.706 | 10.344 | 5.767 | 55.8% | 35.9% | 0.6% | 7.8% |
| 2021 | 11.739 | 11.113 | 11.561 | 104.0% | 37.3% | 0.5% | −41.8% |
| 2022 | 13.362 | 12.367 | 7.003 | 56.6% | 34.3% | 0.4% | 8.7% |
| 2023 | 15.952 | 14.577 | 10.390 | 71.3% | 33.6% | 0.3% | −5.1% |
| 2024 | 18.951 | 17.451 | 11.257 | 64.5% | 33.4% | 0.3% | 1.7% |
| 2025 | 20.013 | 19.588 | 8.936 | 45.6% | 30.8% | 0.4% | 23.2% |
Calculated as 100% minus TDI’s published combined ratio. It is not profit after reinsurance, investment income or income tax. Dollar amounts use Page 14; displayed ratios use the overview. Rounded components can differ by 0.1 point. Sources: S1, “Annual loss and combined ratios”; S2, annual homeowners Grand Total rows.
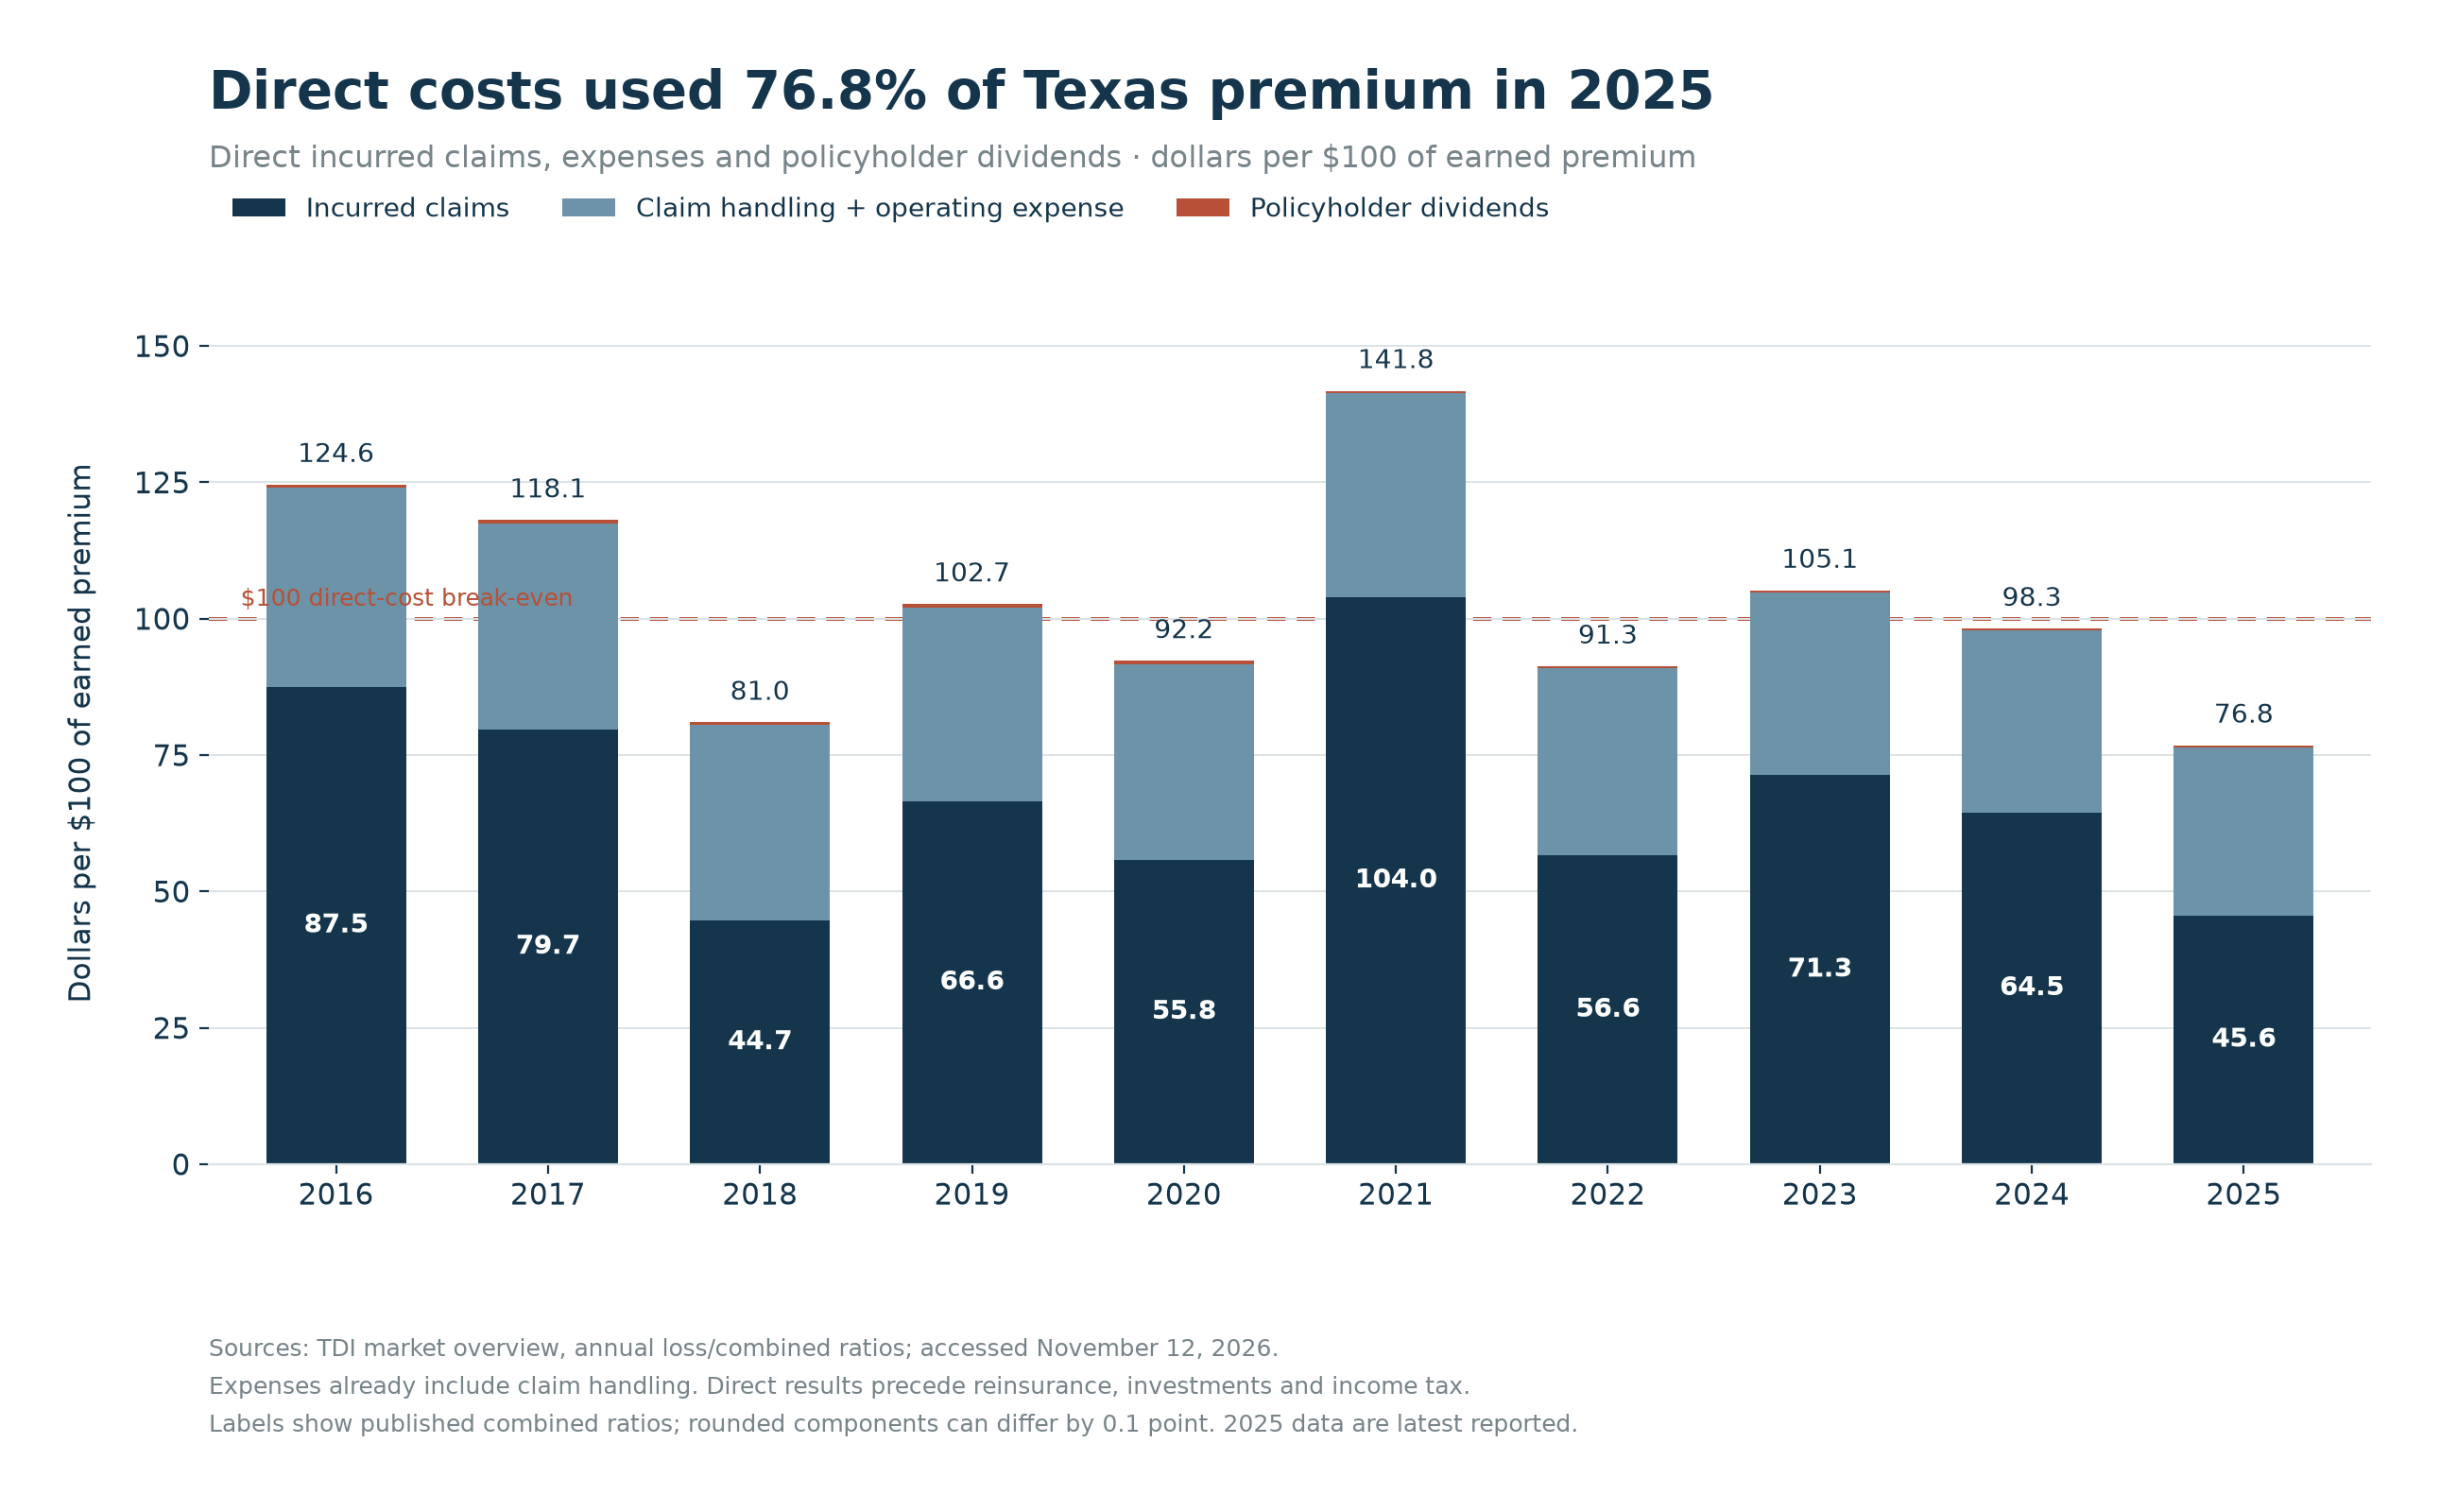
Premium growth explains part of the improvement mechanically: 2025 earned premium increased while incurred losses fell. This does not identify how much came from better weather, rate increases, insured-value growth, policy changes, portfolio selection or reserve development. Those drivers require additional controls.
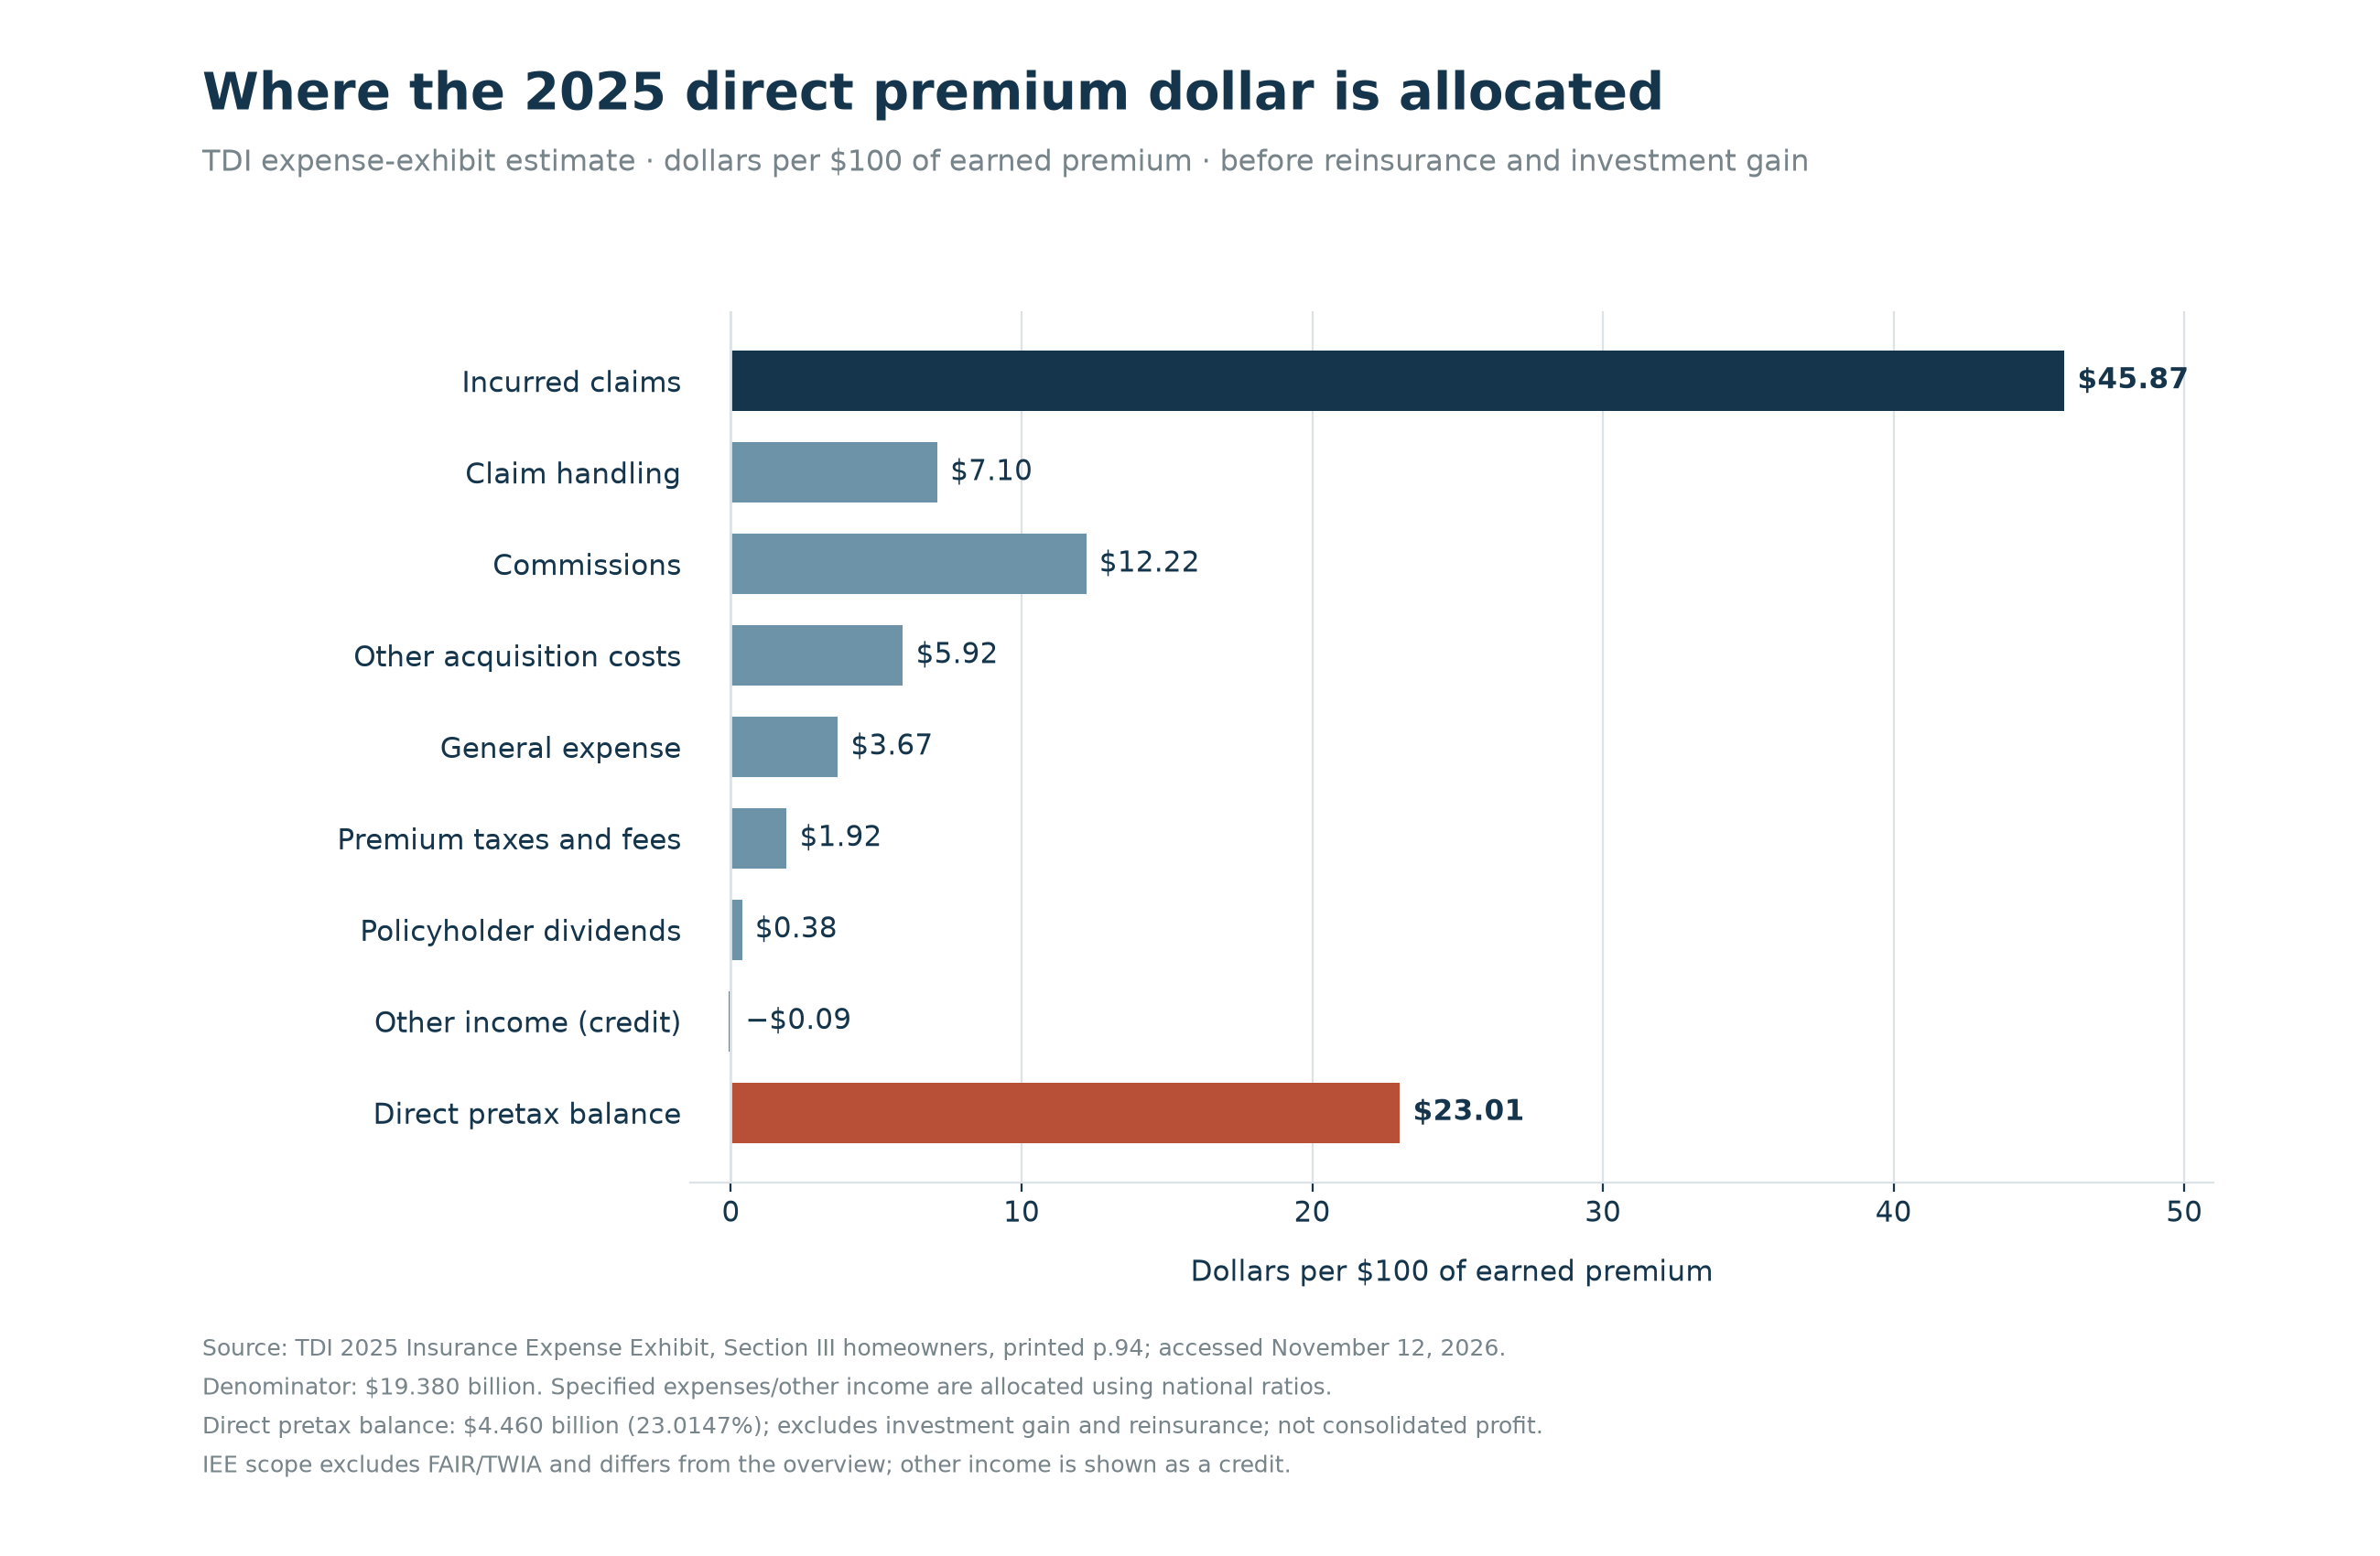
The expense exhibit supplies a more detailed 2025 allocation. On its own $19.380 billion earned-premium denominator, claims consume 45.87%; defense/cost containment 1.29%; other adjusting expense 5.81%; commissions 12.22%; premium taxes, licenses and fees 1.92%; other acquisition costs 5.92%; general expense 3.67%; and dividends 0.38%. Other income contributes approximately 0.09%. The resulting $4.460 billion direct pretax balance is 23.0147%. Several expense lines are allocated using nationwide ratios, as the exhibit’s double-asterisk footnote explains. [S3, 2025 p.94, lines 2–17]
That exhibit excludes government organizations including TWIA and FAIR, farm mutuals and risk-retention groups. Its earned premium is $207.824 million below Page 14; FAIR explains $207.031 million, leaving $0.793 million unreconciled. It would be wrong to force the two universes into an exact tie.
The same exhibit reports direct pretax margins of −41.83%, +8.61%, −5.33%, +1.85% and +23.01% for 2021–2025. Weighting those results by earned premium gives +0.59%. This is evidence of recovery from substantial losses, alongside evidence that 2025 was unusually favorable. The detailed expense-exhibit reconstruction covers 2021–2025; 2016–2020 have the overview’s aggregate expense ratios, but no reconstructed full component split in this package. 3
3. Which major insurers collected the premium and paid the claims?
The next table starts with TDI’s fifteen leading 2025 groups. Official shares come from its market-conditions report. Premiums and loss ratios come from cohorts reconstructed from statutory entity data.
| Leading group | Official 2025 share | Cohort written premium 2025, $m | Cohort earned premium 2025, $m | Incurred claims 2025, $m | 2025 loss ratio | Historical weighted loss ratio |
|---|---|---|---|---|---|---|
| State Farm | 19.10% | 4,009.7 | 3,899.3 | 2,220.4 | 56.9% | 58.2% |
| Allstate | 16.79% | 3,315.7 | 3,156.9 | 1,517.8 | 48.1% | 62.4% |
| USAA | 11.22% | 2,216.6 | 2,135.4 | 1,296.1 | 60.7% | 80.9% |
| Farmers | 8.15% | 1,609.1 | 1,436.5 | 614.4 | 42.8% | 65.6% |
| Liberty Mutual | 6.05% | 1,195.2 | 1,294.8 | 388.1 | 30.0% | 67.6% |
| Travelers | 5.15% | 1,017.1 | 1,092.7 | 473.8 | 43.4% | 66.8% |
| American Family | 3.98% | 786.8 | 732.0 | 281.8 | 38.5% | 53.9% |
| Texas Farm Bureau | 2.44% | 481.3 | 472.3 | 296.0 | 62.7% | 79.4% |
| Progressive | 2.39% | 471.8 | 480.4 | 159.2 | 33.1% | 56.9% |
| Iron Family | 2.38% | 478.0 | 450.2 | 81.5 | 18.1% | 35.5%† |
| Chubb | 1.97% | 389.6 | 381.9 | 95.9 | 25.1% | 84.8% |
| Auto Club Enterprises | 1.96% | 385.1 | 357.6 | 239.8 | 67.1% | 69.3% |
| Nationwide | 1.36% | 267.6 | 300.6 | 134.8 | 44.8% | 82.4% |
| Porch | 1.31% | 258.7 | 281.3 | 63.7 | 22.6% | 53.4% |
| Texas FAIR Plan | 1.11% | 220.0 | 207.0 | 46.1 | 22.3% | 37.5% |
Direct homeowners multiple peril, before reinsurance. Historical period 2016–2025; †Iron has observations only in 2021–2025. Source: S2 statutory worksheets, S4 p.33 and membership crosswalk S6. The full annual written/earned/paid/incurred panel is in the workbook and CSVs.
These are fixed entity cohorts, using June 2026 NAIC membership with the stated 2025 Iron Family override. They are not the fifteen largest groups in every historical year, nor the historical results of each parent as then owned. National General joined Allstate in January 2021; MetLife’s property business entered Farmers in April 2021; Ameriprise Auto & Home joined American Family in October 2019; Porch acquired HOA in April 2021. A cohort’s earlier claims can therefore predate its current owner. [S6, S9]
A material source conflict remains visible. Page 14 shows State Farm Lloyds’ 2025 written premium of $4.010 billion, while the market-conditions group table shows $3.771 billion, a $238.596 million difference. The Iron cohort differs by $7.392 million. Eight selected groups match exactly; smaller differences remain elsewhere. The official shares total 85.36%; the reconstructed cohorts represent 85.45% of their own statewide premium denominator. Neither series has been silently overwritten. [S2, S4]
The market report also prints company-reported underwriting results that TDI says it has not reconciled. For example, Chubb’s reported loss of $1.389 billion exceeds 3.5 times its $389.407 million written premium in the same table. The supplied raw file preserves this disclosure. Without a reconciliation to the same entity, line and period, it cannot close a reliable premium-dollar account or be used to back-solve expenses. [S4, pp.2, 33]
No uniform expense assumption has been imposed on these groups to manufacture profit rankings. Their Texas homeowners external reinsurance costs, full expenses and consolidated profits remain missing where no matching disclosure was obtained. Geographic concentration, coverage mix, growth and reserve development can all change a direct loss ratio.
4. Following the money beyond the Texas entity
Farmers: the fee recipient and the risk bearer differ
Farmers Insurance Exchange’s 2025 statement reports $2.026 billion of management fees to affiliates. Its pooling note says companies first cede business, net of nonaffiliate reinsurance, to FIE; FIE makes quota-share cessions and redistributes the remaining business. Texas Farmers receives a 1% participation share. Foremost Lloyds of Texas and Farmers Lloyds of Texas cede business but do not participate in that pool. The 1% applies to the national pool. The filing leaves the Texas homeowners premium allocation unknown. [S7, p.11 footnote(a), Note 26 pp.14.54–14.55]
Zurich owns Farmers’ attorneys-in-fact; it does not own the policyholder-owned Exchanges. Its 2025 management-services table reports $3.671 billion of management fees on $28.9 billion Exchange gross earned premium, a calculated 12.7%. After the relevant costs and adjustments, gross management result is $2.020 billion, or 7% of Exchange premium. The agreement caps that margin at 7%. Zurich’s results cover the nationwide Farmers Exchanges. FIE’s statement covers that one legal entity. Zurich financial statements, Note 25(b)
Zurich also bears reinsured risk. Its 2025 Farmers Re service result was $204 million on $1.238 billion insurance revenue. Internal retrocessions within Zurich must eliminate before consolidated risk-transfer economics are measured. The disclosures give nationwide results. [S8, Note 25(a), p.109]
Other groups: how Lloyds entities participate in pooling
Liberty’s 2025 statutory notes assign zero pool participation to Liberty Lloyds of Texas and Safeco Lloyds. Six other entities receive the remaining pooled result after the lead handles external reinsurance. Travelers discloses that both its Lloyds insurers are 100% reinsured by pool participants. A Texas entity can consequently report little net underwriting exposure while the group still bears the risk elsewhere. [S10–S11]
Allstate Insurance Company’s Schedule F reports $250.317 million premium assumed from Allstate Texas Lloyds. This documents a payment within the group. An independent counterpart statement, Cincinnati Insurance’s Schedule F, records $1.571 million assumed from State Farm Lloyds and $11.900 million from USAA Casualty. Those are individual counterpart amounts; total ceded premium and Texas homeowners allocation remain unknown. Full current State Farm Lloyds and USAA affiliate/reinsurance allocations were not obtained. [S12–S13]
State Farm’s disclosure as of March 31, 2026, filed April 30, also identifies State Farm Lloyds, Inc., a wholly owned attorney-in-fact. The insurer under its management control is State Farm Lloyds. It supplies no current management-fee amount. 43
Porch’s reciprocal illustrates the consolidation rules. Its member-owned reciprocal is consolidated as a variable-interest entity, with Porch owning the manager and subscribers owning the exchange. Its $239.6 million of 2025 intersegment insurance-services revenue includes fees, commissions and reinsurance premium; it is not entirely management fees. Consolidated net income of $15.318 million comprises $18.679 million attributable to the reciprocal and a $3.361 million loss attributable to Porch. The group includes noninsurance businesses. [S14, Notes 2–3]
Consolidated insurance results
Allstate’s national homeowners combined ratio improved from 106.8% in 2023 to 90.1% in 2024 and 84.4% in 2025; underwriting results were −$803 million, +$1.319 billion and +$2.393 billion. Its category excludes renters, condominium and landlord coverage assigned elsewhere. State Farm’s broader national “Homeowners, CMP, Other” category reported a $3.1 billion underwriting loss in 2025. These disclosures rebut any assumption that every major group earned the same margin, but cannot be apportioned to Texas simply by multiplying by market share. [S15–S16]
5. What the rate filings disclose
A rate indication estimates the change needed under selected future loss, expense, reinsurance and capital assumptions. A filed change is the insurer’s selected action. Portfolio strategy, credibility, transition limits and regulatory review can cause the two to differ.
TDI’s filing guide requires support for indicated and selected rates. Its profit methodology considers total return, including investment income; an unsupported conventional 5% underwriting-profit loading is unacceptable. Texas is file-and-use: rates may take effect while review is pending. “Reviewed” therefore should not automatically be rewritten as “prior-approved.” [S17, pp.21, 49–50, 55; S18]
The public register extract contains 5,462 homeowners-category records, including 258 received during 2026. The latest received date is November 6, 2026. These selected examples demonstrate current direction:
| Group; selected writing entity | SERFF tracking ID | Filed change | Renewal effective | Register status |
|---|---|---|---|---|
| State Farm Lloyds | SFMA-135023749 | +4.0% | 2026-11-01 | Pending |
| Allstate Vehicle and Property | ALSE-134802108 | +8.0% | 2026-03-12 | Reviewed |
| United Services Automobile Association | USAA-134863482 | +7.2% | 2026-07-15 | Reviewed |
| Texas Farmers | FARM-134961095 | +6.2% | 2026-06-28 | Reviewed |
| Liberty Mutual Personal | LBPM-134968726 | +1.8% | 2026-08-30 | Reviewed |
| Travelers Lloyds of Texas, Legacy | TRVD-G134788404 | −5.0% | 2026-02-28 | Reviewed |
| Homesite, American Family group | HMSS-134351232 | +12.0% | 2025-03-18 | Reviewed |
| Texas Farm Bureau Mutual | TXFB-135047715 | −5.2% | 2026-11-01 | Pending |
| ASI Lloyds, Progressive group | AMSI-134971146 | −6.0% | 2026-09-22 | Pending |
| SURE, Iron Family classification | SAGE-135040402 | −5.9% | 2026-10-01 | Pending |
Source S5, exact tracking-ID/entity rows, extract November 12, 2026. “Reviewed” abbreviates Closed/Reviewed. Each row covers a named program.
The Homesite observation is a 2025-effective filing; no nonzero 2026-received example was found. The register says 12.0%, while the regulator’s annual company-reported exhibit says 12.1%. Different entities within the same USAA filing range from 7.2% to 8.5%; each rate applies to its named legal entity.
Supporting-memo coverage is 0/10. The official public SERFF portal returned robot/JavaScript verification and then 403 responses in the available retrieval environment. The documents’ individual confidentiality status remains unknown. The supporting memos could not be retrieved. The output therefore leaves indications, catastrophe annual-average loss, ceded premium/recoveries, expense provisions, profit/ROE selections and final actuarial revisions unknown. 19
Two filings show other ways terms can change. American Summit’s regulator-reproduced example shows +21.3% indicated versus +20.0% selected, but it is outside the requested top ten and its supporting memo was not retrieved. Foremost’s particular filing introduces a mandatory 2% wind/hail deductible with 0% stated rate impact. State Farm’s +19.1% entry applies to mobile homeowners coverage. Product classification and contract terms can matter as much as the headline percentage. [S4, pp.65, 74, 76; S5]
6. Last-resort insurance supplies the clearest complete bridges
TWIA and Texas FAIR Plan serve different purposes under Texas law. TWIA covers eligible coastal wind and hail; FAIR offers residual property coverage. TWIA is not a complete homeowners policy, and neither mechanism is simply an unlimited general-revenue guarantee.
Statutory results for 2024 and 2025
Using their complete statutory statements, the following calculations start with gross claims and deduct the net reinsurance effect, including recoveries and ceding commissions exactly once:
| Whole legal entity and year | Direct earned premium, $m | Direct claims, $m | Direct LAE, $m | Gross other expense, $m | Net reinsurance effect, $m | Statutory fund expense, $m | Underwriting result, $m |
|---|---|---|---|---|---|---|---|
| TWIA 2024 | 708.981 | 518.487 | 115.927 | 172.207 | 386.098 | 0 | −483.737 |
| TWIA 2025 | 794.595 | 181.057 | 65.133 | 170.909 | 422.253 | 39.080 | −83.837 |
| FAIR 2024 | 169.126 | 155.614 | 28.292 | 49.395 | −1.411 | 0 | −62.764 |
| FAIR 2025 | 279.388 | 61.978 | 19.995 | 50.200 | 83.956 | 0 | 63.260 |
Calculated from reported statutory inputs; each row reconciles to reported underwriting result. FAIR combines homeowners, fire, allied lines and other forms. It therefore exceeds the homeowners-only FAIR row in the leading-group table. Sources S20–S23, income p.4, premium p.8, expenses p.11 and state exhibits.
FAIR’s negative 2024 net reinsurance effect is a benefit: incurred recoveries and commissions exceeded earned ceded premium. It is exactly the result that a chart treating reinsurance as an invariably positive percentage would miss.
TWIA’s 2025 underwriting loss coexists with $401.755 million net income because its statement records $462.728 million statutory fund income outside underwriting. FAIR’s $127.261 million net income similarly includes $60.144 million member-assessment income. Neither transfer is profit generated by that year’s premiums. TWIA’s note also puts Beryl ultimate loss and LAE at $545 million, $65 million above the previous estimate; its fund calculations and admitted surplus do not encompass identical resources. [S20, Note 13 p.14.7; S22]
Prospective reinsurance is a different measure
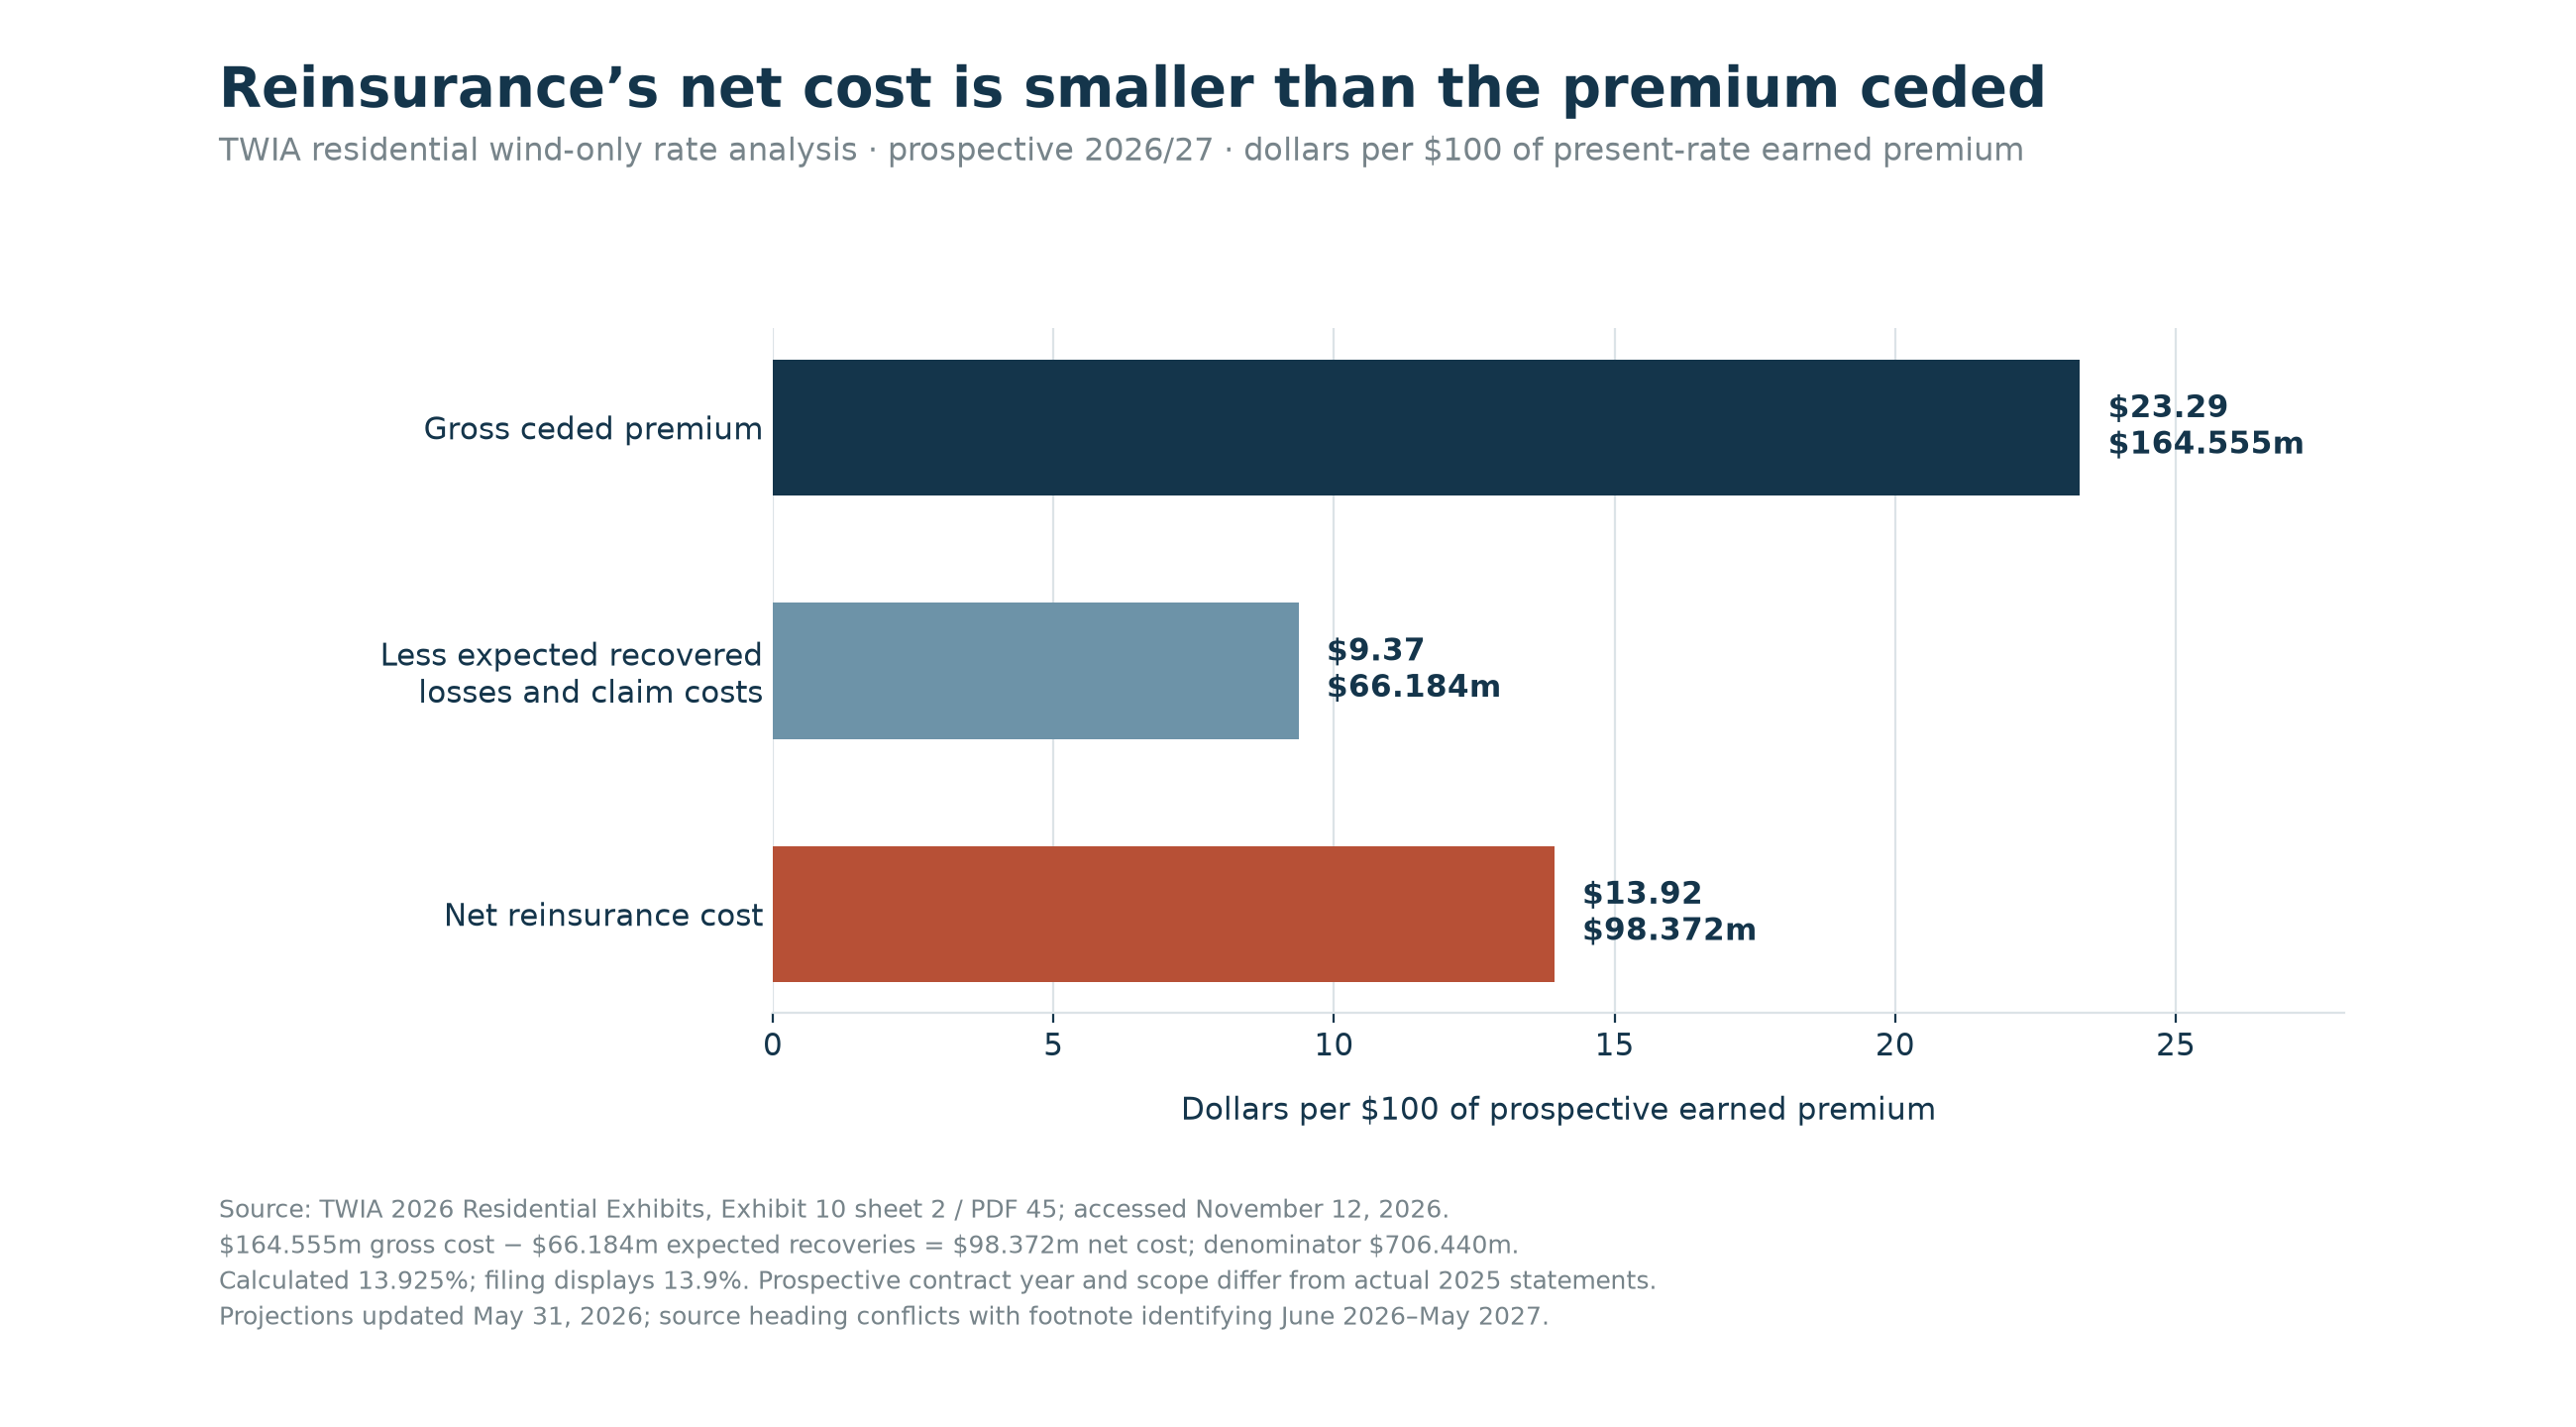
TWIA’s 2025 earned ceded premium is $432.106 million, before ceding commission. Its 2026 residential wind and hail pricing analysis estimates prospective adjusted gross reinsurance cost of $164.555 million, expected loss/LAE recoveries of $66.184 million, and net cost of $98.372 million. Against $706.440 million prospective present-rate earned premium, that is 13.925%, displayed as 13.9%. Scope, contract year and funding requirements differ from the whole-entity 2025 bridge. [S24, Exhibit 10]
The selected 2026 residential indication is −9%; the board filed 0% for 2027. Its public model allows a meaningful low/base/high comparison:
| Hurricane loss/LAE assumption | Hurricane provision | Reported indication |
|---|---|---|
| Cotality model | 37.3% | −14% |
| Selected model/experience blend | 41.2% | −9% |
| Verisk model | 52.1% | +4% |
Other selected inputs include 11.1% non-hurricane loss/LAE, 19.3% fixed expenses including reinsurance, 16% commission and 5% contingency. The contingency supports uncertainty and the catastrophe reserve fund; it is not a shareholder distribution. This model range is not a confidence interval. The reinsurance exhibit’s heading and contract-year footnote conflict; the footnote identifies June 2026–May 2027. [S24–S25]
Counts, funding and who can be assessed
TWIA ended 2025 with 284,846 policies and $126.456 billion direct insured liability; September 2026 counts reached 288,815 and $128.644 billion. FAIR grew from 72,626 policies in 2023 to 127,835 in 2025, then stood at 112,450 in September 2026, below 129,526 a year earlier. Movement alone does not reveal whether households secured better voluntary coverage, dropped coverage or left the insured population. 26
Effective September 1, 2025, the minimum modeled TWIA funding requirement changed from a 100-year to a 50-year return period. Its announced 2026/27 target is $4.3 billion, including $2.2801 billion of reinsurance coverage. Coverage limit is not premium cost. Funding can include reserves/CRTF, up to $1 billion state financing and up to $1 billion member assessments. State financing is repayable through statewide property-policy catastrophe surcharges, potentially reaching policyholders outside the coast; liquidity credit lines must not be added again when they bridge the same ultimate resources. [S27–S28]
FAIR’s 2026/27 first-event protection provides $700 million reinsurance above a $100 million retention, or $800 million in total. Its second-event tower provides $780 million above $20 million, subject to remaining catastrophe-bond protection. Those layers describe how much coverage is available and where it attaches. [S29, pp.16–17]
Current law prohibits recouping TWIA member assessments through a surcharge or tax credit. FAIR assessments follow a different rule. Its $17.655 million 2023-deficit assessment and $60.144 million 2024-deficit assessment have recoupment windows ending March 2028 and December 2028 respectively. An insurer choosing FAIR recoupment must surcharge all its Texas property policies across property lines. These assessment rules cannot be collapsed into one generic “Texas insurance tax.” [S28–S29]
7. Storm damage and the risk households bear
Storm-cost headlines describe different universes. NOAA’s Beryl estimate is $7.2 billion of US economic damage, in 2024 dollars. Aon reports $7.7 billion economic and $3.7 billion insured loss across the United States, Caribbean and Canada. Neither is a Texas homeowners claim total. Subtracting one from the other would not measure Texas’s uninsured gap. NOAA retired its billion-dollar-disaster product in May 2025; the archive ends in 2024. [S30–S32]
TDI’s final Uri survey is closer to the insurance question: it reports $11.5 billion ultimate insured losses and $3.5 billion expected reinsurance across reported lines, valued June 30, 2022. Residential RCV/ACV incurred losses excluding IBNR sum to $4.692 billion. The survey includes homeowners, tenants, condominium and dwelling coverage; it is not identical to one statutory homeowners calendar-year total. [S33, pp.2–3, 14]
A declining insured loss ratio also need not mean declining physical damage. Deductibles and roof valuation determine how much loss enters the insurer’s accounts. TDI explains that percentage deductibles apply to the dwelling’s insured amount; actual cash value deducts depreciation. Some replacement-cost policies still cover roofs on ACV terms. No reliable statewide or insurer-by-ZIP trend in those changes was recovered. [S34–S35]
Consider a hypothetical roof claim. A $400,000 dwelling with a 2% deductible leaves the household responsible for $8,000 before the insurer pays. For a covered $20,000 roof loss:
| Hypothetical settlement | Insurer payment | Household cost |
|---|---|---|
| Replacement cost, 2% deductible | $12,000 | $8,000 |
| 50% depreciation, ACV, 2% deductible | $2,000 | $18,000 |
| Replacement cost, 5% deductible | $0 | $20,000 |
The simplified calculation assumes the same covered loss and no additional limits. At an unchanged 2%, increasing insured value to $450,000 raises the dollar deductible to $9,000. A lower premium for a contract transferring less risk is not necessarily an improvement in the household’s insurance position. The observed data cannot isolate how much of the 2025 loss improvement came from weather versus risk borne by households or changing books.
8. Florida, Oklahoma and Colorado: matched comparisons
The latest verified same-definition NAIC premium comparison is 2023, published in 2026. The same-value column materially changes the ranking:
| State | All-value HO-3 average premium, 2023 | HO-3 premium at $400,000–$449,999 coverage | Direct underwriting result, 2024 |
|---|---|---|---|
| Texas | $2,864 | $2,943 | +2.9% |
| Florida | $2,779 | $2,421 | +12.8% |
| Oklahoma | $2,486 | $3,147 | −9.2% |
| Colorado | $2,492 | $2,321 | −1.1% |
Sources S36, Table 4, state pages; S37, homeowners multiple peril state rows. Premium and profitability periods differ intentionally.
Matching form and dwelling value improves the comparison but leaves deductibles, roofs, precise geography, insurers and coverage details uncontrolled. These averages are not current shopping quotes and cannot identify the causal effect of a state’s regulation.
NAIC’s profitability methodology allocates expenses, investment income, taxes and capital; it is not observed consolidated state net income. Its 2015–2024 arithmetic-average underwriting results are Texas −4.1%, Florida −8.5%, Colorado −18.2% and Oklahoma +6.9%. Those figures cannot be compared directly with this report’s premium-weighted 2016–2025 Texas result. Different windows and weighting can reverse the apparent lesson. 37
9. Travis County: nominal premiums, insured values and ZIP evidence
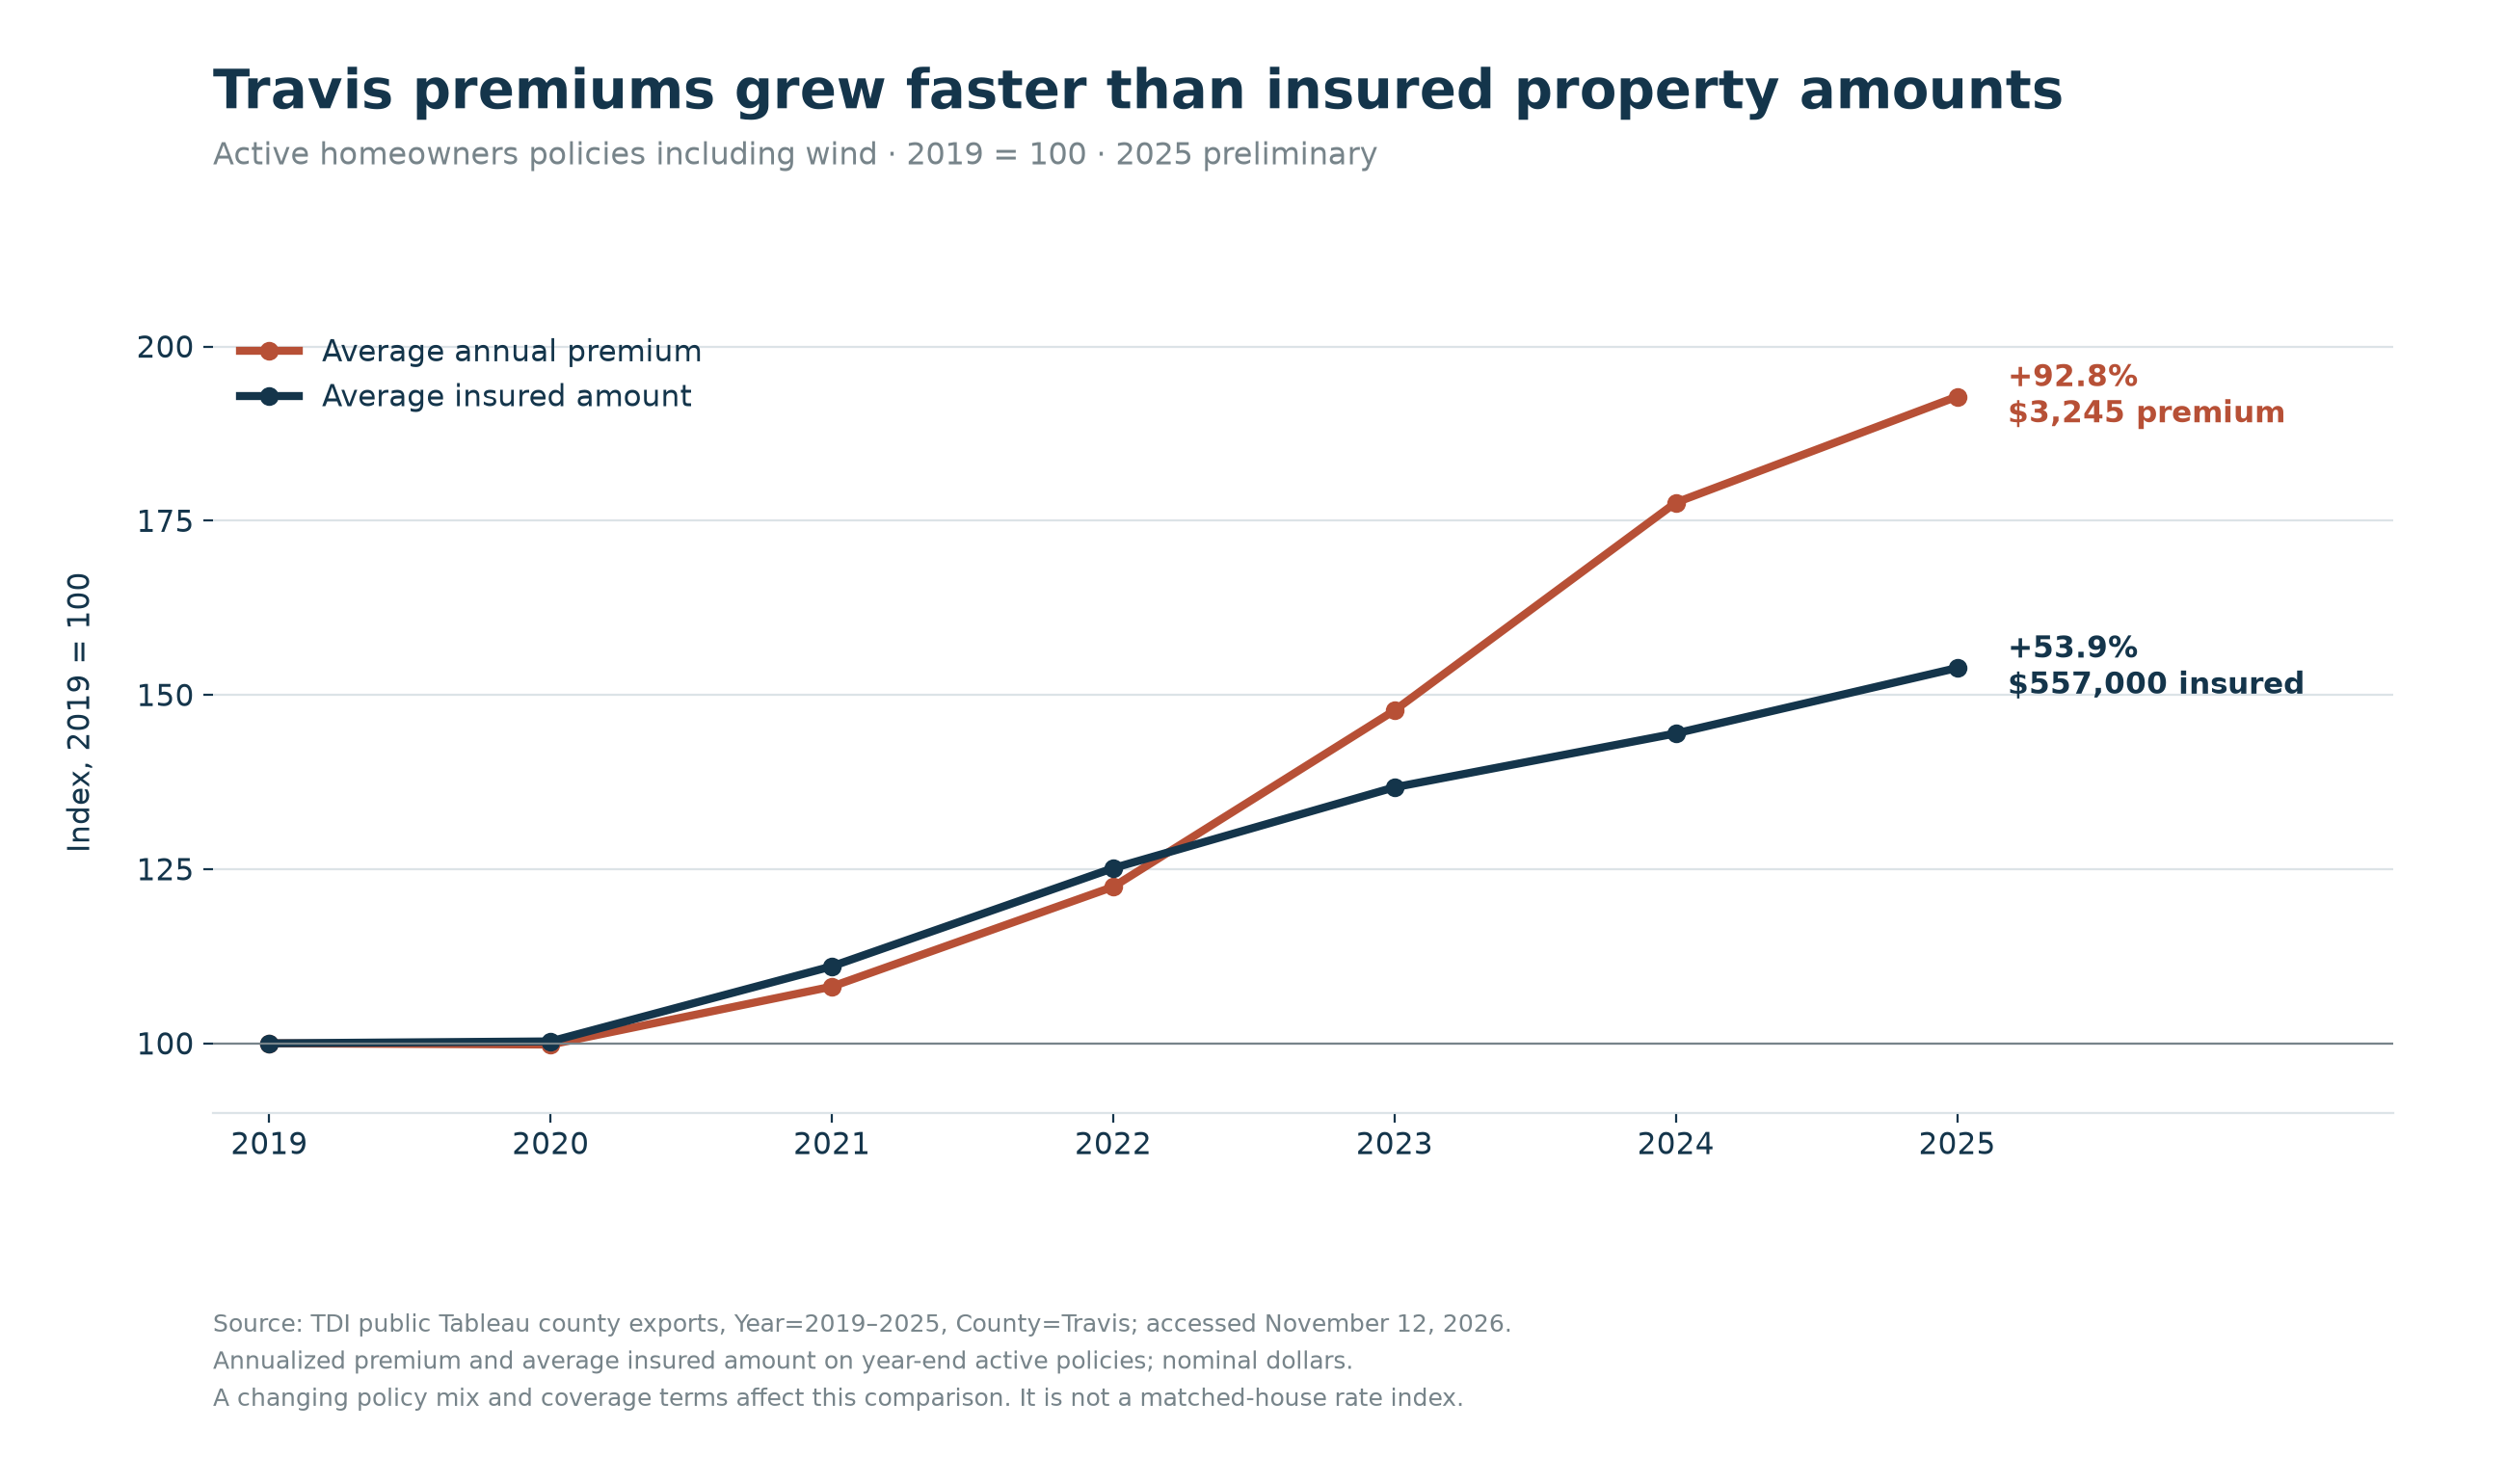
TDI’s Travis County premium map shows a 92.8% increase in average annual premium including wind between 2019 and 2025, from $1,683 to $3,245. Average insured property value increased 53.9%, from $362,000 to $557,000. Premium per $1,000 of average coverage therefore increased a calculated 25.3%. The ratio reflects changes in the portfolio as well as premiums and coverage amounts. 38
| Year | Average premium | Average insured amount | Policies including wind |
|---|---|---|---|
| 2019 | $1,683 | $362,000 | 244,435 |
| 2020 | $1,680 | $363,000 | 256,041 |
| 2021 | $1,820 | $402,000 | 267,216 |
| 2022 | $2,061 | $453,000 | 273,762 |
| 2023 | $2,487 | $495,000 | 275,692 |
| 2024 | $2,989 | $523,000 | 274,890 |
| 2025 | $3,245 | $557,000 | 272,866 |
Source S38, County=Travis, Year filters; 2025 preliminary.
The county loss file reports $404.912 million paid in Travis during 2025, against $670.823 million in 2021. The file measures paid claims and uses different policy counts from the premium map. Incurred losses also reflect reserves for unpaid claims. Multiplying one dataset’s premium by another’s policies would manufacture a county loss ratio. Its statewide 2025 paid-loss sum also differs materially from the overview’s displayed peril chart; the precise valuation-vintage explanation remains unresolved. 39
The retrieved FIO ZIP-year premium evidence stops at 2022. Treasury data match 61 ZIPs whose Census ZCTAs intersect Travis, yielding 305 ZIP-year observations. No matched records exist for 78712 or 78742. Some ZIPs cross county borders, so their full observations are not Travis-only. Selected ZIPs whose 2020 ZCTAs have all land area within Travis show substantial variation:
| ZIP | 2018 premium per policy | 2022 premium per policy | Calculated change |
|---|---|---|---|
| 78724 | $1,347.03 | $1,312.90 | −2.53% |
| 78702 | $1,589.46 | $1,694.06 | +6.58% |
| 78745 | $1,608.21 | $1,733.06 | +7.76% |
| 78704 | $1,964.19 | $2,351.64 | +19.73% |
| 78746 | $3,678.28 | $4,712.43 | +28.12% |
Source S40, original workbook row/cell tags in CSV; geography S42. Values use Treasury’s inflation-adjusted dollars.
Treasury’s sample covers participating insurers’ owner-occupied HO-3/HO-5 policies, excluding residual markets and several other lines. Public data lack policy weights; averaging ZIP values would not produce a policy-weighted county premium. The workbook’s precise constant-dollar base year is not stated, so no second inflation adjustment was applied. [S40–S41]
Most consequentially, literal zeroes in Texas nonrenewal/cancellation fields are unavailable-data placeholders. Treasury says Texas insurers did not supply those measures. The normalized export marks them unavailable; it does not report zero cancellations. There is no verified 2023–2026 ZIP premium, deductible or nonrenewal trend in this release. [S41, pp.13, 61]
10. Low, base and high cases: what drives the answer?
The workbook tests how three historical loss ratios and an assumed reinsurance cost affect the balance. It holds the current overview expense ratio at 30.8% and dividends at 0.4%, substitutes three observed historical claims ratios, and applies an illustrative 5% net reinsurance effect.
| Scenario | Claims ratio | Expense + dividends | Assumed net reinsurance effect | Remaining underwriting balance |
|---|---|---|---|---|
| Low claims: 2025 experience | 45.6228% | 31.2% | 5.0% | +18.18% |
| Base reference: 2016–2025 weighted | 65.6717% | 31.2% | 5.0% | −1.87% |
| High claims: 2021 experience | 104.0310% | 31.2% | 5.0% | −40.23% |
Each stress case applies an observed historical claims ratio to the same current expense assumptions. In particular, 5% is not estimated Texas industry spending. The net cost of risk transfer can be negative in a catastrophe year, as FAIR demonstrates. The exercise also does not on-level historical premiums, trend claims or hold the exposure portfolio constant.
The decisive sensitivity is straightforward: an additional percentage point of claims, expense or positive net reinsurance cost reduces the residual by one point. At the base historical claims ratio, assumed reinsurance effects of 0%, 5% and 10% yield balances of +3.13%, −1.87% and −6.87%. With the selected expenses and 5% assumption, the break-even claims ratio is 63.8%.
This shows why a large 2025 direct balance and a thin longer-run margin can coexist. An insurer’s rate would require its own exposure and cost assumptions. A credible forward indication must update exposure, losses, catastrophe models, treaty terms and capital requirements; TWIA’s public model demonstrates how materially those selections can differ.
11. Verification, unresolved gaps and evidence that would change the result
Three headline findings received independent calculation checks:
- Claims over the cycle: a second read of the original binary worksheets recovered $79,422,375,943 incurred losses and $120,938,522,416 earned premium, reproducing 65.6717% and TDI’s rounded 65.7%. The 2025 calculation independently gives 45.6228%, matching 45.6%. TDI’s ten-year combined ratio is 100.6%. [S1–S2]
- 2025 direct pretax margin: the expense exhibit’s line identity reconstructs $4,460,229,983 exactly; divided by its $19,379,921,496 earned premium it produces 23.0147%. The overview reports a 23.2% balance across its own population. [S1, S3]
- Net reinsurance differs from gross premium: TWIA’s prospective residential inputs independently subtract to $98,371,548; dividing by $706,440,159 gives 13.925%, reproducing the memo’s 13.9%. The statutory calculations reconcile to reported underwriting results, including FAIR’s negative 2024 net reinsurance effect. [S20–S24]
The checks compare calculations and publications that draw on the same statutory filings.
The most valuable missing evidence is precise. The top ten actuarial memos would show modeled catastrophe costs, credibility, selected versus indicated rates, expense allocations and profit assumptions. Matching Schedule F/Y and affiliate notes for every writing entity would identify external versus internal cessions and service payments. Treaty-level recoveries and commissions, allocated to the same Texas homeowners exposure and period, would permit a defensible net-reinsurance waterfall.
Revised reserves could alter the apparent 2025 improvement. A lower prospective catastrophe provision could support lower rates even after a recent loss year; a higher one could weaken the favorable interpretation of 2025. Contract-level deductible and roof data could reveal that households bore more risk while insurer loss ratios improved. Historical ownership reconstruction could change group comparisons around acquisitions. A resolved State Farm source discrepancy would change its premium share and cohort reconciliation.
Sources and audit trail
Access date for every source: November 12, 2026. Page numbers are printed pages unless PDF pages or worksheet tags are specified. The accompanying raw files preserve more granular cell/row references, scopes and unresolved differences.
S1. TDI, Texas homeowners market overview, “Annual loss and combined ratios,” premium/coverage/rate charts; 2016–2025, preliminary 2025 averages.
S2. TDI Page 14 statutory data, annual ZIPs: 2016, 2017, 2018, 2019, 2020, 2021, 2022, 2023, 2024, 2025; member 04-Homeowners.xls, insurer rows and Grand Total.
S3. TDI Insurance Expense Exhibits: 2021, p.84; 2022, 2023, 2024, 2025, p.94; Section III homeowners, lines 1–17; introduction and allocation footnotes.
S4. TDI 2025 Market Conditions Annual Report, March 2026; p.2 unreconciled company exhibit warning, p.33 shares, pp.62–76 filing descriptions.
S5. TDI public home/auto filing register, exact entity/tracking rows; extract through November 6, 2026. October 8 confirmation of selected reductions.
S6. NAIC company/group listing, June 24, 2026; insurer-code joins. Iron override: S4 pp.69–70. Novel/Forza ownership disclosure, June 22, 2026 release; AIF ownership covers the manager’s equity.
S7. Farmers Insurance Exchange 2025 statutory statement, p.11(a), Notes 10/26, Schedule Y.
S8. Zurich 2025 consolidated financial statements, Note 25, pp.109–110, Tables 25.1–25.2; 2025/2024.
S9. Acquisition records: Allstate 8-K, January 4, 2021, Item 2.01; Ameriprise sale, October 1, 2019; Porch Note 12, HOA acquisition April 5, 2021; Farmers S7 Notes 3/10.
S10. Liberty Mutual Insurance Company 2025 statement, Note 26, pp.14.40–14.41.
S11. Travelers 2025 10-K, p.16 footnote(b).
S12. Allstate Insurance Company 2025 statement, Schedule F Part 1 p.20/PDF139, column 5; Schedule Y p.99/PDF278.
S13. Cincinnati Insurance 2025 statement, Schedule F Part 1, column 5, pp.20.1/20.5, PDF49/53.
S14. Porch 2025 10-K, Note 2 p.96 footnote 1, Note 3 pp.99–100, income statement. September 2026 10-Q, Note 3.
S15. Allstate 2025 10-K, homeowners tables pp.39–42; 2023–2025.
S16. State Farm 2025 results, February 26, 2026; “Homeowners, CMP, Other.”
S17. TDI Filings Made Easy, May 2025, pp.20–22, 49–50, 55.
S18. TDI rate-review report, updated February 3, 2026; file-and-use explanation.
S19. TDI public SERFF access guidance, updated July 2, 2026; official portal, retrieval limitation described above.
S20–S21. TWIA 2025 and 2024 statements; pp.4, 8, 11, state exhibits PDF47/49; 2025 Note 13 p.14.7.
S22–S23. FAIR 2025 and 2024 statements; pp.4, 8, 11, state exhibits PDF46/48 and45/47 respectively.
S24. TWIA 2026 residential memorandum, June 30, pp.4, 9–10; actuarial exhibits, Exhibits 1/10, PDF3/44–45; prospective 2026/27.
S25. TWIA August 4, 2026 board decision; TDI filing register, P-0826-01/S739762.
S26. Liability reports, p.1 totals: TWIA December 2025, September 2026; FAIR December 2024 with 2023 comparison, December 2025, September 2026 with 2025 comparison.
S27. TWIA 2026 annual report, pp.9–12, period June 2025–May 2026; May 19 funding announcement.
S28. Current Texas Insurance Code, Chapter 2210, §§2210.082–.083, .453, .632, .642; current November 2026.
S29. FAIR Q2 2026 Fact Book, pp.16–18; TDI Bulletin B-0015-25, October 9, 2025, assessment recoupment.
S30. NOAA 2024 disaster retrospective, January 10, 2025, Beryl.
S31. Aon 2024 catastrophe report release, January 22, 2025, Beryl geography/costs.
S32. NOAA product retirement notice, May 2025.
S33. TDI final Uri report, November 28, 2022, valuation June 30, pp.2–3, 14.
S34. TDI roof coverage guidance, updated April 1, 2026; deductible arithmetic, “Know the math.”
S35. OPIC ACV versus RCV, roof coverage comparison.
S36. NAIC 2023 Homeowners Insurance Report, July 2026, Table 4: Colorado p.43, Florida p.51, Oklahoma p.105, Texas p.119.
S37. NAIC Profitability by Line by State, 2024, July 2026: Colorado p.25, Florida p.29, Oklahoma p.56, Texas p.63; methods and 2015–2024 tables.
S38. TDI public county workbook, County view, Travis, 2019–2025; 2019 CSV export, 2025 CSV export; definitions in S1 “Map info.”
S39. TDI county loss data, Travis total paid-loss rows, 2019–2025; scope explanation, updated June 22, 2026.
S40. Treasury FIO public underlying metrics, January 2025; Supporting Underlying Metrics sheet, 2018–2022 ZIP rows; Disclaimer/Metric Definitions tabs.
S41. Treasury FIO homeowners market analysis, January 2025; pp.5–8, p.6 footnote 12, pp.13–14, 61, 66.
S42. Census 2020 ZCTA–county relationship file, GEOID_COUNTY_20=48453; 2020 geography.
S43. State Farm 2026 SEC control disclosure, filed April 30, Item 32; control as of March 31, 2026, State Farm Lloyds/State Farm Lloyds, Inc. rows.
- S3. TDI Insurance Expense Exhibits: 2021, p.84; 2022, 2023, 2024, 2025, p.94; Section III homeowners, lines 1–17; introduction and allocation footnotes. ↩
- S43. State Farm 2026 SEC control disclosure, filed April 30, Item 32; control as of March 31, 2026, State Farm Lloyds/State Farm Lloyds, Inc. rows. ↩
- S19. TDI public SERFF access guidance, updated July 2, 2026; official portal, retrieval limitation described above. ↩
- S26. Liability reports, p.1 totals: TWIA December 2025, September 2026; FAIR December 2024 with 2023 comparison, December 2025, September 2026 with 2025 comparison. ↩
- S37. NAIC Profitability by Line by State, 2024, July 2026: Colorado p.25, Florida p.29, Oklahoma p.56, Texas p.63; methods and 2015–2024 tables. ↩
- S38. TDI public county workbook, County view, Travis, 2019–2025; 2019 CSV export, 2025 CSV export; definitions in S1 “Map info.” ↩
- S39. TDI county loss data, Travis total paid-loss rows, 2019–2025; scope explanation, updated June 22, 2026. ↩
Supporting material
- Excel model ↗Sourced inputs, live calculations and reported outputs.
- Source and model data (CSV collection) ↗Data tables, source references and calculation exports.
- Source register ↗Download as CSV.
- Texas statutory state totals 2016 2025 ↗Download as CSV.