Texas public finance
Has UTIMCO earned its fees?
The Permanent University Fund beat a low-cost 70/30 portfolio over 20 years. Over 10 years, the result depends on the benchmark.
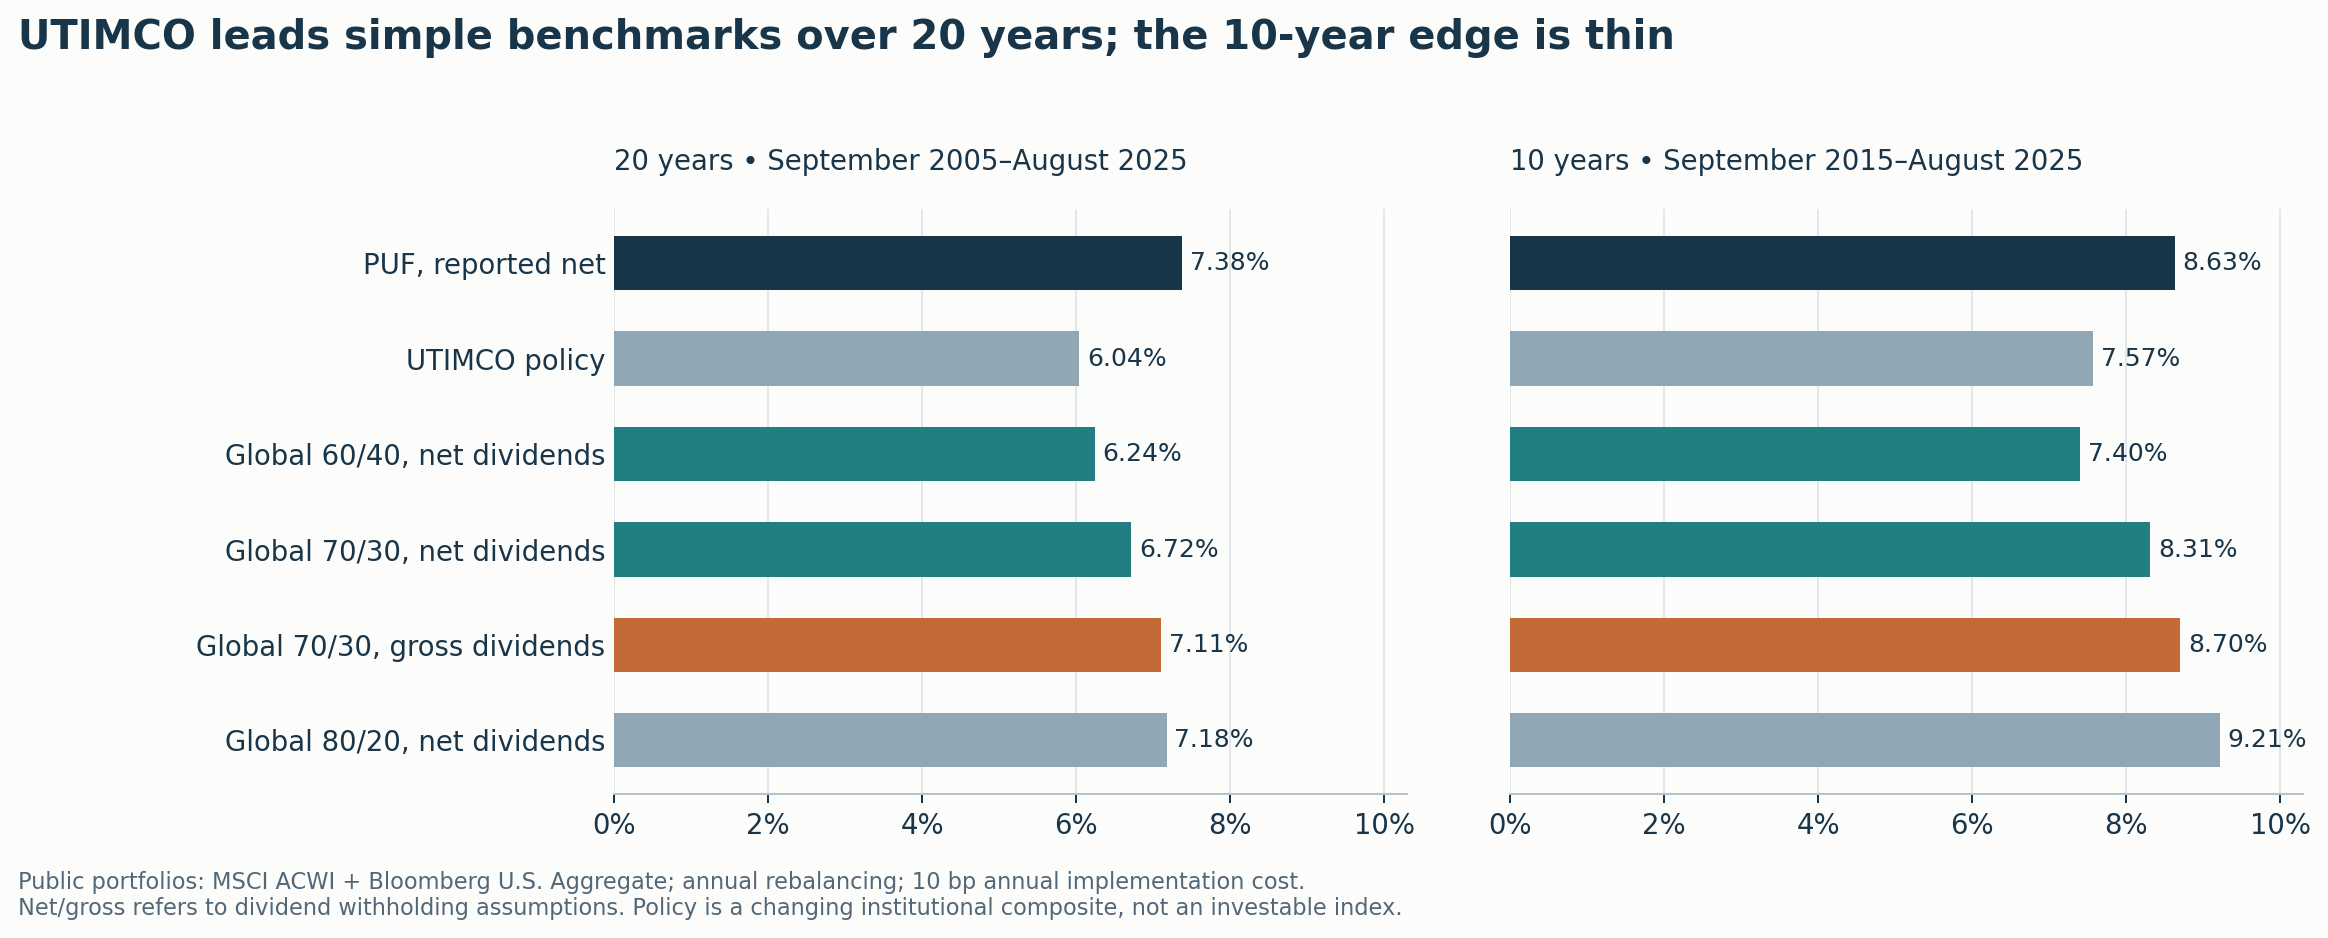
UTIMCO has a defensible twenty-year record of earning its investment costs relative to simple public portfolios. Its ten-year advantage over a low-cost portfolio depends on how the comparison treats economic risk. Both statements can be true.
For the twenty fiscal years ending August 31, 2025, the Permanent University Fund (PUF) returned 7.38% annually as reported net of investment fees, against 6.72% for a portfolio of 70% global equities and 30% U.S. investment-grade bonds after an assumed ten basis points of annual implementation costs. Over the latest ten audited fiscal years, PUF returned 8.63%, against 8.31%. UTIMCO also beat its changing policy benchmark by approximately 1.34 percentage points annually over twenty years and 1.06 points over ten. The calculations compound reported annual returns. Changes in fund assets also include contributions and withdrawals. [S1–S4]
The difficulty is deciding what counts as a fair substitute. Change the equity index from net to gross dividends, keeping the same allocation and implementation charge, and the twenty-year public return rises to 7.11%; the ten-year return rises to 8.70%. The shorter-period advantage disappears. Introduce an annual lag to account for delayed recognition of private-market movements and the ten-year risk estimate changes substantially. That is evidence against confidence in a simple alpha claim, although the short regression is too unstable to settle the question.
Applying PUF’s recorded contributions and withdrawals makes the stakes concrete. The twenty-year midpoint cash-flow replay ends at $40.35 billion using PUF returns, versus $36.17 billion for net-dividend 70/30 and $38.77 billion for gross-dividend 70/30. PUF’s estimated advantage is therefore $4.18 billion or $1.57 billion, depending on the dividend assumption. Over ten years, the corresponding advantage is $0.90 billion under net dividends and a $0.49 billion shortfall under gross dividends. These are modeled comparisons using identical reported annual flows, with the timing residual disclosed below.
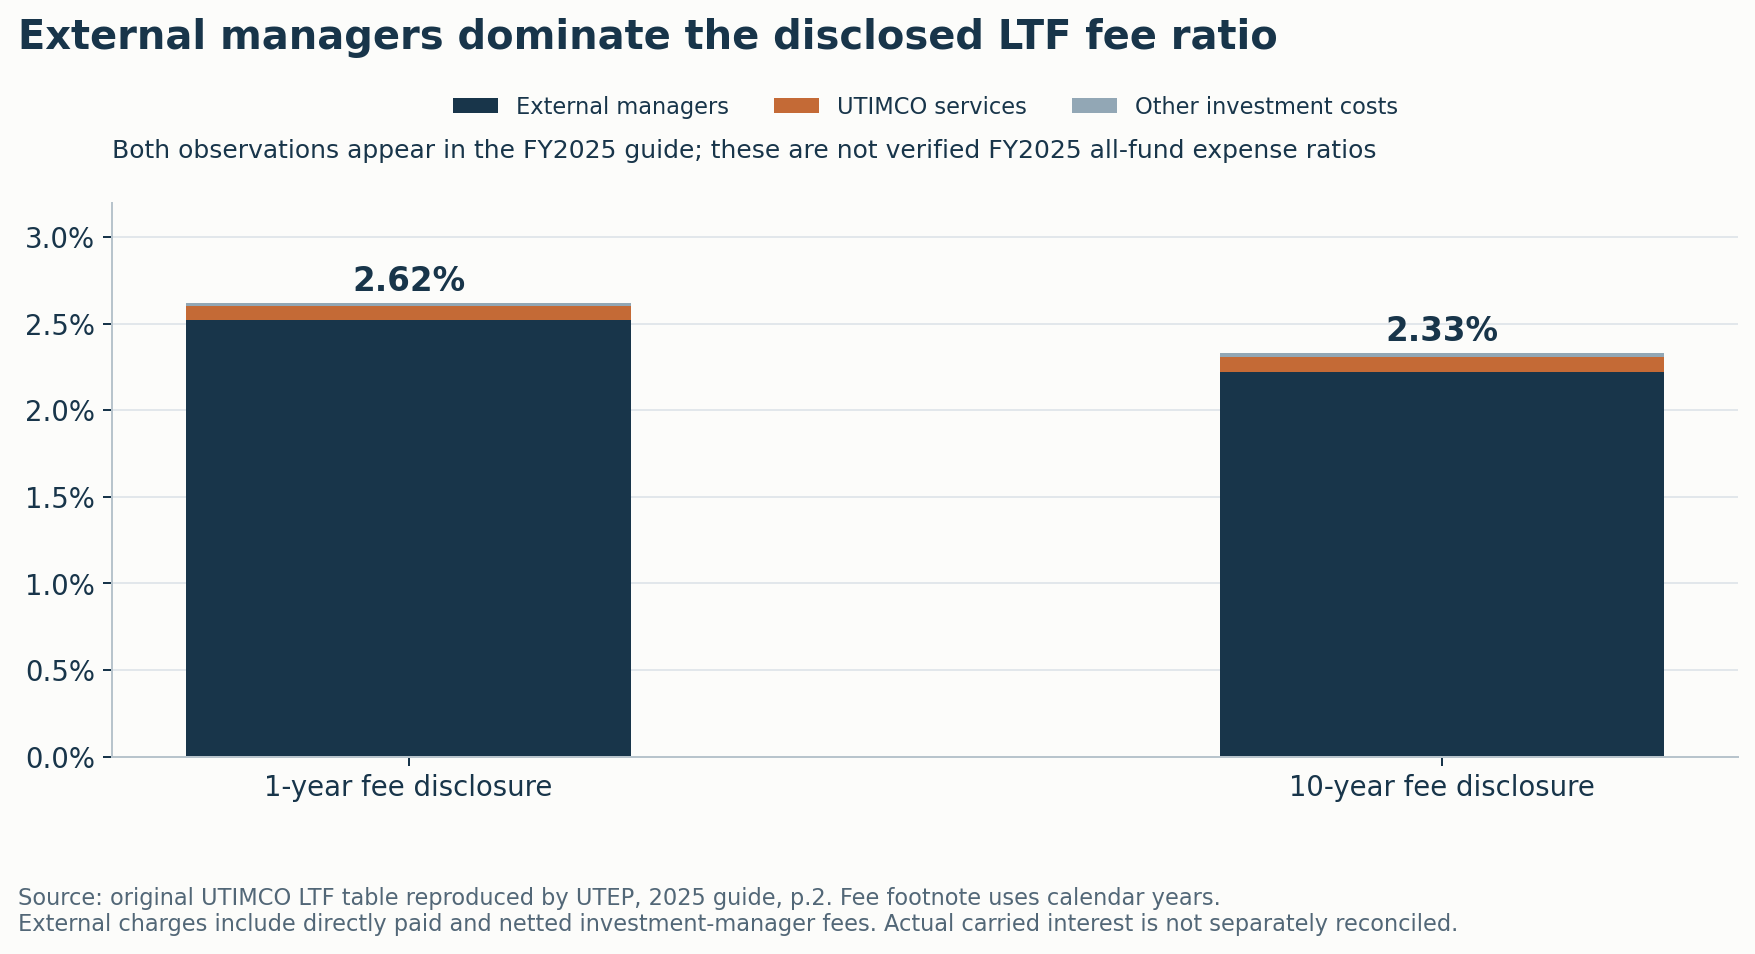
FY2025 operating overhead was $85.746 million, or 10.59 basis points of UTIMCO’s reported average assets. It excludes external-manager fees. An original UTIMCO Long Term Fund (LTF) disclosure shows total investment-fee ratios of 2.62% for its one-year observation and 2.33% for its ten-year observation, mostly external-manager charges. Its footnote uses calendar years; those ratios cannot honestly be relabeled a consolidated FY2025 expense bill. Scaling observed ratios to a fiscal average endowment asset base gives $1.39 billion–$1.69 billion, explicitly an estimate. Carried interest remains unknown because the public material does not reconcile it as a line item. [S9–S11]
Editorial judgment: the strongest favorable finding is sustained twenty-year outperformance of several transparent public alternatives after reported investment costs. The strongest unfavorable finding is how little of the recent advantage survives plausible changes in benchmark taxes, equity exposure, and compensation for illiquidity. Neither a small corporate budget nor a large fee estimate settles the investment-value question by itself.
1. Fund coverage and reporting dates
UTIMCO manages several pools with different purposes. PUF and the General Endowment Fund (GEF) form the main endowment comparison here. LTF and the Permanent Health Fund hold GEF interests; adding their assets to GEF would count the same capital again. The Intermediate Term Fund (ITF) serves a different liquidity and risk purpose. Its reported annual returns and available strategy data are recorded in the files, but it is not treated as another endowment clone. [S3–S4]
The principal windows are September 2005–August 2025 and September 2015–August 2025. The underlying audited PUF and GEF statements are for FY2025. This supports a consistent treatment of returns, contributions, distributions, costs and commitments.
For the fiscal year ending August 2026, UTIMCO’s final performance summary reports PUF’s one-year return of 14.87%, ten-year return of 9.72%, and net assets of $45.90 billion. Recompounding the annual series through August 2026 produces twenty-year PUF performance of 7.55%, against 6.91% for net-dividend 70/30 and 7.29% for gross-dividend 70/30. The updated ten-year figures are 9.72%, 9.22% and 9.60%, respectively; the advantage over gross-dividend 70/30 is about 12 basis points. Thus, extending the endpoint improves the shorter-period comparison, but does not turn it into a complete risk-adjusted test. The report uses FY2025 audited cash flows and cost estimates for the comparisons below. 5
The comparisons use the following assumptions.
| Choice | Main case | Sensitivity or limitation |
|---|---|---|
| Equity index | MSCI ACWI Net, USD | Gross-dividend variant; neither is a fund’s exact tax experience |
| Bond index | Bloomberg U.S. Aggregate | U.S. investment-grade bonds |
| Allocation | 70/30 and 60/40 | 80/20 and estimated equity/bond risk replicas |
| Rebalancing | Annually at the fiscal boundary | Monthly comparison supplied |
| Public implementation cost | 0.10% annually | 0%, 0.05%, 0.20%; multiplicative wealth charge |
| UTIMCO cost treatment | Published net investment returns | No second deduction of external fees or carry estimates |
| Annual cash-flow timing | Midyear | Beginning and end of year; identical treatment across portfolios |
| Private NAV risk | Reported returns | Current-factor and current-plus-lag estimates shown as sensitivities |
| Illiquidity compensation | No extra hurdle in headline returns | Explicit additional 25–100 bp judgmental hurdles |
Facts are values reported in primary documents. Calculations transform those facts. Estimates require assumptions about timing, tax treatment, risk or cost coverage. Every material input in the accompanying raw files carries its document, URL, page or data tag, access date and period.
2. The reported investment record
Annualized returns are geometric: multiply annual wealth factors, take the appropriate root, and subtract one. An arithmetic average of annual returns would overstate compound performance. Likewise, NAV growth is not an investment return when royalties, gifts and distributions move capital into and out of a fund.
| Annualized return through August 2025 | Twenty years | Ten years |
|---|---|---|
| PUF, reported net | 7.38% | 8.63% |
| GEF, reported net | 7.47% | 8.71% |
| LTF, reported net | 7.41% | 8.67% |
| UTIMCO policy benchmark | 6.04% | 7.57% |
| Global 60/40, net dividends, after public costs | 6.24% | 7.40% |
| Global 70/30, net dividends, after public costs | 6.72% | 8.31% |
| Global 70/30, gross dividends, after public costs | 7.11% | 8.70% |
| Global 80/20, net dividends, after public costs | 7.18% | 9.21% |
Calculations from S1–S8. Annual fund and policy observations use the published precision. Some early policy observations are rounded to one decimal place; the long-horizon figures should not be read as basis-point-exact audited statistics.
The recent annual sequence explains why a single good year should not dominate the verdict. PUF earned 31.59% in FY2021, then −6.17% in FY2022, 4.74% in FY2023, 10.48% in FY2024, and 9.95% in FY2025. The matching net-dividend 70/30 calculations are 19.90%, −14.66%, 9.30%, 18.48%, and 11.89%. Private and public portfolios can recognize economic shocks at different times. A smoother reported path is not automatically a less risky economic path. The complete FY2006–2026 fund panel is in the workbook and raw CSV. [S1, S4, S6–S8]
Policy outperformance is real, but the policy is not a cheap index fund
The historical policy series changes with UTIMCO’s governance and portfolio design. The current PUF investment policy, effective September 2026, includes public-equity indexes, private-market median-manager benchmarks, hedge-fund indexes, and real-estate composites. Private weights reset using prior reported combined endowment weights, offsetting public equity. That is a meaningful institutional reference but not a fixed portfolio an outside investor can buy at negligible cost. The 2026 rules are documented prospectively; they have not been backfilled into earlier years. 12
Consequently, 134 basis points of twenty-year policy outperformance is not identical to 134 basis points of public-market alpha. Benchmark design, manager selection, allocation, valuation timing and underlying exposures can all contribute to the gap. A policy containing private-manager medians asks a different question from a readily traded public alternative.
The asset-class records also resist casual splicing. The FY2025 audited performance schedule reports public equity at 17.1%, private equity at 7.3%, directional hedge funds at 15.3% for PUF, and long Treasuries at −4.0%. In the annual report’s economic portfolio groupings, global equity returned 12.4% against 8.9%, stable value 5.6% against 3.2%, real return 4.7% against 1.1%, and strategic partners 11.4% against 10.8%. [S2, S4]
Those labels are not interchangeable. For example, the audited strategy grouping shows PUF total stable value at 6.7%, while the annual-report economic portfolio shows 5.6%. The package preserves both original classifications. It contains 647 audited strategy observations for FY2009–2025, 93 annual-report portfolio/benchmark observations for FY2017–2025, 69 original class/comparator observations for FY2006–2009, and 51 earlier narrative pairs for FY2010–2016. FY2009 lacks a complete numerical class-benchmark table; its executive letter supplies one quantified hedge-fund comparison. Other missing exact historical class benchmarks remain blank or UNKNOWN; they are not inferred by matching similar names.
3. Building a fair public alternative
The public portfolios use index returns. This avoids inventing an ACWI ETF history before its launch. MSCI’s public endpoint supplies ACWI levels; the iShares AGG page supplies the Bloomberg Aggregate benchmark history. Both MSCI series enter the comparisons. [S6–S8]
For equity weight w, equity return E_t, bond return B_t, and annual public cost c, the main calculation is:
Public return = [1 + w × Eₜ + (1 − w) × Bₜ] × (1 − c) − 1
The assumed ten-basis-point charge applies to wealth after the year’s investment return. It is not an observed UTIMCO procurement quote. It represents a transparent implementation allowance whose importance is tested directly.
“Net” in MSCI ACWI Net refers to the index’s assumed dividend withholding. It does not mean all investment-management costs have already been removed. A U.S. tax-exempt institution’s foreign-tax treatment can differ from those assumptions. Conversely, a gross-dividend index assumes reinvestment before the modeled withholding deduction and may be more favorable than any feasible implementation. The two versions bracket an important convention; whether a particular investor can obtain a refund depends on its tax treatment. 6
This convention is decisive because the recent return edge is small. At 70/30, using gross dividends in place of net dividends raises the modeled annual return by approximately 39 basis points over twenty years and 39 basis points over ten. The PUF’s ten-year advantage under the net convention is only 32 basis points.
The additional sensitivity grid tests 60/40, 70/30 and 80/20, both dividend variants, annual and monthly rebalancing, and public costs of zero, five, ten and twenty basis points. Across those rebalancing and cost choices, twenty-year 70/30 returns range from 6.61% to 6.88% under net dividends, and 7.00% to 7.27% under gross dividends. PUF’s 7.38% exceeds all tested fixed 70/30 cases, although the smallest margin is only about 11 basis points.
Over ten years, the net range is 8.20%–8.44%, and the gross range is 8.59%–8.82%. PUF’s 8.63% lies within the latter. Monthly rebalancing alone changes the main net-dividend 70/30 comparison by only about six basis points over twenty years and two over ten. The dividend convention matters more.
4. Risk matching, with and without private-NAV lags
A 60/40 portfolio is a reference point, but beating it does not show that a more equity-sensitive, less liquid endowment earned compensation for every risk it took. Nor does matching reported volatility solve the problem when appraisal-based assets recognize market movements slowly.
The primary methodological reference is Getmansky, Lo and Makarov’s model of illiquidity and return smoothing. It explains why contemporaneous regressions can understate market exposure and why lagged factor loadings can matter. It does not supply a ready-made UTIMCO alpha estimate. 13
This report estimates a deliberately parsimonious public-index diagnostic. Set y_t=R_t^(PUF)-B_t and x_t=E_t-B_t. Fit both:
yₜ = a + b₀xₜ + εₜ
and
yₜ = a + b₀xₜ + b₁xₜ₋₁ + εₜ
The economic equity-weight estimate is b_0 in the first specification and b_0+b_1 in the second. The public replica then holds that weight in current ACWI and the balance in current Aggregate bonds, with the same implementation cost. It does not receive the regression intercept and does not pretend last year’s realized stock return is an investment available today.
| Sample and specification | Current beta | Lag beta | Estimated equity weight | Public replica CAGR | PUF minus replica | Arithmetic intercept |
|---|---|---|---|---|---|---|
| 20 years, current factor | 0.672 | — | 67.2% | 6.59% | +0.79 pp | +0.69% |
| 20 years, current + lag | 0.660 | 0.058 | 71.9% | 6.80% | +0.57 pp | +0.42% |
| 10 years, current factor | 0.711 | — | 71.1% | 8.41% | +0.22 pp | +0.03% |
| 10 years, current + lag | 0.758 | 0.233 | 99.1% | 10.91% | −2.28 pp | −2.24% |
Calculated in sample from annual PUF, ACWI Net and Aggregate returns. The arithmetic intercept and geometric return spread measure different things.
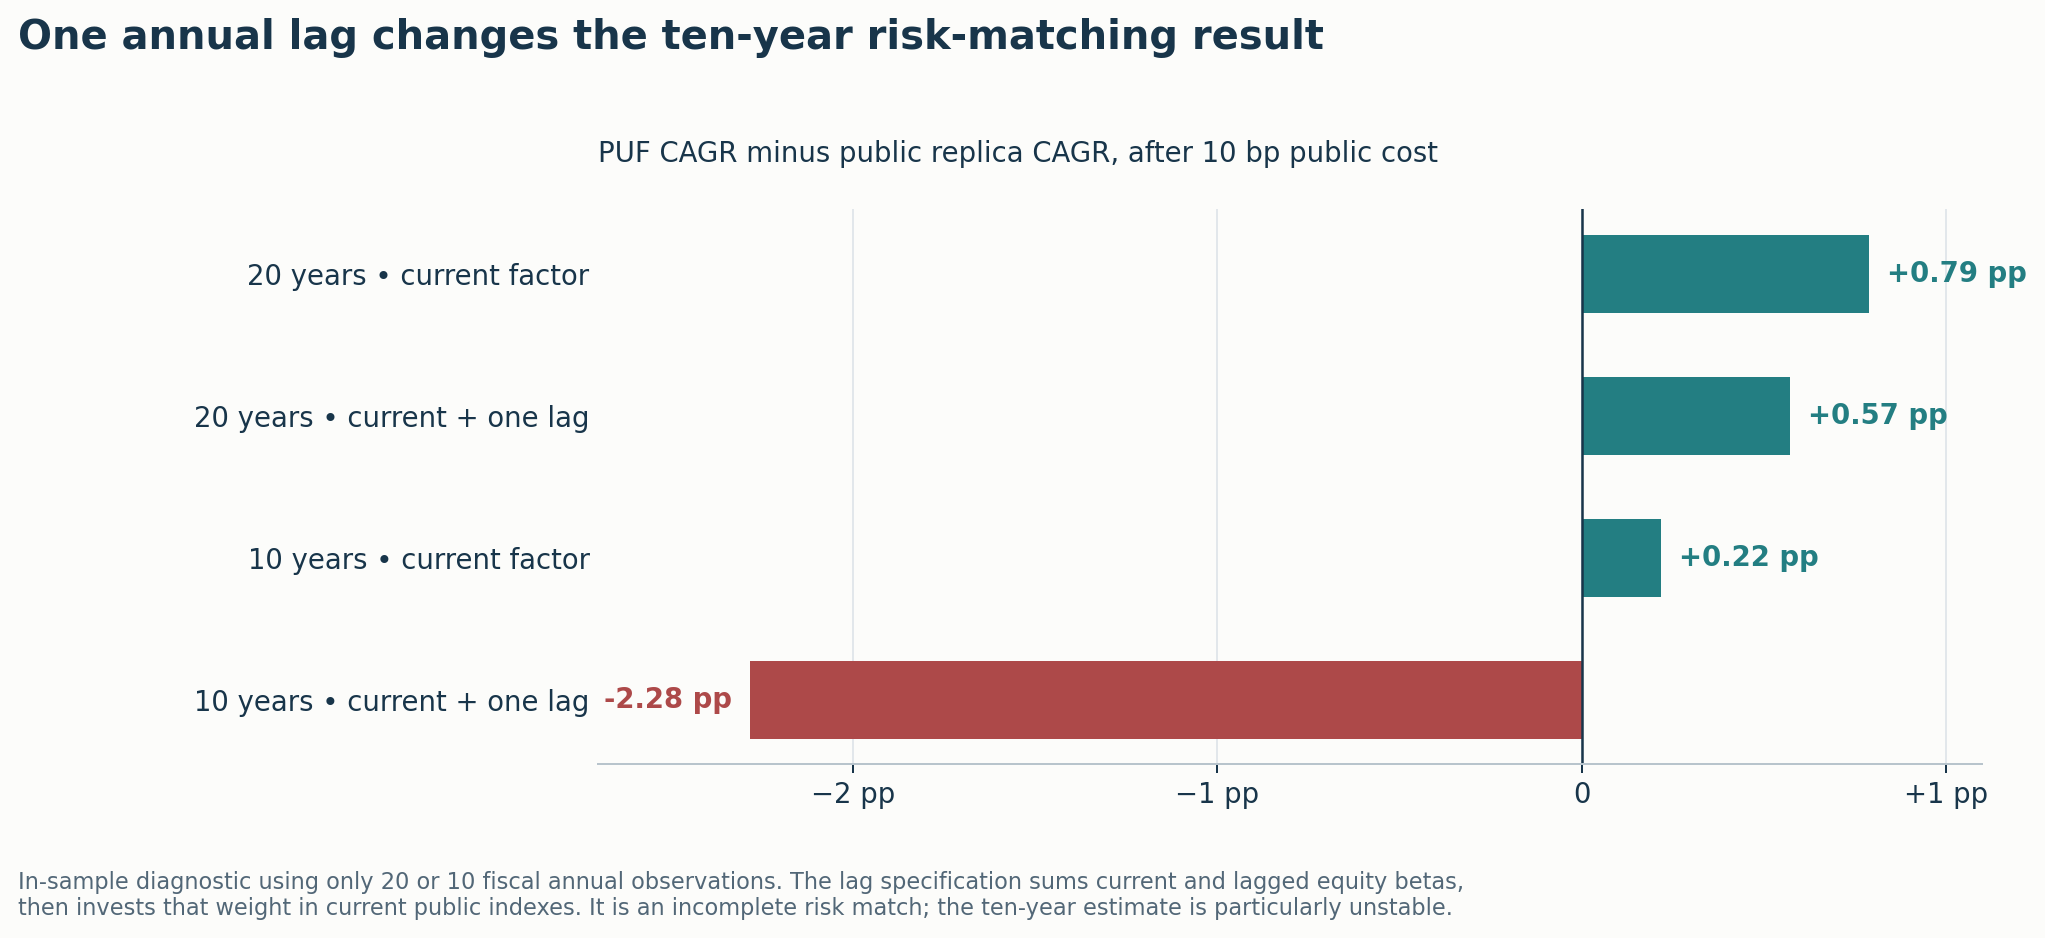
The twenty-year estimate is reasonably stable across these two specifications: allowing delayed equity exposure reduces the return advantage but does not remove it. For the ten-year sample, adding one lag moves the fitted equity weight from 71.1% to 99.1% and reverses the sign of the modeled performance gap.
That reversal is not a precise finding that UTIMCO “really” held a 99% stock portfolio. Only ten annual observations support three estimated coefficients, leaving seven residual degrees of freedom. Portfolio exposures changed; an annual lag is a coarse substitute for quarterly valuation delays; and an equity/bond model omits credit, real assets, leverage, option-like exposures and other risks. The reported fit rises from roughly 65% to 73%, but improved in-sample fit is not proof of a better economic model.
Reported annual PUF volatility is approximately 9.34% over twenty years and 9.54% over ten. The ten-year lag-based public replica has volatility around 12.48%. This contrast illustrates why the model should be treated as a sensitivity, because equal risk remains unverified.
A stronger test needs monthly or quarterly net returns, contemporaneous exposure data, and private-valuation timestamps, with an out-of-sample specification chosen before observing the result. A verified complete panel with those fields was not reconstructed here. The annual diagnostic answers the requested “both ways” comparison while preserving the central uncertainty: the public record supports benchmark outperformance more strongly than it supports a precise risk-adjusted alpha claim.
5. Royalties, distributions and year-end assets
PUF’s asset growth includes new capital generated by its land and mineral interests. Calling all of that growth investment skill would misattribute the resource endowment to portfolio management. The audited “contributions from lands” line is used as reported; it includes mineral-related receipts in place of an assumed oil-price model. Surface-revenue arrangements are not added as if they were PUF investment contributions. 3
The twenty annual statements reconcile to this identity, in billions of dollars:
| PUF accounting bridge, FY2006–2025 | $bn |
|---|---|
| Beginning net assets, August 2005 | 9.427 |
| Net investment income, including gains and losses | +29.688 |
| Contributions from lands | +18.834 |
| Beneficiary distributions | −17.347 |
| Land-management and oversight expenses | −0.310 |
| Ending net assets, August 2025 | 40.291 |
The identity balances exactly at the source statements' $1,000 reporting precision. Each annual bridge also balances. Seventeen overlapping comparative-year checks agree on the core cash-flow lines; a small FY2014 reclassification between gross investment income and expense does not change net income or the bridge.
For the counterfactual, each portfolio receives the same recorded annual contributions and makes the same recorded distributions and noninvestment payments:
V_t=V_(t-1)(1+R_t)+(C_t-D_t-A_t)(1+R_t)^(1/2).
Here C is contributions from lands, D beneficiary distributions, and A land/oversight expense. The half-year exponent assumes a midpoint for annual flows. Individual payment dates can differ. The ten-year replay starts from reported August 2015 net assets of $17.490 billion.
| Ending value using identical recorded annual flows | Twenty-year replay | Ten-year replay |
|---|---|---|
| PUF reported-return replay | $40.35bn | $40.16bn |
| UTIMCO policy benchmark | $31.78bn | $36.49bn |
| Net-dividend 60/40 | $33.12bn | $36.15bn |
| Net-dividend 70/30 | $36.17bn | $39.25bn |
| Gross-dividend 70/30 | $38.77bn | $40.65bn |
| Net-dividend 80/20 | $39.37bn | $42.56bn |
| Current-factor risk replica | $35.31bn | $39.62bn |
| Current-plus-lag risk replica | $36.75bn | $49.49bn |
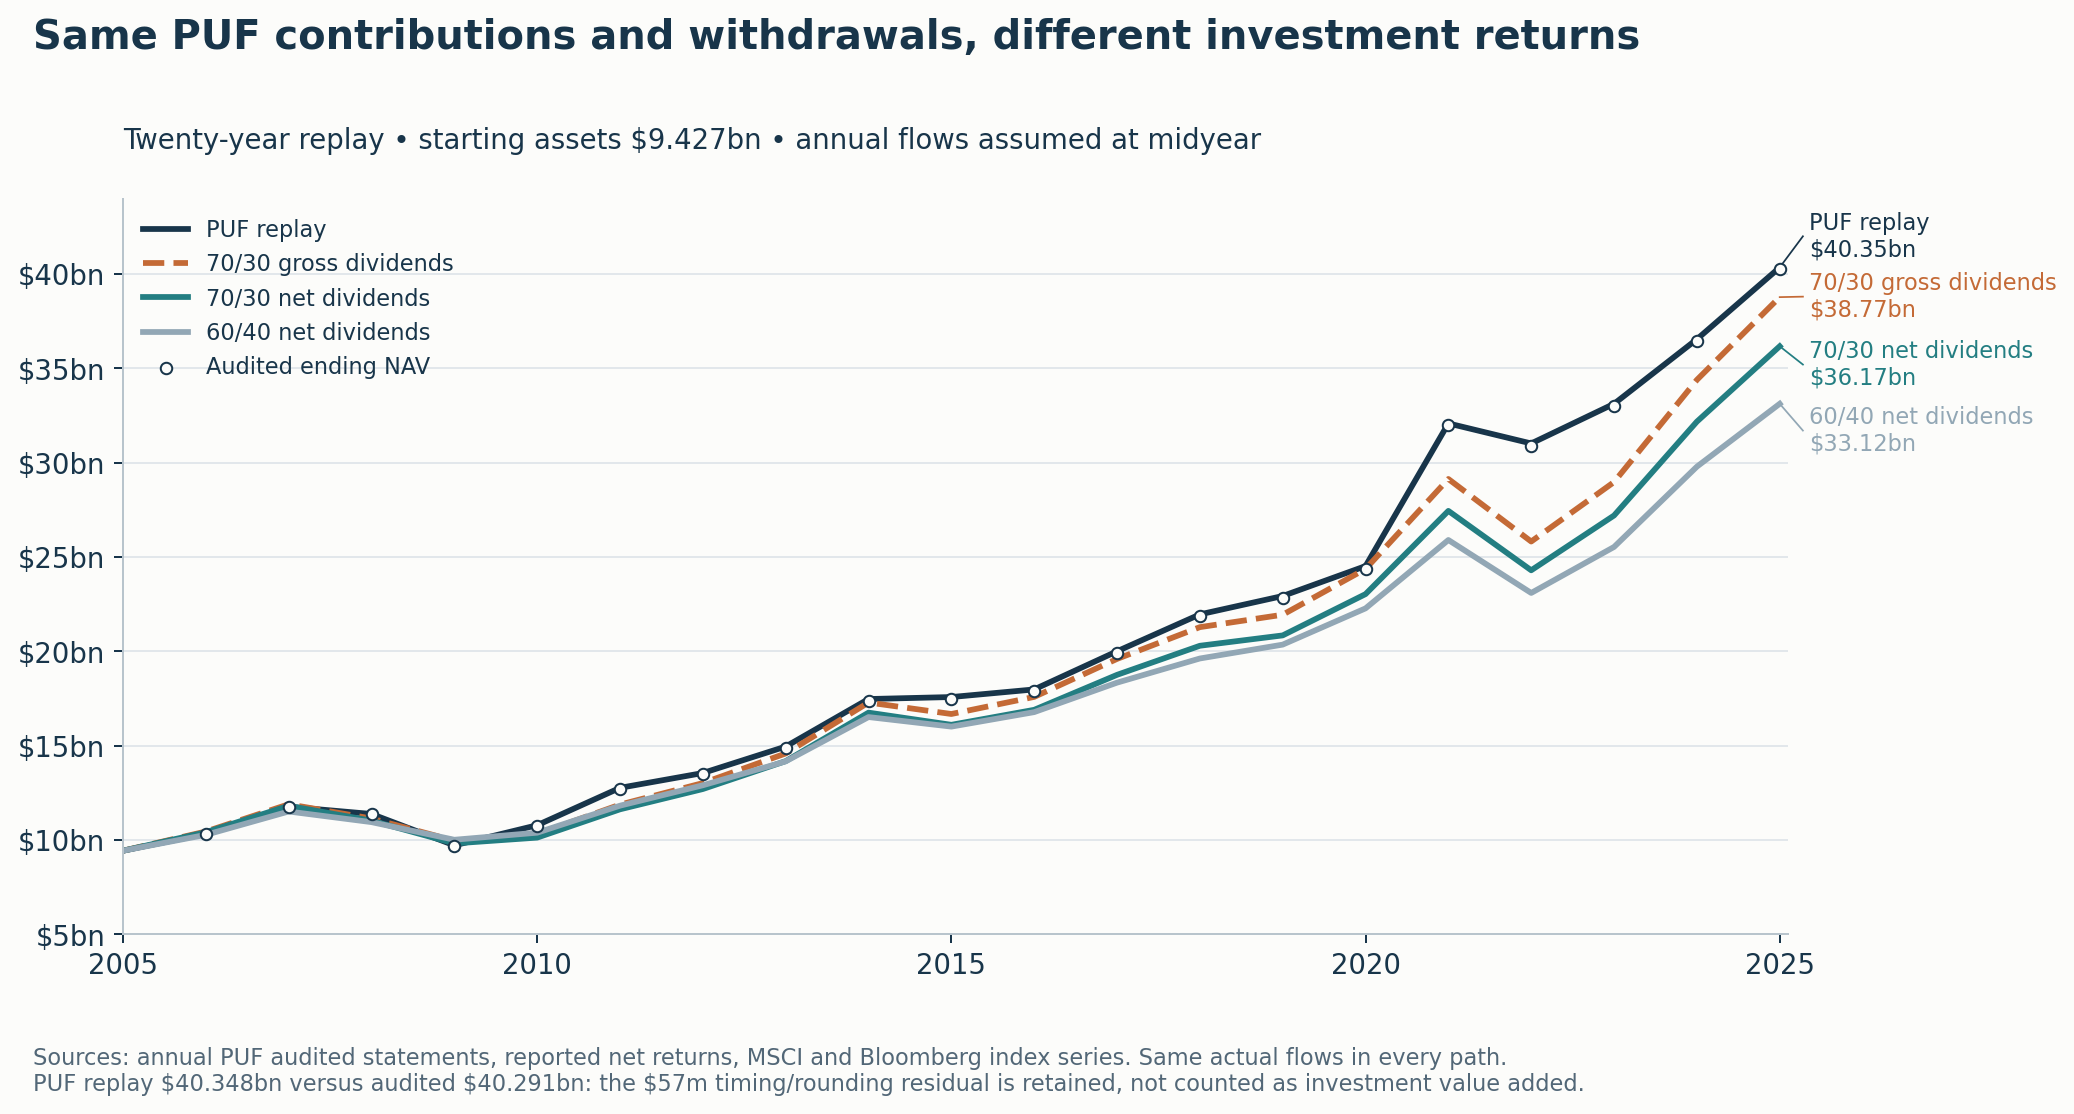
Two controls prevent this table from overstating precision. First, PUF’s own twenty-year replay exceeds audited ending assets by $56.96 million; its ten-year replay falls short by $134.36 million. Rounded returns and assumed annual timing do not reproduce the custodian’s monthly performance calculation exactly. The timing table reports both discrepancies. The report compares modeled PUF wealth with modeled alternative wealth; it does not award the reconciliation residual to management.
Second, shifting all annual flows together to the beginning or end of each year does not change the relevant signs. The twenty-year PUF advantage over net 70/30 ranges from $4.12 billion to $4.22 billion, and the gross-dividend advantage from $1.52 billion to $1.62 billion. Over ten years, the net-dividend advantage ranges from $0.84 billion to $0.95 billion, while the gross-dividend shortfall ranges from $0.44 billion to $0.56 billion. Each timing sensitivity uses the same dates for both portfolios.
The lagged ten-year wealth figure is particularly unsuitable as a claim of “money lost”: it applies a noisy, retrospectively estimated equity weight to the whole decade. Its purpose is to show the consequence of that risk assumption.
6. How much did the investment organization cost?
Three accounting figures measure different costs. the corporation’s overhead, directly recorded fund investment expenses, and broader manager costs embedded in investment vehicles. Adding them indiscriminately produces a false total.
The corporate budget measures the organization’s overhead
The Regents’ August 2026 materials report FY2025 spending on UTIMCO services of $76.44 million, plus $9.31 million in other direct fund costs, totaling $85.75 million. Against $80.933 billion of reported average total AUM, that equals 10.59 basis points. The same functional overhead series totals $584.41 million for FY2016–2025. It explicitly excludes external-manager fees. 9
The FY2027 budget presented to the Regents is $108.11 million, with 144 positions, $32.36 million in base salaries, and $33.13 million in performance compensation and associated earnings. FY2025 performance compensation and associated earnings were $24.80 million, against base salaries of $26.69 million. These budget categories cover the organization. Individual awards are undisclosed here. 9
The budget is not treated as expenditure already incurred. Its documents also contain differing projected-AUM figures. Using Table 1's $96.050 billion denominator gives 11.26 basis points for the submitted FY2027 total; the workbook identifies that choice. The capital budget is not simply added to an expense total containing depreciation.
Audited direct expenses are broader in one direction, narrower in another
The FY2025 PUF and GEF statements show direct investment expenses of $61.44 million and $43.64 million, respectively, or $105.08 million combined. Those include UTIMCO allocations of approximately $35.26 million and $24.03 million. Corporate allocations are therefore already inside these fund lines; adding the corporation’s overhead again would duplicate costs. 3
The fund expense lines do not enumerate every cost borne inside partnerships and investment funds. Those vehicles can report values and distributions after management fees, incentive allocations and other expenses. The booked fee is one component of the full fee rate.
The independent performance schedule describes returns net of cash payments for investment-management fees, while investment values also reflect the underlying vehicles’ reported capital accounts. The performance comparison uses the published net series. It does not claim to have independently re-audited every embedded partnership charge. Land-management and system oversight charges outside the investment-return definition are handled in the cash-flow replay. [S3–S4]
Long Term Fund fee disclosures
An original UTIMCO LTF table reproduced in UTEP’s FY2025 endowment-statement guide provides a broader disclosure:
| Fee category, as percentage of assets | One-year observation | Ten-year observation |
|---|---|---|
| UTIMCO services | 0.08% | 0.09% |
| Other investment costs | 0.02% | 0.02% |
| External managers | 2.52% | 2.22% |
| Total | 2.62% | 2.33% |
The fee footnote specifies calendar-year calculation, without resolving the exact calendar endpoint in the displayed table. External charges include directly paid and netted manager fees. The table is strong evidence that operating overhead is only a small fraction of the investment-cost burden. It is not an audited consolidated fiscal-year carry ledger. 10
To express scale in dollars, the model uses $64.578 billion, the average of beginning and ending FY2025 PUF-plus-GEF net assets. This proxies the asset base with fiscal-year average NAV. The LTF disclosure’s calendar asset denominator remains unverified.
| Cost-scale case | Observed ratio used | Estimated total dollars | Estimate as % of asset proxy |
|---|---|---|---|
| Low | FY2024 disclosure’s one-year total | $1.388bn | 2.15% |
| Base | FY2025 disclosure’s ten-year total | $1.505bn | 2.33% |
| High | FY2025 disclosure’s one-year total | $1.692bn | 2.62% |
These ranges apply the disclosed rates to the assumed asset bases. The low ratio comes from another original UTIMCO statement reproduced in a donor organization’s newsletter. It uses the same calendar-year caveat. A twenty-year cumulative all-in fee total cannot be responsibly calculated from these sparse observations. [S10–S11]
Carry: quantify the uncertainty without manufacturing a fact
No complete public reconciliation was located showing management fees, realized carry, accrued carry, clawbacks, fee offsets and fund expenses consistently across all vehicles and years. Carried interest is therefore UNKNOWN.
For an analyst who needs a dollar sensitivity, the workbook allocates 20%, 40%, or 60% of external-fee dollars to a hypothetical incentive component, paired with the low/base/high fee cases. This produces $260 million, $573 million, and $976 million, equivalent to 0.402%, 0.888%, and 1.512% of the asset proxy. These are explicitly chosen attribution scenarios. They are not evidence-based bounds on realized carry, and the component remains inside the total fee estimate.
A UTIMCO board presentation does show illustrative real-estate fund economics: 1.5% management fee/20% carry for an LP structure versus 0.75%/10% for a co-investment example. That demonstrates why contractual structure can affect costs. It cannot determine portfolio-wide realized carry, because carry is a share of qualifying profits under contract terms. The realized amount varies with performance and the agreement. 14
Investment fees are already reflected in the reported net return to the extent recognized in fund accounting. Subtracting the estimated $1.5 billion—or any hypothetical carry amount—from that return again would count the same economic burden twice.
7. What the incentive design rewards
The 2025 compensation-program restatement reviewed for this report ties important awards to multi-year asset-class performance and to comparisons with large endowments. Its peer measure uses the largest twenty endowments excluding UTIMCO, with one- and three-year components. The performance year ends in June, while the funds’ fiscal reporting ends in August. 15
Multi-year measurement is preferable to treating one successful year as durable skill. Nevertheless, relative performance against a private-heavy peer group is not the same objective as beating a liquid public opportunity cost. If many peers share a valuation convention or pay similar external fees, a peer ranking does not independently test the economic merit of that convention or fee structure.
The program includes extraordinary deferral provisions following negative endowment performance for specified participants, and recovery provisions for specified willful misconduct or fraudulent misconduct that causes or contributes to a restatement of the investment results used to determine awards. It should not be summarized as “no bonuses in a down year”: the coverage and mechanics matter. These protections address payment timing and misstatement risk; they do not by themselves resolve benchmark adequacy. 15
The relevant governance question is whether the scorecard distinguishes three achievements: beating the approved policy, outperforming a feasible public alternative, and earning enough additional return for illiquidity and complexity. An organization can succeed on one and remain unproven on another.
8. Commitments versus resources available to meet them
At August 2025, combined PUF and GEF net assets were $67.60 billion and disclosed unfunded commitments were $19.66 billion, approximately 29.1% of NAV. PUF alone reported approximately $17.43 billion in private-fund NAV. Unfunded commitments are contingent future cash obligations; they are not all immediately due. Conversely, a large NAV is not all immediately spendable. 3
A transparent one-year liquidation proxy combines direct public assets and vehicles disclosed as redeemable within a year. It excludes illiquid holdings, lending collateral and broker deposits, and avoids adding cash equivalents already included in fair-value subtotals. After a conservative $2.09 billion liability reserve, the proxy is $29.71 billion. No credit is given for receivables or positive derivative marks. The calculation estimates available resources from the stated components.
| Combined PUF + GEF measure, August 2025 | Amount |
|---|---|
| Net assets | $67.60bn |
| Unfunded commitments | $19.66bn |
| Gross one-year liquidation proxy | $31.80bn |
| Liability-reserved proxy | $29.71bn |
| Cash and cash equivalents | $2.50bn |
| FY2025 PUF distributions plus GEF participant withdrawals | $2.69bn |
| Unfunded commitments / liability-reserved proxy | 66.2% |
The annual outflow measure combines PUF beneficiary distributions with GEF participant withdrawals, which include redemptions and are not identical to university operating spending. At face value, the reserved proxy covers about eleven times those annual outflows. That is reassuring for ordinary spending, but less decisive when market declines, capital calls and contingent support arrive together.
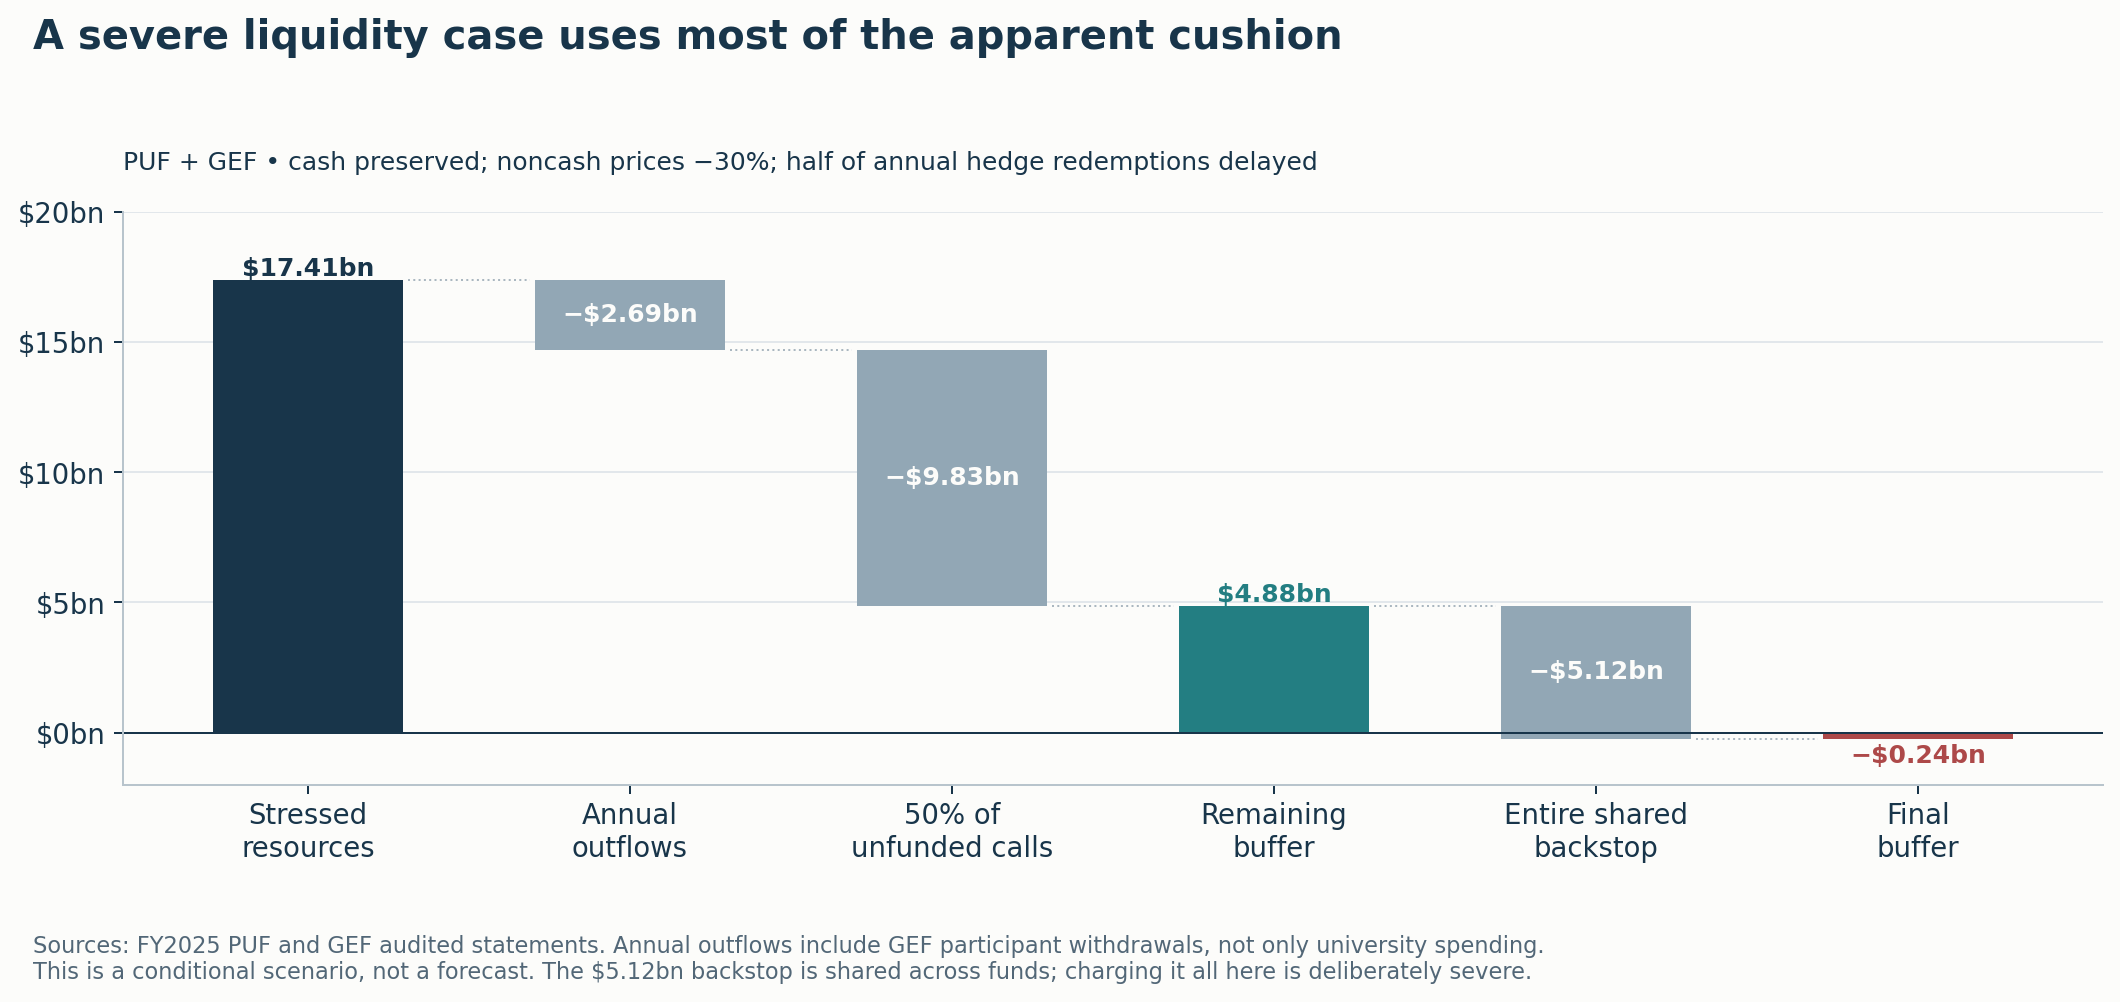
A conditional stress preserves cash, cuts other realizable asset values by 30%, delays half of the hedge-fund assets otherwise redeemable within a year, assumes 50% of unfunded commitments are called, and credits no new royalties or gifts. Available resources fall to $17.41 billion. After $2.69 billion of annual outflows and $9.83 billion of calls, the buffer is $4.88 billion.
The audits also disclose shared contingent liquidity arrangements. Counting the UT System backstop once, plus the PUF’s Texas A&M arrangement, gives $5.12 billion. Assigning that entire amount to the endowment pools in the same stress produces a $0.24 billion shortfall. That final allocation is deliberately severe: the shared arrangement is supported across funds, and the documents do not require all of it to be charged to PUF and GEF simultaneously. The scenario shows how the result depends on marketability and cash flows. 3
The current August 2026 liquidity policy uses a different framework: a 120-day liquidation definition with no more than a 10% orderly-price discount, an 80% endowment illiquid-asset ceiling, and a 35% unfunded-commitment limit measured against the highest trailing 24-month NAV. The illiquid ceiling can temporarily rise to 85% after a specified major equity-market decline, with a required return to 80%. A ratio based on current NAV and a one-year redemption table cannot certify compliance with that policy. Historical liquidity and current rules have their own entries. 16
9. NACUBO, endowment peers and Nevada PERS
Peer returns give context for the reported results across institutions with different mandates. Most of the comparison institutions report investment performance through June 30, two months before UTIMCO’s August endpoint. Fee definitions also differ.
| FY2025 comparison | One year | Ten years | Twenty years | Essential qualifier |
|---|---|---|---|---|
| PUF | 9.95% | 8.63% | 7.38% | August 31 endpoint; published net |
| NACUBO–Commonfund, all institutions | 10.9% | 7.7% | 7.3% | June endpoint; mean of respondent horizon returns |
| Yale | 11.1% | 9.4% | UNKNOWN | Reported net |
| Stanford Merged Pool | 14.3% | 9.4% | UNKNOWN | Net internal/external costs; excludes federal excise tax |
| Harvard | 11.9% | ≈8.2% | ≈7.9% | Long horizons calculated from rounded primary annual returns |
| UVIMCO Long Term Pool | 12.4% | 9.2% | 9.6% | Excludes UVIMCO’s own management/incentive fees |
| Nevada PERS | 10.9% | 9.0% | UNKNOWN | Consultant’s net time-weighted figures |
Sources S17–S22; UNKNOWN means a suitable primary performance data were unavailable for that entry.
NACUBO’s figures are arithmetic averages of each institution’s reported annualized return for that horizon. Compounding each year’s changing respondent average would not reproduce a valid twenty-year fund return. The 7.7% ten-year figure provides context. The survey cannot rank UTIMCO by percentile or support an equal-risk comparison for UTIMCO. PUF appears competitive with the broad sample and below several selected large endowments over ten years; the different endpoints prevent treating the small differences as a precise league table. 17
Nevada is especially informative because a less expensive implementation can coexist with strong long-term results. Its FY2025 expense schedule lists $82.66 million of management fees, $1.04 million of consulting fees, and $2.09 million of investment administrative expense, totaling $85.80 million. Against average beginning/end net position, that is approximately 0.127%. The schedule already includes private-equity general-partner and Pathway charges; adding them again would duplicate expenses. The disclosure leaves some embedded private-fund incentive allocations unresolved. 22
Nevada is also not a pure 60/40 index fund. Its reported allocation was approximately 51.8% public stocks, 26.4% bonds, 9.9% short-term assets and 11.9% private investments. Different liabilities, cash flows, equity composition, private exposure and reporting dates limit causal comparisons. Its record challenges the assumption that a large external-fee budget is necessary for respectable results; UTIMCO’s return under Nevada’s approach remains unknown. 22
Current information matters here too. FY2026 primary releases report one-/ten-year returns of 26.3%/11.7% for Yale, 31.7%/12.5% for Stanford, and 27.0%/12.0% for UVIMCO, with UVIMCO’s own fees excluded. Harvard reports 27.1% for one year. Nevada’s available June 2026 update reports 12.5%/10.1%, explicitly gross and preliminary. These updates cover FY2026. The net-return comparison ends with FY2025. Harvard’s public 11.4% tenure figure covers nine years and is not substituted for a ten-year return. 23
10. Low, base and high interpretations
The verdict depends more on the economic hurdle than on a finely tuned spreadsheet. To make that visible, hold net dividends, annual rebalancing and ten-basis-point public costs constant, then vary only the fixed public equity weight:
| Interpretation favorable to UTIMCO | Public comparator | 20-year PUF CAGR advantage | 10-year advantage | 20-year wealth advantage | 10-year wealth advantage |
|---|---|---|---|---|---|
| Low | 80/20 | +0.20 pp | −0.58 pp | +$0.98bn | −$2.40bn |
| Base | 70/30 | +0.66 pp | +0.32 pp | +$4.18bn | +$0.90bn |
| High | 60/40 | +1.14 pp | +1.23 pp | +$7.23bn | +$4.01bn |
Each scenario shows the outcome under an alternative assumption. A 60/40 comparator is generous to a portfolio with higher economic equity exposure; 80/20 may be too demanding for some periods. The regression estimates help expose that choice without eliminating judgment.
The return hurdle depends on how much an investor requires for illiquidity. At a hypothetical 50-basis-point annual hurdle, the twenty-year advantage over net-dividend 70/30 leaves approximately 16 basis points; the ten-year result misses by approximately 18 basis points. Against gross-dividend 70/30, even the twenty-year 27-basis-point advantage is below that hurdle. A 25–100 basis-point range tests a range of possible illiquidity hurdles. UTIMCO’s exact premium remains unmeasured.
Valuation uncertainty is also material at the margin. The ten-year net-dividend wealth advantage of $0.90 billion equals about 5.2% of PUF’s reported private-fund NAV. A hypothetical terminal markdown of that size, with everything else unchanged, would erase that advantage. This arithmetic is not evidence that the marks are wrong. It shows how much confidence the conclusion places on unrealized values when the measured surplus is modest.
11. Independent checks and evidence that would change the answer
The three central findings were checked against primary records and calculations:
- The long-horizon performance advantage. Annual fund returns were independently compounded. The ten-year compounds reconcile with published ten-year figures at their reported precision; the twenty-year compounds were independently reproduced from the historical annual inputs. MSCI Net history was checked against iShares benchmark observations across 223 overlapping months, with differences under 0.1 basis point. Gross history was checked against another manager’s published index series. A foundation’s contemporaneous 70/30 and 60/40 benchmark report independently corroborates the approximate ten-year levels. Spreadsheet formulas and an independent numerical implementation agree. 24
- The dollar value after recorded cash flows. Every annual PUF statement bridge balances; the twenty-year cumulative bridge balances; and overlapping comparative statements agree on cash flows. Independent calculations reproduce the replay. Beginning/midpoint/end timing sensitivities preserve the main signs. The observed-versus-modeled terminal residual is reported without an adjustment.
- The difference between overhead and total fees. Regents’ budget exclusions, audited fund allocation notes and original LTF fee disclosures were compared directly. The model does not add corporate allocations to fund totals or carry attribution to total fee estimates. Fee scenarios reconcile exactly to their components. The liquidity reconstruction also reserves liabilities and avoids duplicating collateral or cash equivalents.
The following evidence would materially change the conclusion:
- A consistent complete fee ledger: annual manager fees, realized and accrued carry, offsets, clawbacks and vehicle expenses, reconciled to audited capital accounts and net returns. This would replace the current dollar-scale scenarios and determine whether any material recognized costs fall outside the reported performance series.
- Private realization evidence: proceeds, subsequent marks and distributions compared with prior NAVs. Material upward or downward revisions could strengthen or weaken the modest recent surplus.
- A richer risk panel: monthly/quarterly net total-fund returns, valuation dates, exposures and leverage, permitting a prespecified multi-factor lag model and genuine out-of-sample checks.
- An implementable tax comparison: documented withholding recovery and institutional index-implementation pricing. This matters because the ten-year result straddles plausible public alternatives.
- A commitment and liquidity schedule: expected call pacing, contractual redemption restrictions and allocation of contingent support across funds. This would replace broad one-year stress assumptions with specific obligations.
Several requested quantities remain unavailable at a defensible level: a twenty-year cumulative all-in fee bill; realized and accrued carry; a uniform twenty-year asset-class benchmark panel across changing classifications; fully comparable twenty-year peer returns for every institution; and a complete economic risk match. The accompanying gap register states each missing field and its consequence. No missing figure is filled with an invented observation.
The publishable conclusion is conditional but substantive: UTIMCO’s twenty-year net record survives several demanding public-benchmark checks and delivered meaningful modeled dollars after recorded PUF flows. Its FY2016–2025 ten-year edge is too sensitive to taxes, risk exposure and illiquidity assumptions to demonstrate that the full complexity and fee burden was decisively justified. Better disclosure could resolve much of that uncertainty; the existing record does not justify pretending it is already resolved.
Source register and audit trail
All sources were accessed November 12, 2026. Page references below use printed pages unless stated otherwise. The raw-data source register supplies document-level URLs and row-level tags for the full historical series. Calculated figures are reproduced in the XLSX; the CSV collection includes the chart data.
S1 — Historical fund performance: UTIMCO performance-summary archive, August fiscal summaries FY2009–2026, p.1 fund rows; 2006 PUF annual-report return discussion and corresponding 2006–2008 fund charts. Exact annual URLs, dates and tags: annual_fund_returns_2006_2026.csv.
S2 — Annual report: UTIMCO 2025 Annual Report, pp.10–11, Figure 2 and performance discussion; period ended August 2025. Historical class/portfolio report URLs appear in the corresponding CSVs.
S3 — Fund audits: PUF FY2025 audited statements, pp.8–9, Note 3 pp.15/17, Note 10 p.36 and Note 12 pp.37–38, contingent support and expenses; GEF FY2025 audited statements, pp.7–8, Note 3 pp.14/16, Note 10 p.35 and Note 11 p.36. Historical PUF statements are indexed in the PUF report archive; each FY2006–2025 statement page appears in puf_cashflows_2006_2025.csv.
S4 — Audited performance: FY2025 Statement of Investment Performance Statistics, p.2 strategy returns, p.3 fee basis, p.4 calculation formula; August 2025 final summary, p.1 precise fund returns.
S5 — FY2026 year-end performance: August 2026 final summary, p.1 fund rows and assets; periods ending August 31, 2026. Downloaded primary PDF; no FY2026 audit claim.
S6 — Equity methodology/data: MSCI Index Calculation Methodology, pp.28–29 dividend withholding and p.80 ACWI identifier; public ACWI Net level endpoint, daily levels, USD, code 892400. Gross uses GRTR; monthly observations and exact query URLs appear in the raw CSVs.
S7 — Equity cross-check: iShares MSCI ACWI, embedded benchmark growth history and index identity; overlapping monthly observations through 2026.
S8 — Bond history: iShares Core U.S. Aggregate Bond ETF, embedded Bloomberg U.S. Aggregate benchmark growth history; fiscal endpoints FY2005–2026.
S9 — Budget and staff costs: Regents August 2026 Finance and Planning materials, agenda pp.85–92, Tables 1/3 and Exhibit B; FY2025 results, FY2026 forecast and FY2027 submitted budget. Earlier results: August 2019 materials, pp.141/146; August 2023 minutes, pp.133/138.
S10 — Broad fee disclosure: UTEP FY2025 endowment-statement guide, p.2 original UTIMCO LTF table and fee footnote; calendar fee observations displayed with FY2025 return reporting.
S11 — Earlier fee observation: NEDEAN Q1 2025 newsletter, p.12 original UTIMCO FY2024 LTF statement; calendar fee footnote. Contains a reproduction of UTIMCO’s original statement.
S12 — Policy benchmark: PUF Investment Policy Statement, 2026, p.12 Exhibit A and benchmark rules; effective September 1, 2026.
S13 — Smoothing method: Getmansky, Lo and Makarov, Journal of Financial Economics 74 (2004), pp.546–548, equations 20–33, and p.556, equations 59–62. Methodological reference; no UTIMCO observations.
S14 — Carry structure example: UTIMCO June 20, 2024 board materials, printed p.95/PDF p.96, “Evolving Real Estate Strategy”; illustrative LP/co-investment economics.
S15 — Compensation: UTIMCO June 19, 2025 board materials, p.166 section 5.2, performance period; pp.171–173 section 5.8, benchmark measurement and equally weighted one-/three-year peer components; pp.178–179 sections 5.12–5.13, deferral and recovery; p.184 section 8.24, peer definition.
S16 — Liquidity rules: UTIMCO Liquidity Policy, August 13, 2026, liquidity definitions, endowment limits and unfunded-commitment denominator. Independent of the FY2025 audited liquidity observation.
S17 — Broad endowment comparison: 2025 NACUBO–Commonfund Study press release, p.3 horizon-return table; NCSE FAQ, net-fee and average-return definitions; June 2025 endpoints.
S18 — Yale: FY2025 investment-return release, opening and decade-return paragraphs; June 30, 2025.
S19 — Stanford: FY2025 Merged Pool release, first substantive paragraph and cost/tax qualification; June 30, 2025 returns.
S20 — Harvard: Fact Book, Endowment, FY2016–2025 “Return on Investments” column; FY2015 Financial Report, p.10 Figure 2 for FY2006–2015. Long horizons calculated from rounded annual returns. Fact Book retrieved during the run; a later refresh returned a server error.
S21 — UVIMCO: 2025 Annual Report Highlights, p.2 Table 1 and footnote 2; June 30, 2025, own-management/incentive-fee exclusion.
S22 — Nevada: FY2025 Annual Comprehensive Financial Report, p.27 beginning/ending net position; p.57 expenses; pp.63–64 consultant’s net-return letter/footnote; p.69 allocation; p.76 private-manager fees already included in the expense schedule. Gross charts are not used as support for net returns.
S23 — Current peer updates: Yale FY2026, opening/decade paragraphs; Stanford FY2026, first substantive paragraph; Harvard FY2026 financial report, pp.12/27; UVIMCO FY2026 highlights, p.2 and footnote 2; Nevada June 2026 update, p.1, gross/preliminary labels.
S24 — Independent benchmark check: Community Foundation of Herkimer & Oneida Counties, August 2025 investment summary, p.2 benchmark table; ten-year 70/30 and 60/40 before expenses. Additional index cross-check URLs, source tags and numerical tolerances appear in the raw cross-check CSVs.
- S5 — FY2026 year-end performance: August 2026 final summary, p.1 fund rows and assets; periods ending August 31, 2026. Downloaded primary PDF; no FY2026 audit claim. ↩
- S12 — Policy benchmark: PUF Investment Policy Statement, 2026, p.12 Exhibit A and benchmark rules; effective September 1, 2026. ↩
- S6 — Equity methodology/data: MSCI Index Calculation Methodology, pp.28–29 dividend withholding and p.80 ACWI identifier; public ACWI Net level endpoint, daily levels, USD, code 892400. Gross uses
GRTR; monthly observations and exact query URLs appear in the raw CSVs. ↩ - S13 — Smoothing method: Getmansky, Lo and Makarov, Journal of Financial Economics 74 (2004), pp.546–548, equations 20–33, and p.556, equations 59–62. Methodological reference; no UTIMCO observations. ↩
- S3 — Fund audits: PUF FY2025 audited statements, pp.8–9, Note 3 pp.15/17, Note 10 p.36 and Note 12 pp.37–38, contingent support and expenses; GEF FY2025 audited statements, pp.7–8, Note 3 pp.14/16, Note 10 p.35 and Note 11 p.36. Historical PUF statements are indexed in the PUF report archive; each FY2006–2025 statement page appears in
puf_cashflows_2006_2025.csv. ↩ - S9 — Budget and staff costs: Regents August 2026 Finance and Planning materials, agenda pp.85–92, Tables 1/3 and Exhibit B; FY2025 results, FY2026 forecast and FY2027 submitted budget. Earlier results: August 2019 materials, pp.141/146; August 2023 minutes, pp.133/138. ↩
- S10 — Broad fee disclosure: UTEP FY2025 endowment-statement guide, p.2 original UTIMCO LTF table and fee footnote; calendar fee observations displayed with FY2025 return reporting. ↩
- S14 — Carry structure example: UTIMCO June 20, 2024 board materials, printed p.95/PDF p.96, “Evolving Real Estate Strategy”; illustrative LP/co-investment economics. ↩
- S15 — Compensation: UTIMCO June 19, 2025 board materials, p.166 section 5.2, performance period; pp.171–173 section 5.8, benchmark measurement and equally weighted one-/three-year peer components; pp.178–179 sections 5.12–5.13, deferral and recovery; p.184 section 8.24, peer definition. ↩
- S16 — Liquidity rules: UTIMCO Liquidity Policy, August 13, 2026, liquidity definitions, endowment limits and unfunded-commitment denominator. Independent of the FY2025 audited liquidity observation. ↩
- S17 — Broad endowment comparison: 2025 NACUBO–Commonfund Study press release, p.3 horizon-return table; NCSE FAQ, net-fee and average-return definitions; June 2025 endpoints. ↩
- S22 — Nevada: FY2025 Annual Comprehensive Financial Report, p.27 beginning/ending net position; p.57 expenses; pp.63–64 consultant’s net-return letter/footnote; p.69 allocation; p.76 private-manager fees already included in the expense schedule. Gross charts are not used as support for net returns. ↩
- S23 — Current peer updates: Yale FY2026, opening/decade paragraphs; Stanford FY2026, first substantive paragraph; Harvard FY2026 financial report, pp.12/27; UVIMCO FY2026 highlights, p.2 and footnote 2; Nevada June 2026 update, p.1, gross/preliminary labels. ↩
- S24 — Independent benchmark check: Community Foundation of Herkimer & Oneida Counties, August 2025 investment summary, p.2 benchmark table; ten-year 70/30 and 60/40 before expenses. Additional index cross-check URLs, source tags and numerical tolerances appear in the raw cross-check CSVs. ↩
Supporting material
- Excel model ↗Sourced inputs, live calculations and reported outputs.
- Source and model data (CSV collection) ↗Data tables, source references and calculation exports.
- Source register ↗Download as CSV.
- Annual fund returns 2006 2026 ↗Download as CSV.