Financial systems
RAP student loan calculator: What will you repay?
At $60,000 of starting income and debt, RAP starts at $250 a month. The 2026 rules also cap new federal graduate borrowing.
The short version
- I calculate that a borrower with $60,000 of debt and $60,000 of income repays about $123,459 under RAP, against $87,622 on the ten-year benchmark and $121,076 on the new 20-year Tiered Standard.
- RAP applies its income-band rate to all AGI, so for a single borrower with no dependents, one extra dollar, $60,000 to $60,001, lifts the monthly bill from $250 to $300.01.
- In 2024–25, resident tuition and fees exceeded $50,000 in 88 of 210 law-school records and 64 of 153 M.D. records.
- UT Austin’s resident first-year J.D. budget is $63,899, $13,899 over the $50,000 cap; the McCombs MBA is $59,371 over its $20,500 cap, before a mandatory student fee.
I calculate that a borrower starting with $60,000 in graduate debt and $60,000 in adjusted gross income would repay about $123,459 under RAP. The ten-year benchmark costs $87,622, and the new 20-year Tiered Standard costs $121,076. Under the November 12, 2026 rules, UT Austin’s first-year resident law budget exceeds the federal cap by $13,899.1, 15
The repayment example assumes 8.07% fixed interest, 3% annual income growth and zero dependents. It excludes the temporary autopay reduction. The school comparison subtracts the gross federal ceiling from the published budget before grants. It assumes a new borrower with no earlier graduate debt or transition protection.
Download the Excel model · Repayment grid · National tuition data · Current program budgets.
Compare monthly and lifetime student-loan payments
| Plan | First monthly payment | Total paid | Months | Balance forgiven |
|---|---|---|---|---|
| RAP | $250.00 | $90,000.00 | 360 | $42,000.00 |
| Standard | $504.48 | $121,075.46 | 240 | $0.00 |
Example arithmetic for general information. The example uses the 2026 HHS guideline for the contiguous states and D.C., a single borrower with eligible Direct unsubsidized debt, constant income, and zero prior qualifying payments. Any taxes at forgiveness are outside the calculation.
How much will I pay under RAP?
The example borrower starts at $250 a month and pays off the loan after 238 payments, or 19 years and 10 months. The total is $123,459. Discounting later payments at 4% gives a present value of $79,249.1
Present value puts payments made at different times into dollars at the start of repayment.
The table uses $60,000 in starting principal, $60,000 in starting adjusted gross income (AGI), 8.07% interest and 3% annual income growth. AGI is the income measure on a federal return after specified adjustments. The borrower is single, has only unsubsidized graduate debt and starts with no unpaid interest or prior qualifying payments. The model assumes poverty guidelines rise by 2.5% annually.1, 4, 5
| Comparison, modeled November 12, 2026 | First monthly bill | Total cash paid | Present value at 4% | Time until payoff or forgiveness | Balance forgiven |
|---|---|---|---|---|---|
| RAP | $250.00 | $123,459 | $79,249 | 19 years, 10 months | $0 |
| SAVE, unavailable counterfactual | $200.75 | $96,095 | $56,859 | 25 years | $57,247 |
| IBR at 10%, eligible legacy borrowers | $300.50 | $100,068 | $66,371 | 20 years | $56,540 |
| IBR at 15%, eligible older borrowers | $450.75 | $114,252 | $81,989 | 16 years, 4 months | $0 |
| Ten-year Standard benchmark | $730.19 | $87,622 | $72,363 | 10 years | $0 |
| New Tiered Standard | $504.48 | $121,076 | $83,771 | 20 years | $0 |
Complete monthly cash flows are in the base monthly paths. Whole-dollar lifetime results are rounded; required payments are rounded to cents and the final payment clears the remaining balance.
RAP repays $123,459 on a $60,000 loan, more than any other plan and $27,364 more than the former SAVE rules
Total cash paid and present value at a 4% discount, single borrower, $60,000 loan at 8.07%, $60,000 starting income growing 3% a year, USD
Numbers and method
| USD | Total cash paid | Present value at 4% discount |
|---|---|---|
| RAP | $123,459 | $79,249 |
| SAVE (counterfactual) | $96,095 | $56,859 |
| IBR, 10% vintage | $100,068 | $66,371 |
| IBR, 15% vintage | $114,252 | $81,989 |
| Standard, 10 years | $87,622 | $72,363 |
| Tiered Standard, 20 years | $121,076 | $83,771 |
Sources: 2026 final repayment rule, former SAVE rule, 2026–27 FSA loan rate and stated model assumptions, November 12, 2026. SAVE uses the former rules for comparison. IBR and ten-year Standard are available only to borrowers who meet the legacy rules.
RAP costs $35,837 more than ten-year Standard in lifetime dollars in this example. The difference falls to $6,886 in present value because more payments fall later. Against the new Tiered Standard plan for this balance, RAP costs $2,383 more in lifetime dollars and $4,521 less in present value.1
The Department’s official 2026–27 graduate Direct Unsubsidized rate is 8.07% for loans first disbursed from July 1, 2026 through June 30, 2027. Older loans keep the rates in force at disbursement. A temporary autopay incentive reduces eligible Direct Loan rates by one percentage point in total through June 30, 2028, with an enrollment deadline of December 31, 2026. This model excludes that incentive; applying the reduction to all future years would overstate it.4, 6
How is a RAP payment calculated?
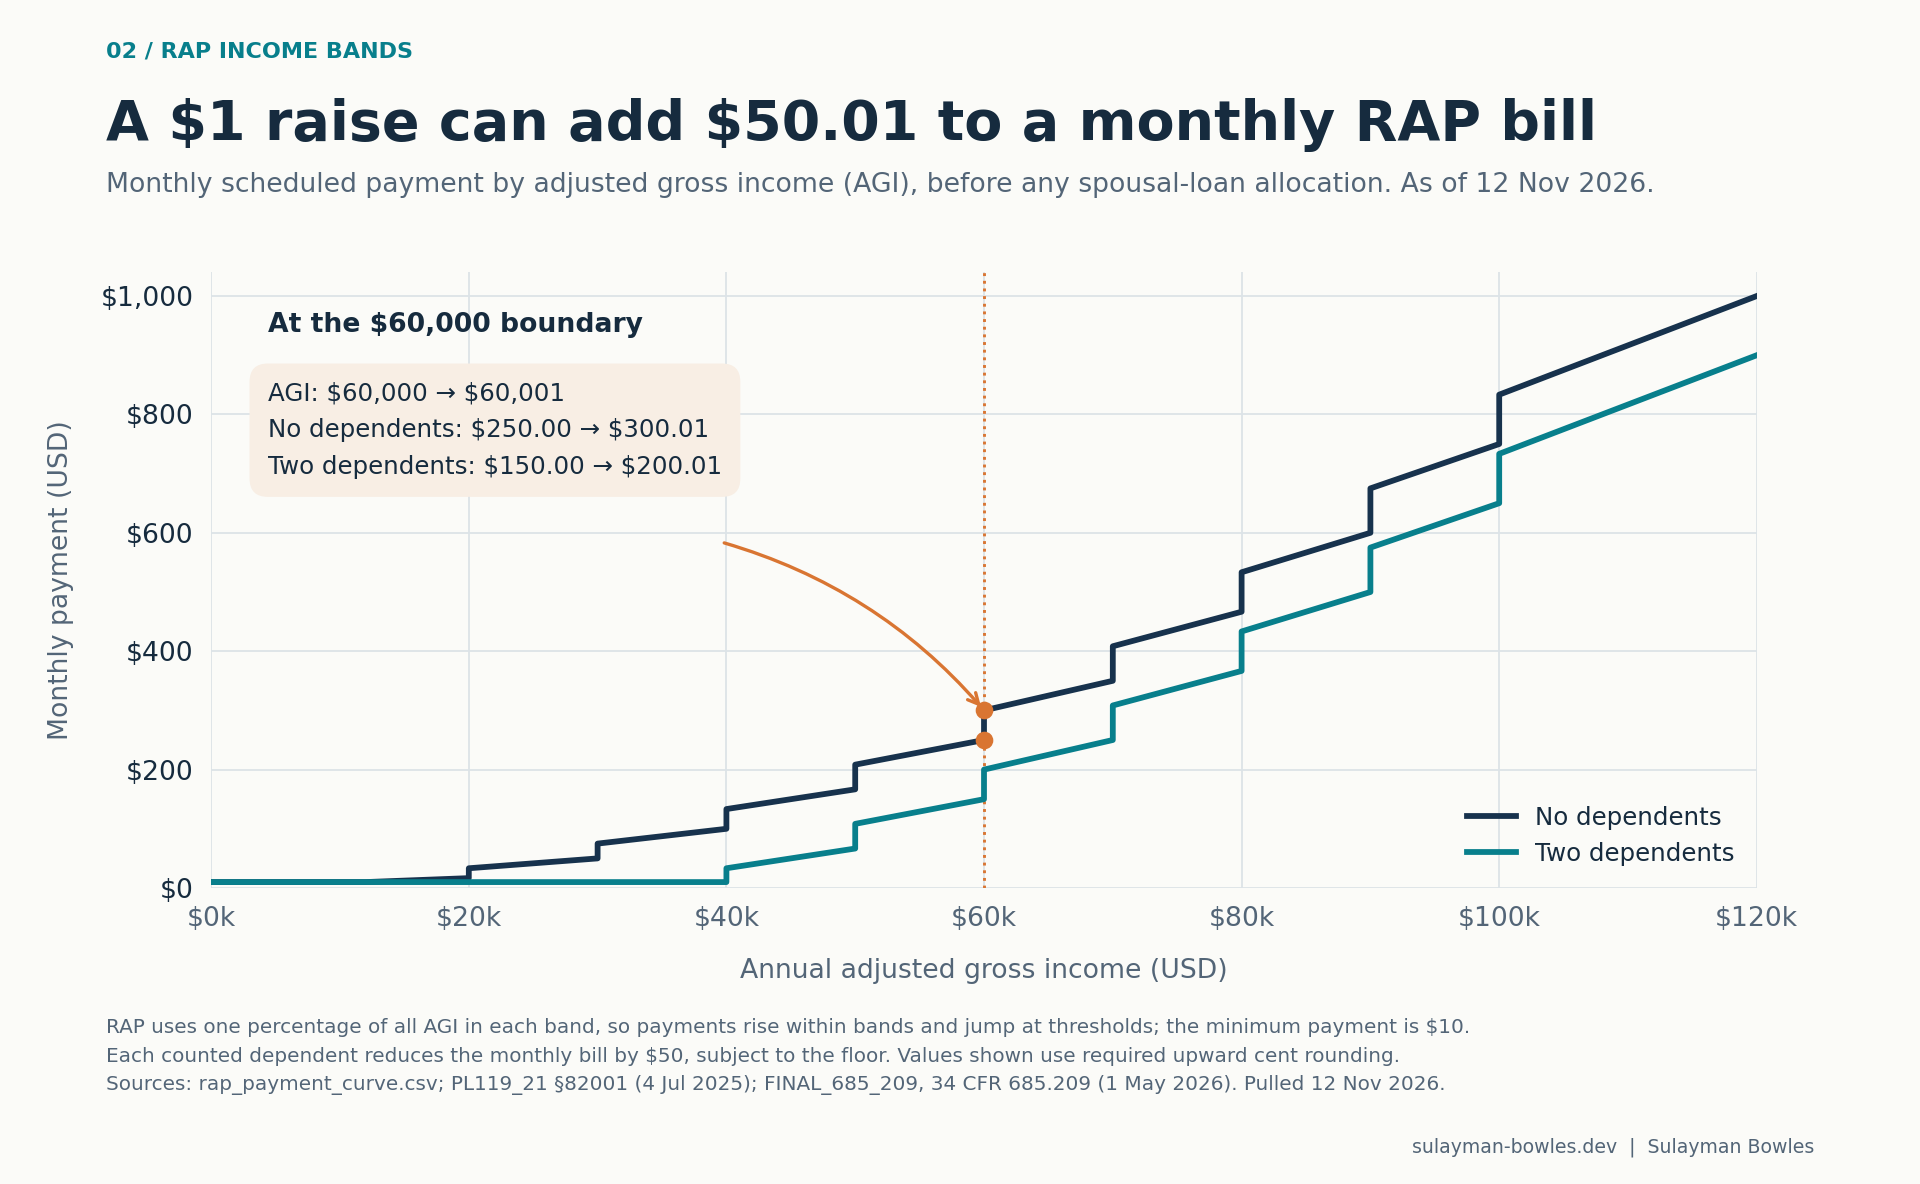
RAP applies an income-band percentage to all AGI, divides by twelve, subtracts $50 per tax dependent per month, and imposes a $10 monthly floor. These are whole-income bands, so a small income increase can cause a discrete increase in the bill.2, 3
| Annual AGI, current rule as of November 12, 2026 | Annual base before dependent credit |
|---|---|
| $10,000 or less | $120 |
| More than $10,000 through $20,000 | 1% of AGI |
| More than $20,000 through $30,000 | 2% |
| More than $30,000 through $40,000 | 3% |
| More than $40,000 through $50,000 | 4% |
| More than $50,000 through $60,000 | 5% |
| More than $60,000 through $70,000 | 6% |
| More than $70,000 through $80,000 | 7% |
| More than $80,000 through $90,000 | 8% |
| More than $90,000 through $100,000 | 9% |
| More than $100,000 | 10% |
For a single borrower without dependents, the monthly bill rises from $250 at $60,000 AGI to $300.01 at $60,001 after rounding. A one-dollar increase in annual income adds $50.01 a month, or $600.12 over twelve bills. The loan payment generally changes when the borrower recertifies income.3, 1
 (opens the full-size image)
After a full on-time payment, the government waives any remaining interest that accrued that month. It then adds enough principal assistance to bring the month’s principal reduction to the smaller of $50 or the borrower’s payment, limited by the outstanding principal. Interest that accrued before RAP remains due.2, 3
The statute uses the lesser of $50 or “the total amount paid by the borrower for such month,” then subtracts borrower-funded principal reduction. A $10 payer can therefore receive $10 of principal assistance. When a $205 payment covers $200 of interest and $5 of principal, the government adds $45 to principal reduction. The Department’s training examples reproduce both results.2, 7
General RAP forgiveness follows 360 qualifying payments over at least 30 years. Public Service Loan Forgiveness has its own rules. Existing qualifying credits can matter, but the published comparisons start at zero.2, 3
How does RAP work if I am married?
Joint filers use their combined AGI and claimed dependents. When both spouses have eligible debt, the payment after the dependent credit follows each person’s share of eligible principal plus interest. Each borrower has a $10 monthly minimum.3
| First bill, rules as of November 12, 2026 | Borrower | Spouse | Household |
|---|---|---|---|
| Joint AGI $100,000; two dependents; eligible debts $60,000/$40,000 | $390 | $260 | $650 |
| Same incomes on individual returns: $60,000 with two dependents; $40,000 with none | $150 | $100 | $250 |
| Joint AGI $100,000; two dependents; only one debtor | $650 | $0 | $650 |
| Joint AGI $10,000; two eligible debtors; no dependents | $10 | $10 | $20 |
Source: final rule, section 685.209(e) and (g), and married examples. The examples assume eligible debt and zero accrued interest. A comparison of filing status would also require taxes.
The workbook keeps spousal debt shares fixed between annual certifications and assumes both spouses use the same plan. The primary guidance does not say whether shares reallocate automatically after a spouse pays off midyear. Joint IBR lifetime results are omitted when the Standard-payment cap binds, because the order of the cap and spousal allocation is unclear.3
Is RAP cheaper than IBR or SAVE?
It depends chiefly on income growth, the interest rate and how long the balance remains outstanding. In this $60,000 example, the 3% income-growth case produces more lifetime RAP payments than either the 0% or 5% case.1
| RAP income-growth scenario | Annual AGI growth | Total cash paid | Present value at 4% | Repayment period | Forgiven |
|---|---|---|---|---|---|
| Low growth | 0% | $90,000 | $52,820 | 30 years | $42,000 |
| Base growth | 3% | $123,459 | $79,249 | 19 years, 10 months | $0 |
| High growth | 5% | $108,734 | $76,364 | 15 years, 2 months | $0 |
Source: growth cases, November 12, 2026.
With no income growth a RAP borrower pays $90,000 and has $42,000 forgiven; at 3% growth $123,459 and nothing forgiven
RAP total cash paid, present value at 4% and balance forgiven by income-growth scenario, $60,000 balance and starting income, 8.07% interest, USD
Numbers and method
| USD | Total cash paid | Present value at 4% | Balance forgiven |
|---|---|---|---|
| 0% income growth, 360 months | $90,000 | $52,820 | $42,000 |
| 3% income growth, 238 months | $123,459 | $79,249 | $0 |
| 5% income growth, 182 months | $108,734 | $76,364 | $0 |
Source: author’s monthly model under the November 12, 2026 rules. Starting principal and AGI $60,000; interest 8.07%; discount rate 4%; no dependents or autopay.
At zero income growth, the bill remains $250. Principal assistance reduces the balance, but $42,000 remains for forgiveness after thirty years. At 5% growth, higher later payments clear the loan faster. The base case occupies the middle ground: income rises enough to eliminate forgiveness, while interest accumulates over a longer payoff period than in the high-growth case.
Sensitivity: total RAP cash paid, nominal dollars
| Annual income growth | 6.00% interest | 8.07% interest | 10.00% interest |
|---|---|---|---|
| 0% | $90,000 | $90,000 | $90,000 |
| 1% | $132,059 | $135,943 | $135,943 |
| 3% | $105,034 | $123,459 | $139,154 |
| 5% | $95,052 | $108,734 | $121,560 |
Source: growth-rate sensitivity; starting principal and AGI fixed at $60,000, other assumptions unchanged. Equal cash totals can conceal different interest subsidies and forgiven balances.
The comparison models the complete 2023 SAVE design: payments based on income above 225% of the poverty guideline, weighted undergraduate/graduate rates of 5%/10%, and its forgiveness rules. IBR uses income above 150% of poverty, at 10% or 15% depending on eligibility, with the original ten-year Standard payment as a cap. The model tracks unpaid IBR interest apart from principal. It capitalizes interest only when a rule calls for it.8, 3
The lifetime totals add the payments the borrower makes. The calculation excludes taxes on forgiveness, default costs, school-period interest, loan fees and Public Service Loan Forgiveness.
What happened after SAVE ended?
The court ended SAVE on March 10, 2026. RAP opened July 1, 2026 under a final rule published May 1.9, 10, 3
FSA says the servicer notice gives a 90-day selection period, followed by a final 30-day notice. The borrower’s own notice gives the deadline. The remaining income-contingent repayment plans end by July 1, 2028.10, 2
Eligible borrowers whose loans all predate July 2026 can stay eligible for IBR, subject to its requirements. A new Direct Loan first disbursed on or after July 1 generally limits eligible Direct debt to RAP or the new Tiered Standard plan. Parent PLUS loans, including consolidations containing them, cannot enter RAP. Their legacy consolidation/IBR transition requires its own eligibility review.3, 11
Tiered Standard uses fixed payments over 10, 15, 20 or 25 years: respectively, balances below $25,000; $25,000 to below $50,000; $50,000 to below $100,000; and $100,000 or more. Thus the ten-year column above is a common comparison benchmark, while the new fixed-payment alternative for the example’s balance is twenty years.3
What is the new Grad PLUS loan cap?
For new borrowing without transition protection, Grad PLUS no longer fills the gap up to a graduate school’s cost of attendance. Starting July 1, 2026, graduate Direct borrowing is generally capped at $20,500 annually, or $50,000 for a qualifying professional program.2, 3
| Borrowing category, current November 12, 2026 | Gross annual ceiling | Aggregate ceiling |
|---|---|---|
| Graduate, never a professional student | $20,500 | $100,000 |
| Professional | $50,000 | $200,000 |
| Parent PLUS, all parents combined for one dependent student | $20,000 | $65,000 |
The student lifetime ceiling is $257,500, including undergraduate borrowing but excluding loans borrowed as a parent. Undergraduate loans are excluded from the graduate and professional aggregate limits. A graduate student who is or has been a professional student instead uses a $200,000 aggregate limit reduced by professional borrowing; the professional limit is reduced by graduate borrowing. The two categories do not create additive pots. Repayments can restore some graduate aggregate capacity, while the lifetime and Parent PLUS limits do not reset that way. Schools can set lower program limits, and less-than-full-time attendance reduces annual limits.2, 3
For graduate and professional students, the transition exception is program-specific: the student must have been enrolled in that program as of June 30, 2026 and received a Direct Loan for that program before July. Protection lasts the lesser of three academic years or the remaining expected time to credential; leaving the protected program generally ends it. For the Parent PLUS exception, the qualifying earlier Direct Loan may have been made either to the parent for that student’s program or to the student for that program. An unrelated older loan does not establish protection.3
Professional-degree coverage changed after the final rule. FSA’s current October 30 guidance implements court orders and temporarily includes qualifying MSN and DNP credentials, among other listed programs. MBA and social-work degrees remain under the graduate ceiling. The credential/CIP lookup lists the exact degree names and grouping rules. “CIP” is the federal Classification of Instructional Programs; the degree credential matters as well as the code.12
Which graduate programs cost more than the federal limit?
In 2024–25, resident tuition and required fees exceeded $50,000 in 88 of 210 law-school records, 64 of 153 M.D. records and 43 of 68 dentistry records.13
| IPEDS professional field, 2024–25 prices | Resident records above $50,000 | Nonresident records above $50,000 |
|---|---|---|
| Law, J.D./LL.B. | 88 / 210 · 41.9% | 103 / 210 · 49.0% |
| Medicine, M.D. | 64 / 153 · 41.8% | 132 / 151 · 87.4% |
| Osteopathic medicine, D.O. | 31 / 39 · 79.5% | 34 / 39 · 87.2% |
| Dentistry, D.D.S./D.M.D. | 43 / 68 · 63.2% | 62 / 68 · 91.2% |
Source: IPEDS 2024–25 tuition and fee fields, matched to Title IV institutions in the 50 states and D.C. The comparison uses complete positive price records by institution and field, with the July 2026 professional cap as the threshold.
Nonresident tuition and fees exceeded the $50,000 annual cap at 91% of dental programs and 87% of M.D. programs
Share of institution-field records with 2024-25 tuition and required fees above $50,000, by field and residency, %
Numbers and method
| % of records above $50,000 | Resident price | Nonresident price |
|---|---|---|
| Law | 41.9% | 49.0% |
| Medicine, M.D. | 41.8% | 87.4% |
| Medicine, D.O. | 79.5% | 87.2% |
| Dentistry | 63.2% | 91.2% |
Source: NCES IPEDS COST1_2024 and official dictionary, retrieved November 12, 2026. Prices cover 2024–25; the threshold is the July 2026 professional annual cap. Living costs and aid are excluded.
The downloadable lookup includes 1,542 raw records. The main comparison uses 1,393 complete positive records across nine professional fields.13, 30
A national full-cost gap and affected-student count are unavailable: IPEDS chiefly collects undergraduate budgets and selected professional tuition and fees, and an estimate would need program-level living costs, duration and enrollment. College Scorecard material I could access could not fill those gaps.14
The program-budget data include current named examples in law, medicine, dentistry, business, nursing and social work. Tuition above the cap shows a gap before living costs. Tuition below the cap leaves the full-budget result open.
How much is the funding gap at UT Austin?
UT Austin’s resident first-year J.D. budget is $63,899, leaving a $13,899 gross-cap difference for 2026–27. McCombs’ resident first-year MBA budget is $79,871, leaving $59,371, before an additional mandatory student fee.15, 16
| Current named example | Published budget | Gross annual cap | Published-budget gap |
|---|---|---|---|
| UT Austin J.D., resident, first year | $63,899 | $50,000 | $13,899 |
| UT Austin J.D., nonresident, first year | $82,485 | $50,000 | $32,485 |
| UT Austin MBA, resident, first year | $79,871 | $20,500 | $59,371 |
| UT Austin MBA, nonresident, first year | $85,889 | $20,500 | $65,389 |
| UTHealth Houston M.D., resident, first year | $62,316 | $50,000 | $12,316 |
| UTHealth Houston D.D.S., resident, first year | $95,020 | $50,000 | $45,020 |
| Columbia residential social-work master’s, first year | $104,216 | $20,500 | $83,716 |
| Nightingale MSN FNP, full-time off-campus budget | $39,583 | $50,000 | $0 |
UTHealth Houston and UT Austin are different institutions. The Nightingale comparison covers its published nine-month budget. Grants, prior borrowing and school-set limits affect the gaps.15, 16, 17, 18, 19
Published 2026-27 budgets exceed the gross annual loan cap by $12,316 to $83,716 at six of seven programs
Published budget split into the part within the gross annual federal cap and the part above it, selected full-time programs, USD
- Within the gross annual cap
- Above the cap
Numbers and method
| USD | Within the gross annual cap | Above the cap |
|---|---|---|
| UT Austin, J.D., Texas resident | $50,000 | $13,899 |
| UT Austin, J.D., Nonresident | $50,000 | $32,485 |
| UT Austin, MBA, Texas resident | $20,500 | $59,371 |
| UTHealth Houston, M.D., Texas resident | $50,000 | $12,316 |
| UTHealth Houston, D.D.S., Texas resident | $50,000 | $45,020 |
| Columbia, Social work, Two-year residential route | $20,500 | $83,716 |
| Nightingale, MSN FNP, Living off campus | $39,583 | $0 |
Sources: institutional 2026–27 budgets; current statutory and interim professional caps; retrieved November 12, 2026. The article gives the effect of McCombs’ additional $1,500 fee. All differences precede aid and loan fees.
For the resident J.D., holding today’s class-year budgets flat gives $63,899 + $62,261 + $62,261 = $188,421 over three years. Three $50,000 annual ceilings permit $150,000, producing a $38,421 flat-price gap. The nonresident counterpart is $92,579. Using the $200,000 aggregate limit alone would miss the annual constraint.15, 20
McCombs charges a $1,500 student fee outside its displayed budget. Adding it raises the resident first-year gap to $60,871. The 1.057% Direct Loan origination fee reduces $20,500 of gross borrowing by $216.68, making the fee-inclusive difference against net proceeds $61,087.68. Its $2,000 admission deposit is credited toward tuition and is not added again. The source page mixes current budgets with older aid language; the arithmetic here uses the explicitly dated cost table.16, 21, 20
For other UT programs, the verified inputs are narrower. The full-time two-year MSSW route has tuition-only annual costs of $14,108 resident/$27,066 nonresident for two 15-credit semesters, giving a $6,566 nonresident tuition-only gap. Dell M.D. lists $22,074/$37,138 annual tuition and fees for the 2026 entering class. The post-MSN DNP lists $30,000 across five consecutive semesters. Program-specific full living budgets remain unverified for Dell M.D., MSSW, MSN and DNP; the full-cost gaps remain unknown.22, 14
What would a private loan for the gap cost?
Financing the MBA example’s $59,371 published-budget gap over ten years at a stated 11% fixed note rate would require about $818 monthly and $98,140 in total payments. This example starts repayment immediately and excludes school-period deferral and fees.23
| Assumed fixed note rate | Monthly payment | Total paid over ten years | Interest paid |
|---|---|---|---|
| 8% | $720 | $86,440 | $27,069 |
| 11% | $818 | $98,140 | $38,769 |
| 15% | $958 | $114,943 | $55,572 |
Source: private gap scenarios, calculated November 12, 2026. The amount excludes the additional MBA fee, to match the published-budget comparison above.
A $59,371 private loan costs $720 a month at an 8% note rate and $958 at 15%
Monthly payment on a $59,371 ten-year loan with immediate principal-and-interest payments, by assumed note rate, USD
Numbers and method
| USD per month | Monthly payment |
|---|---|
| 8% note rate | $720.33 |
| 11% note rate | $817.84 |
| 15% note rate | $957.86 |
Source: author’s standard monthly amortization calculation, November 12, 2026. The model uses assumed note rates.
The published market has a wide spread. Sallie Mae displayed 2.29%–14.99% fixed APR for graduate loans, with the low end conditional on credit, repayment choice and discounts. SoFi’s ten-year immediate-payment table showed 8.57%–14.83% fixed APR. APR is an annualized financing-cost measure and, especially with deferred payments, is not the same as a note rate.24
Lenders already report growth. SLM’s Q3 2026 filing records $575.905 million of graduate originations, versus $263.313 million in Q3 2025: 118.7% growth, rounded to 119% in its release. Its category includes some graduate-status Parent and Smart Option loans. The company’s 2025 annual report expected a “gradual and positive impact” from the federal changes. The observed increase is consistent with that expectation, but it does not isolate the law’s causal effect.25
Have default collections and wage garnishment resumed?
The latest primary policy I found delays involuntary collections; I found no restart date as of November 12, 2026. The Department’s January notice paused administrative wage garnishment and Treasury offsets, and its May final rule explicitly says collections were paused.26
FSA counted $1,724.5 billion in federal student loans and 42.3 million recipients at June 30, 2026. The narrower federally managed loan-status table shows $234.1 billion in default and 9.3 million recipients with defaulted debt. A borrower can appear in more than one status.27
At September 30, 2026, the New York Fed’s credit panel showed 10.92% of student debt at least 90 days delinquent. The annualized rate of new transitions into serious delinquency was 7.72%. One figure measures debt already behind and the other measures balances newly falling behind.28
$234.1 billion of federally managed student loans is in default, against $658.5 billion in repayment
Federally managed loan balance by status, June 30, 2026, USD billions
Show the numbers
| USD billions | Balance |
|---|---|
| Repayment | 658.5 |
| Forbearance | 459.2 |
| Default | 234.1 |
| Deferment | 149.7 |
| In school | 96.7 |
| Grace | 36.0 |
| Other | 8.9 |
The share of student balances 90 or more days late reached 10.9% in 2026 Q3; new delinquency peaked at 16.2% in 2025 Q4
Share of student-loan balances 90+ days late (stock) and annualized flow into 90+ days, %, quarterly, 2019 Q1 to 2026 Q3
Numbers and method
| % | Stock: balance 90+ days late | Annualized flow into 90+ days |
|---|---|---|
| 2019 Q1 | 10.9% | 9.4% |
| 2019 Q2 | 10.8% | 9.9% |
| 2019 Q3 | 10.9% | 9.3% |
| 2019 Q4 | 11.1% | 9.2% |
| 2020 Q1 | 10.8% | 8.9% |
| 2020 Q2 | 7.0% | 6.5% |
| 2020 Q3 | 6.5% | 4.4% |
| 2020 Q4 | 6.5% | 2.8% |
| 2021 Q1 | 6.2% | 1.0% |
| 2021 Q2 | 5.7% | 1.0% |
| 2021 Q3 | 5.3% | 1.1% |
| 2021 Q4 | 5.0% | 1.1% |
| 2022 Q1 | 4.7% | 1.1% |
| 2022 Q2 | 4.6% | 1.0% |
| 2022 Q3 | 3.9% | 1.0% |
| 2022 Q4 | 0.9% | 1.0% |
| 2023 Q1 | 0.7% | 0.9% |
| 2023 Q2 | 0.6% | 0.9% |
| 2023 Q3 | 0.7% | 0.8% |
| 2023 Q4 | 0.6% | 0.8% |
| 2024 Q1 | 0.6% | 0.8% |
| 2024 Q2 | 0.7% | 0.8% |
| 2024 Q3 | 0.5% | 0.8% |
| 2024 Q4 | 0.5% | 0.7% |
| 2025 Q1 | 7.7% | 8.0% |
| 2025 Q2 | 10.2% | 12.9% |
| 2025 Q3 | 9.4% | 14.3% |
| 2025 Q4 | 9.6% | 16.2% |
| 2026 Q1 | 10.3% | 10.9% |
| 2026 Q2 | 10.6% | 7.8% |
| 2026 Q3 | 10.9% | 7.7% |
Sources: FSA June 30, 2026 status data, released September 22; New York Fed September 30, 2026 credit-panel data, released November 10. Universes, dates and units differ.
How much does the government expect to save?
CBO estimates about $284 billion less in higher-education-related primary deficits over FY2025–34, relative to its January 2025 baseline. Its estimate includes interactions among the law’s provisions.29
The detailed July 2025 score assigns $44.170 billion lower outlays to borrowing limits and the end of Grad PLUS, $270.520 billion lower outlays to repayment changes, and $35.760 billion higher outlays to interactions. The full education-committee title totals $284.022 billion in lower outlays; removing its $338 million of unrelated Garden of Heroes/refugee spending yields $284.360 billion for the higher-education grouping. The report uses CBO’s rounded $284 billion headline.29
CBO scores Title VIII at $284 billion in savings: $319.8 billion from three provisions, less $35.8 billion from interactions
Change in estimated outlays, fiscal 2025 to 2034, against CBO's January 2025 baseline, USD billions; positive is savings
Numbers and method
| USD billions | Savings in estimated outlays |
|---|---|
| Loan limits and Grad PLUS | 44.2 |
| Loan repayment | 270.5 |
| Other Title VIII provisions | 5.1 |
| Interactions | −35.8 |
| Net Title VIII | 284.0 |
Source: CBO July 21, 2025 enacted-law workbook, Title VIII; fiscal 2025–2034; January 2025 baseline. Credit-program estimates reflect present-value accounting (retrieved November 12, 2026).
What would change these answers?
Repayment depends on the interest rate, income path and qualifying payment credits. Program gaps depend on grants, school-set limits, transition protection and the school’s current budget.
The next scheduled full refresh is July 1, 2027, when the next federal disbursement-rate year begins. Refresh earlier if a court changes professional-degree treatment, FSA changes the interim CIP table or repayment implementation, the autopay program changes, or a primary notice announces collections restarting. Update the poverty inputs when HHS publishes its 2027 guidelines and replace each school’s table when its 2027–28 budget appears.
The on-page calculator holds income and the poverty guideline constant for a single borrower with eligible Direct Unsubsidized debt. With the same $60,000 balance, 8.07% rate and $60,000 AGI held flat, RAP starts at $250, collects $90,000 over 30 years and forgives $42,000 in this illustration. The workbook uses changing income for the opening example and includes married and legacy comparisons.1
Who owns Austin’s apartments? covers part of the local market behind students’ living expenses. The lease-versus-debt analysis shows how the timing of payments changes their present value.
How can I reproduce the results?
Each month accrues interest on the principal at one-twelfth of the annual rate. Payments cover outstanding interest first. The workbook then applies any eligible interest waiver or principal match. Income and family inputs update annually. Present value discounts month-end payments by (1 + annual discount rate)^(month / 12).
The repayment grid tests eight starting balances between $10,000 and $300,000 and eight incomes between $30,000 and $200,000. The Excel model includes the monthly calculations and live sensitivity tables.
FSA publishes rounded portfolio totals, and its status and delinquency tables can use different reporting dates.
Questions about RAP and graduate borrowing
Does RAP use marginal income brackets?
RAP applies the band’s rate to all adjusted gross income. With no dependents, the monthly bill rises from $250 at $60,000 AGI to $300.01 at $60,001 after cent rounding.
Does everyone on RAP receive a $50 principal match?
Principal assistance tops up the borrower’s principal reduction to the smaller of $50 or the monthly payment, limited by the remaining balance. A borrower paying $10 can receive up to $10.
Is SAVE still available?
A court judgment ended SAVE on March 10, 2026. The table models the former SAVE rules for comparison. Available plans depend on when the borrower received the loans and what type they are.
Are nursing graduate degrees subject to the $20,500 limit?
Qualifying MSN and DNP credentials currently receive professional treatment under FSA’s October 30, 2026 court-order guidance, with a $50,000 gross annual federal ceiling. Exact credentials, institutional limits and later court changes matter.
How large is UT Austin’s resident first-year MBA gap?
The published 2026–27 resident MBA budget exceeds the $20,500 gross federal cap by $59,371. A required $1,500 student fee raises the gap to $60,871 before grants and loan origination fees.
Sources and calculation notes
The source registry gives document dates, locators, public URLs and the November 12, 2026 pull date. Reported figures maps report calculations to workbook cells and compact source data, and school-budget inputs maps each school’s budget inputs. Complete official datasets are at their official download URLs.
- Author calculations,
Student_Loan_Rules_2026_Model.xlsx, Inputs, Monthly calculations, Outputs and sensitivity tables; base comparison, growth cases. Rule sources S01/S02/S05; all assumptions indata/model_config.json; calculated November 12, 2026. ↩ - Public Law 119-21, July 4, 2025, sections 81001 and 82001, 139 Stat. 334–346; 20 U.S.C. 1087e, especially (a) and (q) (retrieved November 12, 2026). ↩
- RISE final rule, May 1, 2026, 91 FR 23768–23901, especially 34 CFR 685.200, .203, .208–.210; effective July 1, 2026 (retrieved November 12, 2026). ↩
- FSA GENERAL-26-33, June 4, 2026, loan-type rate table for July 1, 2026–June 30, 2027 disbursements (retrieved November 12, 2026). ↩
- HHS 2026 poverty guidelines, January 15, 2026, 91 FR 1797–1798; contiguous-state first-person amount $15,960 and additional-person amount $5,680. Future 2.5% increases are assumptions. ↩
- ED announcement extending autopay enrollment, September 29, 2026, opening and eligibility paragraphs; source ED_AUTOPAY_EXTENDED. Enrollment deadline December 31, 2026; temporary benefit window July 1, 2026–June 30, 2028. ↩
- FSA, The Future of Federal Loan Repayment—Servicing and System Impacts, March 2026, slides 25, 28, 30–31. Slide 25’s $25,000 example prints 3% but calculates the statutory 2%; the source register records both. ↩
- 2023 SAVE final rule, July 10, 2023, 88 FR 43820–43905, 34 CFR 685.209. Historical counterfactual only. ↩
- Eastern District of Missouri order, ECF 102, March 10, 2026, pages 1–2. The order vacated the SAVE rule except for the specified deferment and forbearance provision. ↩
- FSA SAVE court-action FAQ, current November 12, 2026, transition-notice section; source FSA_SAVE_CURRENT. ↩
- FSA repayment-plan guidance, current November 12, 2026, income-driven repayment eligibility and post-July borrowing restriction; final rule 685.209 also controls. ↩
- Federal Student Aid interim professional-degree list, updated October 30, 2026. The announcement describes the court orders and lists the eligible CIP codes and credentials. ↩
- NCES COST1_2024 data and official dictionary; professional tuition/fee variables ISPROF, OSPROF, ISPFEE and OSPFEE, fields 1–9. Historical scope uses HD2024; display names use HD2025.
National tuition screenand the CSV document every included/excluded record. ↩ - NCES Cost survey scope, official IPEDS files and College Scorecard data/documentation retrieval log;
data/national_gap_coverage.csv,sources/missing_source_retrievals.csv, andprogram_gap_methodology.md. All checked November 12, 2026. ↩ - Texas Law cost of attendance, 2026–27 first-year and continuing-student annual budgets; three-year J.D. program (retrieved November 12, 2026). ↩
- McCombs full-time MBA tuition and financial aid, explicitly labeled first-year Fall 2026/Spring 2027 budget, mandatory student fee, deposit-credit note and exclusions (retrieved November 12, 2026). ↩
- UTHealth Houston 2026–27 budget PDF.pdf), M.D. and D.D.S. class-year/residency tables; exact page locators in program source registry (retrieved November 12, 2026). ↩
- Columbia residential social-work 2026–27 COA, two-year program first-year table; includes potentially waivable medical insurance (retrieved November 12, 2026). ↩
- Nightingale graduate COA 2026–27, full-time MSN FNP off-campus nine-month budget (retrieved November 12, 2026). ↩
- Author calculations,
Program gapsandReport calculations; program source values and stated annual/aggregate cap inputs. The scenarios hold current class-year budgets flat. ↩ - FSA FY27 sequester changes, May 13, 2026, Direct Loan origination fee table and truncation convention (retrieved November 12, 2026). ↩
- UT tuition tables, 2026–27, social-work 15-credit rates; UT One Stop tuition rates, Dell M.D. 2026 entering class; post-MSN DNP tuition. Program-duration sources appear in
sources/program_source_values.csv. ↩ - Author PMT calculation for $59,371, 120 months, assumed fixed note rates 8%/11%/15%, immediate payment and no fees. Calculated November 12, 2026; workbook
Report calculations. ↩ - Sallie Mae graduate loan rates, advertised October 26, 2026; SoFi graduate rates, November 12, 2026, ten-year immediate-payment table. Retrieved November 12, 2026; full terms preserved in
data/loan_rate_inputs.csv. ↩ - SLM Q3 2026 10-Q, p. 61 origination table and footnote 2; fiscal 2025 Form 10-K, p. 47, full EDGAR URL in source PB17 (retrieved November 12, 2026). ↩
- ED January 16 involuntary-collections delay and May 1 final rule. The source register gives locators for these notices and the September 30 Treasury support-center announcement. ↩
- FSA Portfolio Summary and Portfolio by Loan Status, June 30, 2026, released September 22; workbook source rows/cells in compact CSVs (retrieved November 12, 2026). ↩
- New York Fed Q3 2026 source workbook, Page 12 Data and Page 14 Data, observation September 30, 2026; released November 10. The cell locators are in
data/nyfed_student_debt_history.csv. ↩ - CBO enacted-law workbook, July 21, 2025, Title VIII cells O32, O42, O135 and O139; CBO February 2026 Budget and Economic Outlook, higher-education discussion, source PB09. Scoring window FY2025–2034 and January 2025 baseline. ↩
- Source register and reported figures, with the underlying document links, locators and calculation references. ↩
Supporting material
- Excel model (XLSX file) Sourced inputs, live calculations and reported outputs.
- Source and model data (CSV collection) (ZIP file) Data tables, source references and calculation exports.
- Source registry (CSV file) Download as CSV.
- Repayment grid (CSV file) Download as CSV.
- Base monthly paths (CSV file) Download as CSV.
- Program gap table (CSV file) Download as CSV.
- National professional tuition screen (CSV file) Download as CSV.
- Professional programs interim 2026-10-30 (CSV file) Download as CSV.