Financial systems
Southwest after Elliott
Third-quarter revenue rose 21.2%. Baggage fees climbed, while Southwest lost share in a sample of 984 competitive markets.
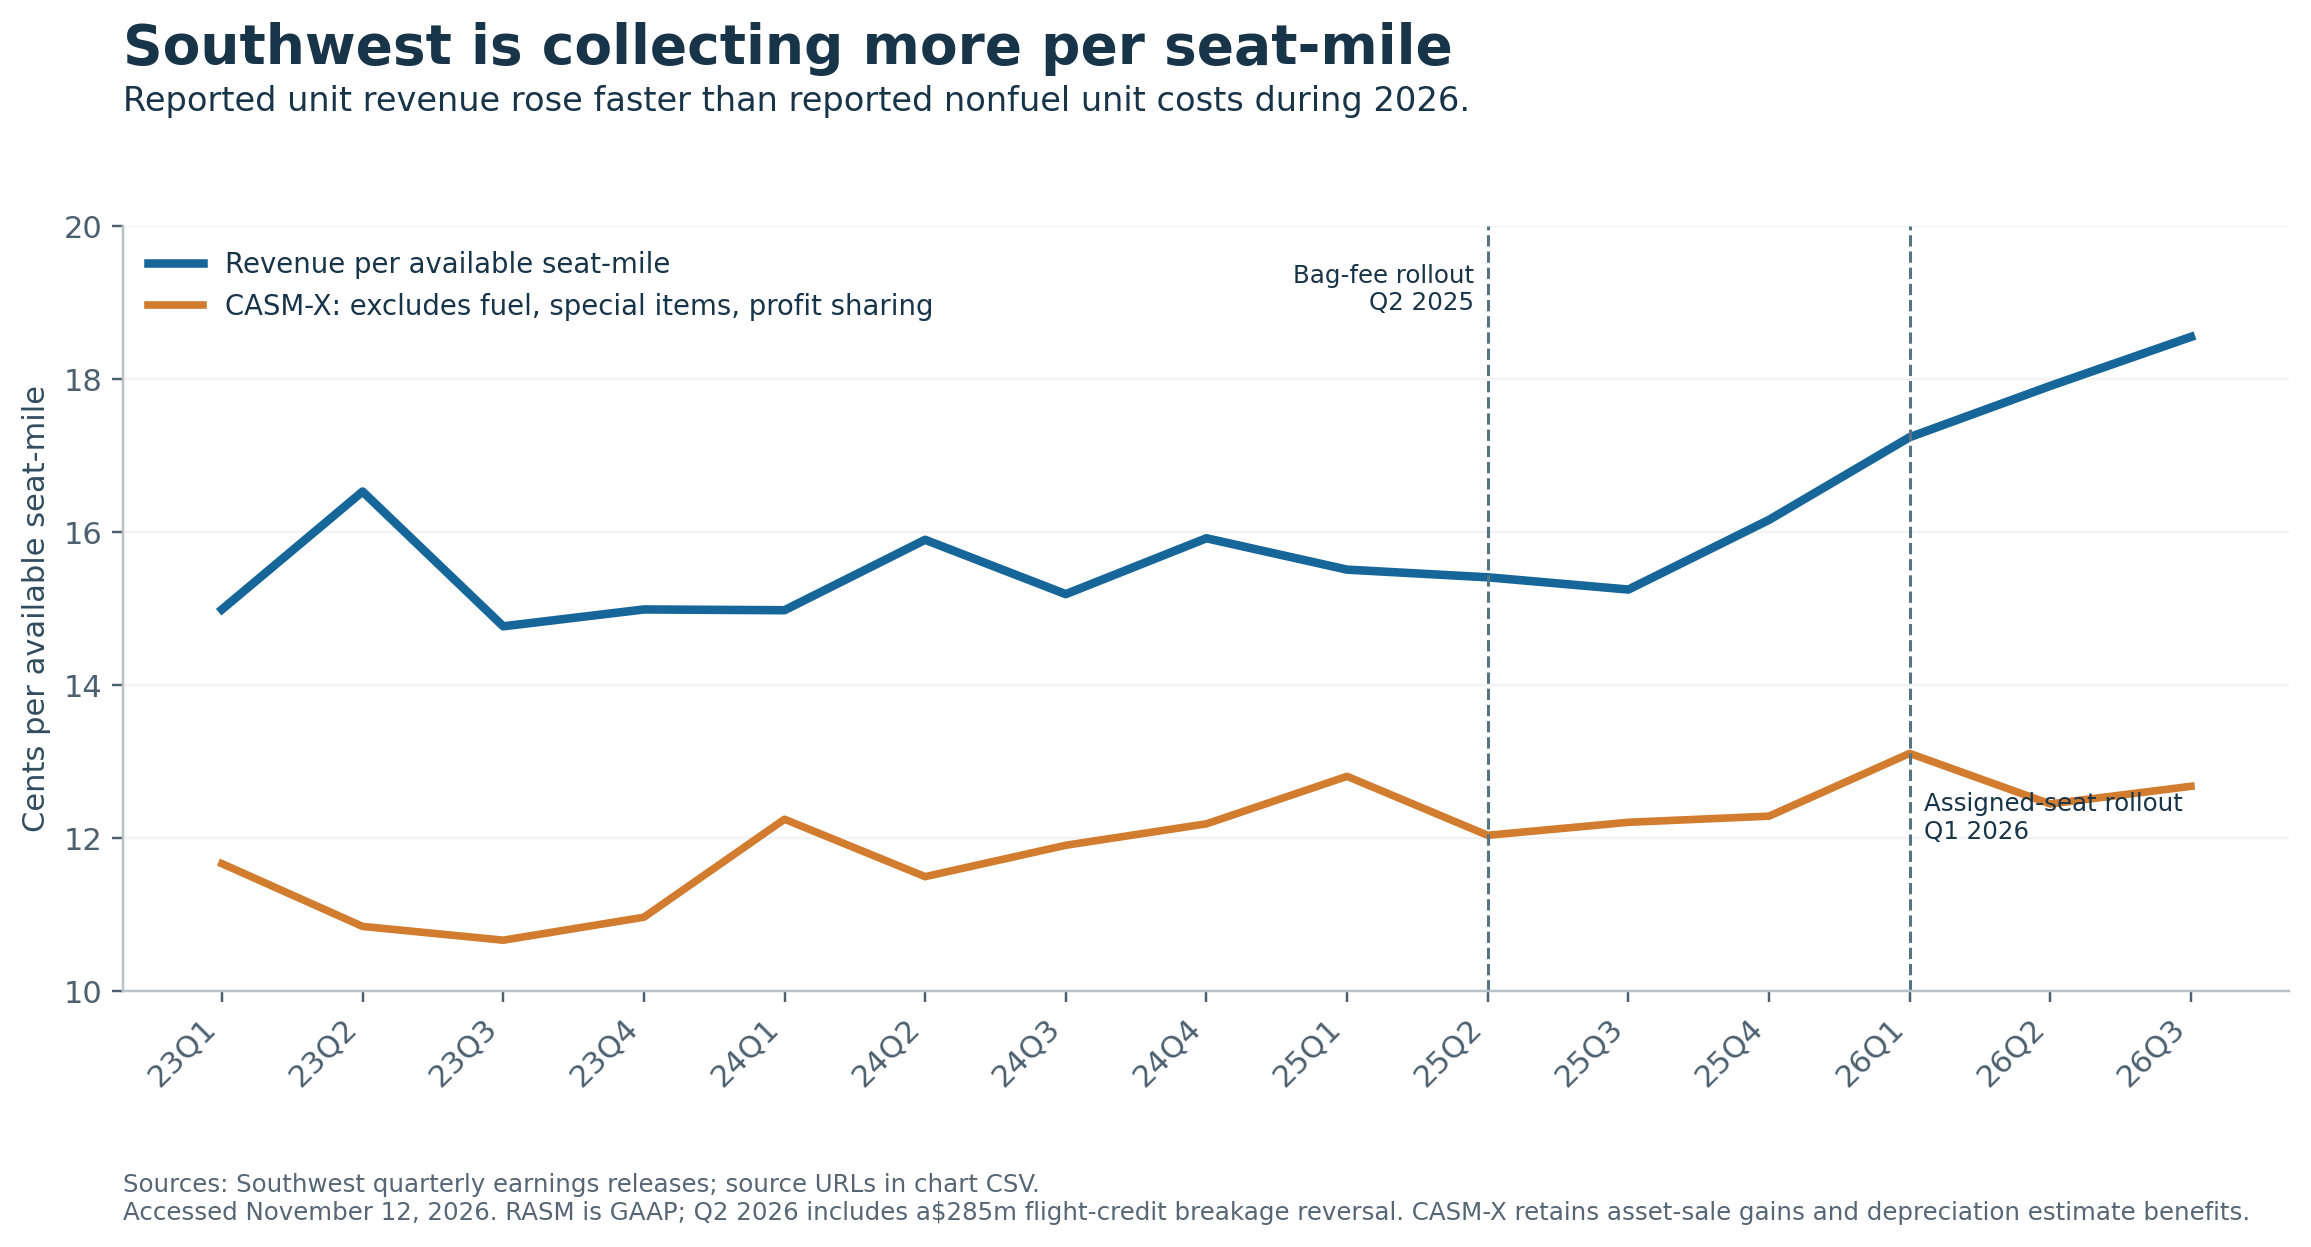
Southwest’s revenue improvement has exceeded the deterioration visible in its aggregate operating results. How much came from ending free bags and open seating remains unknown, as does the number of customers who left in response. The strongest supportable conclusion is that the new commercial model is monetizing traffic more effectively while some competitive markets and service measures show pressure.
The airline reported third-quarter 2026 revenue of $8.422 billion, up 21.2%, and revenue per available seat-mile, or RASM, up 21.6%. Revenue passenger-miles and available seat-miles both slipped about 0.4%, leaving load factor at 79.8%. These are substantial revenue gains with essentially unchanged miles flown by paying passengers. They are not evidence that Southwest attracted 21% more customers. Southwest’s Q3 results
Three qualifications determine the investment interpretation:
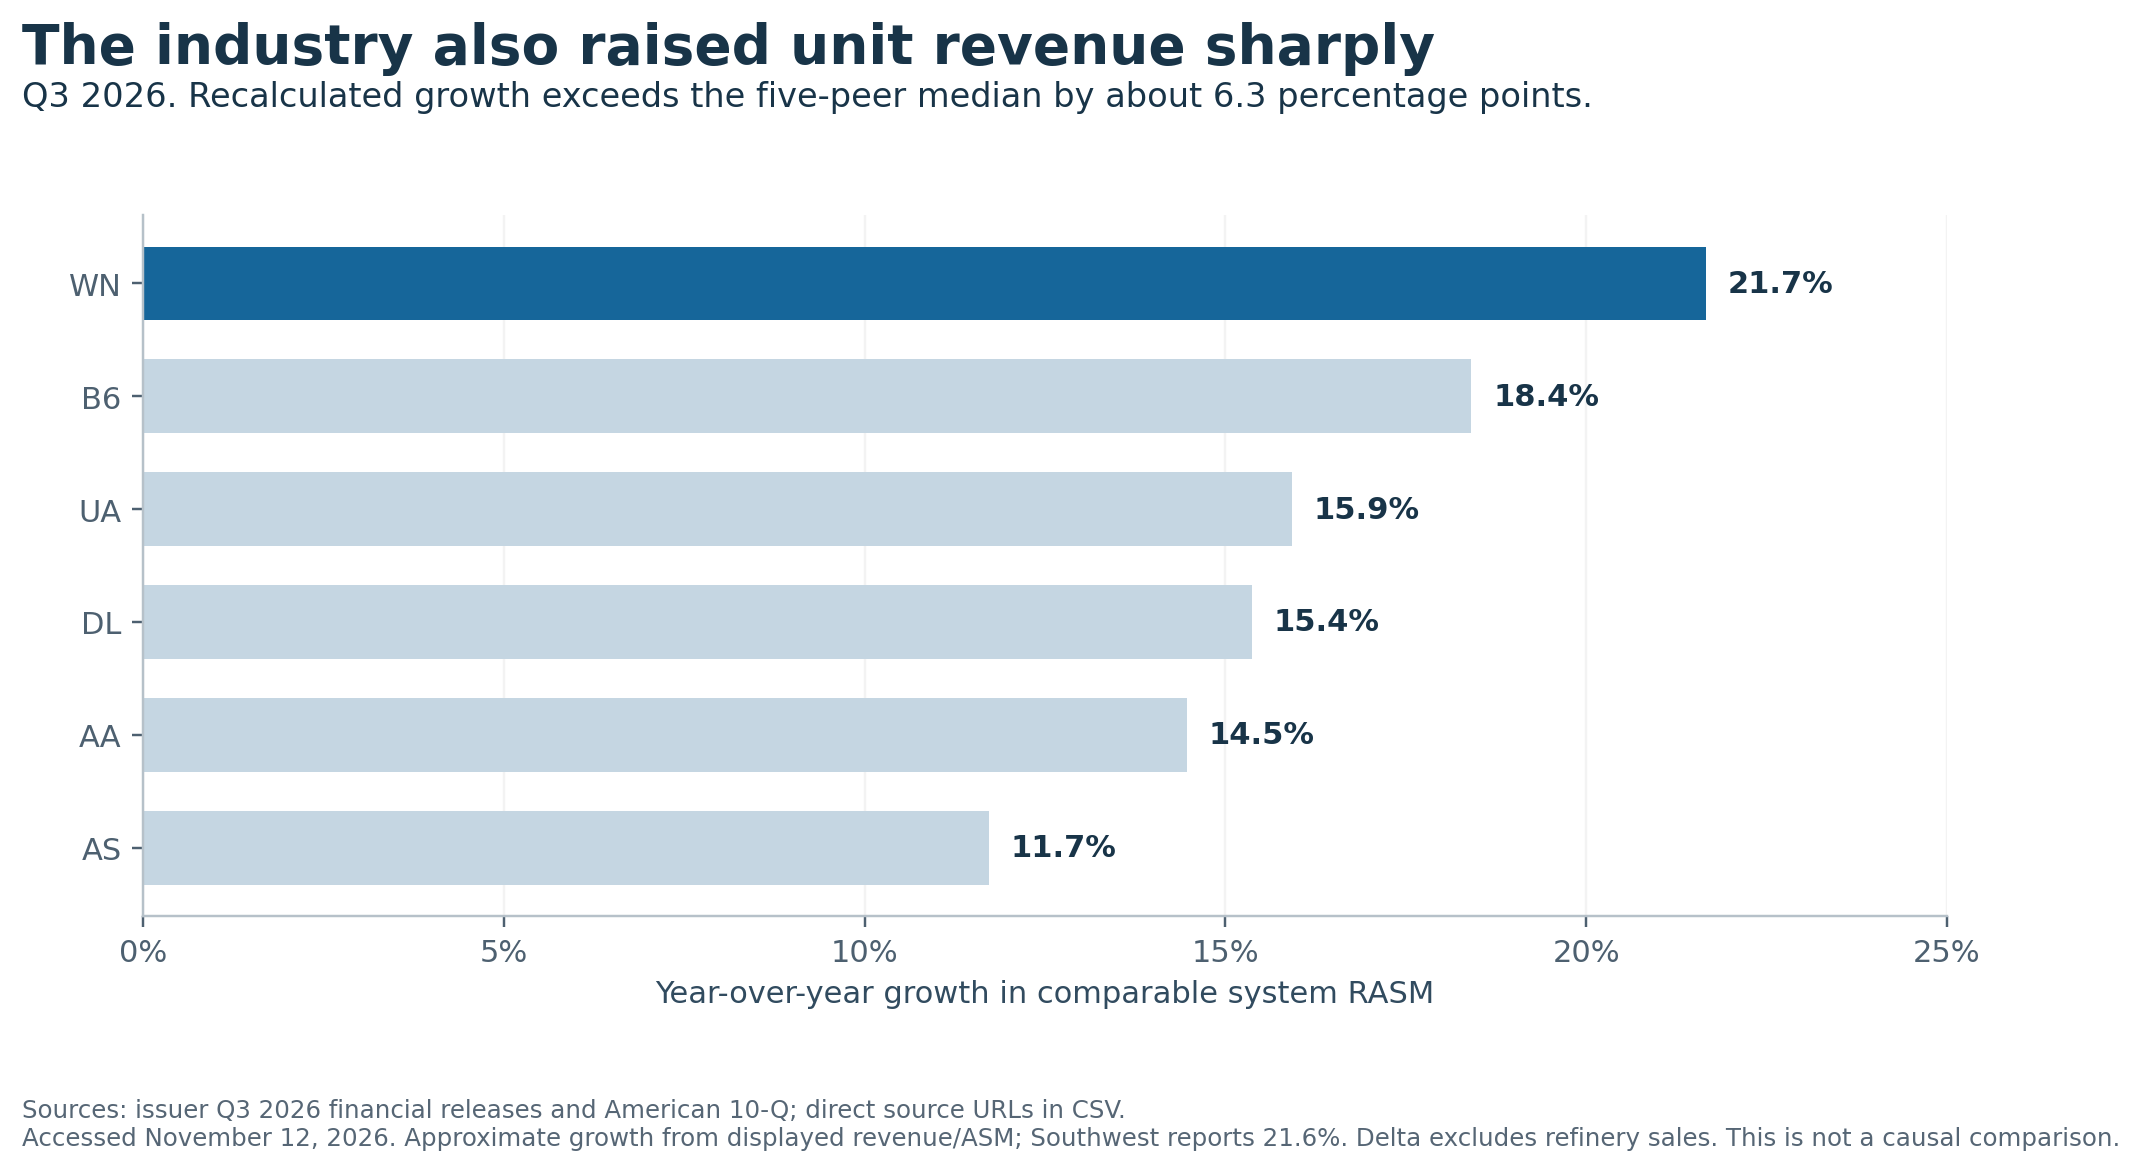
- The industry also raised revenue sharply. A calculation from the five peers’ published revenue and capacity puts their median Q3 unit-revenue growth at approximately 15.4%. Southwest’s growth exceeded the peer median by about six percentage points. A simple peer-growth benchmark leaves approximately $435 million of Q3 revenue unexplained by that common benchmark. That residual describes a gap after the peer adjustment. The effect of the policy changes remains unknown. [S01, S28–S32]
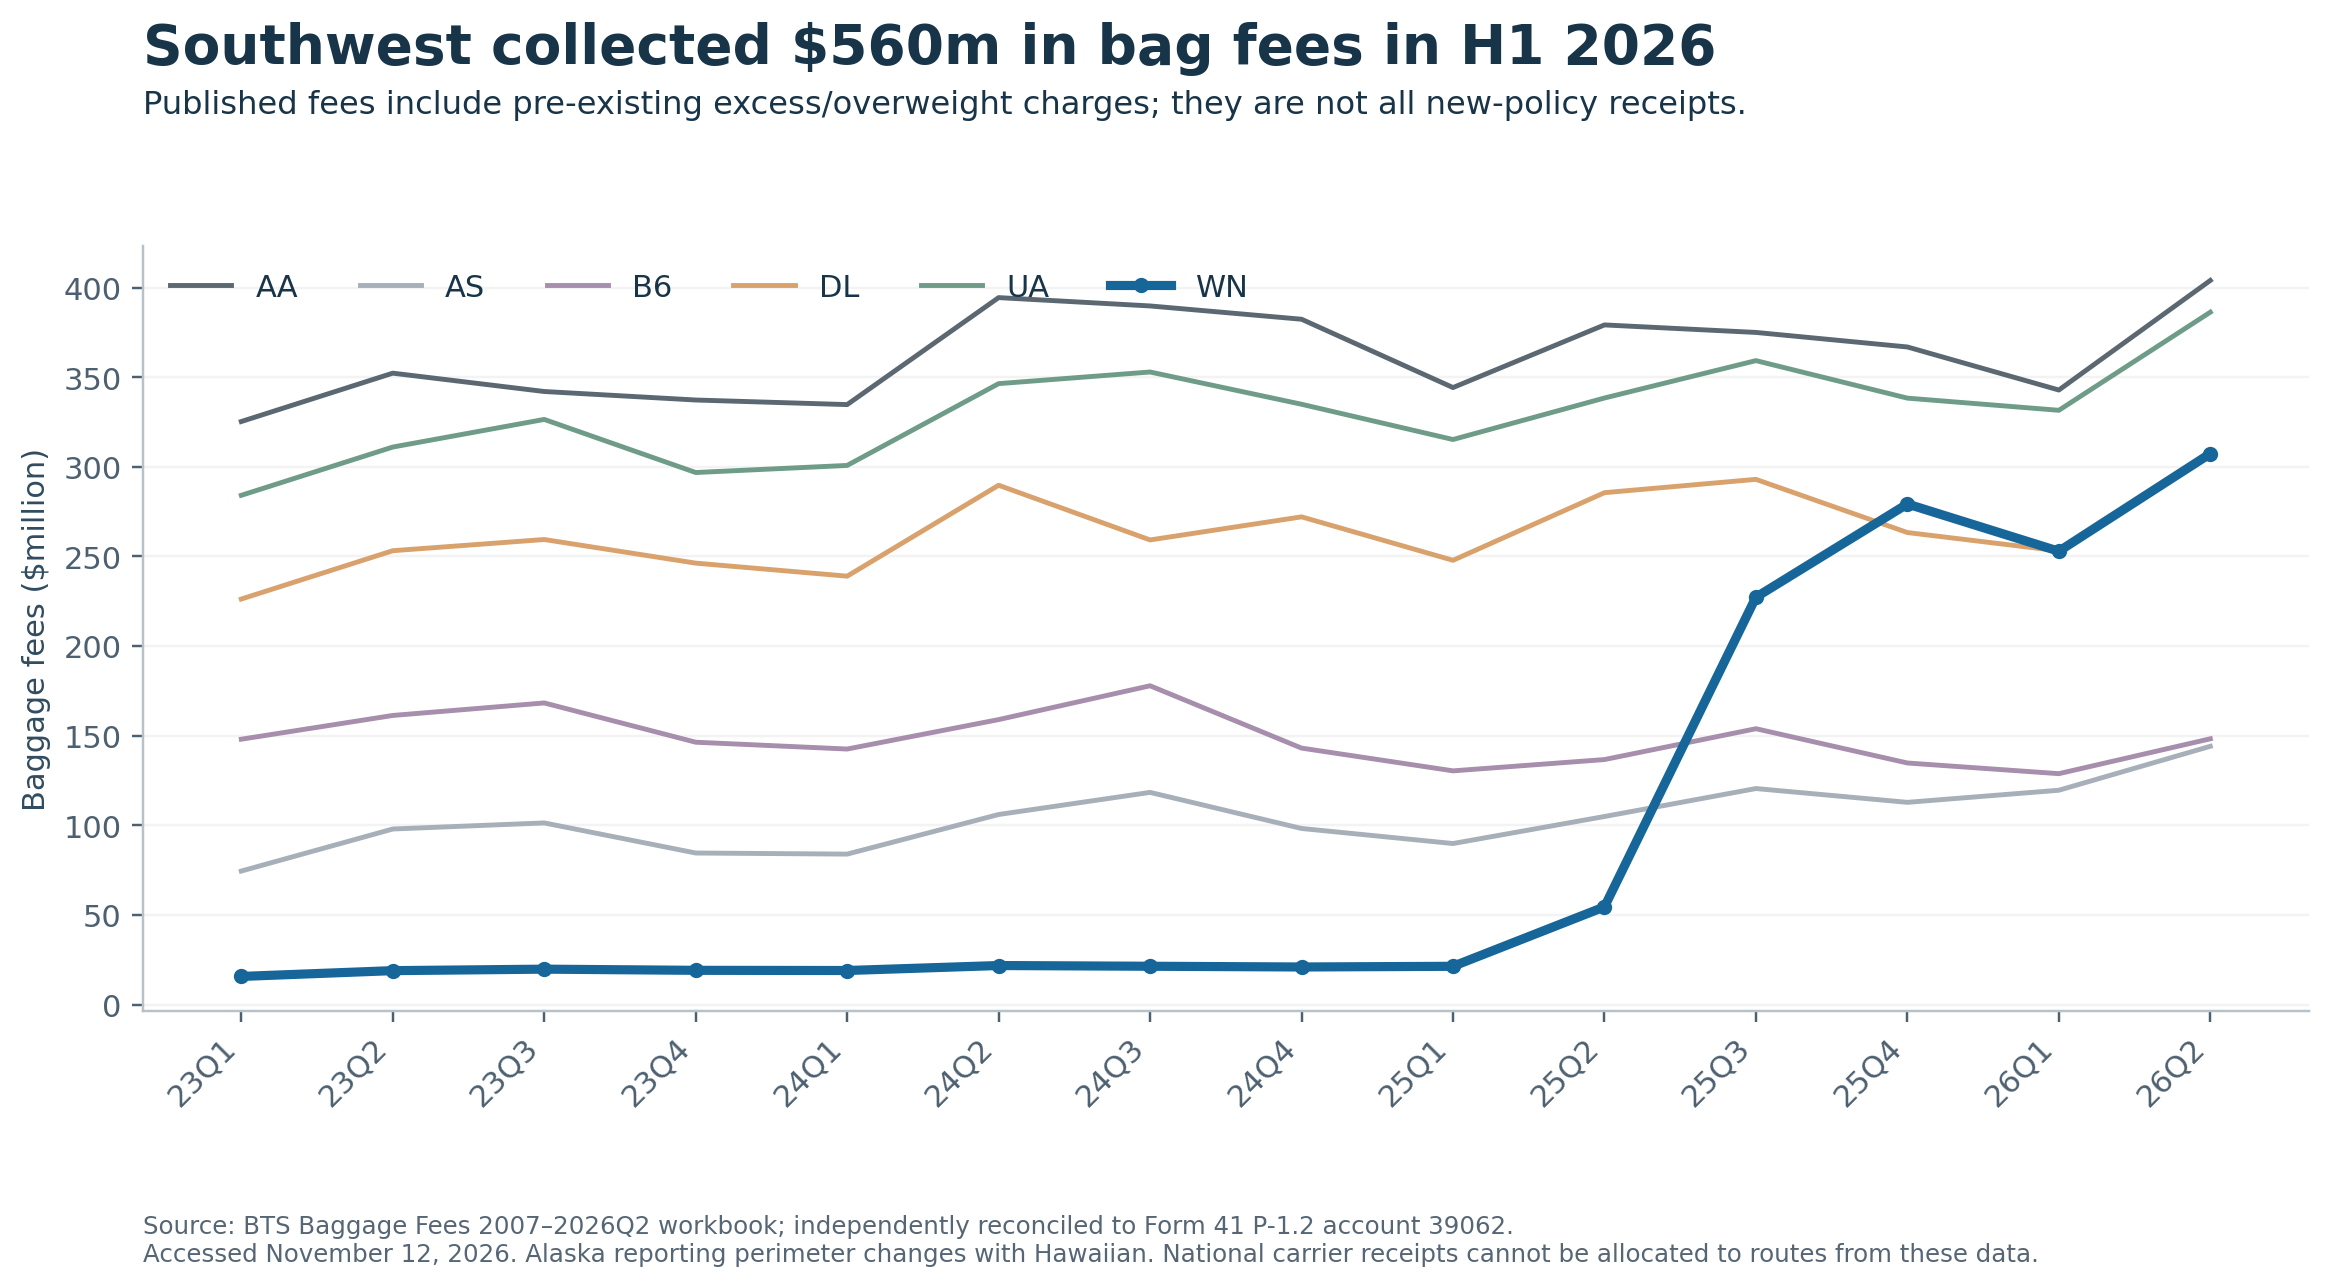
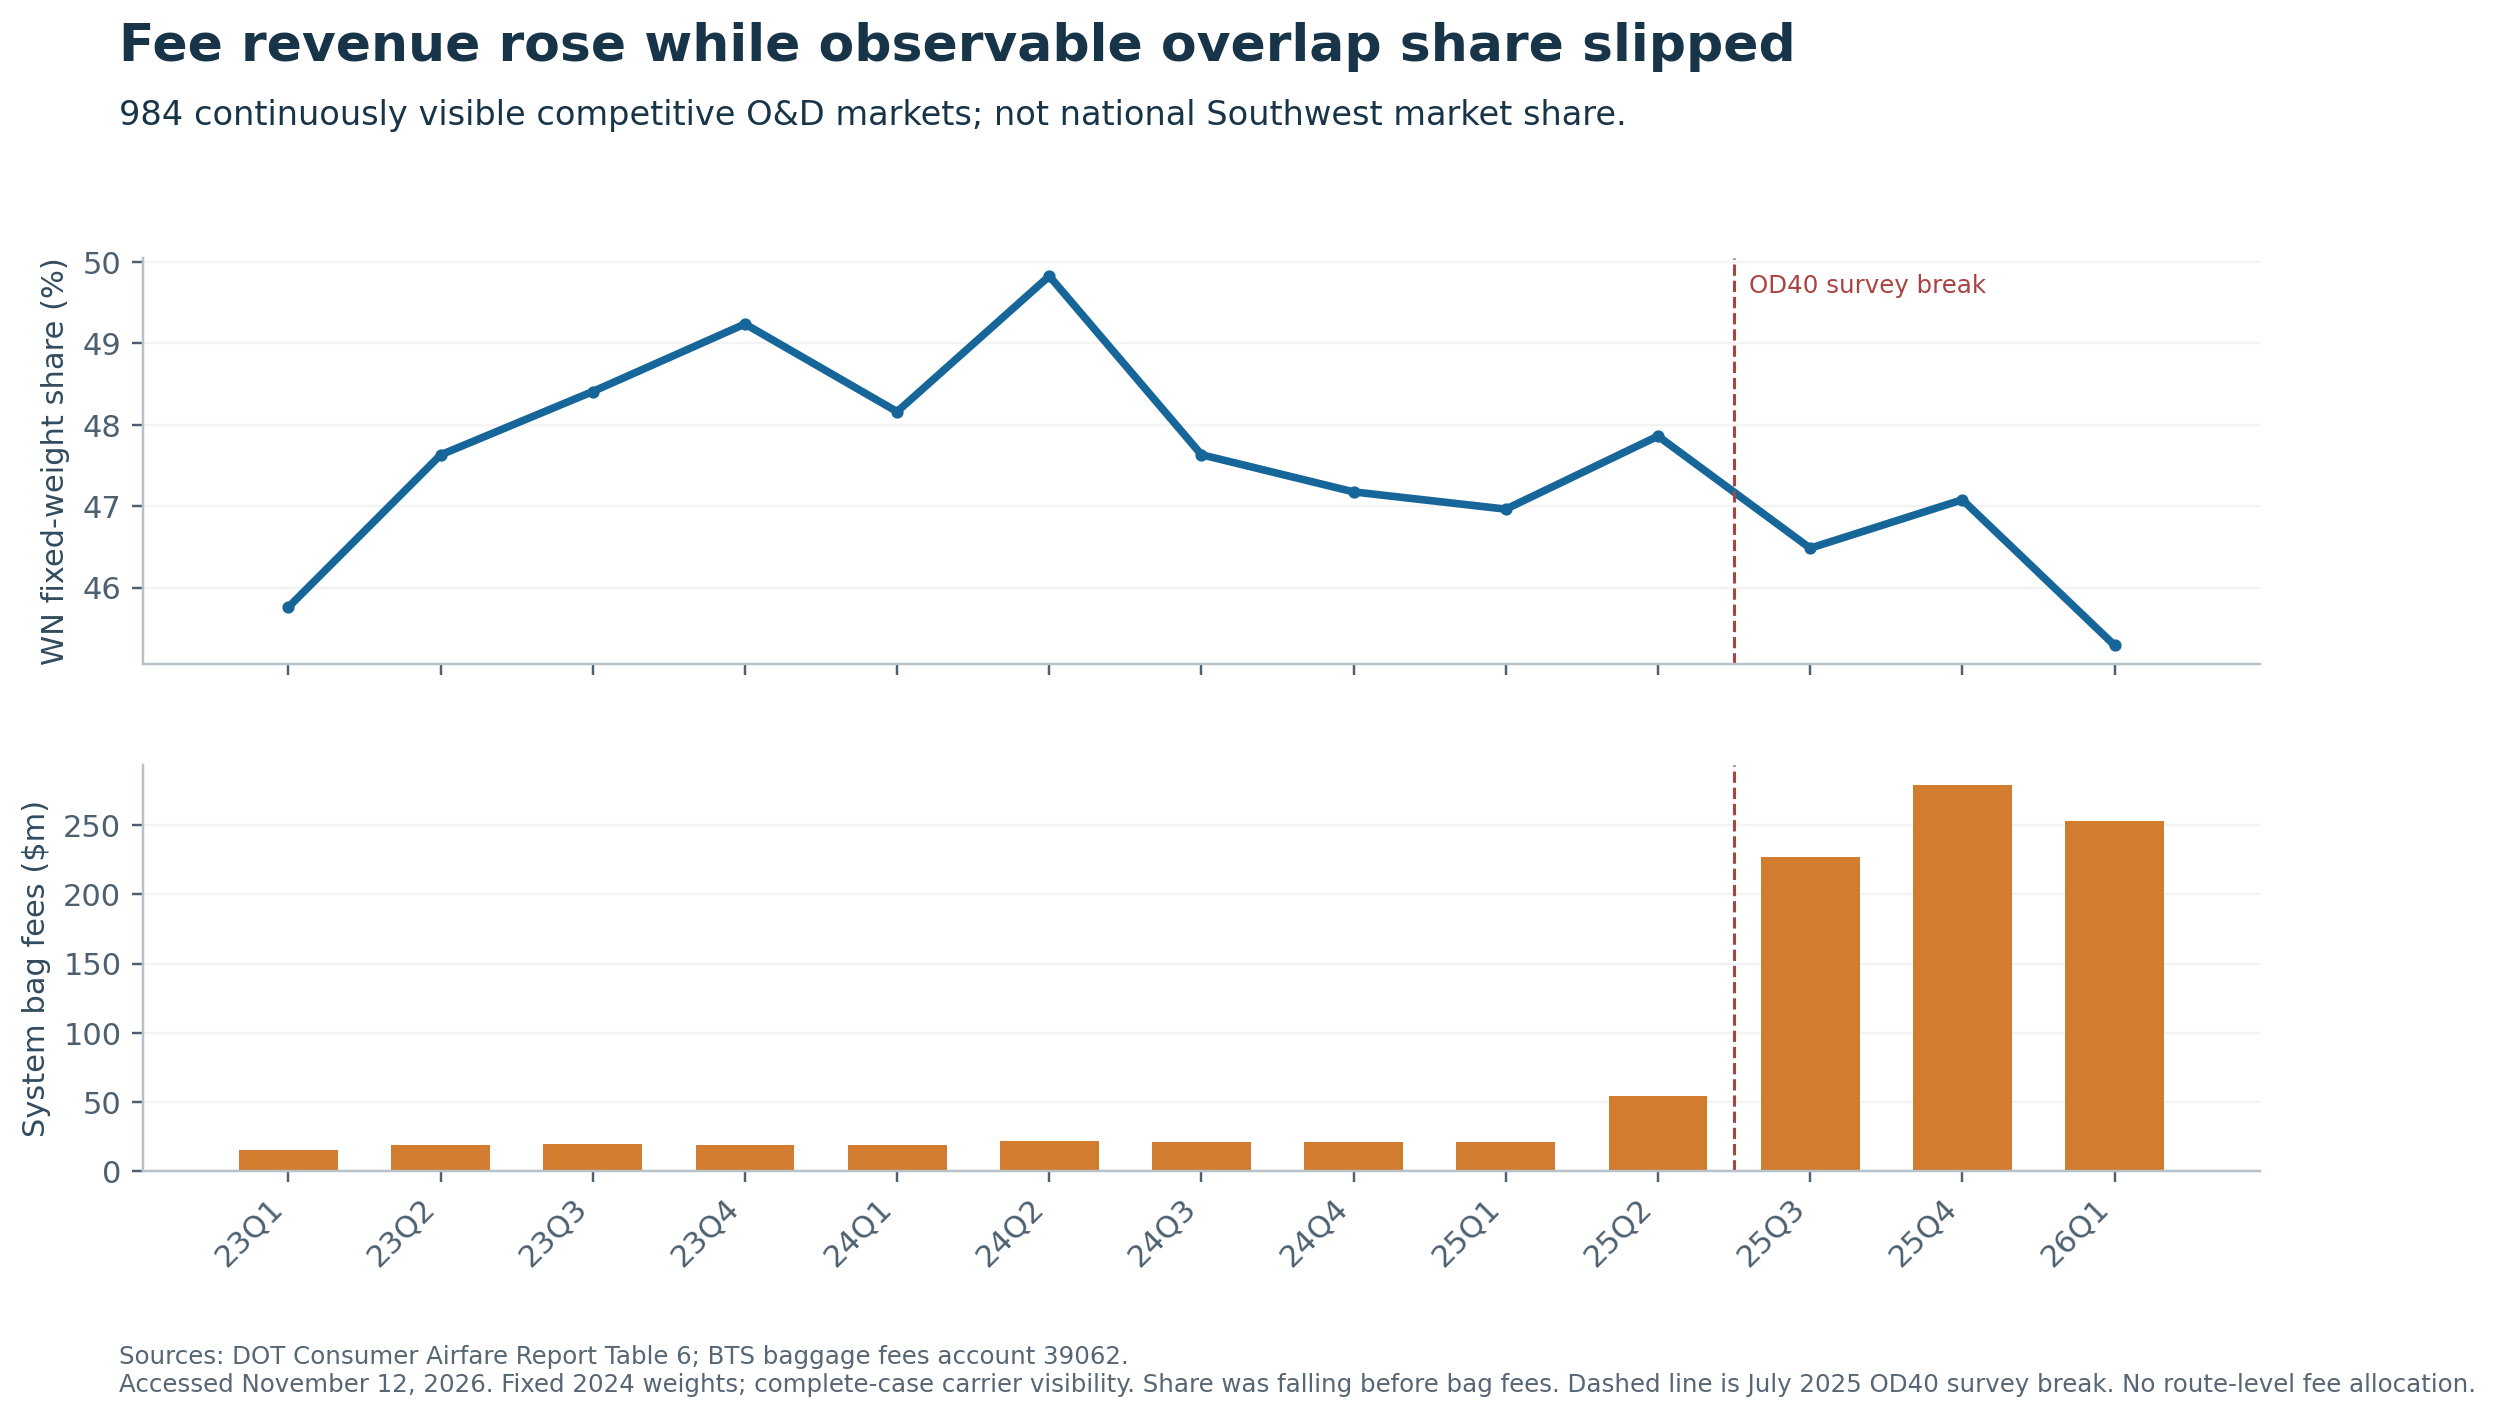
- Fees rose while share weakened in some observable markets. Southwest collected $560.323 million in baggage fees in H1 2026. In a fixed-weight sample of 984 competitive origin-and-destination markets where Southwest remained visible in every published quarter, its share fell from 46.96% in Q1 2025 to 45.29% in Q1 2026. That sample already showed a decline before the policy change, and the fare survey changed during the intervention. Neither the share loss nor the fee gain can be assigned mechanically to the new policy. BTS baggage fees · BTS fare survey transition
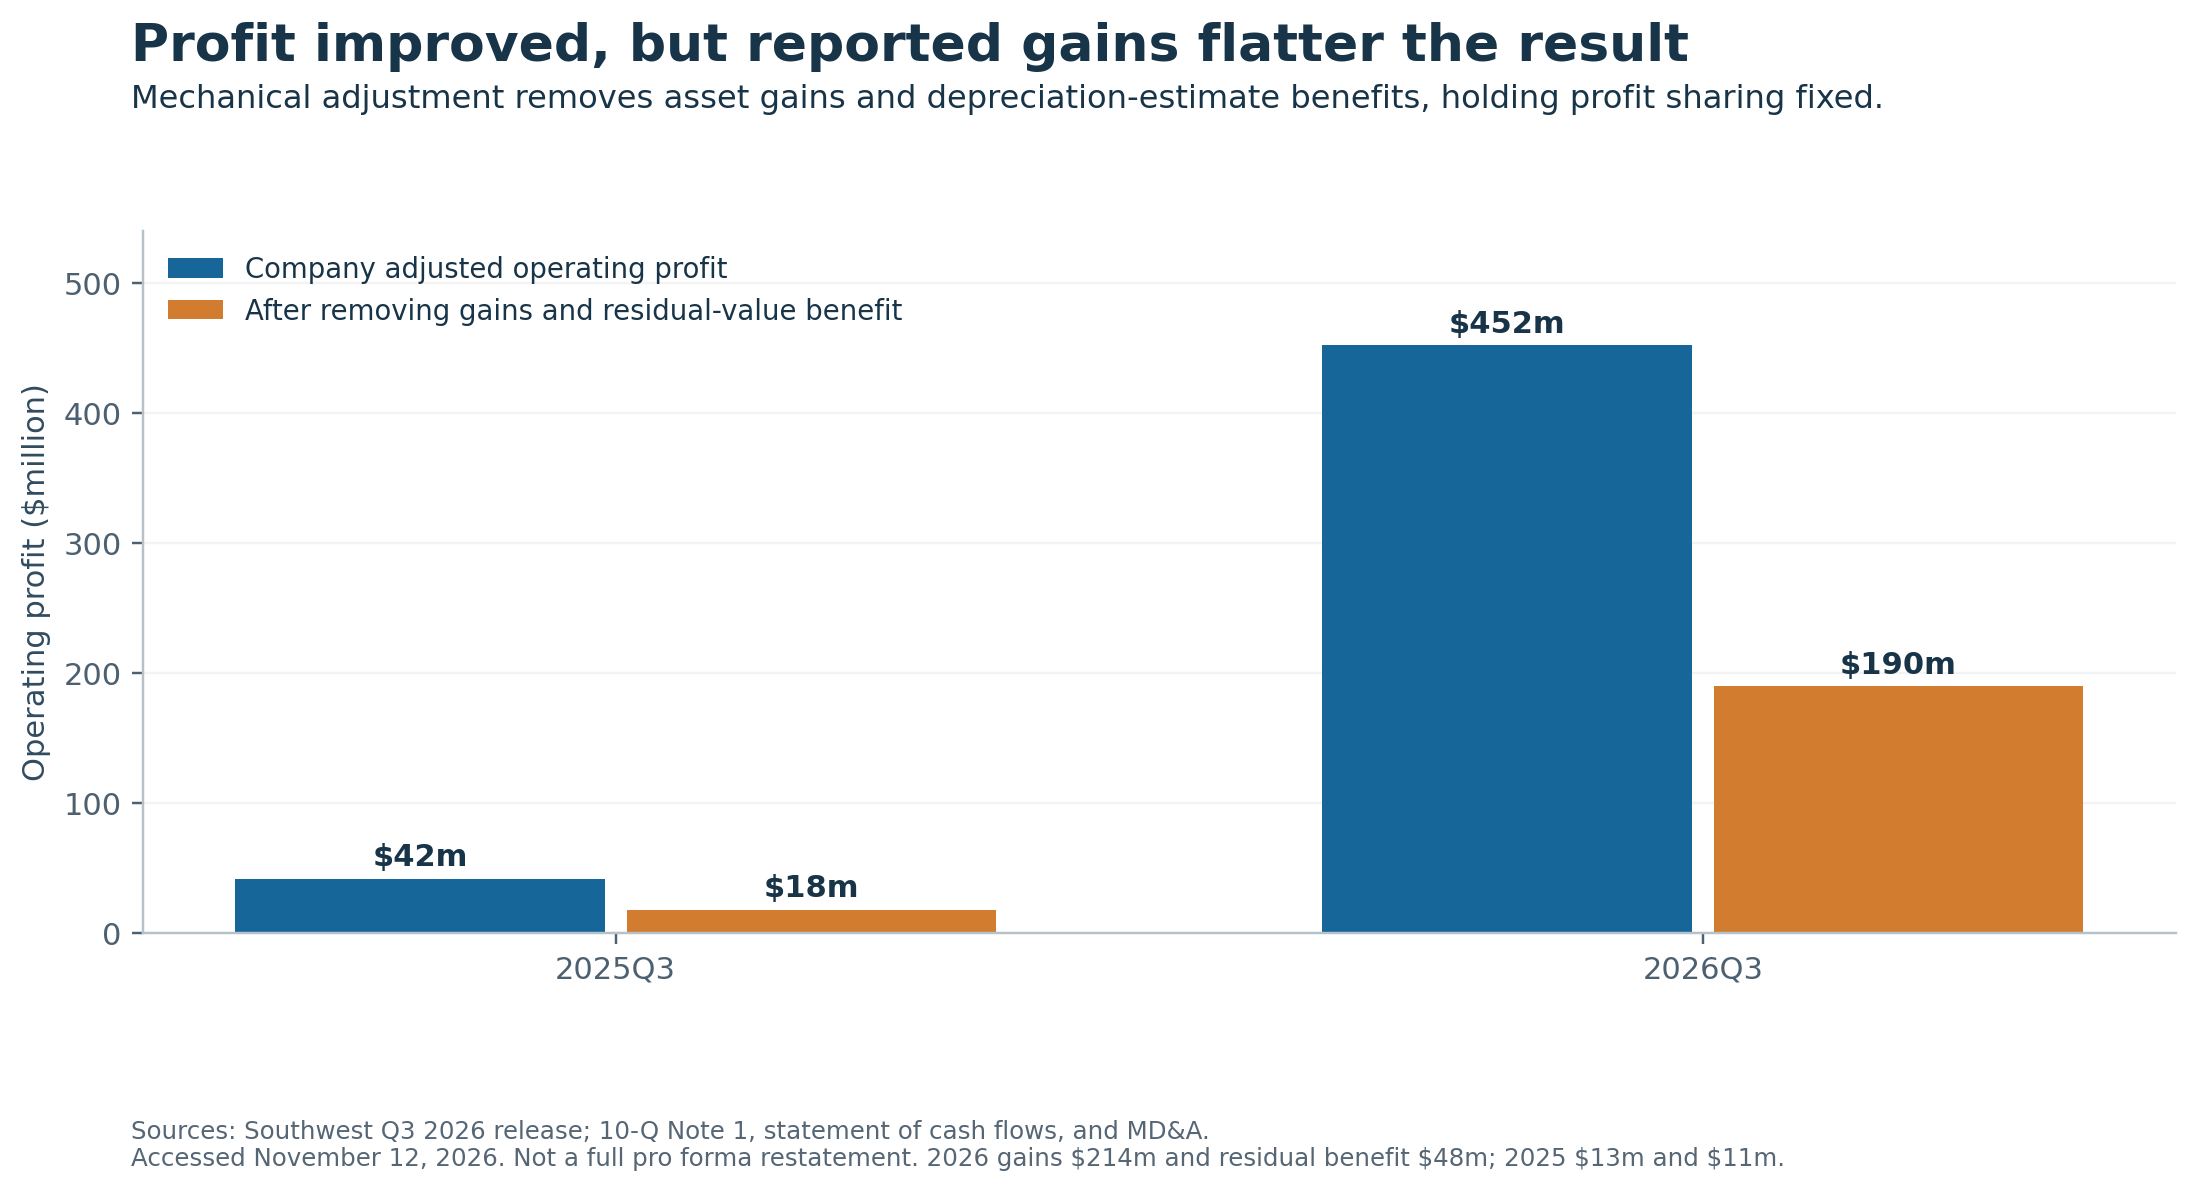
- Some earnings improvement is accounting or asset monetization. Removing disposal and sale-leaseback gains and the benefit of higher residual-value estimates reduces company-adjusted Q3 operating profit from $452 million to a mechanically normalized $190 million, against $18 million on the same basis a year earlier. Improvement remains, but its size is smaller. [S01, S02]
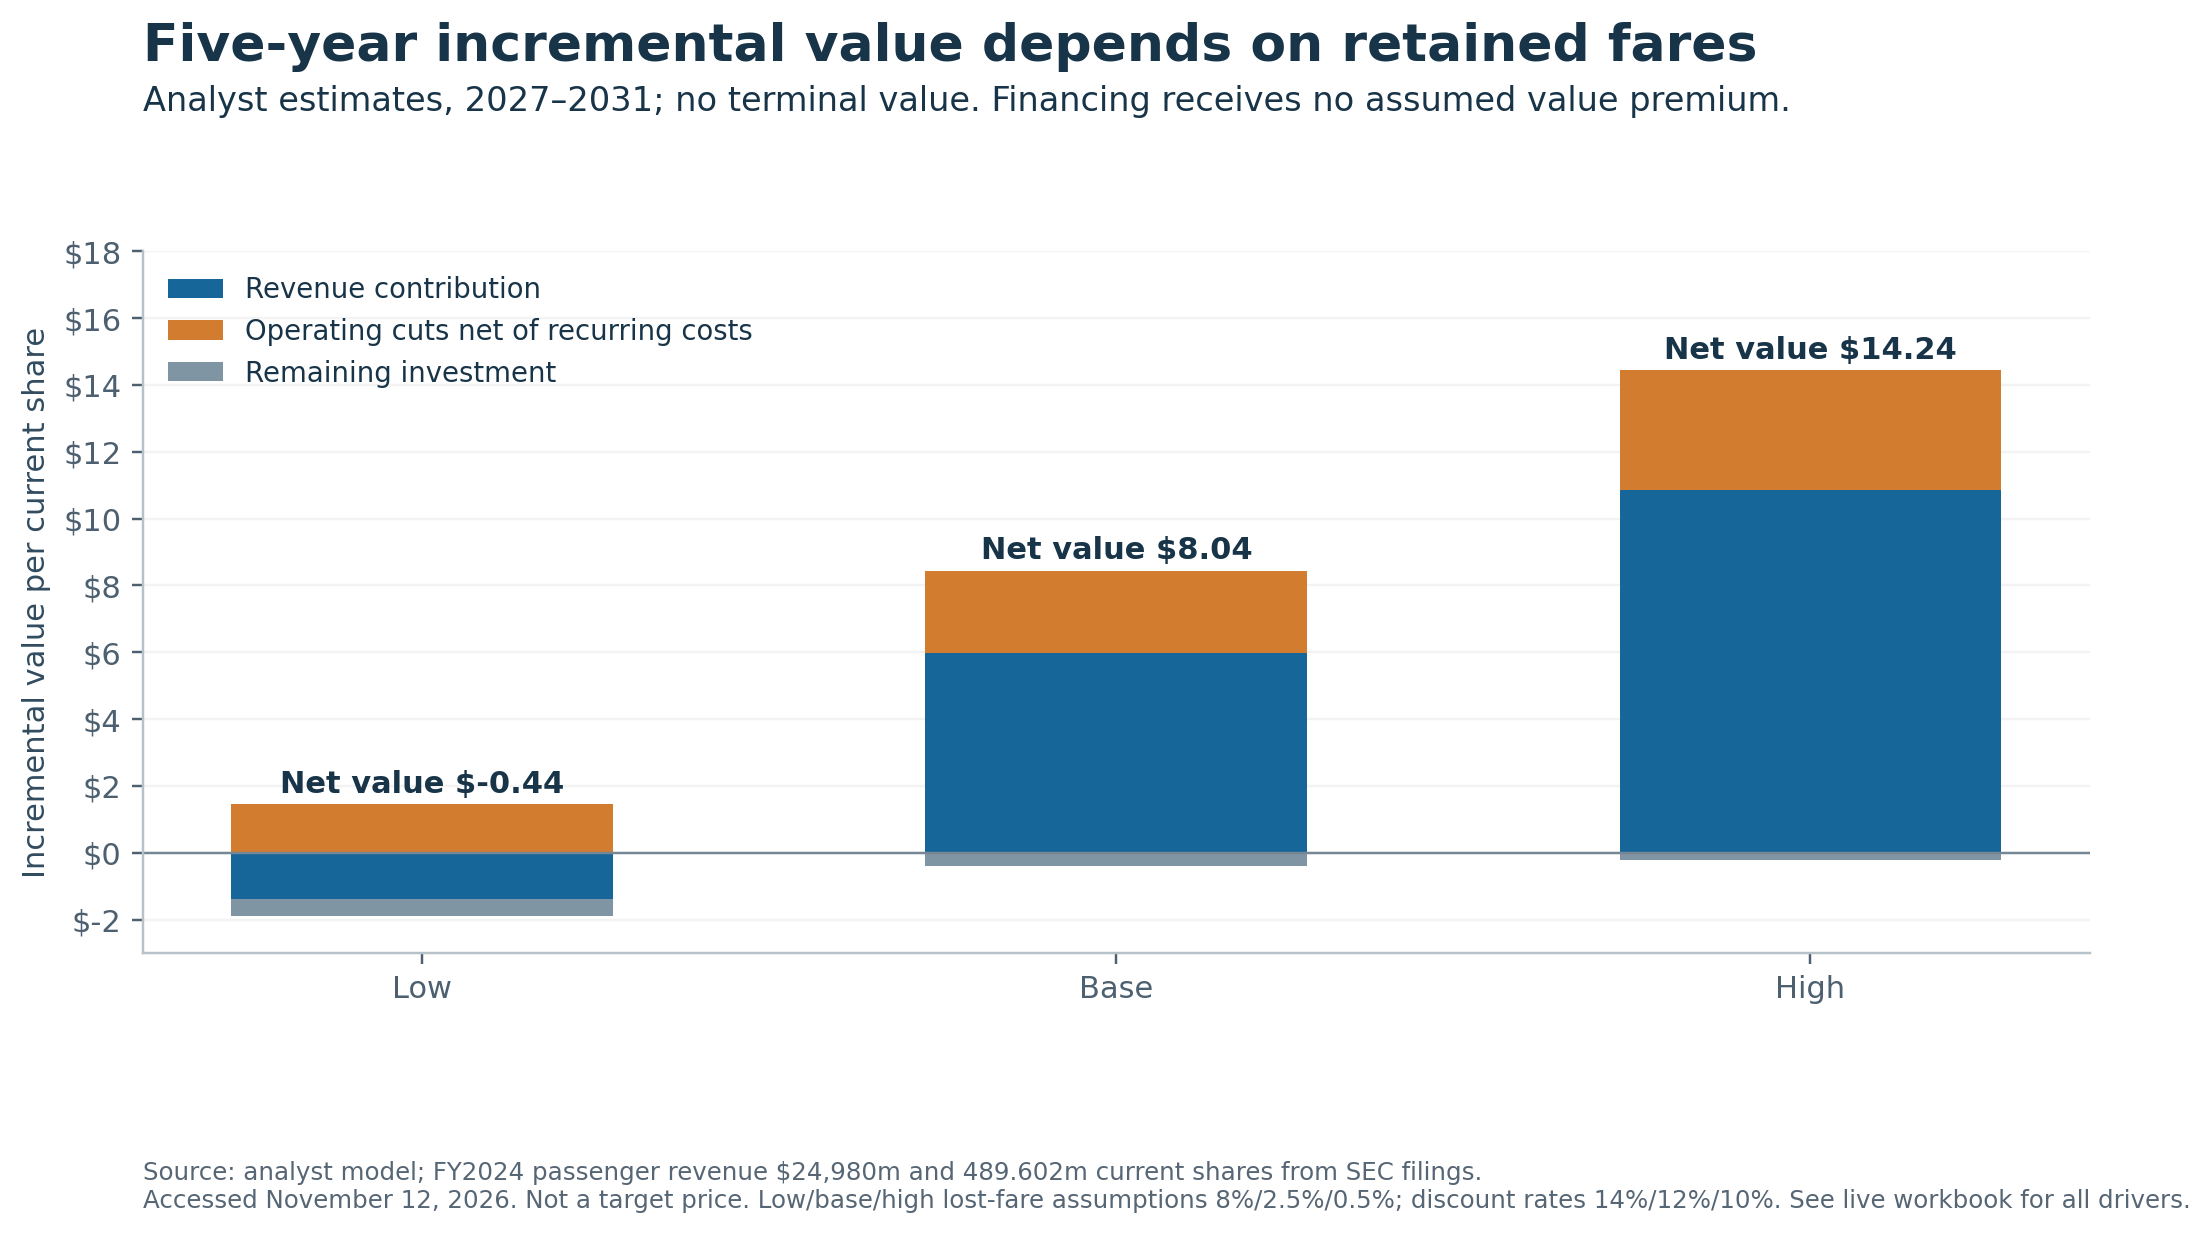
The accompanying model values five years of estimated incremental policy cash flows, using individual revenue, operating-cut and financing components. It produces −$0.44 / $8.04 / $14.24 per current share in low/base/high cases, with no terminal value. Those values estimate incremental cash flows under each scenario. The base case assigns financing no independent value premium.
For Austin and Dallas travelers, the immediate consequence is clearer than the causal shareholder result: a standard mainland customer without an exemption now pays $90 roundtrip for one checked bag, or $200 for two, holding ticket price constant. Extra-legroom seating offers a differentiated product, while the old universal baggage allowance has become a fare, status or card benefit. 12
1. What changed, and when
Elliott announced an approximately $1.9 billion investment representing 11% economic exposure in June 2024. That was not the same as an 11% voting shareholding. Its initial letter sought a board and leadership overhaul and a broad review of Southwest’s business. An August 26 shareholder letter escalated its demand for leadership accountability and a shareholder vote if management remained protected. The October 23, 2024 cooperation agreement delivered five agreed directors; the airline separately appointed a sixth independent director. Gary Kelly left early, Rakesh Gangwal became chair, and Bob Jordan remained chief executive. The settlement changed governance without constituting an Elliott takeover. [S06, S07, S36]
The latest identified April 3, 2026 Schedule 13D amendment reported 24,308,000 beneficially owned shares, 4.9% on its stated denominator, and disclosed additional cash-settled derivative positions. Elliott reported falling below 5% beneficial ownership on April 2. Its independently filed June 30 holdings table still showed 24,308,000 common shares. The filings verify the dated position. Total November exposure remains unknown. The original cooperation period ended no later than February 14, 2026; its original standstill percentage caps should not be presented as perpetual restrictions. [S08, S09; S07, Section 3(a)]
The product changes are now operating facts, but the relevant treatment dates differ:
| Change | Verified timing | Consequence for measurement |
|---|---|---|
| Bag fees, Basic fare and related ticket-credit changes | Applied to qualifying tickets purchased or changed from May 28, 2025 | A booking cutoff phases into flown traffic; it is not an instantaneous treatment of every May flight. |
| Assigned and extra-legroom seat sales | Opened July 29, 2025 | Booking behavior can change before the flight product changes. |
| Assigned and extra-legroom seating in operation | Began January 27, 2026 | January is a mixed operating month. |
| Standard mainland bag-price increase | April 9, 2026, for qualifying new or changed reservations | First/second bag prices rose from $35/$45 to $45/$55 each way. |
| Corporate workforce reduction | Announced February 17, 2025 | Approximately 1,750 roles, or 15% of corporate positions, . The announced percentage covers only corporate positions. |
Sources: March 2025 revenue-initiative announcement; July 2025 seat-sales announcement; current fee schedule and dated update; February workforce announcement. [S10–S13]
These changes arrived alongside redeyes, wider distribution, loyalty changes, route restructuring and aircraft constraints. The 737-700 retrofit reduced seating from 143 to 137 and was completed in January 2026. RASM can therefore improve partly because there are fewer seats in its denominator. Nevertheless, the Q3 revenue increase was much larger than the 0.4% capacity decline; a denominator explanation alone cannot account for the result. [S03, S01]
Delivery delays also predate Elliott’s operational influence. Southwest’s 2024 delivery expectation fell from 79 aircraft to 46 and then 20; it ultimately received 22. The contemporaneous revisions appear in the January 2024 release, March 12 8-K and April 2024 release. Southwest received 55 aircraft in 2025. The latest Q3 2026 plan anticipated 67 deliveries for the year, against 43 received through September and 46 by October 21. These are different quantities: contractual order book, management delivery plan, deliveries received and aircraft available to fly measure different things. [S37–S39, S33, S03, S02]
The MAX 7 was no longer uncertified at the research cutoff. The FAA certified it on August 3, 2026. Southwest still expected its first delivery late in 2026 and entry into service during 2027. FAA certification and an airline’s operational readiness have different dates. [S16, S02]
2. Revenue rose while passenger journeys fell
The quarterly financial series makes the mechanism clearer than the headline growth rate:
| Southwest metric | Q3 2025 | Q3 2026 | Interpretation |
|---|---|---|---|
| Operating revenue | $6,949m | $8,422m | More money collected per unit of traffic/capacity |
| Available seat-miles | 45,567m | 45,393m | Capacity approximately flat |
| Revenue passenger-miles | 36,362m | 36,214m | Paying traffic approximately flat |
| Load factor | 79.8% | 79.8% | No aggregate occupancy improvement |
| Revenue passengers | 34.581m | 33.467m | Down 3.2%; not a count of unique individuals |
| Enplaned passengers | 43.806m | 43.310m | Flight-segment count down 1.1% |
| Average passenger haul | 1,051 miles | 1,082 miles | Longer journeys partly offset fewer passenger trips |
| Reported RASM | 15.25¢ | 18.55¢ | Pricing, ancillary revenue and mix dominate volume |
Source: comparative operating statistics in the Q3 2026 earnings release. Passenger journeys, enplanements and passenger-miles count different things. 1
Southwest’s reported average passenger fare rose to $231.69 from $182.56. Its numerator is passenger revenue, which includes ancillary products sold individually. That measure is not interchangeable with DOT’s ticket-fare survey, which excludes optional bags and seat upgrades paid for outside the fare. Treating both as the same base ticket price would double count ancillary inflation. [S01, S02, S21]
The peer adjustment matters
| Carrier | Q3 2026 RASM growth, recalculated | Reported CASM-X growth | Important perimeter |
|---|---|---|---|
| Southwest | Approximately 21.7% | 3.8% | Single operating airline |
| Delta | 15.4% | 7.3% | Revenue excludes third-party refinery sales |
| United | 15.9% | 7.8% | Consolidated network including regional activity |
| American | 14.5% | 3.0% | American Airlines Group, including regional activity |
| Alaska | 11.7% | 4.4% | Includes Hawaiian; historical perimeter needs care |
| JetBlue | 18.4% | 7.0% | Consolidated system |
RASM growth above is calculated from the displayed revenue and ASM amounts; issuer percentages can differ slightly because of rounding. Southwest reports 21.6%, JetBlue 18.4%, and Delta rounds its adjusted growth to 15%. CASM-X is each issuer’s disclosed measure, with differing exclusions; the column is not a standardized accounting metric. [S28–S32, S01]
Fuel was a common shock. Southwest’s nominal Q3 fuel expense rose $821 million, and the other carriers also described substantial fuel-cost increases. Comparing Southwest only with its own weak prior year would assign industrywide fare inflation to the new products. Conversely, using Delta’s unadjusted revenue would import refinery turnover into the comparison. [S01, S28–S32]
The workbook calculates a simple benchmark:
Benchmark revenue = Prior-year Southwest RASM × Current Southwest ASMs × (1 + median peer RASM growth)
The resulting Southwest revenue residuals are approximately $273 million, $382 million and $435 million in Q1, Q2 and Q3 2026. Q2's reported revenue includes a $285 million reversal of previously recognized flight-credit breakage; adding it back increases that quarter’s descriptive residual accordingly. The gaps show the scale of the difference after the peer adjustment. Mix, geography, capacity decisions and competitor strategies can all affect the result. They should not be called product-generated revenue. [S04, calculations from issuer inputs]
The annual results show that the larger improvement came in 2026. Reported adjusted operating income was $457 million in 2024 and $539 million in 2025; the larger improvement appeared in 2026. Annual controls come directly from reported annual results. Summing adjusted quarters can be wrong: the 2023 quarterly total differs from the annual figure because the pilot-contract adjustment uses different quarter and annual attribution periods. The workbook preserves that distinction. [S03, S33]
3. Bags produced real revenue; not every dollar was incremental
BTS baggage account 39062 provides a direct answer about collections:
| Period | Southwest baggage revenue |
|---|---|
| Q1 2025 | $21.332m |
| Q2 2025 | $54.508m |
| Q3 2025 | $227.279m |
| Q4 2025 | $279.297m |
| Full-year 2025 | $582.416m |
| Q1 2026 | $252.917m |
| Q2 2026 | $307.406m |
| H1 2026 | $560.323m |
The BTS summary and the underlying Form 41 account agree across 96 carrier-quarter observations. Total post-change fees include older excess/overweight baggage charges, so they are an upper bound on new-policy receipts before estimating a counterfactual. [S17, S18]
For context, H1 2026 baggage receipts were approximately $747 million at American, $718 million at United, $559 million at Delta, $277 million at JetBlue and $264 million at Alaska. Different network sizes, waivers, itinerary mixes and the Alaska/Hawaiian reporting change prevent ranking these as equivalent passenger-level monetization rates. 18
Q2 Southwest bag revenue divided by its reported revenue-passenger count is about $8.95 per passenger journey. That ratio divides systemwide bag receipts by all revenue journeys. Individual fees and the share of passengers who paid one require passenger-level data. Cardholders, elite members, certain fares, carry-on-only travelers and multi-bag travelers are mixed together. The $45 posted first-bag price should not be multiplied by every passenger. [S18, S04; calculation]
The important accounting boundary is that Southwest’s broader passenger-ancillary category also includes other products sold on their own. It cannot be added wholesale to BTS baggage receipts. Likewise, assigned-seat revenue must be measured after displaced EarlyBird and Upgraded Boarding sales, fare-bundle substitution and free upgrades. A high gross premium-seat sales figure could overstate incremental economics even if accurate. [S02, Note 5]
Southwest’s own original analysis makes the trade-off explicit. Its September 2024 Investor Day modeled $1.5 billion of new bag revenue against $1.8 billion of lost market-share contribution, yielding a $300 million EBIT loss. The lost contribution was already net of lower passenger-carrying costs. The forecast applied to the fare allowances modeled at the time. The post-2025 rules use different waivers and fare structures. Subtracting avoided costs a second time would misread the slide. [S14, slide 72 and footnote]
The central question therefore remains the contribution lost on fares and loyalty against the contribution earned on new products. Public systemwide fee data show the scale of product revenue. They do not disclose each route’s bag receipts, customer lifetime value or the ticket revenue that would have existed under the old policy.
4. What the route tests measure
The route tests use the following public records.
| Source | Records included | Principal limit |
|---|---|---|
| Form 41 | Q1 2023–Q2 2026; 168,962 raw target-carrier schedule records; 8,587 selected P-1.2 account records | Certificated entities differ from consolidated airline groups. |
| T-100 domestic segments | January 2023–July 2026; 659,939 selected six-airline-plus-Hawaiian raw records | Measures nonstop flight segments, including connecting passengers on each leg. |
| Fare Table 1a | 25,825 airport-pair rows, Q1 2023–Q1 2026 | Lists selected carrier identities. |
| Fare Table 6 | 81,937 city-pair rows over the same 13 quarters | Same carrier-visibility limitation; includes connecting itineraries. |
| Baggage fees | 84 six-airline quarters plus 12 historical Hawaiian quarters | Systemwide revenue cannot be observed by route. |
The extracted city-pair fares stop at Q1 2026 even though the airport-average fare release reaches Q2. T-100 Q3 is July only, never a full third quarter. No individual DB1B/OD40 ticket microdata were processed. The accompanying tables identify source files, record numbers, accounts and units. [S17–S22]
A further pitfall is dividing a network airline’s Form 41 revenue, including transport-related activity, by only its own operating-carrier T-100 ASMs. Regional operations can leave the numerator and denominator inconsistent. Consolidated peer RASM/CASM in this report therefore uses matched issuer revenue and capacity; Form 41 serves as a financial cross-check with different carrier coverage.
Design
For each qualifying route, carrier group and phase, the test calculates annual passenger growth from phase totals:
Passenger growth (%) = 100 × (Current-phase passengers ÷ Prior-year passengers in the same months − 1)
It then calculates the post-minus-pre change in Southwest’s growth gap against the combined selected mainline carriers:
D = Σᵣ wᵣ × [(gWN, post − gWN, pre) − (gpeers, post − gpeers, pre)]
Each wᵣ is the route’s weight based on 2024 traffic.
The peer pool is American, Delta, United, Alaska/Hawaiian and JetBlue operating carriers, excluding regional operators. Routes require at least 12,000 passengers in 2024 for Southwest and 12,000 for the combined peer group; weights use 2024 traffic. Positive monthly reference observations and placebo history reaching into 2023 are also required. Current passenger exits remain as zero traffic, or −100% growth. Load-factor comparisons require positive current capacity and consequently use a different continuing-service sample. The airport groups use the documented metro mappings. The anchors include BWI, DEN, LAS, MDW and MCO. The other anchors are PHX, BNA, OAK and SAN.
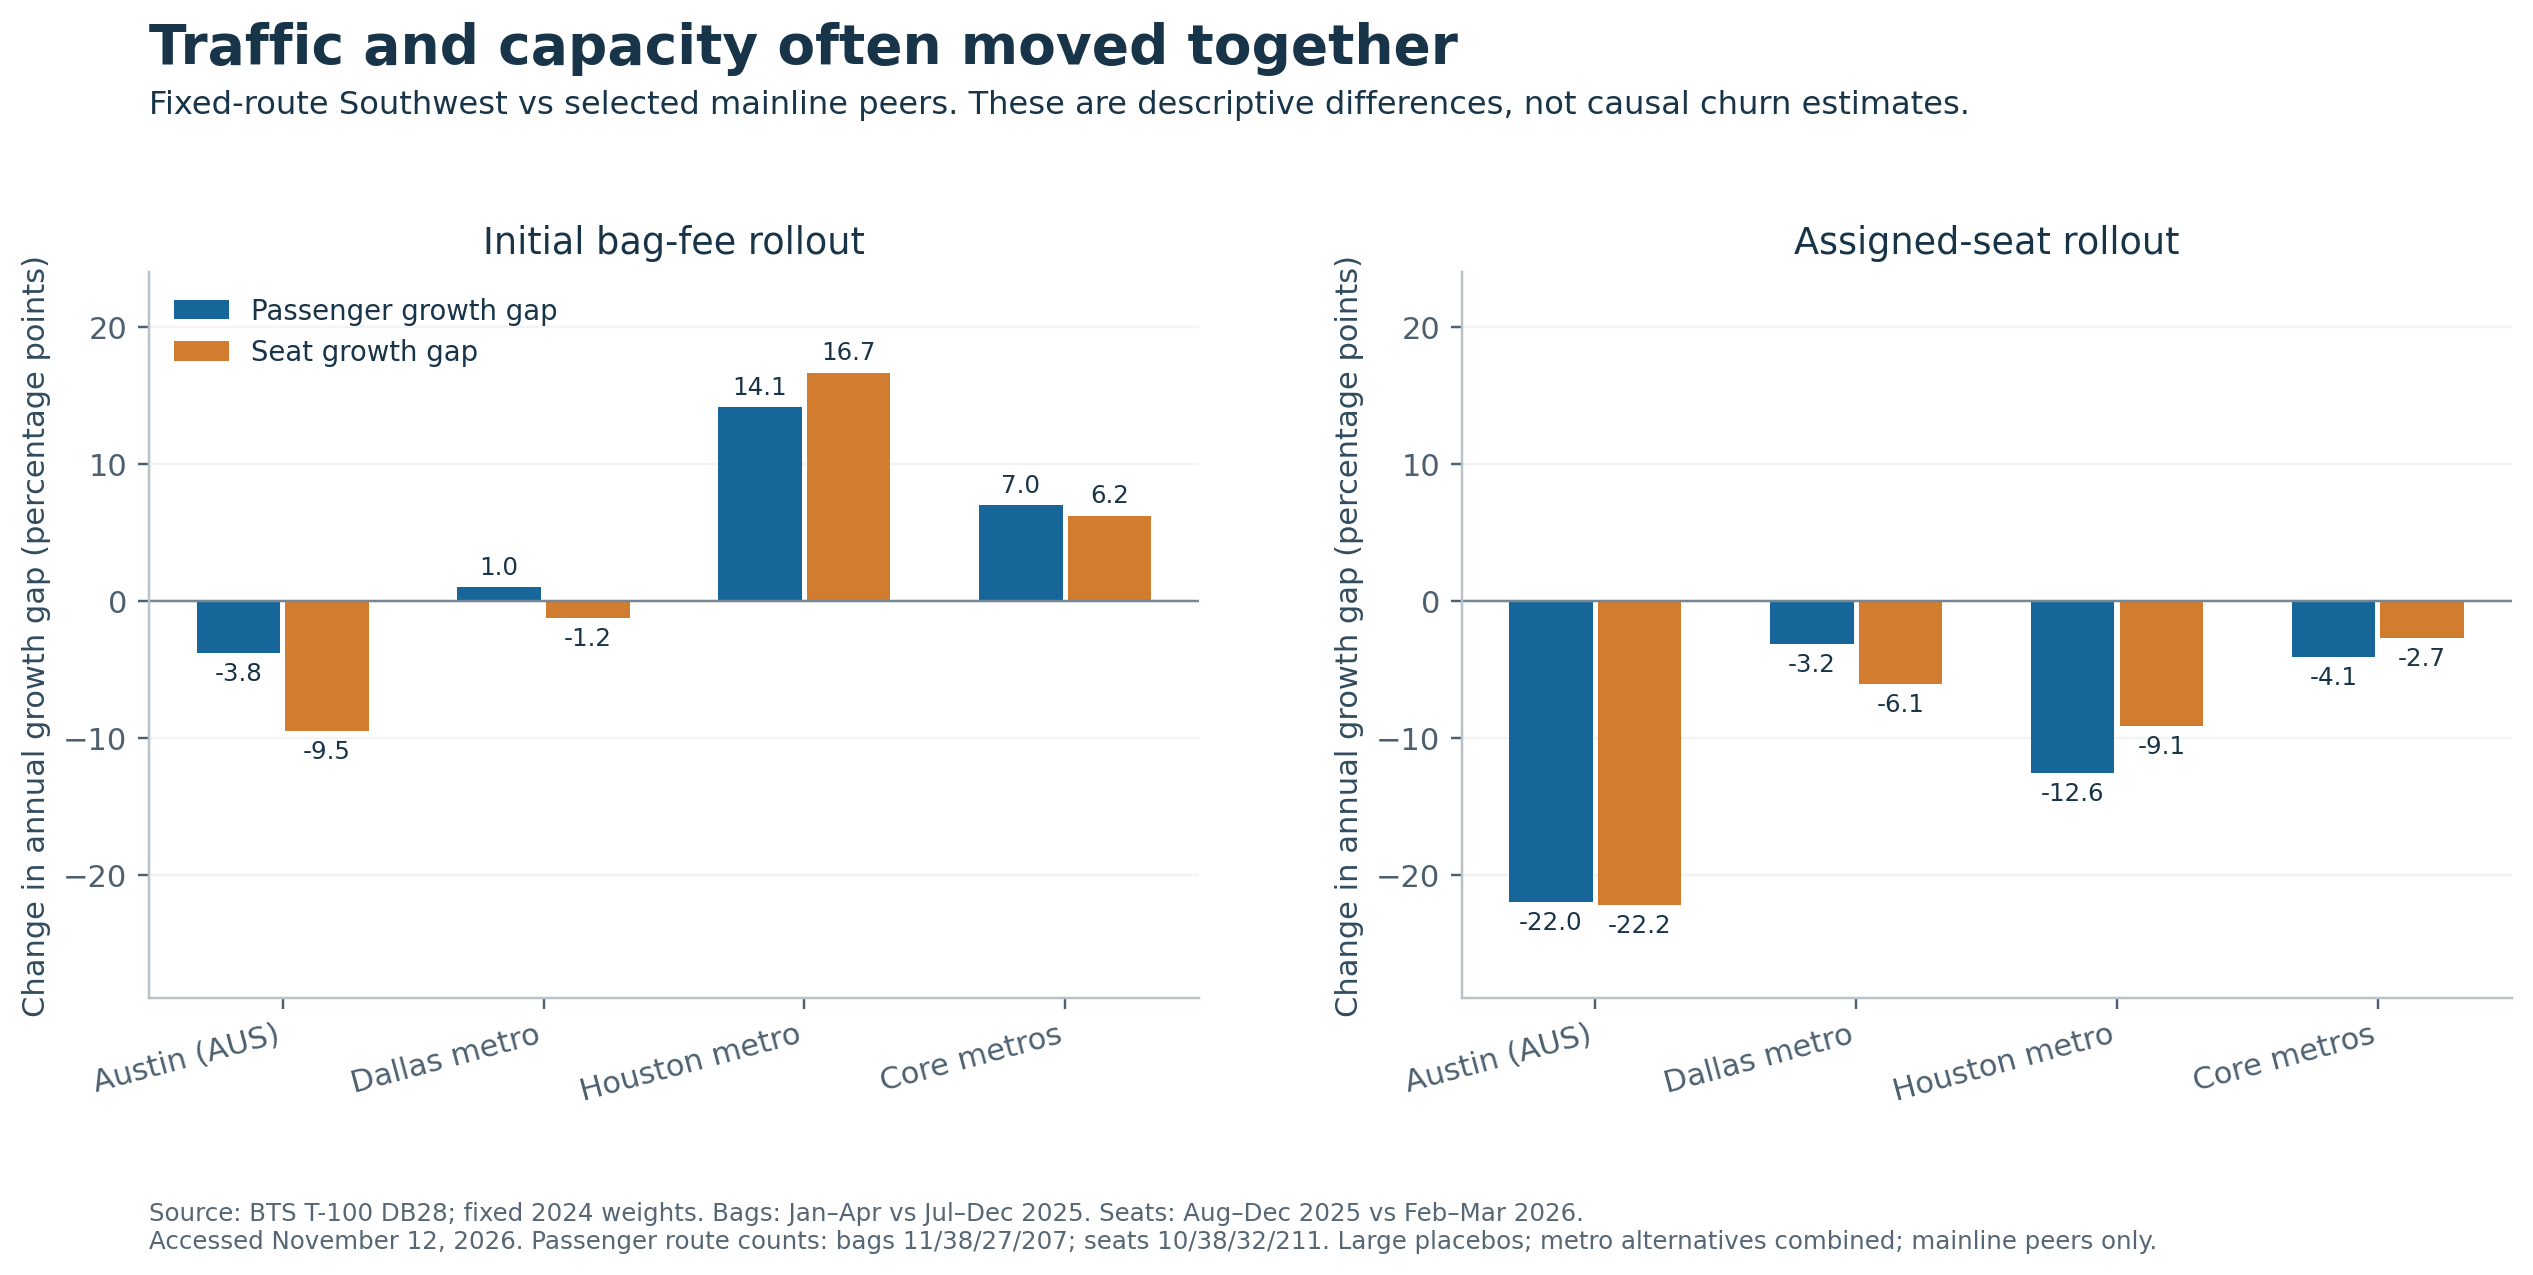
Initial bag-fee comparisons use January–April 2025 against July–December 2025, leaving the implementation transition out. Assigned-seating comparisons use August–December 2025 against February–March 2026. The seating comparison uses the date assigned seating entered operation. Seat sales had started earlier. The April 2026 price increase uses February–March against May–July 2026, which also overlaps Spirit’s May cessation and subsequent competitive responses. [S19, S27]
Initial fees: no uniform traffic collapse, but weak causal identification
| Geography | Routes | Change in annual passenger-growth gap | Earlier placebo |
|---|---|---|---|
| Austin airport | 11 | −3.8 pp | −8.2 pp |
| Dallas/Fort Worth metro | 38 | +1.0 pp | Approximately 0.0 pp |
| Houston metro | 27 | +14.1 pp | −21.4 pp |
| Selected core metros | 207 | +7.0 pp | −9.0 pp |
| All qualifying metro overlaps | 319 | +3.6 pp | −10.8 pp |
These results measure changes in annual growth gaps. Market share and the fraction of customers lost use different denominators. The initial-fee placebos repeat the design one year earlier. Their universe is still selected using full-year 2024 traffic, so they describe the selected sample. The large earlier movements, particularly in Houston and the broader samples, undermine parallel-trends assumptions. Subtracting the placebo does not manufacture a causal correction. The later April-price test deliberately uses a 2024 placebo to avoid the contaminated 2025 policy period.
Assigned seats: traffic and capacity moved together
| Geography | Passenger routes | Passenger-growth-gap change | Seat-growth-gap change |
|---|---|---|---|
| Austin | 10 | −22.0 pp | −22.2 pp |
| Dallas metro | 38 | −3.2 pp | −6.1 pp |
| Houston metro | 32 | −12.6 pp | −9.1 pp |
| Core metros | 211 | −4.1 pp | −2.7 pp |
Austin’s result is especially instructive: calling the approximately 22-point passenger contrast a customer rejection estimate would ignore a similarly sized capacity contrast. Capacity is an endogenous business decision, so simply controlling it away would not solve identification either.
The second bag-price increase produces passenger-growth-gap changes of +18.6 points for Austin, approximately zero for Dallas, +3.6 for Houston and +2.3 for core metros. Dallas’s result changes from −4.8 points under an alternative mean-of-monthly-growth-ratios method to approximately zero under the preferred phase-total method. That is a concrete robustness failure for a directional causal claim.
Exact Dallas Love and Houston Hobby comparisons each have just one qualifying peer-overlap route: Atlanta. The fuller tests therefore combine DAL with DFW and HOU with IAH. Airport-level traffic and share remain available in the raw files, but the single-route contrasts do not represent airport-wide experiments. No statistical confidence interval is claimed, and none of these route coefficients is fed into the valuation.
5. Fares and share: the customer trade-off is heterogeneous
DOT’s city-pair fares are each-way market fares including taxes and mandatory charges, excluding optional bags and seats purchased outside the fare. The Texas observations show different outcomes:
| City pair | Southwest fare, Q1 2025 | Southwest fare, Q1 2026 | Change | Southwest share, Q1 2025 → Q1 2026 |
|---|---|---|---|---|
| Austin–Dallas/Fort Worth | $213.78 | $227.30 | +6.3% | 52.57% → 53.81% |
| Austin–Houston | $199.65 | $269.67 | +35.1% | 46.81% → 43.31% |
| Dallas/Fort Worth–Houston | $195.93 | $231.61 | +18.2% | 46.16% → 46.99% |
The fares come from Southwest’s observations in the survey. Dallas and Houston combine their alternative airports, and connecting itineraries are included. The 39-row raw extract preserves all three routes over 13 quarters. Dallas–Houston Southwest share had already fallen from 53.62% in Q1 2024 to 46.16% in Q1 2025, before the fee change. [S20, S21]
The broader 984-market visible-overlap index is a meaningful caution: fixed-weight Southwest share declined from 48.16% in Q1 2024 to 46.96% in Q1 2025 and 45.29% in Q1 2026. Fee revenue rose strongly during the last interval. Southwest appears able to monetize more aggressively while surrendering some relative share in this conditional sample.
That is not national Southwest share. The baseline contains 1,432 competitive markets; only 984 display Southwest consistently in all 13 quarters. Tables disclose the largest and qualifying lowest-fare carrier, so disappearance from the table does not mean zero share. The fare comparison also crosses the July 2025 shift from a 10% to 40% sample, along with changes in reporting carrier, coverage and frequency. Those measurement changes occurred directly around the first fee intervention. [S20, S22]
Austin’s airport data provide an independent check with a different population. Southwest’s January–September passenger movements were 6.694 million in 2024, 6.483 million in 2025 and 6.889 million in 2026. Its airport share rose from 40.86% to 41.68% between 2025 and 2026, slightly above 2024's 41.19%. The airport counts arriving and departing passenger movements, including passengers outside the local O&D market. A traveler can count more than once. [S25, S26, S35]
There is no contradiction between an Austin airport-share gain and a decline in a selected O&D-market index: destinations, connecting travel, weights and carrier coverage differ. American’s Austin retrenchment, Delta’s expansion and Spirit’s cessation further complicate attribution. Southwest’s airport share grew. Individual customer departures remain unmeasured. [S25–S27]
The fare-based DiD also changes sign across phases. The initial-fee test compares Q1 2025 with Q3–Q4 2025; the assigned-seat test compares Q4 2025 with Q1 2026, which is only partly treated. It measures the change in Southwest’s annual fare-growth gap against the fare of all other carriers in the market:
| Geography | Initial-fee fare-growth-gap change | Partial assigned-seat change |
|---|---|---|
| Austin city markets | −7.5 pp; 52 routes | +4.2 pp; 55 routes |
| Dallas metro | −8.2 pp; 41 routes | +4.7 pp; 41 routes |
| Houston metro | −10.6 pp; 43 routes | +8.3 pp; 43 routes |
| Core metros | −8.7 pp; 367 routes | +3.6 pp; 383 routes |
This fare comparison has a different universe from T-100: Southwest must hold 10–90% share in all four 2024 quarters and remain visible in the needed published observations. The calculation uses the weighted relationship between market fares, carrier fares and passenger counts to derive the other-carrier fare. Large placebos and the OD40 break prevent causal interpretation. City-pair data through Q1 cannot test the April 2026 fee increase. Complete individual-carrier fare/share microdata remain unprocessed here; the published summaries cannot fill those missing cells. [S20–S22; raw fare-DiD tables]
6. Service is a real part of the customer cost
The service evidence is less flattering than the revenue evidence. The DOT’s first-half comparison shows Southwest’s on-time arrival rate falling 4.15 percentage points, while four of the five peers improved:
| Carrier | H1 2025 on time | H1 2026 on time | H1 2026 cancellations | H1 2026 mishandled bags per 100 checked |
|---|---|---|---|---|
| Southwest | 78.91% | 74.76% | 1.05% | 0.32 |
| Delta | 78.70% | 79.33% | 2.35% | 0.37 |
| United | 77.42% | 77.60% | 1.76% | 0.69 |
| American | 73.35% | 74.38% | 3.32% | 0.67 |
| Alaska | 77.72% | 80.51% | 1.24% | 0.53 |
| JetBlue | 74.49% | 71.02% | 2.86% | 0.31 |
These measures use DOT’s reporting network. Its carrier coverage can differ from T-100. Alaska’s combination with Hawaiian further limits the year-on-year comparison. Southwest’s cancellation rate remained comparatively low, but that does not erase worsening punctuality. Its latest available August result was 69.1% on time, and January–August was 73.1%. Neither statistic identifies the contribution of seat assignments, layoffs, weather or network design. [S23, S24]
Southwest’s handled-bag denominator fell from 59.030 million to 46.350 million between H1 2025 and H1 2026, down 21.5%; mishandled bags fell faster, from 240,488 to 148,875. Covered passenger enplanements in the oversales table were approximately flat. Fewer checked bags can reflect people carrying bags onboard or qualifying for different allowances. Overall passenger counts can stay flat as checked-bag counts fall. Bag-handling performance improved, but the number of bags cannot be used as a customer-loss count. [S23, printed pp. 42, 52]
Complaints require an explicit data break. The new ACERS system began in August 2025. DOT reported 1,249 Southwest complaint cases in H1 2026, including 50 fare/fee cases; August added 278 cases, including nine fare/fee cases. The comparable 2025 columns are not a valid zero baseline. This report therefore does not calculate a before/after complaints growth rate, invent an aligned complaints-per-passenger rate, or label all fee complaints as baggage complaints. [S23, pp. 55, 61; S24, pp. 45, 48]
The inference is narrower: punctuality deteriorated during the transformation, and that creates a customer-retention risk alongside the higher total trip price. Public data do not price that inconvenience or trace individual travelers’ subsequent airline choices.
7. Operating cuts helped a counterfactual, but reported costs still rose
The February 2025 corporate reduction was initially expected to save approximately $210 million in 2025 and $300 million in 2026, against estimated severance charges of $60–80 million. The eventual 2025 charge was $62 million. Those savings estimates belong to a counterfactual: expenses can rise despite a successful cut if wages, flying patterns or other spending rise faster. Southwest’s Q3 salaries and related costs increased from $3.219 billion to $3.542 billion, and active full-time-equivalent headcount rose from 72,223 to 73,092. A corporate layoff is not equivalent to a declining total airline workforce. [S13, S03, S01]
The broader March 2025 plan targeted operating savings of $370 million in 2025, $785 million in 2026 and $1.045 billion in 2027 before a 15% profit-sharing adjustment. Corporate reductions are already inside that plan; adding their $300 million again would double count. The same presentation’s $4.3 billion 2026 initiative-EBIT expectation used a $2.33-per-gallon fuel assumption. That forecast is not an observed 2026 earnings result and should not be compared unadjusted with today’s fuel environment. [S15, slides 9–12]
Asset accounting is the more decisive adjustment:
| Q3 operating-profit bridge | 2025 | 2026 |
|---|---|---|
| GAAP operating profit | $35m | $379m |
| Company-adjusted operating profit | $42m | $452m |
| Aircraft/asset disposal and sale-leaseback gains | $13m | $214m |
| Depreciation benefit from higher residual values | $11m | $48m |
| Adjusted profit less those two benefits | $18m | $190m |
The residual-value change is a higher assumed value at the end of an asset’s existing depreciable life. The last row holds profit sharing fixed to isolate the adjustments. Nevertheless, it demonstrates why reported adjusted earnings alone exaggerate recurring operating progress. [S01; S02, Notes 1, 9 and 10]
The increase in disposal and sale-leaseback gains was $201 million, equivalent to 58% of the $344 million GAAP operating-profit improvement. Removing those gains and the residual-value benefit raises calculated nonfuel unit-cost growth from the reported 3.8% to approximately 8.1%. That calculation adds the benefits back to the disclosed nonfuel-cost numerator and divides by reported ASMs; it does not harmonize every peer’s CASM-X definition.
Improvement survives the adjustment. Across nine months, company-adjusted operating profit of $1.367 billion becomes approximately $869 million after subtracting $390 million of gains and $108 million of residual-value benefit. The corresponding 2025 figure is approximately $117 million. The recurring business appears better, but those figures still combine the product program, industry conditions and other operational changes. [S02, MD&A and non-GAAP reconciliation; S04]
8. Buybacks used the balance sheet as well as aircraft monetization
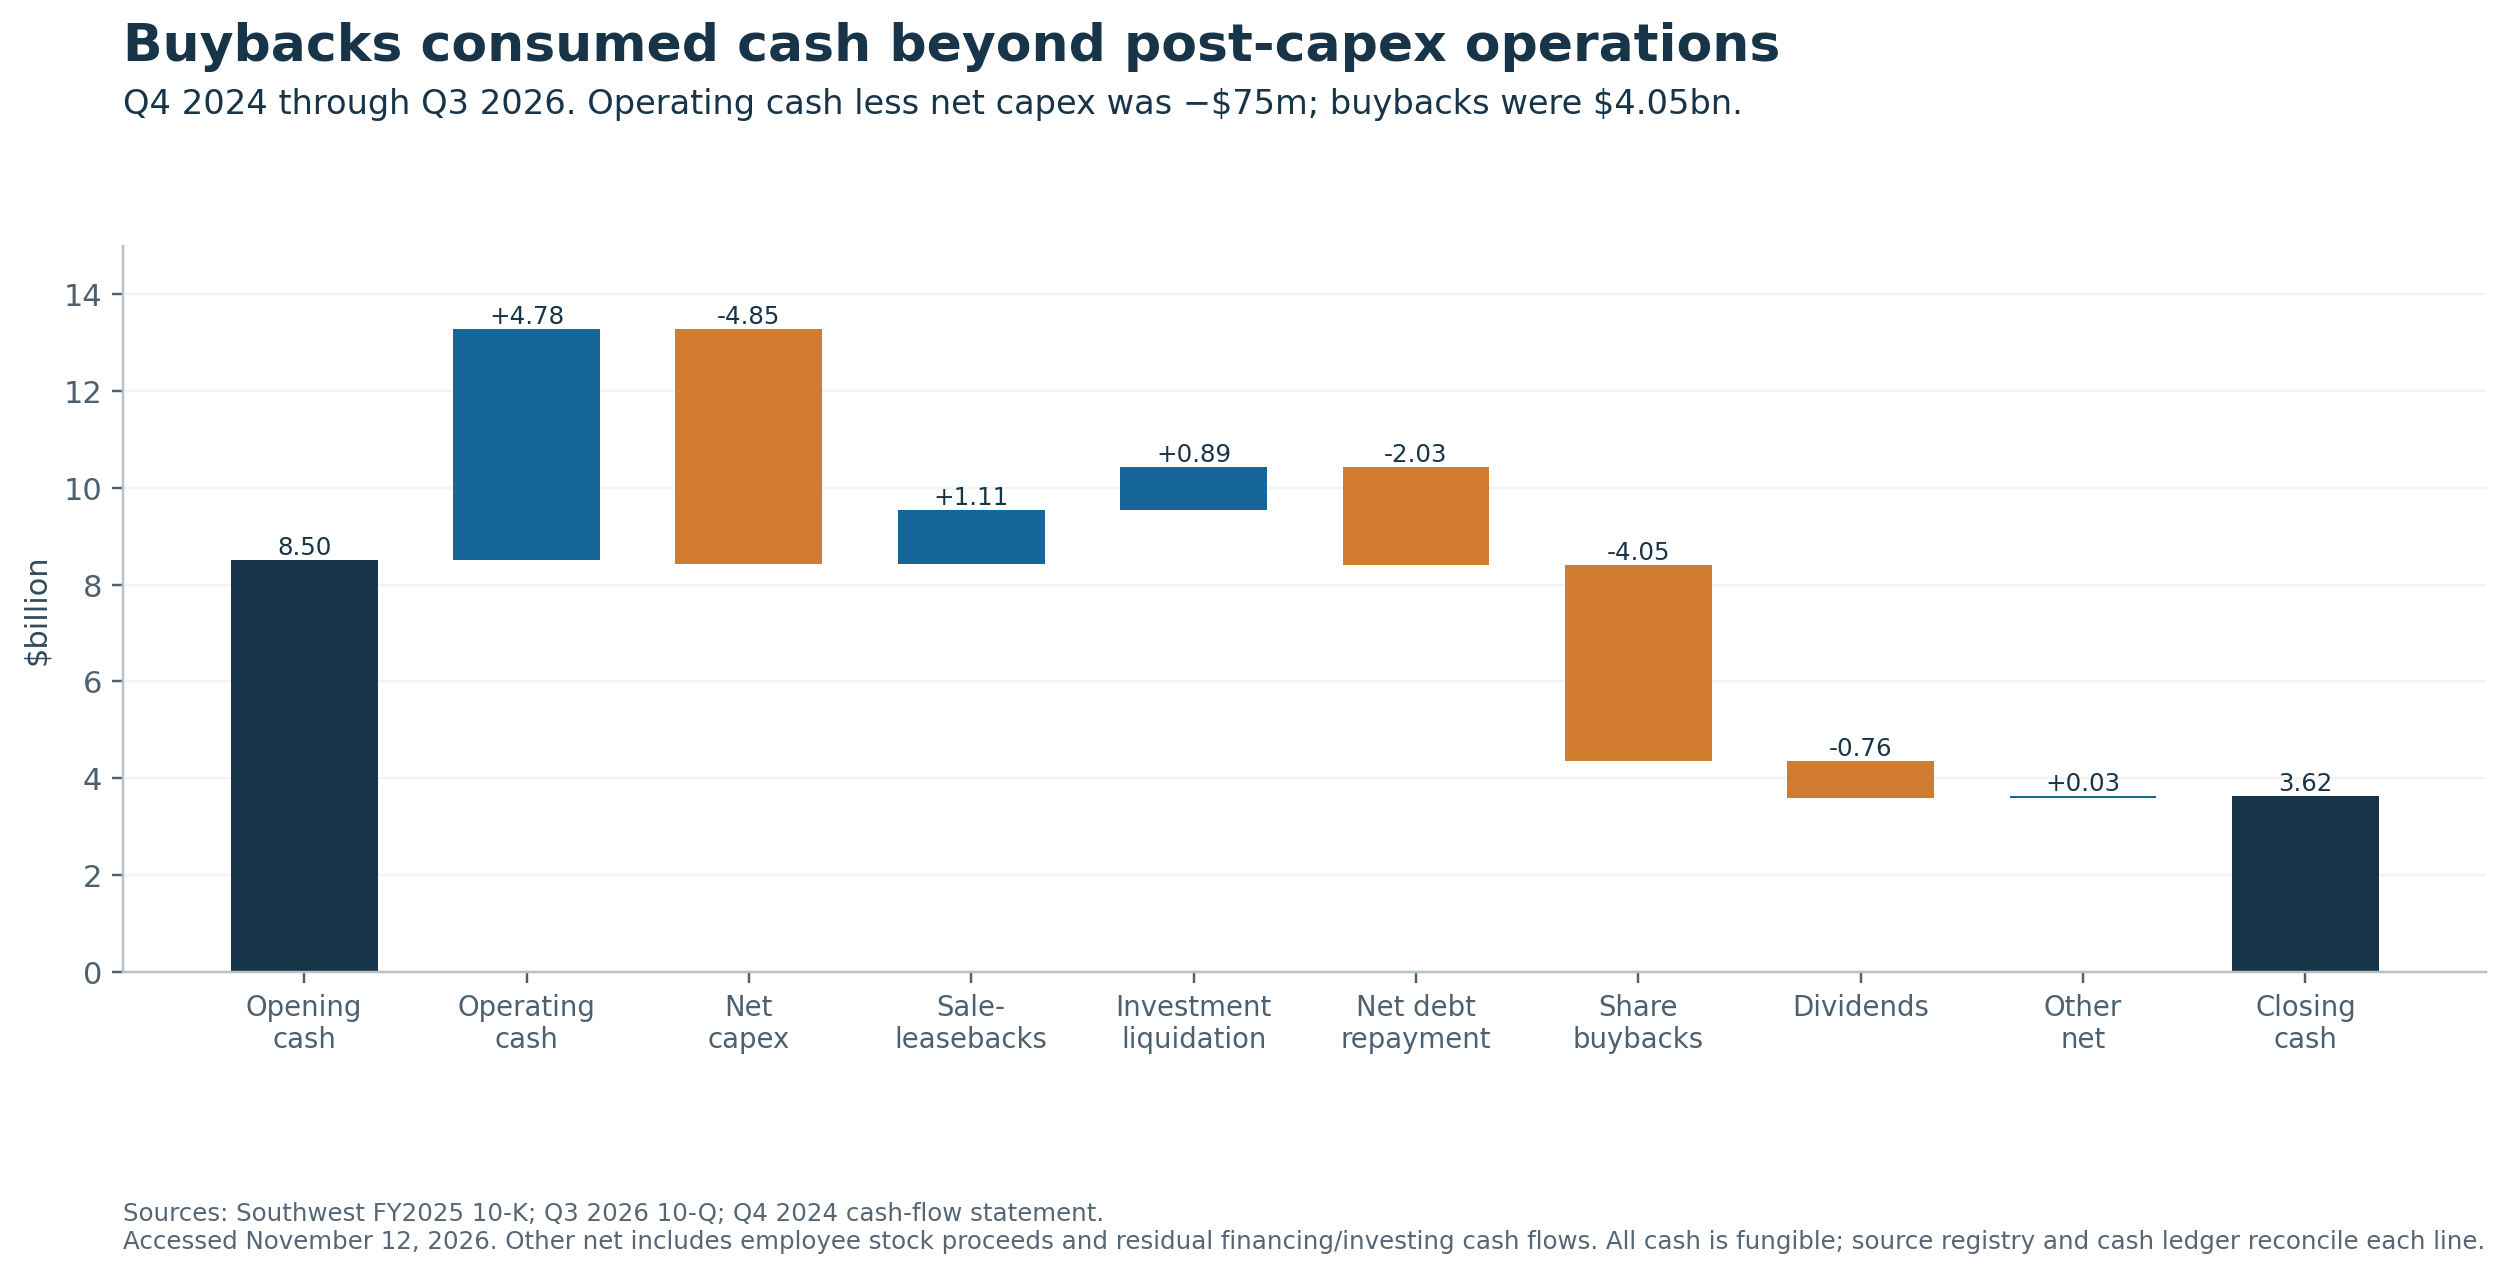
The eight repurchase programs since the Q4 2024 restart used $4.050 billion and acquired 116.078 million gross shares, an average cash cost of approximately $34.89 per share. Cash spending was $250 million in Q4 2024, $2.550 billion in 2025 and $1.250 billion in the first nine months of 2026. The 2026 spending occurred in Q1; the subsequent two quarters did not add buybacks. Gross repurchases exceed the net fall in shares because other equity activity also matters. [S03, Note 8; S34, Part II Item 2; S02]
The cash flows show how Southwest funded the repurchases.
| Cash movement, Q4 2024 through Q3 2026 | $m |
|---|---|
| Opening cash, September 30, 2024 | 8,503 |
| Operating cash flow | +4,778 |
| Net capital spending, excluding sale-leasebacks | −4,853 |
| Sale-leaseback proceeds | +1,107 |
| Net short-term investment liquidations | +890 |
| Debt issued less principal repaid | −2,027 |
| Employee-stock proceeds | +120 |
| Repurchases | −4,050 |
| Dividends | −756 |
| Other investing and financing | −88 |
| Closing cash, September 30, 2026 | 3,624 |
The cash flows come from the 2024 full-year release, the 2025 annual filing, and the 2026 nine-month filing. The workbook reproduces each subperiod and reconciles to zero difference. [S33, S03, S02]
Operating cash less net capital spending, before sale-leaseback proceeds, was negative $75 million over the combined period. Even that capital-spending measure is net of ordinary property and aircraft sales; it is not a normalized replacement-capex estimate. The $1.107 billion in sale-leaseback proceeds was material but much smaller than $4.050 billion of repurchases. Cash is fungible, so the correct conclusion is that buybacks coexisted with substantial liquidity consumption and aircraft monetization—not that a specific lease funded a specific repurchase.
The lease footnotes show the economics behind the proceeds. In Q4 2024, Southwest sold and leased back 35 aircraft for $871 million, booked $92 million of gains and added approximately $319 million of operating-lease liabilities, with leases generally lasting two to three years. A small 2025 transaction added $24 million of proceeds. Nine-month 2026 proceeds were $212 million, including $118 million of gains. Cash proceeds, accounting gains and future lease commitments are three different quantities. [S03, Note 7; S02, Note 10]
Using the December 2024 balance sheet as the starting point, cash plus short-term investments fell from $8.725 billion to $3.624 billion by September 2026, while debt fell from $6.699 billion to $5.887 billion. Net debt excluding operating leases therefore moved from negative $2.026 billion to positive $2.263 billion, a $4.289 billion deterioration. Including reported operating-lease liabilities produces a $3.914 billion deterioration. This comparison starts in December 2024, unlike the cash bridge’s September start. [S03; S02, balance sheets]
A smaller share count raises earnings per share at unchanged profit, but does not itself create enterprise value. If an asset sale and its lease are fairly priced, exchanging aircraft ownership for cash and lease obligations also creates no automatic value. Value creation requires favorable transaction pricing, better use of capital or a genuine operating advantage. Those possibilities must be demonstrated rather than inferred from EPS accretion.
9. A transparent value-per-share model
The model values incremental cash flows during 2027–2031, at the start of 2027, using 489.602 million shares, the October 21, 2026 cover-page count. It does not value Southwest’s unchanged business or produce a current stock-price target. Historical rollout costs are sunk and excluded; remaining investment is deducted. A no-growth continuation shows how much the result depends on the duration of the changes. [S02, cover page; analyst model]
Decisive assumptions
| Annual mature driver, unless stated | Low | Base | High |
|---|---|---|---|
| Incremental bag receipts versus old policy | $800m | $1,050m | $1,300m |
| Seat, bundle and loyalty revenue after displaced old products | $600m | $1,000m | $1,400m |
| Lost fare revenue / FY2024 passenger revenue | 8.0% | 2.5% | 0.5% |
| Operating savings before profit sharing | $450m | $650m | $850m |
| Recurring implementation, rent and service reinvestment | $125m | $125m | $125m |
| Remaining investment at start of 2027 | $250m | $200m | $100m |
| Discount rate | 14% | 12% | 10% |
I estimate the prospective inputs from the disclosed figures and the assumptions below. The baggage range is anchored to observed H1 2026 receipts and allows for old excess-baggage revenue, exemptions, maturation and customer responses. The seat/bundle/loyalty range is less directly observable: no public counterfactual isolates it after displaced EarlyBird, Upgraded Boarding and fare-bundle sales. That is the largest product-attribution gap.
The operating-savings range discounts the company’s broader $1.045 billion 2027 target and includes the corporate reduction. It excludes disposal gains and residual-value accounting. The fare-loss denominator is $24.980 billion of reported FY2024 passenger revenue, held fixed for transparency. I use the number to stress-test revenue in dollars. Customer churn and market-share loss require different inputs. The base 2.5% assumption means $624.5 million of lost annual fare revenue. [S03, annual financial statements; S15]
All cases assume an 85% contribution margin on new product revenue, 75% contribution lost on displaced fare revenue, 15% marginal profit sharing and 25% cash tax. These are simplifying marginal assumptions. In particular, losing fares while keeping the schedule may save less than 25% of the lost revenue; the workbook permits that assumption to change. No additional working-capital or replacement-capital requirement is assumed beyond the explicit allowances. The result approximates the change in cash flow from these policies.
For bags B, seats/bundles/loyalty S, fare attrition a, cuts K and recurring costs I, annual cash is:
C = [0.85 × (B + S) − 0.75 × (24,980 × a) + K − I] × (1 − 0.15) × (1 − 0.25)
Five-year value is Σ_(t=1)^(5)C/(1+r)^t, less remaining investment, divided by 489.602 million shares. The workbook lets readers vary each input and calculates the outputs with live formulas.
| Model output | Low | Base | High |
|---|---|---|---|
| Annual net incremental revenue | −$598m | $1,426m | $2,575m |
| Incremental operating profit after profit sharing | $14m | $1,529m | $2,487m |
| Annual after-tax cash proxy | $10m | $1,147m | $1,866m |
| Revenue contribution value/share | −$1.38 | $5.98 | $10.87 |
| Operating cuts, net of recurring costs, value/share | $1.45 | $2.46 | $3.58 |
| Remaining investment/share | −$0.51 | −$0.41 | −$0.20 |
| Independent financing premium/share | $0.00 | $0.00 | $0.00 |
| Five-year incremental value/share | −$0.44 | $8.04 | $14.24 |
The base case’s $1.529 billion operating contribution should not be mistaken for measured 2026 attribution. It is a mature annual scenario. Its $1.426 billion net revenue assumption is below four times the $435 million Q3 peer-benchmark residual. The residual is a quarterly comparison. It leaves seasonality and the effect of the policy change unmeasured. Plausibility depends on sustained revenue performance and real savings relative to an unobserved counterfactual. The low case illustrates how sizeable fees can coexist with almost no annual operating gain once fare losses and recurring costs are recognized.
Sensitivities that matter
With all other base inputs unchanged, each additional one percentage point of fare-revenue attrition costs approximately $0.88 per share of five-year value. Raising attrition from 2.5% to 5% reduces value from $8.04 to $5.84; at 8% it becomes $3.20. Raising the contribution lost per displaced fare dollar from 75% to 95% reduces base value by approximately $0.59 per share.
At base margins, bag receipts alone are offset by fare-revenue attrition of approximately 4.76% of the fixed revenue base. The full program’s annual contribution breaks even around 12.10%, or approximately 11.64% when the initial investment is included in the five-year value test. These are the break-even thresholds under the model assumptions. Seat revenue and operating cuts explain why the whole-program threshold is much larger than the bag-only threshold.
Adding a perpetual, zero-growth continuation changes low/base/high values to approximately −$0.36 / $19.11 / $37.90 per share. That large increase is precisely why it is not the headline. It assumes the estimated advantage survives indefinitely, without further erosion or investment beyond the annual allowances.
The financing case tests repurchase prices. Using the verified repurchase quantities, assumed intrinsic values of $30, $35 and $45 at the times of repurchase imply approximately −$1.16, +$0.03 and +$2.40 per remaining share from buying below or above value. Intrinsic value is unknown, and one constant value across eight transactions is a simplification. These sensitivities are not evidence of realized value creation and are not added automatically to the operating cases.
10. What an Austin or Dallas flyer should take from this
The practical comparison is the complete trip, using current fare conditions. A traveler without a waiver who checks one bag adds $90 to a domestic roundtrip; two bags add $200. Four travelers checking one bag each add $360. Those are arithmetic illustrations that hold the ticket price fixed. Carry-on and a personal item remain included under the published allowance. 12
Choice Extra and A-List Preferred include two checked bags. A-List and eligible co-branded card benefits can cover the first bag; the A-List second bag is $35 each way, compared with the standard $55. Extra-legroom and Preferred seats are different products: Preferred seats have standard legroom in more desirable locations. A traveler should compare the fare-and-seat bundle, bags, card cost if relevant, airport access and schedule before treating a cheap Basic quote as the cheapest journey. The value of an assigned seat or extra legroom is individual; the fee is directly observable. [S12, S11]
For Dallas, compare Love Field with the full DFW alternative, including the airport journey and flight time. The empirical metro comparison is broader than the traveler’s airport preference, and its one exact-airport overlap route cannot decide every itinerary. Austin travelers face a changing competitive network: Southwest’s airport share recovered in 2026 even as selected Southwest city-pair fares and competitive shares diverged. A single national brand verdict is a poor substitute for an itinerary-level total-price comparison.
What would change the research conclusion
Five developments would materially change the assessment:
- Persistent relative revenue gains after industry inflation eases. Several further quarters of matched-perimeter RASM outperformance, without larger disposal gains, would strengthen the case for durable product value.
- A stable post-change ticket panel. Full carrier-level OD40 observations, consistent reporting rules and credible pre-trends could distinguish passenger substitution from a selected-table visibility effect. The current city-pair tables cannot do that completely.
- Disclosed product contribution after substitution. Figures for new bags, seats and bundles, net of displaced products and customer incentives, could materially raise or lower the model’s revenue component.
- Service and retention evidence moving together. Continued punctuality deterioration accompanied by broad, capacity-adjusted fare/share weakness would move the estimate toward the low case. Better service with stable competitive shares would support the base or high case.
- Cash generation without repeated asset monetization. Sustained cash after credible replacement capital spending, alongside a stable balance sheet, would make the buybacks easier to justify economically.
The three leading conclusions were cross-checked against the following sources. Unit-revenue growth was recalculated from revenue and ASMs and compared with five independent issuers. Baggage receipts reconciled the BTS summary workbook to raw Form 41 account 39062; the customer side was tested against T-100 segments, the fare survey and Austin airport totals. Repurchase funding was reconciled from cash-flow statements, transaction-level share disclosures and sale-leaseback footnotes. These checks confirm the arithmetic and consistency across sources; two publications of the same underlying filing are not independent causal evidence.
Precise remaining gaps are consequential: no observed old-policy counterfactual; no route-level baggage receipts; no complete carrier-by-city-pair fare/share panel from the published summary tables; no processed individual DB1B/OD40 tickets; no comparable pre-ACERS complaint series; no reliable airport-wide exact-DAL or exact-HOU experimental control; and no demonstrated intrinsic value at each repurchase date. They are left unknown without imputation.
Editorial judgment: Southwest’s commercial reset has produced real monetization and a meaningful operating recovery. Its public record supports neither a claim that customer losses overwhelmed the program nor a claim that the program caused the entire improvement. Revenue appears to be doing most of the economic work; operating cuts contribute, while financing has changed the ownership and liquidity profile more clearly than it has demonstrated new value.
Source register and reproducibility
I accessed the cited Southwest and industry records on November 12, 2026. The dates and locations identify the underlying observations. The source-data download includes source references, underlying observations and tables used in the figures.
| ID | Primary document and URL | Period; page, tag or section |
|---|---|---|
| S01 | Southwest Q3 2026 results | Q3/9M 2026 and comparatives; income statements, operating statistics, non-GAAP reconciliation |
| S02 | Southwest Q3 2026 Form 10-Q | September 30, 2026; cover shares October 21; cash-flow statement p. 7; Notes 1, 5, 9, 10; MD&A pp. 32, 36–37 |
| S03 | Southwest 2025 Form 10-K | FY2023–25; operating statistics p. 64; financial statements p. 85 onward; leases Note 7; equity Note 8 |
| S04 | Southwest Q2 2026 results | Q2/H1 2026; breakage adjustment, operating statistics and reconciliation |
| S05 | Southwest Q1 2026 results | Q1 2026; income statement and operating statistics |
| S06 | Elliott’s initial letter and presentation announcement | June 10, 2024; investment/economic-interest and governance paragraphs; issuer-authored release |
| S07 | Cooperation agreement, Exhibit 10.1 | October 23, 2024; Sections 1 and 3, board and standstill |
| S08 | Elliott Schedule 13D/A, amendment 14 | April 3, 2026 filing; cover, Items 5 and 6; ownership event April 2 |
| S09 | Elliott Investment Management Form 13F table | June 30, 2026 holdings; Southwest common-stock row; filed August 14 |
| S10 | Southwest revenue-initiative announcement | March 11, 2025; baggage, Basic and ticket-credit changes effective May 28 |
| S11 | Assigned-seat and extra-legroom sales launch | July 29, 2025; travel beginning January 27, 2026 |
| S12 | Southwest optional travel fees | Current at cutoff; mainland checked-bag table, April 9, 2026 applicability, exemptions |
| S13 | Corporate workforce reduction | February 17, 2025; roles, expected savings and severance |
| S14 | 2024 Investor Day presentation | September 26, 2024; slide 72, especially footnote 1 |
| S15 | March 2025 JPMorgan conference presentation | March 11, 2025; slides 9–12, targets and assumptions |
| S16 | FAA statement on MAX 7 certification | August 3, 2026 certification |
| S17 | BTS Data Bank 10 / Form 41 and field definitions | Q1 2023–Q2 2026; Schedule P-1.2, accounts 39010, 39062, 49990, 71990, 79990, 98990; exact archive URLs in raw ledger |
| S18 | BTS baggage-fee workbook | 2007–Q2 2026; extracted 2023–26 sheets, airline rows and quarter columns recorded |
| S19 | BTS Data Bank 28DS / T-100 domestic segments | January 2023–July 2026; scheduled class F, passengers, seats, distance, carrier, airport and city-market IDs |
| S20 | DOT Table 6 CSV API and Table 1a CSV API | Q1 2023–Q1 2026; year, quarter, city/airport pairs, largest/lowest-fare carrier, fare and share fields |
| S21 | Domestic Airfare Consumer Report Q1 2026 | Q1 2026; pp. 2–3 definitions; Tables 1a/6 descriptions |
| S22 | BTS OD40 transition | Effective July 1, 2025; sample, issuing-carrier and monthly reporting rules |
| S23 | August 2026 Air Travel Consumer Report | H1 2025/26; printed pp. 9, 30, 42, 52, 55 and 61 |
| S24 | October 2026 Air Travel Consumer Report | August and January–August 2026; printed pp. 6, 8, 26, 37, 45 and 48 |
| S25 | Austin airport September 2026 traffic | September and January–September 2026; carrier passenger table; published October 30 |
| S26 | Austin airport September 2025 traffic | September and January–September 2025; carrier passenger table |
| S27 | FAA Federal Register notice concerning Spirit | October 8, 2026; printed p. 64452; May 2 cessation |
| S28 | Delta Q3 2026 results | Q3 2025/26; operating statistics and adjusted revenue reconciliation excluding refinery sales |
| S29 | United Q3 2026 results | Q3 2025/26; income statement, consolidated operating statistics, non-GAAP reconciliation |
| S30 | American Q3 2026 Form 10-Q | Q3 2025/26; p. 6 income statement, pp. 44–47 costs and operating statistics |
| S31 | Alaska Q3 2026 results | Q3 2025/26; pp. 5, 8, 11; consolidated figures including Hawaiian |
| S32 | JetBlue Q3 2026 results | Q3 2025/26; comparative financial and operating-statistics tables |
| S33 | Southwest Q4/FY2024 results | Q4/FY2024 and FY2023 comparatives; cash flows, annual adjustments and SWAPA reconciliation |
| S34 | Southwest Q1 2026 Form 10-Q | Q1 2026; Part II Item 2, pp. 39–40; repurchase programs and shares |
| S35 | Austin airport September 2024 report | January–September 2024; carrier passenger table; primary-domain indexed text retrieved, direct historical PDF returned 404 |
| S36 | Elliott shareholder letter, DFAN14A | August 26, 2024; Item 1, full letter and participant disclosure |
| S37 | Southwest Q4/FY2023 results | January 25, 2024; Capacity, Fleet and Capital Spending; outlook footnote (d); 79-aircraft plan |
| S38 | Southwest March 12, 2024 Form 8-K | Item 7.01; revised 2024 delivery expectation of 46 MAX 8 aircraft |
| S39 | Southwest Q1 2024 results | April 25, 2024; Fleet, Capacity and Capital Spending; outlook footnote (d); 20-aircraft plan |
Deliverable audit notes
The workbook has input, calculation and output sheets, with a low/base/high selector and a two-variable sensitivity table. It includes formulas for financial ratios, route aggregation, cash reconciliation and valuation. Independent calculations reproduce all three cases and sampled sensitivity cells.
The CSV collection contains primary extracts, derived tables and an alternative route specification.
- Southwest optional travel fees. Current at cutoff; mainland checked-bag table, April 9, 2026 applicability, exemptions ↩
- Southwest Q3 2026 results. Q3/9M 2026 and comparatives; income statements, operating statistics, non-GAAP reconciliation ↩
- BTS baggage-fee workbook. 2007–Q2 2026; extracted 2023–26 sheets, airline rows and quarter columns recorded ↩
Supporting material
- Excel model ↗Sourced inputs, live calculations and reported outputs.
- Source and model data (CSV collection) ↗Data tables, source references and calculation exports.
- Baggage fees form41 reconciliation ↗Download as CSV.