Kalshi’s $40 billion question
The market can grow faster than the fees Kalshi keeps. A valuation built around distribution, sports access, and the cash left for shareholders.

What would justify a $40 billion valuation for Kalshi?
Value the fees Kalshi retains, not a single multiple of headline trading activity. The October 14, 2026 model produces $26.4 billion of base enterprise value and $29.5 billion of weighted aggregate equity with an assumed $1 billion of unrestricted net cash. Supporting $40 billion under the base margins and capital assumptions requires roughly 50% more revenue in every forecast year, reaching $13.25 billion in 2031. The financing benchmark is reported discussions, the revenue checkpoint is a third-party annualized estimate, and the forecast is not company guidance.
Evidence: Kalshi Series F announcement · Kalshi July fee schedule · CFTC October event-contract proposal
Read this alongside Who owns the cash flow?.
Kalshi’s hardest valuation question is no longer whether people will trade on events. It is who gets paid when they do.
In May, Kalshi announced a $1 billion financing at a $22 billion valuation. By late September, Reuters was reporting talks about another round at approximately $40 billion. The first is a completed financing announcement. The second is a proposed price, not a closing I could establish as of October 14. 1 2
I think Kalshi can become a large, enduring exchange. I would not underwrite $40 billion merely by extrapolating the adoption of prediction markets. My central estimate is $28.5 billion of enterprise value, or $29.5 billion of aggregate equity value if unrestricted net cash is $1 billion. The operating base case is lower, at $26.4 billion of enterprise value. A genuinely successful breakout supports substantially more than the reported financing price; a serious restriction of sports trading supports substantially less.
The difference is not enthusiasm for the category. It is whether Kalshi keeps the customer, keeps the order, and keeps enough of the fee after other people help it grow.
Scope and assumptions
Evidence cutoff: October 14, 2026. The $22bn Series F was announced; the roughly $40bn financing remained reported discussions in the evidence reviewed. Sacra’s $4bn revenue figure is an annualized estimate, not audited FY revenue. Every forecast driver, case weight and discount parameter is an author assumption. Values are enterprise values unless labeled equity; the equity illustration adds an assumed $1bn of unrestricted net cash, not verified cash. Customer collateral, financing preferences and share-class allocations are not valued as free corporate assets.
The revenue is not a subscription
Sacra estimates that Kalshi reached a $4 billion annualized revenue pace in July 2026. That is a useful indication of scale. It is not a promise to collect $4 billion next year, an audited trailing-year revenue number, or a subscription base waiting to renew. The same research attributes roughly $7 billion of June activity to newly launched, initially zero-fee perpetual futures. A dollar of that activity did not have the same economic value as a dollar of fee-paying event trading. 3
This is where an apparently easy valuation becomes unreliable. Divide $40 billion by $4 billion and the answer is ten times. But ten times what? A seasonal trading pace, on a revenue definition that has not been publicly reconciled to rebates, distribution economics and the expenses necessary to generate it, is not equivalent to ten times a mature exchange’s net revenue.
I use three distinct quantities throughout the model. Event turnover is the number of matched contracts multiplied by their $1 maximum payout, counted once per matched trade. Perpetual-futures turnover is traded exposure in dollars. Economic net revenue is what remains for Kalshi after transaction-linked concessions and distribution payments, before its own operating expenses. These are modeling definitions; I do not assume every public volume dashboard uses them.
There is no credible way to reconstruct a complete income statement from the public checkpoints alone. The missing information is specific: monthly revenue recognized, gross-to-net adjustments, retention after incentives, partner routing, customer acquisition spending and unrestricted corporate cash. Rather than fill those blanks with invented historical numbers, I forecast the economics that would have to exist.
| Checkpoint | Figure | What it is |
|---|---|---|
| May 7, 2026 | $22bn valuation; $1bn raised | Company financing announcement [1] |
| May 7, 2026 | $178bn annualized trading volume | Company-reported activity pace [1] |
| July 2026 | $4bn annualized revenue | Sacra estimate; not audited annual revenue [3] |
| September 29, 2026 | Approximately $40bn valuation | Reported financing discussions [2] |
Dates and definitions are not interchangeable. The forecast does not divide these non-matched periods to infer a realized take rate.
Start with one trade
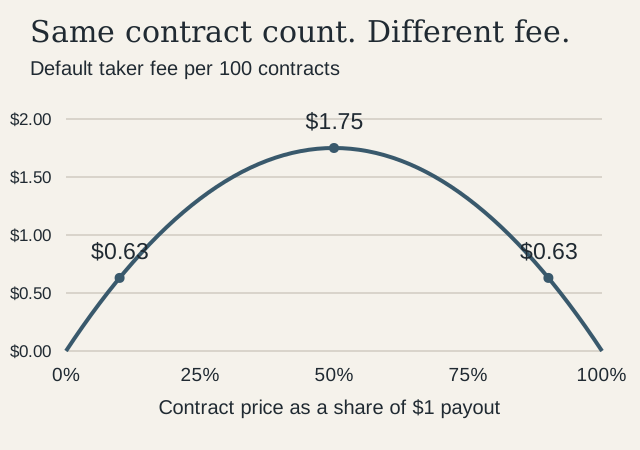
Kalshi’s July fee schedule makes the arithmetic concrete. Ignoring rounding where it does not change the result, the default taker fee is 0.07 × contracts × price × (1 − price). Series-specific multipliers and maker-fee exceptions can change the total. 4
Buying 100 contracts at 50 cents produces a $1.75 default taker fee. Those contracts have $100 of maximum payout notional, while that buyer pays $50 for the position. The same fee is therefore 1.75% of notional or 3.5% of the buyer’s premium. These are two descriptions of one fee, not two revenue streams. At either 10 cents or 90 cents, the default fee for 100 contracts is only 63 cents.
An exchange whose activity shifts toward contracts priced near zero or one can grow contract count faster than fees. A shift toward promotional products, wholesale distribution or price-sensitive professional trading can do the same. There is no single permanent take rate that can be multiplied by every volume figure in a press release.
Nor does the bid–ask spread automatically belong to the exchange. It compensates the party supplying liquidity, which may be a separate market maker. Counting that spread as exchange revenue without evidence would manufacture a business line. My forecast values retained fees, not the gross winnings of traders or every dollar deposited into their accounts.
A real exchange is a narrower claim than a monopoly
The attractive version of Kalshi is not a website full of questions. It is a place where participants can obtain an executable price, trade a meaningful amount, understand the settlement rule and trust that the contract will pay correctly. The product is the whole transaction, not the probability displayed above it.
This gives the business a plausible network effect. More competitive orders can improve execution, which attracts more flow, which makes supplying liquidity more worthwhile. Reputation also carries between markets: a participant need not rediscover whether an exchange handles withdrawals and disputes competently every time a new contract appears.
But each event still has a local liquidity problem. Depth in one election contract is not immediately depth in tomorrow’s basketball game. Common infrastructure helps; it does not make every newly listed outcome liquid. The relevant advantage is repeated success at assembling a market, rather than exclusive ownership of the idea of betting on an outcome.
Messari’s April microstructure study is useful precisely because it looks below headline volume. Its analysis found in-game order-book depth falling by 76%, illustrating that high activity and abundant executable liquidity are not interchangeable. This is a historical result in that research, not a measurement of every Kalshi market today. 5
The distinction matters financially. A venue with consistently better depth can charge for execution quality. A venue with a recognizable brand but fragile depth may have to keep subsidizing the people who make the market usable. The first can earn exchange margins. The second has to purchase part of its apparent network effect every day.
CME offers a useful comparison, and a warning against a lazy one. Its second-quarter release reported $95 billion of average daily margin efficiencies. Portfolio offsets can make an established clearing system valuable even when a competing screen offers a similar contract. That is a different source of customer attachment from an attractive consumer app. Kalshi should not receive the value of mature portfolio netting before it has built the relevant products and capital relationships. 14
The distributor can become the exchange
The clearest threat to an uncomplicated exchange thesis comes from an apparent source of growth.
In June, Robinhood announced that selected World Cup and baseball contracts were trading through Rothera, its exchange venture with Susquehanna. Its disclosures also identify KalshiEX and ForecastEx as venues for event contracts. The customer relationship and the venue supplying the trade are already separable. 6
For Kalshi, embedded distribution can be excellent business. Another company supplies the interface, customer trust and funded account. Kalshi supplies a market the customer can use without first deciding to download a dedicated prediction app. August’s announced Alpaca partnership points toward more of that distribution, although an announcement is not evidence of realized incremental volume. 7
The bargain has a cost. The distributor can compare venues, negotiate economics and eventually help build an alternative. It does not need to move every order to make its threat credible. It needs enough viable alternatives to prevent Kalshi from pricing as though customer access is permanently captive.
I therefore expect event trading to become more common inside existing financial products, while the share of each trade’s economics available to the underlying venue comes under pressure. This is my forecast, not a claim that the contractual terms are public. Kalshi’s direct business matters because a loyal, funded direct customer is less exposed to someone else’s routing decision.
There is a second route to growth: become a broader derivatives venue. Kalshi announced its perpetual-futures launch in May. That enlarges the opportunity, but introduces a different revenue denominator and competitors whose economics need not resemble binary contracts. I model perpetuals separately at a few basis points, rather than attach event-contract yields to leveraged exposure. 8
Data could provide a more recurring income stream. But that market is not waiting unoccupied. ICE launched a Polymarket signals product in February, distributing structured event-market information to institutional customers. Kalshi has to sell reliable coverage, history, integration and service, not merely assert that probabilities are valuable. 9
AI can improve the market and compress the fee
My expectation is that automated participants will make more event markets competitive. Reading announcements, comparing related contracts and monitoring changing prices are tasks for which the cost of software participation can fall. That can increase turnover without a corresponding increase in human users or fresh money entering the system.
The benefit to Kalshi depends on what follows. Faster arbitrage may tighten spreads and make hedging practical. It may also move a larger fraction of trading to sophisticated participants who negotiate fees aggressively and route across venues. A better forecast can be a better public product while becoming a cheaper financial product.
There is a retention constraint underneath this. In a closed group of traders, gains and losses net out before costs. Fees leave the group. An entertainment-led market therefore cannot be valued as though the same retail funds can circulate indefinitely without withdrawals, losses or replenishment. Professional traders can improve prices, but their profits also have to come from somewhere.
This is why I would pay more attention to repeat funded customers and revenue after incentives than to the number of automated orders. The business becomes more valuable when better execution produces durable demand, not merely when machines make the activity chart steeper.
Sports access belongs in the cash flows
The legal position changed again only five days before this valuation’s cutoff. On October 9, the CFTC proposed expressly including event contracts based on sports, politics, culture and weather in the definition of a swap. It is a proposed rule, not a final rule or a conclusive resolution of state challenges. 10
The agency’s accompanying text describes a divided judicial position: a favorable Third Circuit interpretation in April, an opposing Ninth Circuit interpretation in August, and an adverse Sixth Circuit ruling in September. The CFTC is defending its jurisdiction in that document; I am not treating its preferred reading as a court’s final answer. 11
A favorable federal outcome would support broader access and reduce one source of uncertainty. It would not eliminate the need to monitor trading, settle disputes or compete for customers. Kalshi’s announced Nasdaq surveillance integration is evidence of investment in those capabilities, not evidence that the work is finished. 12
The unfavorable outcome is not simply a higher discount rate. It is fewer accessible customers, lower sports turnover, weaker acquisition efficiency and an operating cost base that cannot immediately shrink with revenue. I represent that in a restricted case with a sharp revenue contraction and operating losses through the early forecast. The business then survives on a smaller franchise; survival is not assumed to preserve the last financing value.
My base case assumes sports remains a substantial business despite restrictions and compliance costs. The breakout case assumes much broader acceptance together with strong execution. These are joint operating scenarios, not numerical predictions about an individual court case. I do not apply an extra blanket legal haircut after already reducing the cash flows.
What I am underwriting
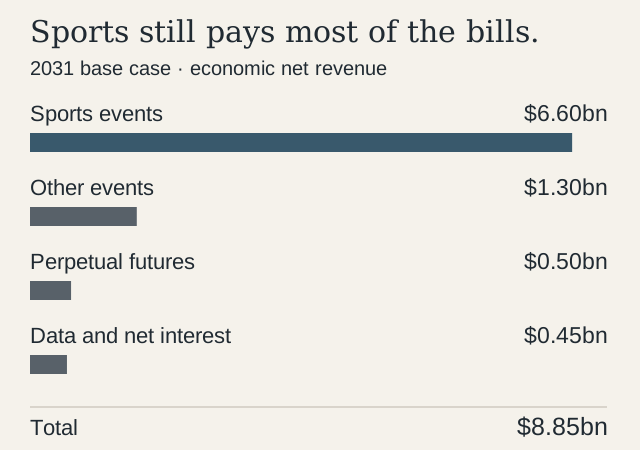
The base case generates $4.83 billion of economic net revenue in 2027 and $8.85 billion in 2031. It is deliberately not a reconstruction of calendar 2026. The $4 billion starting normalization is a modeling anchor informed by the reported run rate, not an assertion that the estimate is audited net revenue.
Sports remains the engine. I assume annual sports turnover rises from $300 billion to $600 billion while retained fee yield falls from 1.35% to 1.10%. Other event turnover grows from $70 billion to $200 billion at lower yields. Perpetuals reach $2 trillion of annual traded exposure but contribute only $500 million of net revenue at 2.5 basis points. All of these are assumptions.
The sports yield is not automatically conservative. The published schedule’s fee varies with contract price, and the model’s retained yield has to survive incentives and distribution costs. Sustaining 1.10% across $600 billion of sports notional requires an attractive product mix and meaningful pricing power. Changing that assumption is more informative than describing the entire forecast as cautious.
The model’s $6.6 billion of 2031 sports revenue also has a customer-budget implication. If it were supported by 30 million annual fee-paying sports customers, it would require $220 of retained revenue per customer; with ten million, $660. Neither customer count is an estimate of Kalshi’s actual users. They show the scale of participation and replenishment needed, before accounting for what those customers might lose to other traders or pay elsewhere.
I allow $450 million of ancillary revenue by 2031. An illustrative split is $300 million of data and services plus $150 million of net interest retained on eligible balances. The latter would require $5 billion of average eligible balances at a 3% net retained yield. These balances and economics are not disclosed inputs. Their principal is not corporate wealth, and the model never adds customer collateral to equity value.
| Driver | 2027 | 2031 |
|---|---|---|
| Sports event turnover | $300bn | $600bn |
| Retained sports fee yield | 1.35% | 1.10% |
| Other event turnover | $70bn | $200bn |
| Retained other-event yield | 0.75% | 0.65% |
| Perpetual-futures exposure traded | $400bn | $2,000bn |
| Retained perpetuals yield | 2.5 bp | 2.5 bp |
| Ancillary revenue | $0.15bn | $0.45bn |
| Economic net revenue | $4.83bn | $8.85bn |
| Operating margin, including stock compensation | 42% | 50% |
All figures are author assumptions. Event notional is $1 maximum payout per matched contract, counted once; perpetuals notional is exposure traded. Do not add the two and call the result customer spending.
Turn revenue into owner cash
A 50% operating margin is an ambitious outcome, but not an impossible exchange outcome. ICE reported a 74% GAAP operating margin for its Exchanges segment in the second quarter of 2026, versus 52% for the consolidated group. That distinction matters: the segment is not the whole company, and neither percentage is evidence of Kalshi’s current profitability. 13
My base margin rises from 42% to 50% as the business scales. It includes employee stock compensation as an economic expense, along with the continuing cost of product development, marketing, compliance and operations. I do not add stock compensation back to free cash flow and then forget that employees own part of the business.
After applying a 26% tax assumption to positive operating profit, I deduct reinvestment equal to one dollar for every four dollars of incremental annual revenue. This is an aggregate allowance for net capital expenditure, working capital and additional required operating capital. It is not an estimate of server spending. Maintenance depreciation is assumed to be offset by maintenance capital expenditure; the model deducts growth investment separately. A contracting business gets no automatic cash windfall from releasing capital.
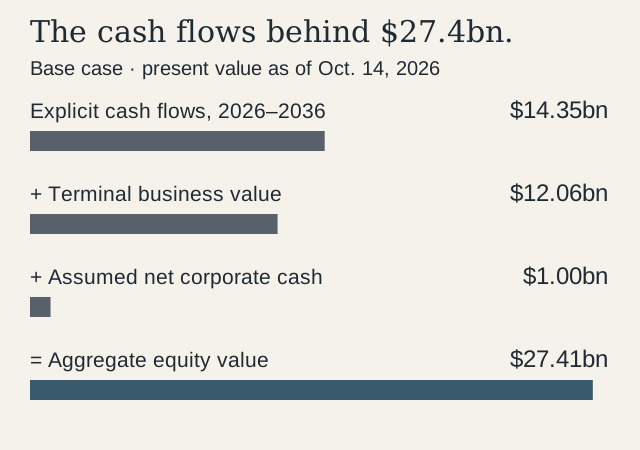
I forecast each year through 2036. After 2031, revenue growth fades to 12%, 10%, 8%, 6% and 4%, respectively. Perpetual growth is 3%, and a 20% terminal incremental return on capital requires reinvesting 15% of terminal after-tax operating earnings. The terminal value is therefore not a free perpetuity on all earnings.
Cash flows are discounted at an assumed 13% to October 14, 2026, using actual days to each year-end divided by 365. The remaining 2026 stub contributes approximately $184 million of present value under a common normalization; scenario divergence begins in 2027. The restricted case receives no immediate tax refund for losses and no speculative credit for using those losses later.
The 13% discount rate is a judgment about the return required from this risky, illiquid operating business, not a measured Kalshi WACC derived from an observable beta. Specific sports-access outcomes sit in the scenarios. The discount-rate sensitivity shows the consequence of disagreeing about the remaining required return.
| USD billions | 2027 | 2029 | 2031 | 2036 |
|---|---|---|---|---|
| Net revenue | 4.83 | 6.51 | 8.85 | 12.98 |
| Operating profit | 2.03 | 2.99 | 4.42 | 6.49 |
| After-tax operating profit | 1.50 | 2.22 | 3.27 | 4.80 |
| Growth reinvestment | 0.21 | 0.23 | 0.32 | 0.12 |
| Unlevered free cash flow | 1.29 | 1.99 | 2.96 | 4.68 |
Forecasts, not reported results. Unlevered free cash flow equals after-tax operating profit less growth reinvestment. No financing cash inflows are counted as operating cash flow.
Three businesses, three values
The restricted case reaches only $2.04 billion of net revenue in 2031. Sports turnover is $150 billion at a 0.80% retained yield; the platform’s operating margin begins at negative 30% in 2027 and recovers to 30% by 2031. The resulting $2.6 billion enterprise value is not a liquidation floor. Worse legal, liquidity or funding outcomes could destroy more value.
The base case produces $26.4 billion of enterprise value. Its $8.85 billion of 2031 net revenue and $4.42 billion of operating profit already describe a highly successful company. This is not a forecast that prediction markets disappear.
The breakout case requires $1 trillion of annual sports notional at a 1.25% retained yield, $400 billion of other event turnover, $4 trillion of perpetuals turnover and $900 million of ancillary revenue by 2031. Revenue reaches $18 billion and operating margin reaches 58%. That supports $58.7 billion of enterprise value. It combines widespread access, strong direct demand, successful distribution and less fee erosion than in the base case. Those favorable outcomes cannot be assumed independently costless.
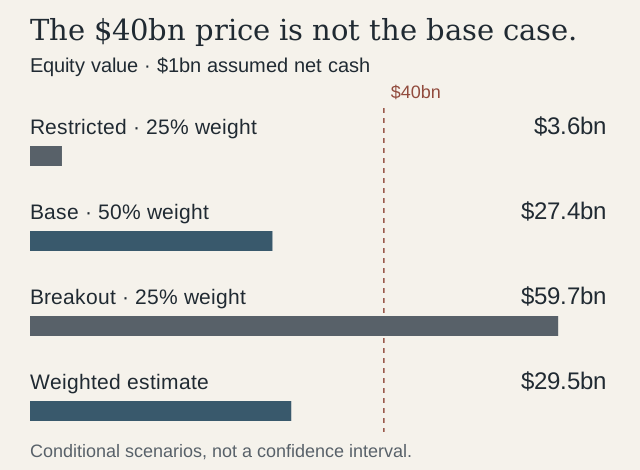
I assign 25% to restricted, 50% to base and 25% to breakout, producing $28.5 billion of weighted enterprise value. These are my underwriting weights, not market-implied probabilities or a statistical confidence interval. The wide spread is a feature of the business’s unresolved economics, not a reason to report an exact point estimate as knowledge.
To compare with a financing headline, I add $1 billion of assumed unrestricted net corporate cash. That produces approximately $3.6 billion, $27.4 billion and $59.7 billion of aggregate equity value, and a weighted estimate of $29.5 billion. With zero net cash the weighted estimate is $28.5 billion; with $2 billion, it is $30.5 billion. Required regulatory capital and customer assets are not excess cash.
A funding announcement does not establish that cash bridge. Capital may already have been spent, earmarked, supplied by secondary buyers rather than the company, or offset by liabilities. Nor does aggregate equity value tell an investor what a particular common or preferred share is worth. Existing options and share-class rights still have to be allocated against that value. I am not inventing a cap table to manufacture a per-share target.
| Author assumption / result | Restricted | Base | Breakout |
|---|---|---|---|
| Underwriting weight | 25% | 50% | 25% |
| 2031 revenue | $2.04bn | $8.85bn | $18.00bn |
| 2031 operating margin | 30% | 50% | 58% |
| Enterprise value | $2.6bn | $26.4bn | $58.7bn |
| Equity with $1bn assumed net cash | $3.6bn | $27.4bn | $59.7bn |
Values as of October 14, 2026. Common 13% discount rate and 3% terminal growth. Scenario weights are subjective and combine regulatory, competitive and execution outcomes.
What $40 billion requires
A useful model should be able to argue against its author. The reverse valuation asks how much better the business must become before the proposed price is justified.
Holding the base-case margins, growth shape, reinvestment rules, discount rate and terminal assumptions constant, the model needs approximately 50% more revenue in every forecast year to support $40 billion of equity with $1 billion of net cash. That means roughly $7.22 billion of net revenue in 2027 and $13.25 billion in 2031, rather than $4.83 billion and $8.85 billion. Reinvestment rises with the larger business. This is one explicit price-consistent path, not the only combination of assumptions that works.
That result should not be read as requiring $13.25 billion in 2031 alone. Timing matters. A company that reaches that number only at the end, after several weaker years, is worth less than the modeled path. Nor is a faster-growth outcome worth the same amount if the additional revenue is purchased with weaker margins or more capital.
The fees also matter in dollars large enough to change the decision. Reducing retained sports yield by 25 basis points in each of 2027–2031, with the lower revenue level carried into the later forecast, reduces base equity value from $27.4 billion to $23.2 billion. That sensitivity holds operating margins constant, so it allows expenses to shrink with revenue. If costs prove sticky, the damage would be larger.
Conversely, a lower required return helps. At an 11% discount rate and 3% terminal growth, base equity value rises to $35.0 billion. At 15% and 3%, it falls to $22.4 billion. Even the favorable 11%/4% combination in the table remains below $40 billion. The proposed price needs an operating improvement, a still lower required return, more excess cash, or some combination.
There is another way to express the disagreement. Hold the restricted weight at 25%, and let probability move only between base and breakout. To make the weighted equity value equal $40 billion, the breakout weight must rise to about 57.4%, leaving only 17.6% in the base case. That is a meaningful change in conviction, not a rounding difference in a terminal multiple.
| Discount rate | 2% terminal growth | 3% terminal growth | 4% terminal growth |
|---|---|---|---|
| 11% | $33.8bn | $35.0bn | $36.6bn |
| 12% | $30.0bn | $30.8bn | $31.8bn |
| 13% | $26.8bn | $27.4bn | $28.1bn |
| 14% | $24.3bn | $24.7bn | $25.1bn |
| 15% | $22.1bn | $22.4bn | $22.7bn |
All cells retain a 20% terminal incremental return on capital, so higher perpetual growth also requires more reinvestment. These sensitivities are not scenario probabilities.
The evidence that would change my price
I would move toward $40 billion if a reconciled revenue history showed that a stronger run rate persists outside exceptional events, survives incentives being withdrawn and belongs to Kalshi after its distribution partners are paid. The reverse model gives that evidence a scale: a path toward approximately $7.2 billion of 2027 economic net revenue, with base-like margins and reinvestment, is materially different from a few unusually busy trading weeks.
I would also pay more for proof that distribution increases the business without hollowing out its economics. The useful disclosure is not another partner logo. It is the share of net fees generated directly, the retained yield on intermediated trades, partner concentration, and whether competitive routing changes those yields. A growing contribution from non-sports contracts and paid data would reduce the company’s dependence on one legal and customer-demand regime.
On the other side, declining direct retention, revenue concentrated in incentives or long-shot churn, and a retreat in executable depth would make the exchange less valuable even if reported notional kept rising. A disclosed cash balance would narrow the equity bridge. It would not repair weak unit economics.
My central judgment is that event markets become a normal feature of financial distribution, not a separate destination every customer must consciously choose. Kalshi has a credible path to being one of the venues that powers them. The same transition gives distributors and professional traders more leverage over price.
That is a good business at the right valuation. On the information available now, I would anchor negotiations around $30 billion of aggregate equity value, conditional on the cash bridge and security terms, rather than accept $40 billion as the natural consequence of a large market. I expect Kalshi to become substantially larger. I do not expect its share of each trade’s economics to remain untouched.
Method and reading
The model and its assumptions are available with this article. It can be reproduced without paid data or credentials. Figures use the same forecast outputs; values in the prose are rounded. No private-company financial statement, unpublished broker agreement or full capitalization table was available for this valuation.
The research began with the regulation-first framing in Contrary’s early Kalshi profile and the execution-quality analysis in Messari’s April study, then moved to current company releases, the fee schedule and the October CFTC proposal. The old profile is useful history, not a source for current operating figures. 16 I also reviewed the public abstract of PitchBook’s September initiation report, not the underlying paid report or its full model. Its conclusions were not used as model inputs. 17
For the valuation architecture, Aswath Damodaran’s Airbnb discussion is the useful precedent: separate activity from retained revenue, connect the operating story to investment needs, and solve for what the proposed price requires. The inputs here are my own. The accompanying research note records the reading scope and the claims accepted or excluded. 15
Sources
- Series F: $1 billion raised at $22 billion
Kalshi · 2026-05-07 · Primary disclosure
Verified Oct 14, 2026
Announced financing and annualized trading volume; company claims, not audited financial statements.
- Investors discuss another $1 billion financing
Reuters · 2026-09-29 · Reported financing discussions
Verified Oct 14, 2026
Approximately $40 billion discussed valuation. Talks are not a completed transaction; no closing confirmation was established by this review.
- Revenue and business estimates
Sacra · July 2026 revenue checkpoint; accessed October 14 · Third-party estimates
Verified Oct 14, 2026
Estimates $4 billion annualized revenue in July; attributes about $7 billion of June activity to initially zero-fee perpetuals. Neither metric is an audited annual result or a reconciled economic-net-revenue series.
- Fee schedule, July 7 revision
Kalshi · 2026-07-07 · Primary disclosure
Verified Oct 14, 2026
Page 2: default taker coefficient 0.07 times contracts times price times one minus price, with market multipliers and rounding. Maker coefficient 0.0175 with default multiplier zero; exceptions apply. Calculations in the article use multiplier one and no rounding difference.
- Sports-market microstructure study
Messari / Kunal Doshi · 2026-04-16 · Original market research
Verified Oct 14, 2026
Research reports a 76% reduction in in-game order-book depth in its analysis. Historical sample, not a current all-market liquidity measurement.
- World Cup trading on Robinhood and Rothera
Robinhood · 2026-06-04 · Primary disclosure
Verified Oct 14, 2026
Selected contracts route to the Robinhood–Susquehanna exchange venture; disclosures also name KalshiEX and ForecastEx. Does not disclose Kalshi revenue sharing or current routing shares.
- Alpaca distribution partnership
Kalshi · 2026-08-31 · Primary disclosure
Verified Oct 14, 2026
Announced API distribution plans. Not treated as realized partner volume or a quantified customer acquisition benefit.
- Perpetual-futures launch
Kalshi · 2026-05-29 · Primary disclosure
Verified Oct 14, 2026
Product expansion beyond event contracts. Fees, leverage and notional should not be imported from binary contracts.
- Polymarket Signals and Sentiment tool
Intercontinental Exchange · 2026-02-11 · Primary disclosure
Verified Oct 14, 2026
Institutional distribution of structured prediction-market data is already a competitive product, not an unclaimed market.
- CFTC proposal to include event contracts in swap definition
CFTC · 2026-10-09 · Primary disclosure
Verified Oct 14, 2026
Notice of proposed rulemaking, not a final rule or court judgment.
- Proposed-rule text and appellate-case discussion
CFTC · 2026-10-09 · Primary disclosure
Verified Oct 14, 2026
Pages 9–11 discuss the Third, Ninth and Sixth Circuit decisions. The agency is defending its own jurisdiction; its legal interpretation is not presented as a neutral judicial determination.
- Nasdaq surveillance partnership
Kalshi · 2026-08-10 · Primary disclosure
Verified Oct 14, 2026
Phased, multiyear surveillance integration announced. Not proof that manipulation, operational failures or enforcement risk disappear.
- Second-quarter 2026 results
Intercontinental Exchange · 2026-07-30 · Primary disclosure
Verified Oct 14, 2026
74% Exchanges-segment GAAP operating margin; 52% consolidated GAAP margin. Net revenue excludes transaction-based expenses. Neither is an observed Kalshi margin.
- Second-quarter 2026 results
CME Group · 2026-07-22 · Primary disclosure
Verified Oct 14, 2026
Company reports $95 billion average daily margin efficiencies. Used to distinguish portfolio offsets from simple brand or traffic advantages, not as a Kalshi capability.
- December 2020 Airbnb valuation discussion
Aswath Damodaran · 2020-12-02 · Valuation-method reference
Verified Oct 14, 2026
Method reference: separate gross bookings, retained revenue, operating margin, reinvestment and price-implied assumptions. Reviewed the indexed December archive text, not the underlying spreadsheet.
- Early Kalshi company profile
Contrary Research · 2023 profile; accessed 2026-10-14 · Company research
Verified Oct 14, 2026
Reviewed for the regulation-first business thesis. Historical operating and valuation figures are not used as current data.
- Kalshi initiation report: public abstract
PitchBook · 2026-09-23 · Research abstract
Verified Oct 14, 2026
Public abstract only. Full paid report and financial model were not accessed; its valuation conclusions are not used as assumptions.
Supporting material
- Interactive valuation model
Change discount rate, terminal growth, net cash and retained sports fees. All inputs are assumptions.
- Reproducible model
Standard-library model, dated cash flows, reverse valuation and arithmetic checks.
- Annual forecast data
All three cases, 2027–2036. USD billions; author assumptions, not guidance.
- Model assumptions
Machine-readable segment drivers, case weights and capital assumptions.