Financial systems
What large 2025–26 IPOs left out of adjusted profit
Fifteen of 42 selected adjusted earnings measures turned a reported loss into a profit for the same period. Adjustment size showed little relationship to later returns.
Fifteen of 42 issuers with a selected adjusted earnings measure showed a profit after adjustments for a period with a GAAP or IFRS loss. The size of those adjustments had little relationship to share returns at six or twelve months in this sample.
The base-offer universe contains 52 US listings that sold more than $500 million of public shares, with $163.552 billion of gross proceeds. The 15 loss-to-profit comparisons include a historical predecessor of WaterBridge. Excluding that predecessor leaves 14. Janus Living reported adjusted funds from operations, a real estate measure outside the 42 earnings comparisons. A sensitivity test adds six IPOs whose gross proceeds exceeded $500 million after underwriters exercised their options.universe
Using custom exclusions beyond ordinary EBITDA adjustments, the six-month rank correlation with S&P 500-relative returns is −0.142, using 29 issuers; at twelve months it is +0.011, using 20. Both confidence intervals span zero. The six additional IPOs leave the estimated relationships weak.model
The stronger findings concern what the measures mean. Some gaps chiefly remove stock compensation. Others chiefly remove depreciation, financing costs or valuation changes. Several categories described as nonrecurring appear in three annual periods. IPO vesting can create a large accounting charge, yet substantial stock-pay expense can continue afterward. Software capitalization can leave a cost outside both current GAAP expense and adjusted EBITDA. The size and persistence of those costs matter for interpreting a prospectus.
1. The universe depends on what “raised more than $500 million” means
The principal definition is gross base public shares multiplied by the final offer price, including shares sold by existing holders. It excludes the underwriting option and concurrent private placements. This is reproducible from the cover of a final prospectus and counts only shares in the base offering.
That definition produces 25 offerings in 2025, raising $28.919 billion, and 27 in 2026 through the cutoff, raising $134.634 billion. The public-offering proceeds include sales by existing shareholders. Requiring the issuer’s own shares alone to raise more than $500 million reduces the universe to 40.universe
The requested S-1/F-1 approach identifies 47 offerings. The broader US listings sample also includes four S-11 real-estate registrations, SmartStop, Fermi, Janus Living and Blackstone Digital Infrastructure Trust, and the N-2 offering of Pershing Square USA.fermi Their different forms and business models remain visible. The statistical results are also recomputed using only S-1/F-1 registrations.
SK hynix was already listed in Korea; this study includes its first US ADS offering and labels that fact explicitly. SmartStop was previously a nontraded REIT, so its event is a first listed public offering. Readers seeking only first-ever public offerings can remove those records without having to reconstruct the source data.skhy, sma
Pershing Square USA needs special treatment. Its public base comprised 40,516,960 shares at $50, or $2.026 billion. A larger headline financing amount included a concurrent private placement, which this calculation excludes. Each public share came with 0.2 shares of Pershing Square Inc. The return model therefore follows that economic basket; using PSUS alone would discard part of what the IPO purchaser received.psus
The supplemental cohort contains Caris, Via, Hinge Health, Liftoff Mobile, National Healthcare Properties and ADARx Pharmaceuticals. Their base offerings were below $500 million, but verified option exercise took gross public proceeds above it.
| Issuer | First trade | Base public proceeds, $m | After verified exercise, $m |
|---|---|---|---|
| HNGE | 2025-05-22 | 437.312 | 502.909 |
| CAI | 2025-06-18 | 494.118 | 568.235 |
| VIA | 2025-09-12 | 492.857 | 555.336 |
| NHP | 2026-04-22 | 462.000 | 531.300 |
| LFTO | 2026-06-04 | 437.000 | 502.550 |
| ADRX | 2026-09-25 | 446.250 | 513.188 |
A granted option is insufficient evidence of exercise. The screening also checked near-threshold exclusions, including transactions that remained below the threshold. Exactly $500 million fails the strict “greater than” test. A total combining base proceeds and exercised options would require option-exercise data for all 52 original offerings.boundary
The screen includes blank-check IPOs. None identified exceeded the base threshold. Drugs Made In America Acquisition II had a public base of exactly $500 million, and its later annual report says the underwriting option expired unexercised. The potential $575 million deal therefore does not qualify under either the base or documented-exercise rule.spac
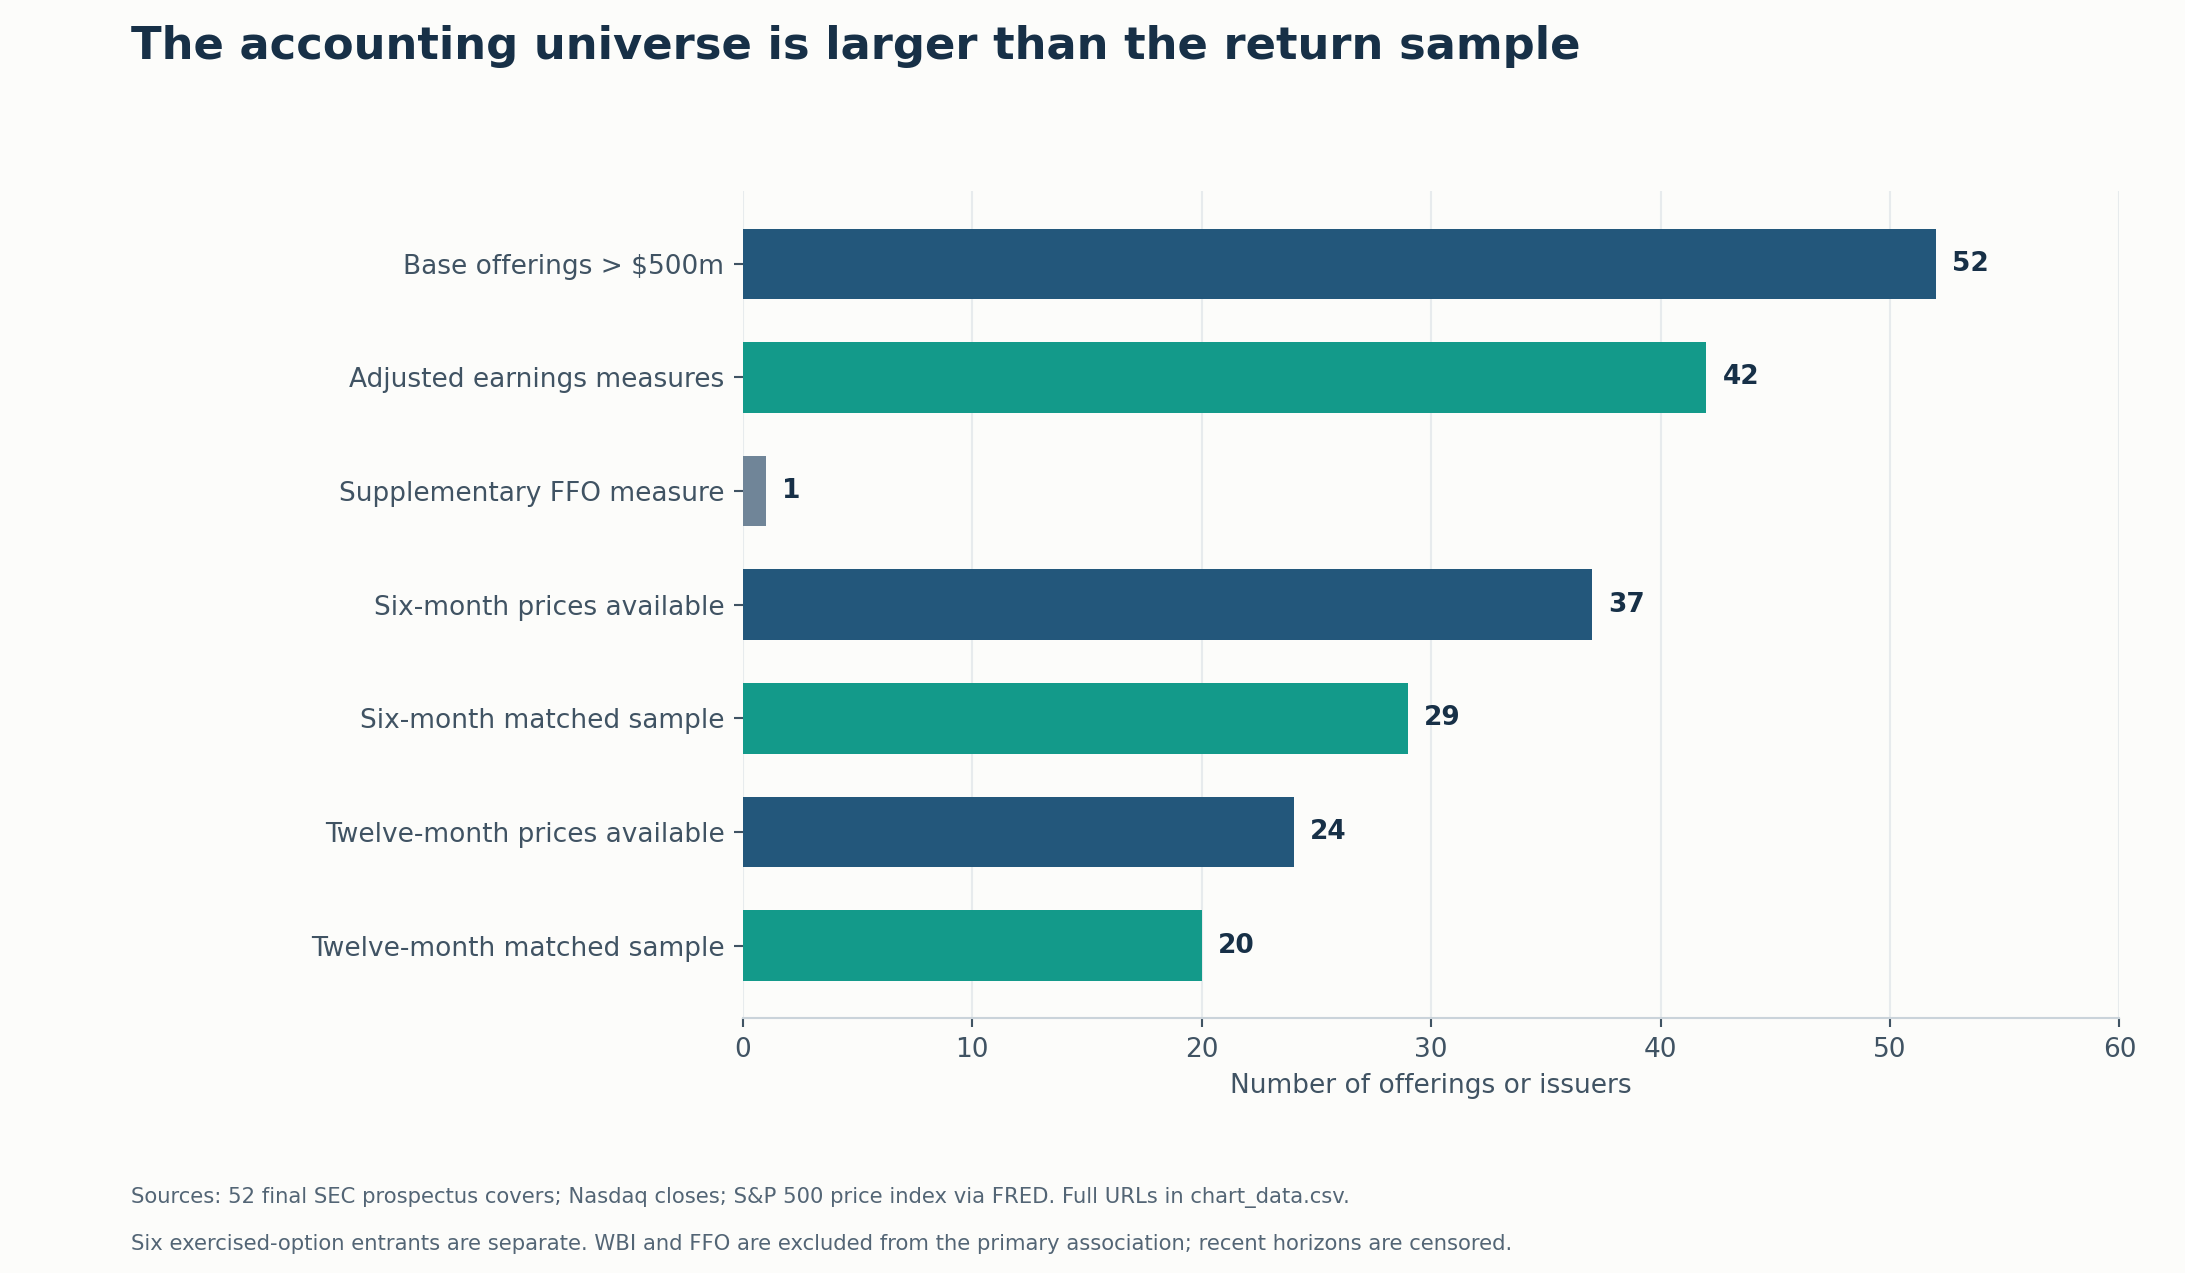
Figure 1. Source: final prospectus covers, the sourced universe ledger, Nasdaq closes and the S&P 500 price series. The return sample is smaller because some issuers have no comparable adjusted earnings measure, some measures have a different entity basis, and recent IPOs have not reached the required anniversary.
For the earnings comparison, the rule is the latest audited complete fiscal year available in the final prospectus: adjusted EBITDA when featured, otherwise adjusted operating income, otherwise adjusted net income. A segment measure does not displace a consolidated measure. An estimated future or recently completed year does not displace an audited fiscal year. Consequently, some early-2025 offerings use FY2023. The selection reflects the audited financials available at the IPO.
The dataset identifies interim periods, alternative profit measures, predecessor and successor periods, and pro forma bridges. For example, Jersey Mike’s has predecessor and successor statements, and WaterBridge’s combined pro forma business includes operations beyond its historical predecessor.waterbridge Missing adjusted measures are marked as missing.
2. A large gap can describe very different economics
The first comparison uses each issuer’s stated GAAP or IFRS anchor. Comparing adjusted operating profit with GAAP net income would mix financing and tax effects into an operating adjustment. The spreadsheet therefore preserves the anchor’s exact label.
| Issuer / period | Selected measure | GAAP/IFRS, $m | Adjusted, $m | Signed gap, $m |
|---|---|---|---|---|
| CRWV / FY2024 | Adjusted EBITDA | −863.448 | 1,219.258 | 2,082.706 |
| FIG / FY2024 | Non-GAAP operating income | −877.433 | 127.218 | 1,004.651 |
| NIQ / FY2024 | Adjusted EBITDA | −722.700 | 740.700 | 1,463.400 |
| SPCX / FY2025 | Adjusted EBITDA | −4,937.000 | 6,584.000 | 11,521.000 |
| CBRS / FY2025 | Non-GAAP operating loss | −145.862 | −96.095 | 49.767 |
These examples show why adding every company’s “profit gap” into one dollar total would mislead. They mix operating and net profit, capital-intensive and asset-light businesses, different fiscal periods and, elsewhere in the universe, different reporting currencies.
CoreWeave: most of the bridge is not stock pay
CoreWeave’s FY2024 $863.448 million net loss became $1,219.258 million adjusted EBITDA, a $2,082.706 million difference. The complete bridge is:
| Reconciliation line | FY2024, $m |
|---|---|
| Net loss | −863.448 |
| Loss on fair value adjustments (1) | 755.929 |
| Depreciation and amortization | 863.413 |
| Interest expense, net | 360.824 |
| Stock-based compensation | 31.487 |
| Other income, net | −48.194 |
| Provision for (benefit from) income taxes | 119.247 |
| Adjusted EBITDA | 1,219.258 |
Ordinary interest, income tax and depreciation/amortization account for $1,343.484 million of the gap. The remaining signed custom exclusions are $739.222 million. The $755.929 million fair-value adjustment is much larger than the $31.487 million stock-compensation adjustment. Calling the entire $2.083 billion difference “stock pay left out” would be wrong.crwv
The arithmetic cross-check starts at audited operating income of $324.358 million and adds depreciation/amortization and stock compensation. That independently reaches the same $1,219.258 million adjusted EBITDA endpoint. The exercise verifies the bridge; it does not make EBITDA cash available to shareholders. Interest and capital expenditure still matter to a capital-intensive business.
Figma: stock compensation changes the sign
Figma’s FY2024 operating result moved from a $877.433 million GAAP loss to $127.218 million non-GAAP operating income. Its $1,004.651 million reconciliation comprises:
| Reconciliation line | FY2024, $m |
|---|---|
| Income (loss) from operations | −877.433 |
| Plus: Stock-based compensation expense (1) | 947.553 |
| Plus: Amortization of stock-based compensation included in capitalized internal use software development costs | 0.186 |
| Plus: Transaction costs and other related expenses associated with the Abandoned Merger with Adobe (2) | 18.064 |
| Plus: Employer payroll taxes related to the May 2024 RSU Release and 2024 Tender Offer | 26.703 |
| Plus: 2024 Tender Offer transaction costs (3) | 12.145 |
| Non-GAAP operating income | 127.218 |
The stock-compensation exclusion alone exceeds the adjusted profit. A significant part of that historical charge relates to a 2024 liquidity transaction, before the IPO. It must be distinguished from the later IPO-triggered vesting charge.
The annual figures were cross-checked against Figma’s later FY2025 results, which reproduce the FY2024 comparative reconciliation. Revenue less the audited cost and operating-expense lines also reproduces the GAAP operating loss. The audited operating statement provides an independent route to the GAAP operating loss.fig, fig_crosscheck
SpaceX and Cerebras: two different 2026 examples
SpaceX’s prospectus reports a FY2025 $4.937 billion net loss and $6.584 billion adjusted EBITDA. Of the $11.521 billion bridge, $8.872 billion is the ordinary interest, tax and D&A component used in this study. The remaining $2.649 billion includes $1.947 billion SBC, $487 million restructuring, $38 million impairment and $177 million other adjustments. The historical statements were retrospectively combined with xAI under common control; the entity basis is flagged.spcx
Cerebras reports different effects at the operating and net-income levels. Its selected adjustment narrows the operating loss. A $145.862 million GAAP operating loss becomes $96.095 million non-GAAP operating loss after removing $49.767 million SBC. Its net-income adjustments turn a profit into a loss. $237.827 million GAAP net income becomes a $75.742 million non-GAAP net loss, chiefly because it removes a $363.336 million financial-instrument gain while adding back SBC. The analysis uses the operating measure, following the selection rule above.cbrs
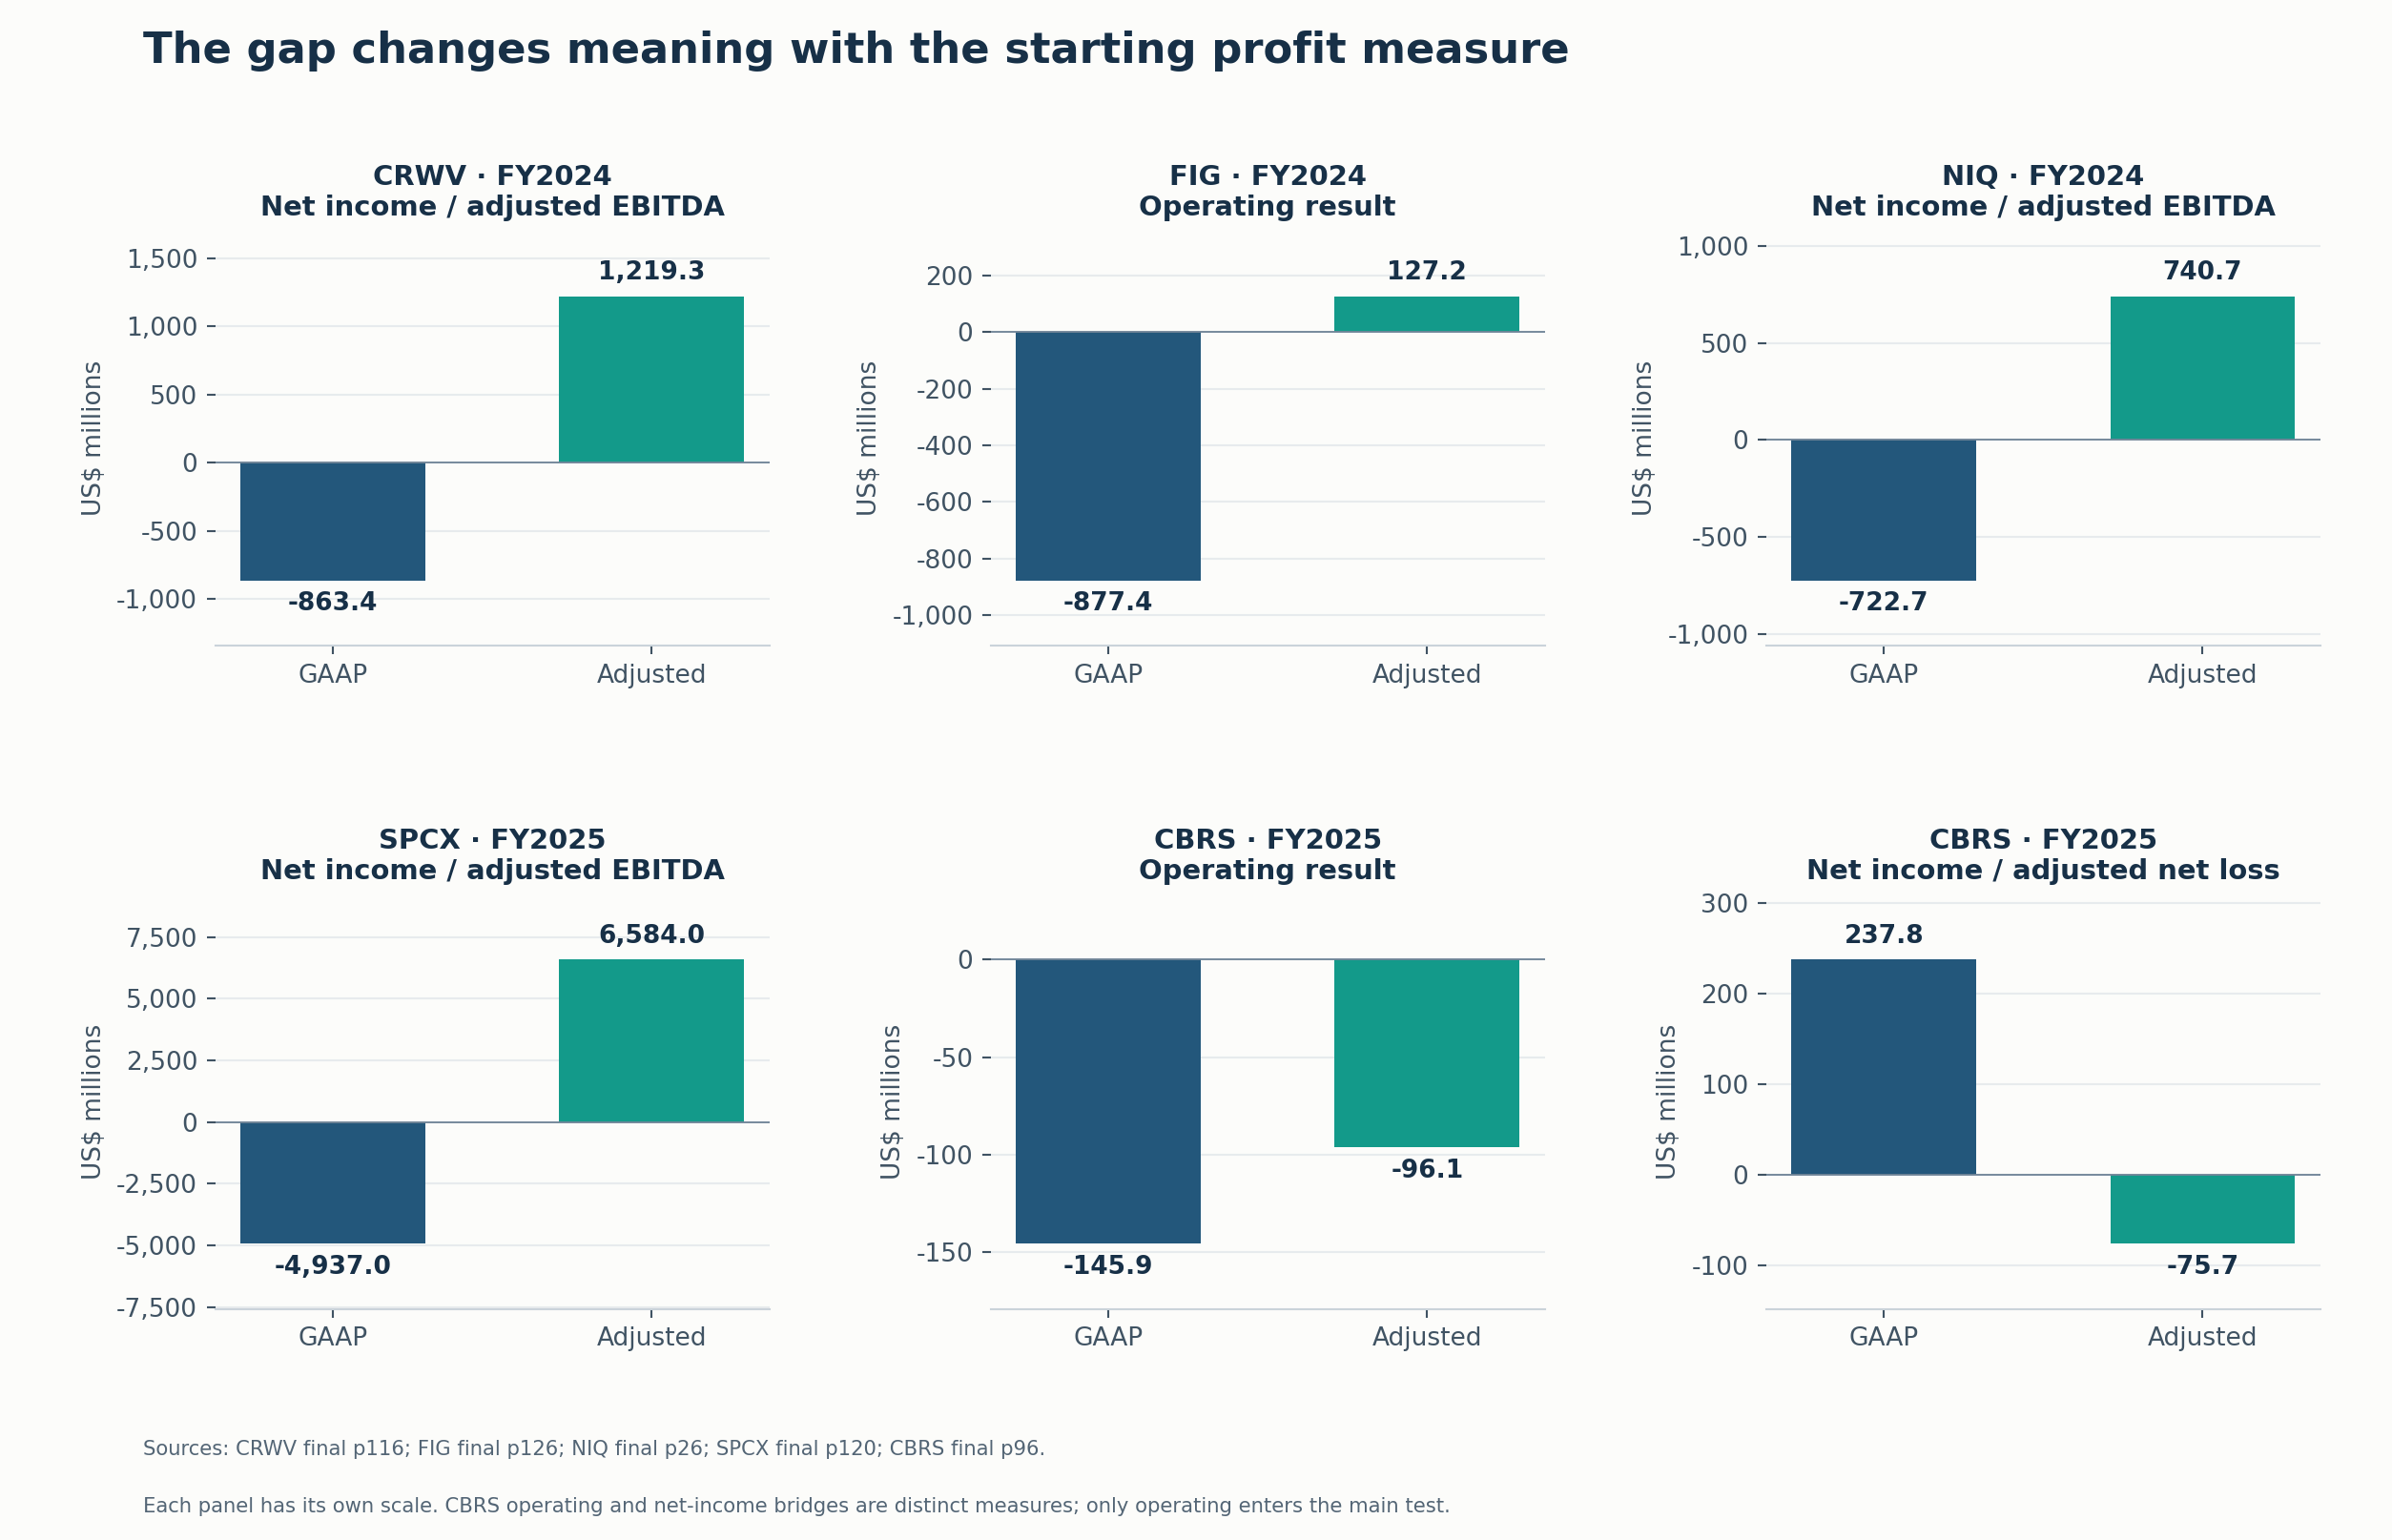
Figure 2. Source: each issuer’s final prospectus reconciliation; exact dates, pages and original rows appear in the dataset. Each panel uses its own dollar scale. Cerebras presents an operating and a net-income reconciliation.
3. “Nonrecurring” needs a period count and a description
The classifications describe the underlying cost or gain. Original issuer labels remain alongside the classifications.
| Category | Treatment in this study |
|---|---|
| Stock compensation | Track disclosed compensation and employer payroll taxes and other associated cash charges. Identify liability or cash-settled awards where disclosed. |
| Restructuring and transformation | Track severance, facilities changes, transformation programs and similar costs with their source descriptions. |
| Acquisitions and integration | Identify transaction and integration costs from acquired-intangible amortization and fair-value marks. |
| Litigation and regulation | Keep legal provisions, settlements and indirect-tax contingencies and ordinary income tax under their respective categories. |
| Capitalized software | Track current capitalization, amortization, impairment and capitalized SBC. |
| Valuation and financial instruments | Preserve both gains and losses, including derivatives, digital assets and contingent consideration. |
| Disposals and discontinued operations | Record their sign and the entity they cover. |
| Other specified or bundled items | Preserve identifiable components; leave any unsplit basket unallocated. |
| Ordinary EBITDA bridge | Interest, income tax and D&A form the standard EBITDA bridge. |
Refinancing and debt extinguishment are listed apart from ordinary interest when filings itemize those costs. Acquired-intangible amortization is ordinary D&A when the endpoint is EBITDA, but it is an additional exclusion when the endpoint is adjusted operating profit. The classification depends on the earnings measure.
The conservative annual recurrence flag requires a nonzero adjustment family in at least three full fiscal years. It does not count an annual period and its overlapping nine-month period as two independent events. The ledger also shows other periods and identifies recurrence in standalone quarters where available.
Several examples meet that test:
| Issuer / excluded family | First year, $m | Second year, $m | Third year, $m |
|---|---|---|---|
| Bullish — nonrecurring expenses | FY2022: 2.000 | FY2023: 8.000 | FY2024: 10.000 |
| SmartStop — offering-related costs | FY2022: 1.803 | FY2023: 0.792 | FY2024: 0.330 |
| Legence — strategic initiatives | FY2022: 0.839 | FY2023: 6.784 | FY2024: 10.778 |
| Madison Air — professional fees | FY2023: 4.300 | FY2024: 7.700 | FY2025: 8.400 |
Bullish’s explicitly named nonrecurring basket appears in FY2022, FY2023 and FY2024. SmartStop’s offering-related costs also span three years; one extended offering process can generate expense over several years. Legence’s strategic-initiative basket includes a mixture of activities, so a statement that one component is not expected to recur cannot be applied indiscriminately to the entire basket. Madison Air’s professional-fee exclusions are similarly repeated.blsh, sma, lgn, mair
The supplemental Via data are revealing in a different way: its named nonrecurring patent/transaction-cost categories appear in ten disclosed standalone quarters. The filings show repeated use of the category. The underlying patent disputes or transactions may differ by quarter.via
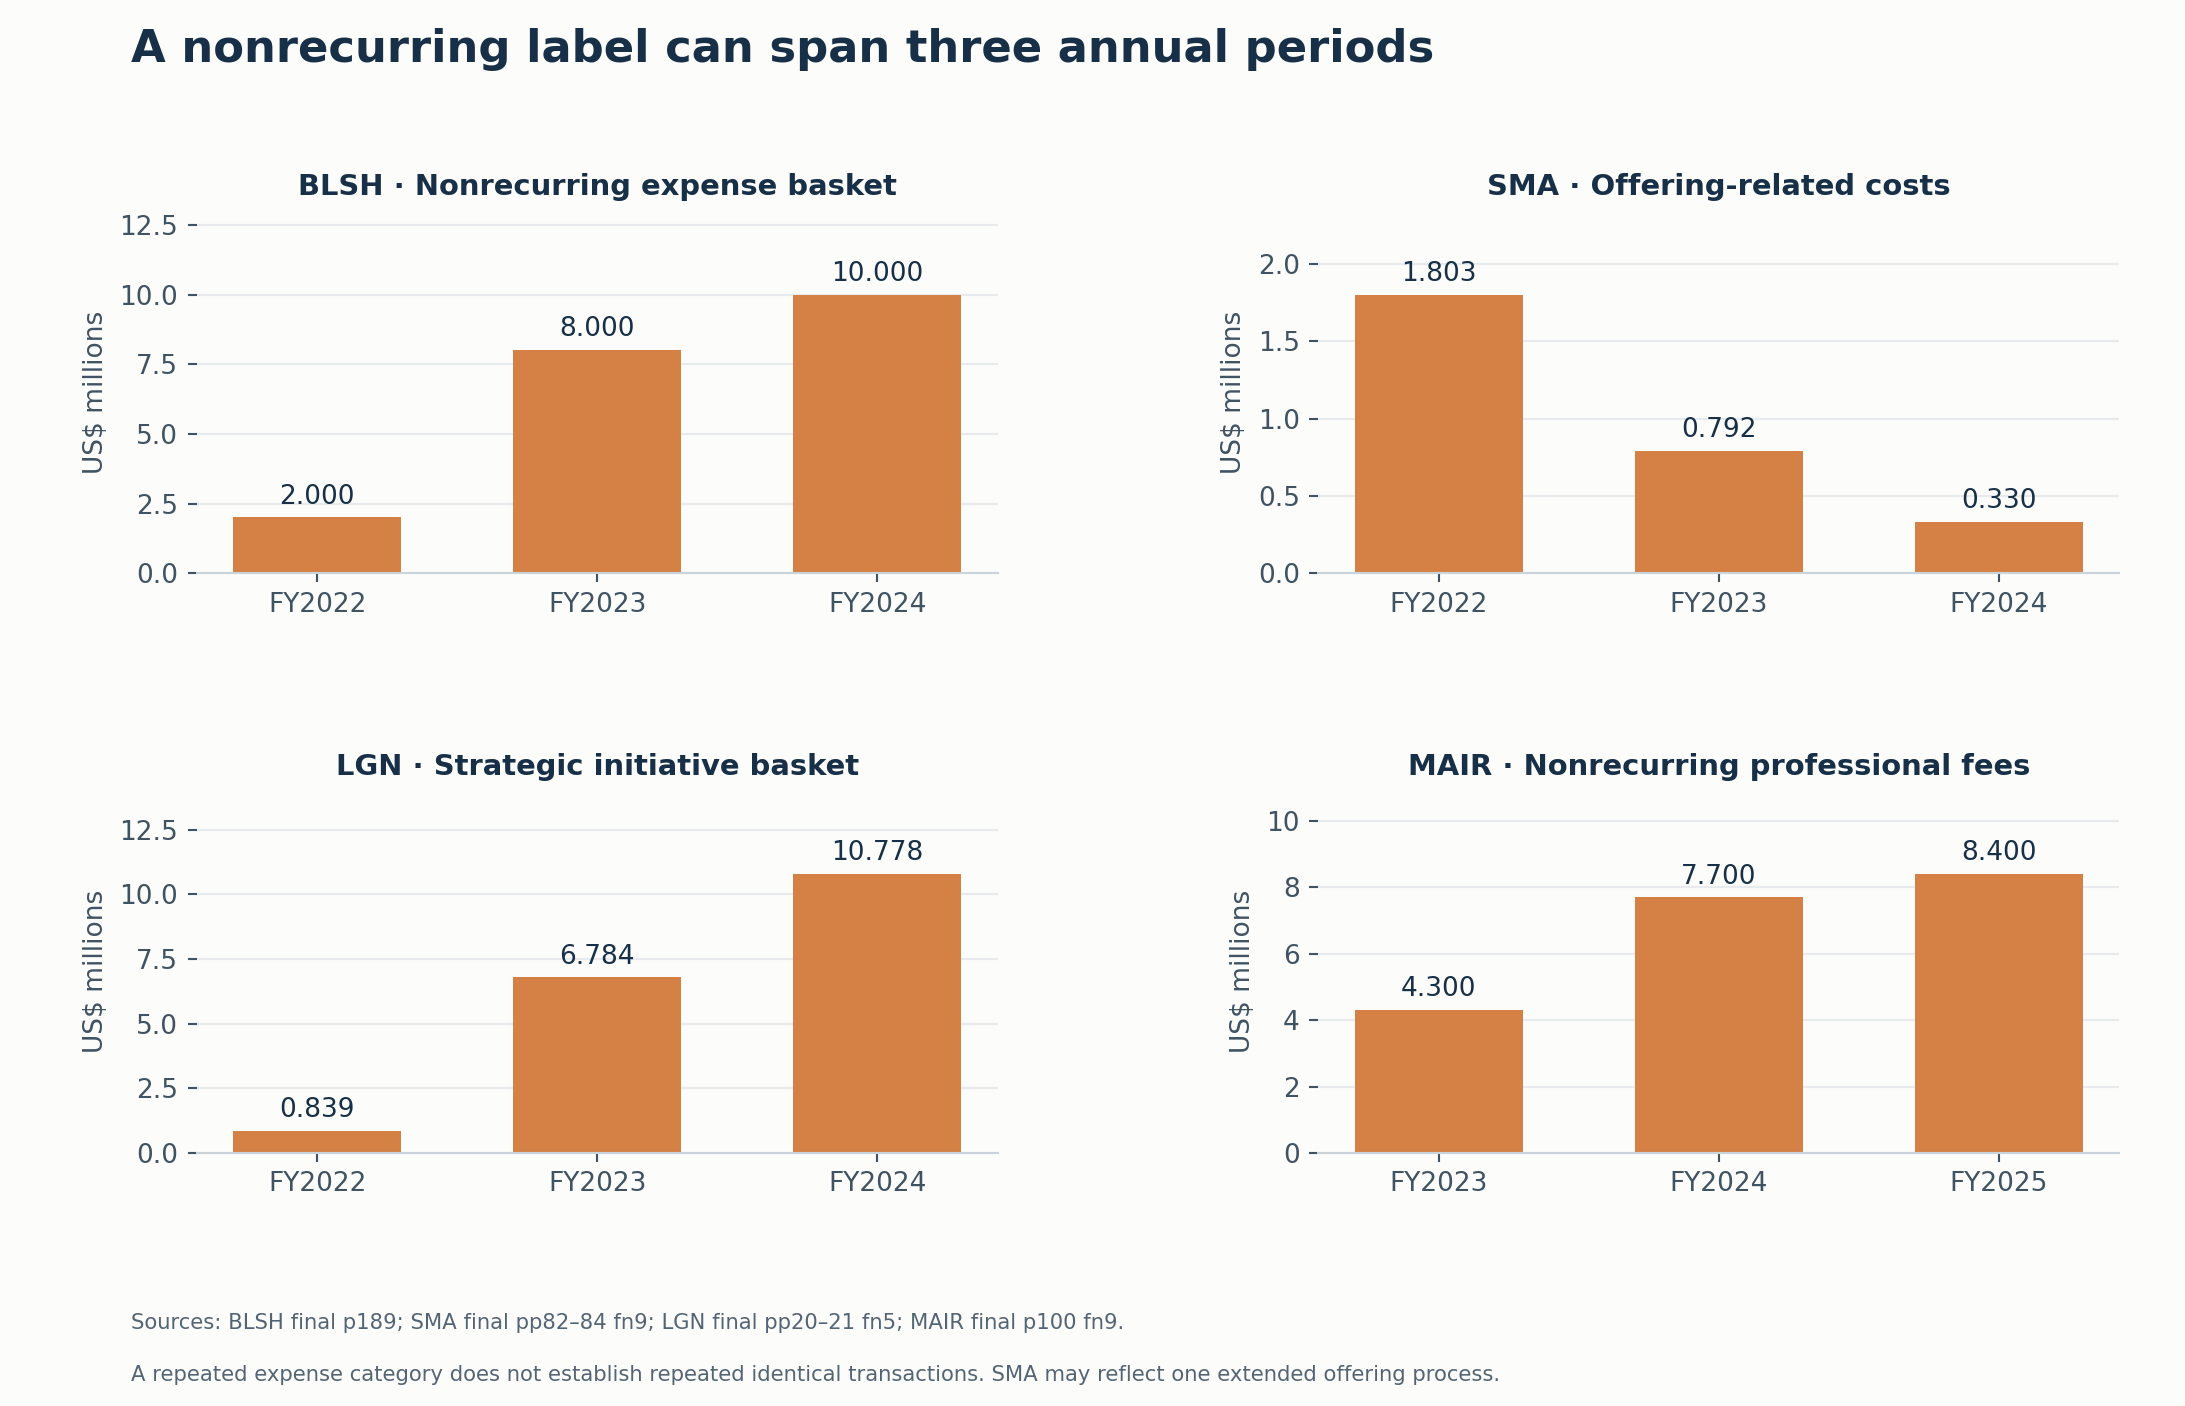
Figure 3. Source: final prospectus annual reconciliations and the cited footnotes. Each panel uses its own scale. Repeated categories show where issuers excluded costs over several periods.
StubHub’s indirect-tax contingency exclusions—$28.610 million, $34.645 million and $52.118 million in FY2022–24—illustrate why the description matters. The SEC staff asked about the components and the basis for treating these exposures as outside recurring operations, including the uncertainty over their resolution. The observation is that the costs and exclusions persisted; the exchange is not a finding of wrongdoing.stub, stub_letter
For a reader building an earnings estimate, the practical question is whether the business can sustain its activity without replacing the excluded cost with another cost. A completed transaction may end. A serial acquisition program, continuing litigation exposure or repeated transformation spending may continue to generate different transactions within the same expense category. The historical series helps frame that question but cannot settle the future outcome.
4. IPO-triggered stock pay, continuing stock pay and dilution
An IPO can satisfy a liquidity condition on previously granted awards. Accounting then recognizes costs associated with service already provided. The resulting charge can be much larger than a normal quarter’s expense.
That does not justify treating all subsequent stock compensation as the same one-time event. The study measures the identifiable IPO-triggered charge, SBC in the latest available standalone quarter, and the change in economic shares over four quarters when those counts have been reported.
Selected documented IPO charges include:
| Issuer | Reported IPO-related amount, $m | Scope |
|---|---|---|
| CRWV | 177.0 | 177.0 expense; 17.0 capitalized |
| CRCL | 423.8 | 423.8 expense; 62.7 capitalized |
| CHYM | 885.8 | 885.8 compensation catch-up; broader payroll bundle excluded |
| FIG | 975.7 | 975.7 IPO RSU-release catch-up. The tender was in 2024 |
| STUB | 1,400.7 | 1,400.7 expense; 27.1 capitalized |
| NTSK | 402.1 | 402.1 IPO-quarter RSU expense; includes 56.7 performance awards; not isolated catch-up |
| NAVN | 81.8 | 81.8 disclosed catch-up; treatment of 0.9 capitalized amount is ambiguous |
| HNGE | 571.4 | 571.4 through IPO effectiveness; supplemental cohort |
The amounts are not interchangeable. Chime’s broader reported charge includes related payroll tax, so the table uses the narrower identified compensation catch-up. Netskope’s figure covers an IPO-quarter expense rather than an isolated pre-IPO catch-up, and includes performance awards that must not be added a second time. Circle and CoreWeave itemize capitalized compensation, which is not in current expense. StubHub’s reported annual charge supersedes an earlier prospectus estimate. Hinge Health’s charge through registration effectiveness differs from its entire IPO-quarter expense.sbc
There are also awards that do not translate directly into newly issued public shares. Accelerant’s scoped $1.38 billion IPO compensation charge related to settlement using 65,270,453 existing LP-held shares. That settlement was equity-neutral at the listed company. Other awards and later share changes require their own analysis. Madison Air’s historical equity-appreciation rights and SailPoint’s modified awards likewise require attention to settlement terms.arx_sbc, mair
For continuing cost, the latest quarter is more informative than annualizing the IPO catch-up:
| Issuer | Quarter ended | SBC expense, $m | Revenue, $m | SBC/revenue |
|---|---|---|---|---|
| FIG | 2026-09-30 | 158.586 | 391.415 | 40.5% |
| NTSK | 2026-07-31 | 62.972 | 220.541 | 28.6% |
| SAIL | 2026-07-31 | 68.321 | 308.813 | 22.1% |
| NAVN | 2026-07-31 | 41.857 | 232.790 | 18.0% |
| CHYM | 2026-09-30 | 74.238 | 718.001 | 10.3% |
| CRCL | 2026-09-30 | 43.100 | 864.888 | 5.0% |
| CRWV | 2026-09-30 | 160.000 | 3,661.000 | 4.4% |
These are reported expenses divided by same-period reported revenue, without annualizing a partial year. They show that substantial stock pay can remain after the catch-up quarter. They do not establish a stable future run rate: grants, acquisitions, forfeitures and changes in revenue can all move the ratio.
The full dataset keeps difficult cases visible. Quantinuum’s latest SBC is large relative to its small revenue base. Bullish’s isolated quarterly employee component is not a complete measure of every share-based charge. eToro and Bullish report gross crypto-related flows that make revenue ratios look very different from ratios using a net contribution or adjusted-revenue denominator. Those alternative denominators are recorded and the two issuers are excluded in a return-test sensitivity.
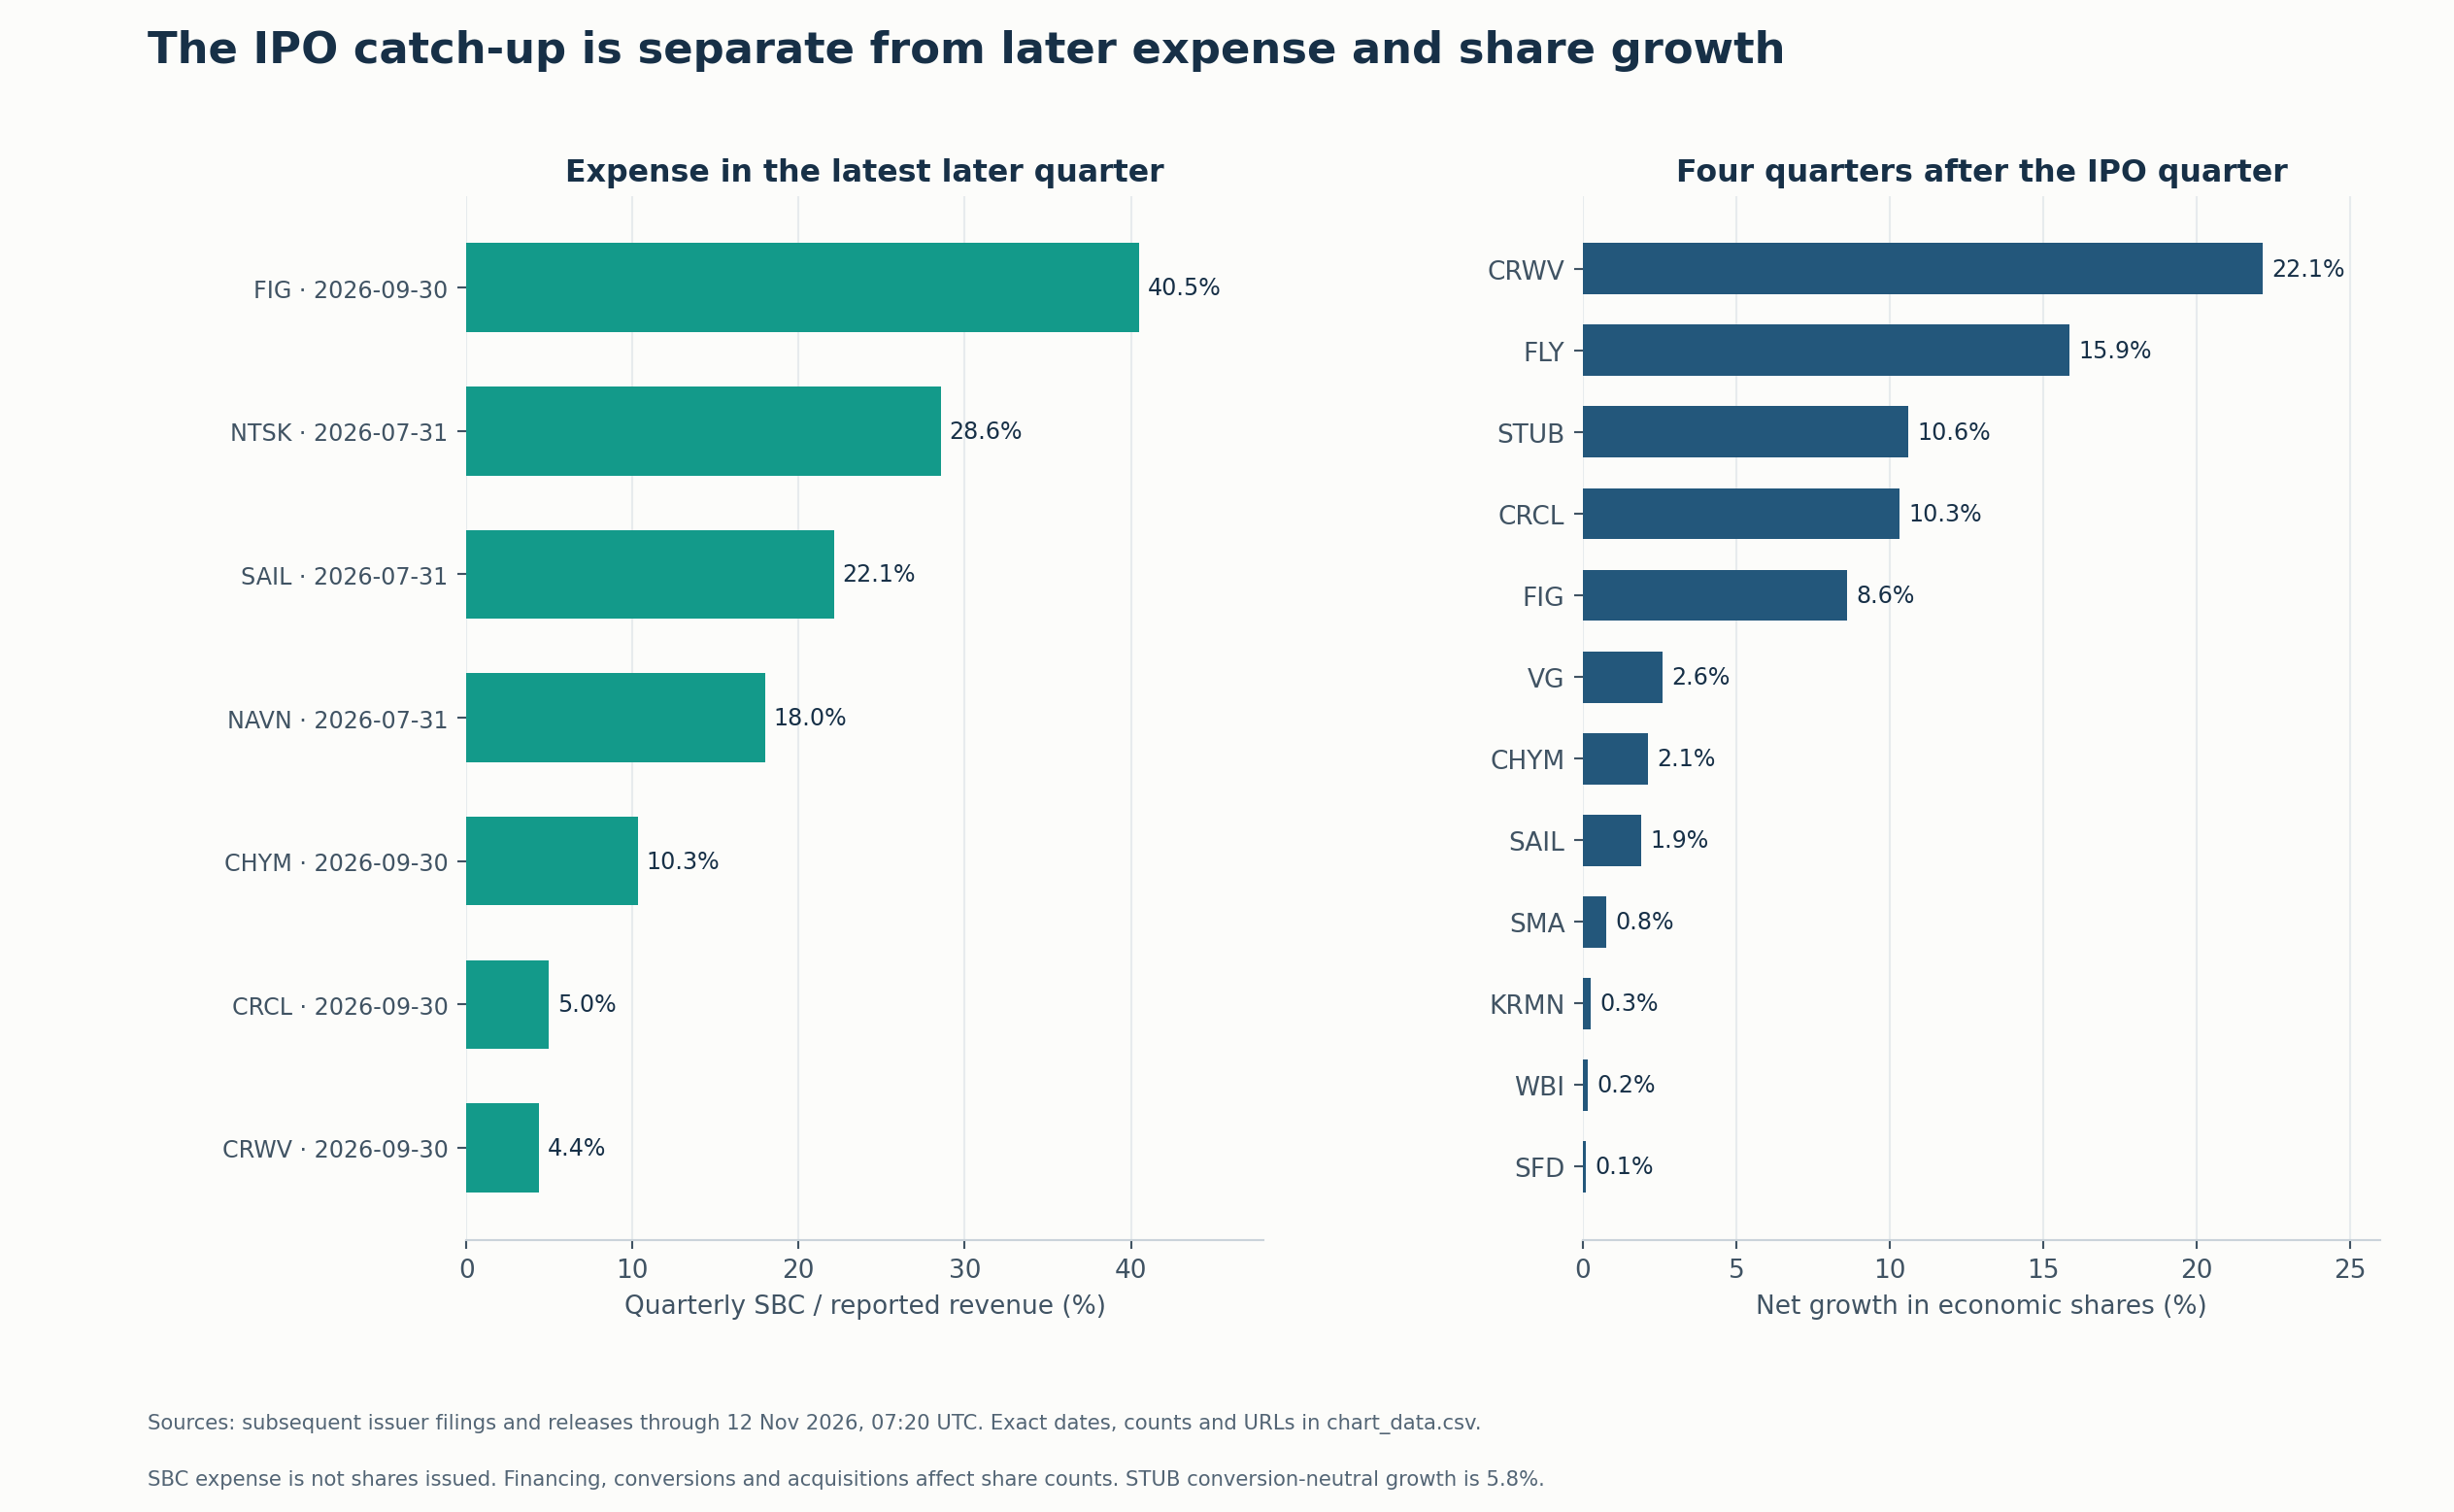
Figure 4. Sources: subsequent issuer filings and financial releases through the cutoff. The left panel shows selected base-cohort later quarters; the right shows available base-cohort four-quarter share windows. Full dates, classes, units and source links accompany every input.
Four-quarter share growth is measured from the first post-IPO quarter-end to the quarter-end four quarters later, using all participating common classes and relevant external operating units. Weighted-average diluted EPS shares are not substituted for period-end shares.
Among the base-cohort observations, CoreWeave’s economic share count grew 22.1%, Firefly’s 15.9%, Circle’s 10.3% and Figma’s 8.6% over their respective windows. These figures measure net changes in outstanding shares. Financing, acquisitions, conversions, repurchases and award settlements can all contribute.shares
StubHub illustrates the difference between compensation and share-count changes. Common shares rose from 345,487,388 to 382,184,430, a 10.6% increase. But 15,594,087 mandatory preferred-conversion equivalents already existed at the baseline. Including those equivalents in the opening denominator reduces the change to 5.8%. Both calculations are disclosed. SmartStop’s comparison includes external operating-partnership units; a public-common-only calculation would miss part of the economic share base.
The supplemental cohort receives the same treatment. Hinge Health’s common-share count is shown both before and after adjusting the baseline for preferred shares that later converted one-for-one. That conversion was voluntary, and the adjusted baseline is a sensitivity because the preferred rights differed before conversion. An IPO that has not yet supplied four subsequent quarter-ends is censored; a completed window without a verified count is marked unknown. Neither status becomes zero dilution.
5. Capitalized software is a second cost question
Capitalization changes when a cost reaches the income statement. Qualifying development spending can initially become an asset, with expense recognized later through amortization or impairment. An EBITDA measure can then remove that later amortization.
The result can leave current development expenditure outside both current operating expense and adjusted EBITDA. That accounting treatment affects comparisons of reported development costs across issuers.
Figure Technology Solutions reported FY2024 adjusted EBITDA of $101.443 million and cash capitalization of software of $16.628 million. Subtracting that current cash expenditure produces $84.815 million. Accelerant reported $113.0 million adjusted EBITDA and $34.4 million cash capitalization of technology development, leaving $78.6 million on the same sensitivity.software
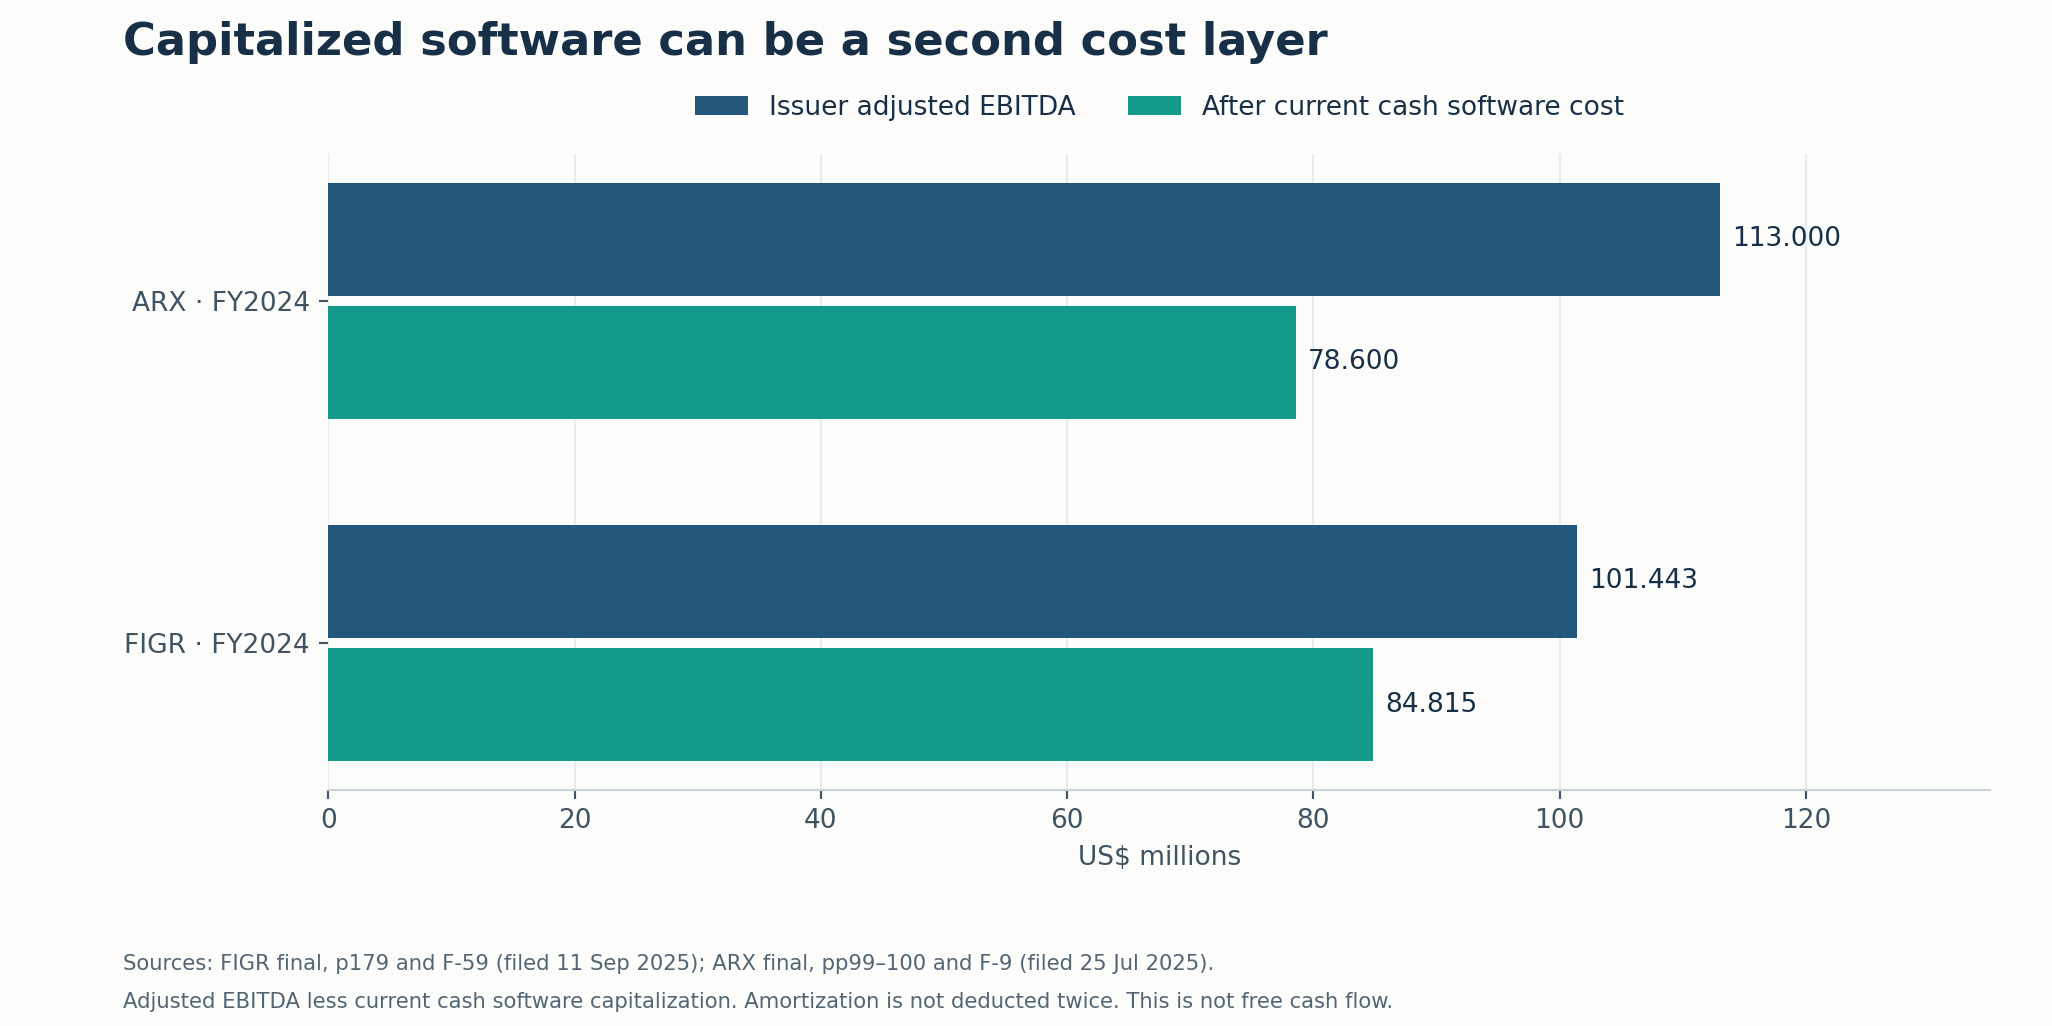
Figure 5. Sources: Figure’s final prospectus, p.179 and F-59; Accelerant’s final prospectus, pp.99–100 and F-9. The chart subtracts current cash software capitalization from adjusted EBITDA.
This calculation does not subtract amortization again: the EBITDA starting point has already removed it. Nor does it treat noncash capitalized SBC as cash expenditure. Figure’s disclosed capitalized SBC remains a different input.
The resulting number is not free cash flow. It has not deducted all capital expenditure, working-capital needs, interest or tax. Its purpose is narrower: to show how the reported earnings picture changes when current software development cash cost is retained.
A convincing forward model would connect additions, useful lives, amortization, impairments and revenue generation. That requires more information than a single adjusted-profit bridge. The dataset therefore preserves these inputs separately rather than silently inserting a software deduction into every issuer’s chosen metric.
6. Definitions can change before and after the IPO
A final prospectus is a snapshot. Earlier amendments can use different labels, estimates or adjustment components; subsequent results can recast the historical comparison.
Bending Spoons provides a clear post-IPO example. Its August 2026 results expanded adjusted-net-income exclusions to include net foreign-exchange and derivative fair-value changes, with their tax effect. Under the revised definition:
- FY2025 adjusted net income rose from $375.592 million to $401.696 million.
- Q1 2026 adjusted net income fell from $205.977 million to $162.877 million.
For FY2025, the newly excluded FX and derivative amounts, less the tax effect, sum to $26.103 million; the reported endpoint change is $26.104 million because the source inputs are rounded. The workbook shows the $0.001 million rounding residual.bsp
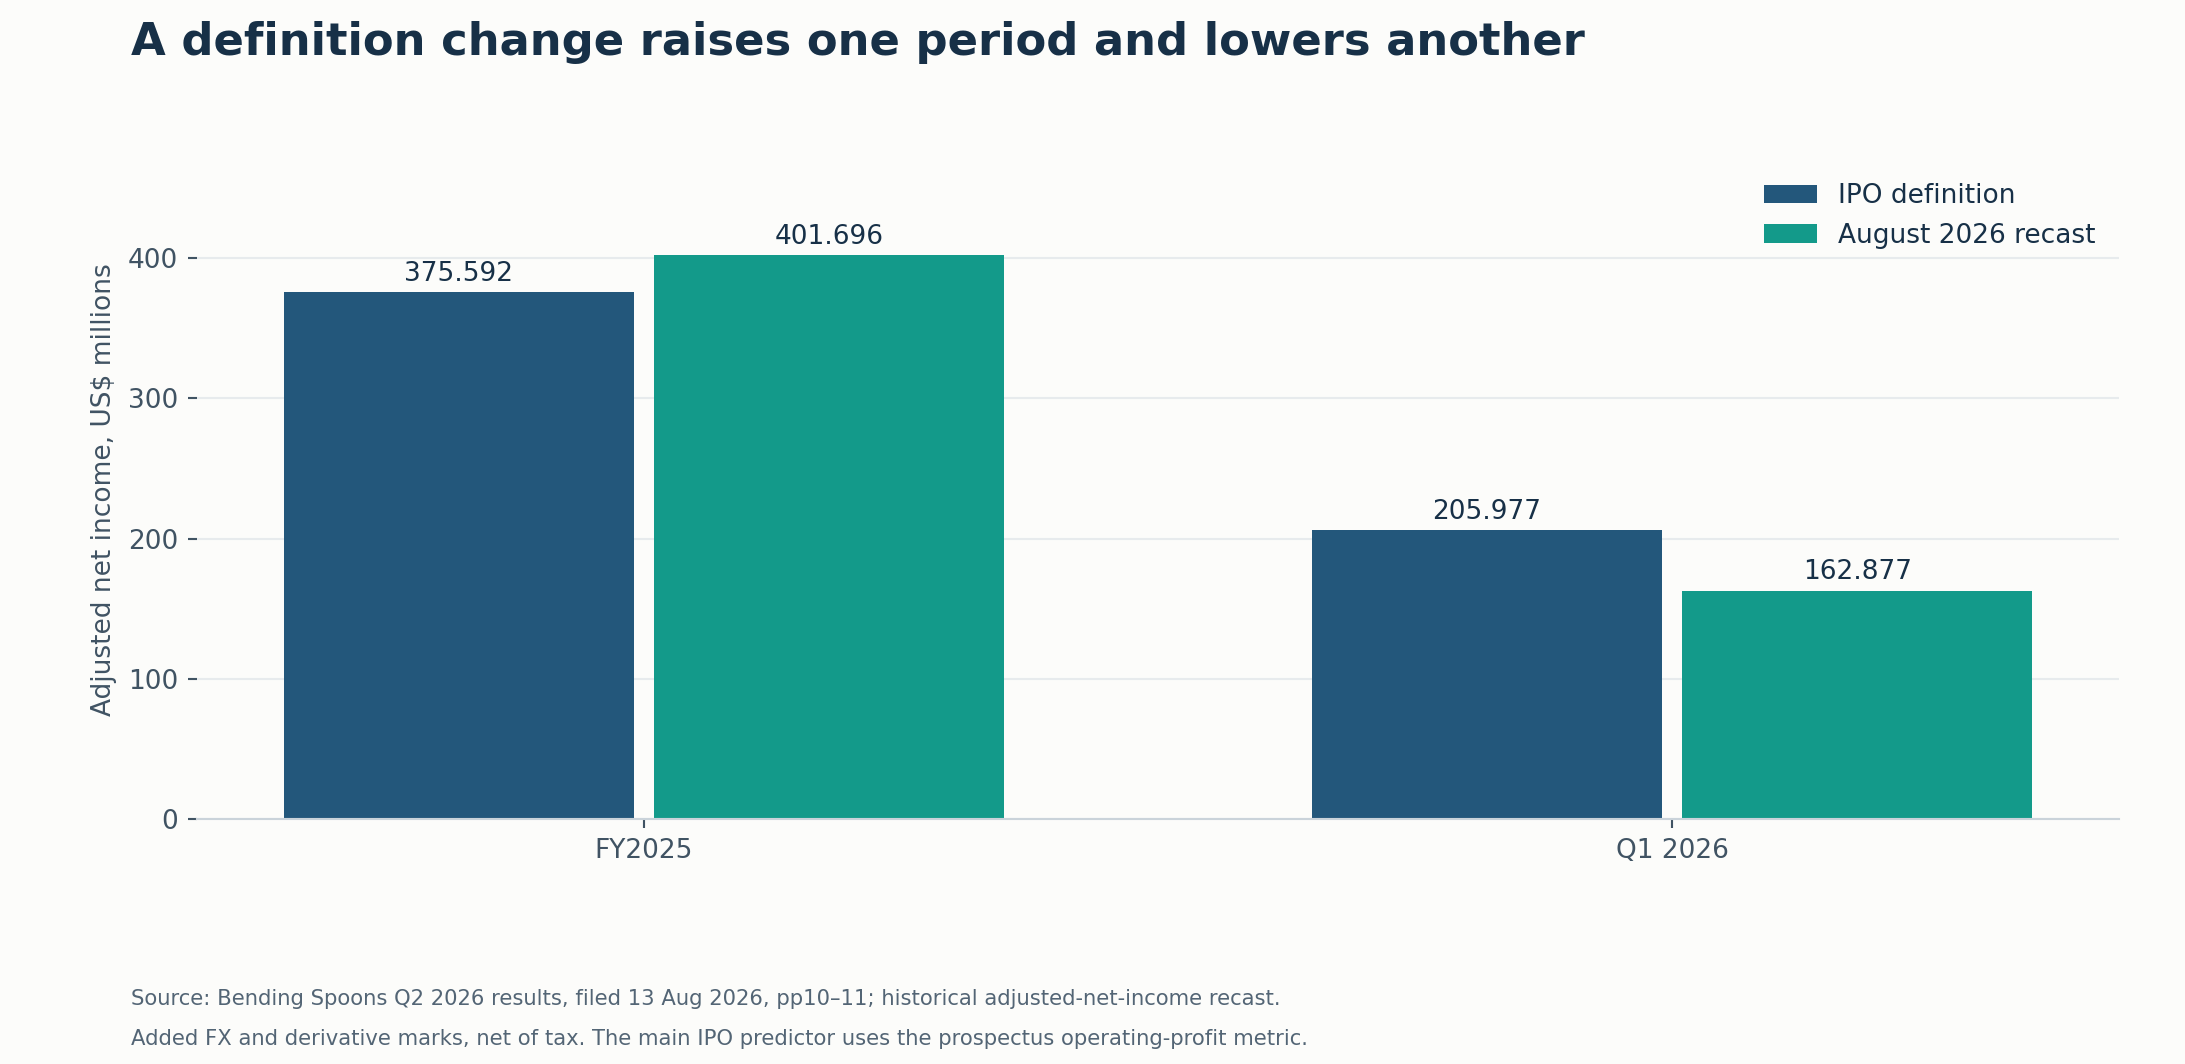
Figure 6. Source: Bending Spoons’ Q2 2026 results, filed 13 August 2026, pp.10–11. One definition change affects the two historical periods in opposite directions.
The main IPO comparison continues to use Bending Spoons’ prospectus operating-profit measure, selected under the stated hierarchy. The later adjusted-net-income recast is an additional finding. It is not substituted into the IPO predictor with the benefit of hindsight.
The amendment and correspondence records also distinguish numerical changes from presentation changes:
| Case | Documented change or question | What it does—and does not—show |
|---|---|---|
| Klarna | The first public FY2024 adjusted operating result was $181m; the final was $180m as IPO-related costs changed from $15m to $14m. | A small historical bridge revision. It is not a change to GAAP operating loss. |
| Figure Technology Solutions | FY2023 restructuring fell from $1.822m to $1.721m between the first public and final tables; adjusted loss increased by $0.101m. | An observed row change. The reason remains unknown. The FY2024 endpoint was unchanged. |
| eToro | A January 2025 response renamed adjusted net revenue and related components as contribution measures. | A documented classification/label discussion. The issuer’s explanation is not represented as SEC endorsement. |
| Madison Air | After staff questions about simply combined historical margins, the issuer said it removed combined-margin references. | An entity-basis and presentation issue; the issue concerned historical versus pro forma results. |
| YSS | Staff sought clearer compensation amounts and assumptions; the final offer price differed from the midpoint used in an earlier estimate. | Some apparent revisions reflect a changed price assumption and vesting scope. |
| BETA and X-energy | Subsequent reports contain adjusted-profit measures not selected from their final IPO prospectuses. | Later introduction does not retroactively create an IPO-time adjusted-profit observation. |
These cases are traced to the underlying amendment, staff letter, response or subsequent financial report in the event ledger.definitions
Prominence questions also appear in the correspondence: presenting GAAP net loss or operating income alongside adjusted results, clarifying the composition of a basket, or explaining why an excluded expense is outside ordinary operations. The letters document what the SEC staff asked and how issuers responded.
The timing of correspondence has its own limit. The SEC describes releasing this material no earlier than twenty business days after effectiveness or completion of review. A letter’s date therefore does not prove when an outside investor could first read it. Some public-release dates remain unknown. The study uses the letters available by the research cutoff and does not imply that every exchange was available during IPO marketing.sec_letters
The comparison is targeted: first public filing versus final selected annual bridges, plus material intervening and subsequent changes. It is not a complete semantic comparison of every sentence in every amendment. The comparison covers the selected metrics and definitions.
7. The observed gaps do not clearly predict six- or twelve-month performance
The performance test asks whether a larger signed custom-exclusion gap relative to revenue is associated with a worse subsequent return.
For an EBITDA measure:
Custom gap = adjusted EBITDA − stated GAAP/IFRS anchor − ordinary interest, income-tax and D&A bridge.
For an adjusted operating- or net-income measure, the custom gap is its signed difference from the corresponding anchor. Dividing by same-period reported revenue provides a scale measure without adding dollars, yen and won together.
This is an imperfect common denominator. Crypto gross flows are not economically equivalent to software subscription revenue. Financial companies’ interest treatment also differs from that of industrial companies. The sensitivity tests therefore change both the accounting sample and the definition of the gap. A single normalized ratio cannot erase all business-model differences.
The return convention is equally explicit:
Offer-price return = anniversary closing price / final offer price − 1.
The endpoint is the first trading close on or after the six- or twelve-calendar-month anniversary of the first trading day. The benchmark is the S&P 500 price index, measured from the last trading close before that first trading day to the same endpoint. Excess return is the arithmetic difference, in percentage points. Neither side includes reinvested dividends.prices
A future anniversary is censored. A mature observation missing a verified price would be marked missing. The study never substitutes the latest available price for an unfinished six-month window or annualizes a recent IPO’s partial return. It also recomputes the analysis from the first public trading-day close, because an offer allocation and an aftermarket purchase are different entry prices.
| Horizon | Matched issuers | Spearman correlation | 95% bootstrap interval | Two-sided p-value |
|---|---|---|---|---|
| 6 months | 29 | −0.142 | −0.473 to +0.232 | 0.461 |
| 12 months | 20 | +0.011 | −0.416 to +0.436 | 0.965 |
The confidence intervals are wide. The six-month interval includes a moderately negative association and a positive one; the twelve-month estimate is almost zero but similarly imprecise. Failure to detect a relationship is not evidence that accounting quality never matters.
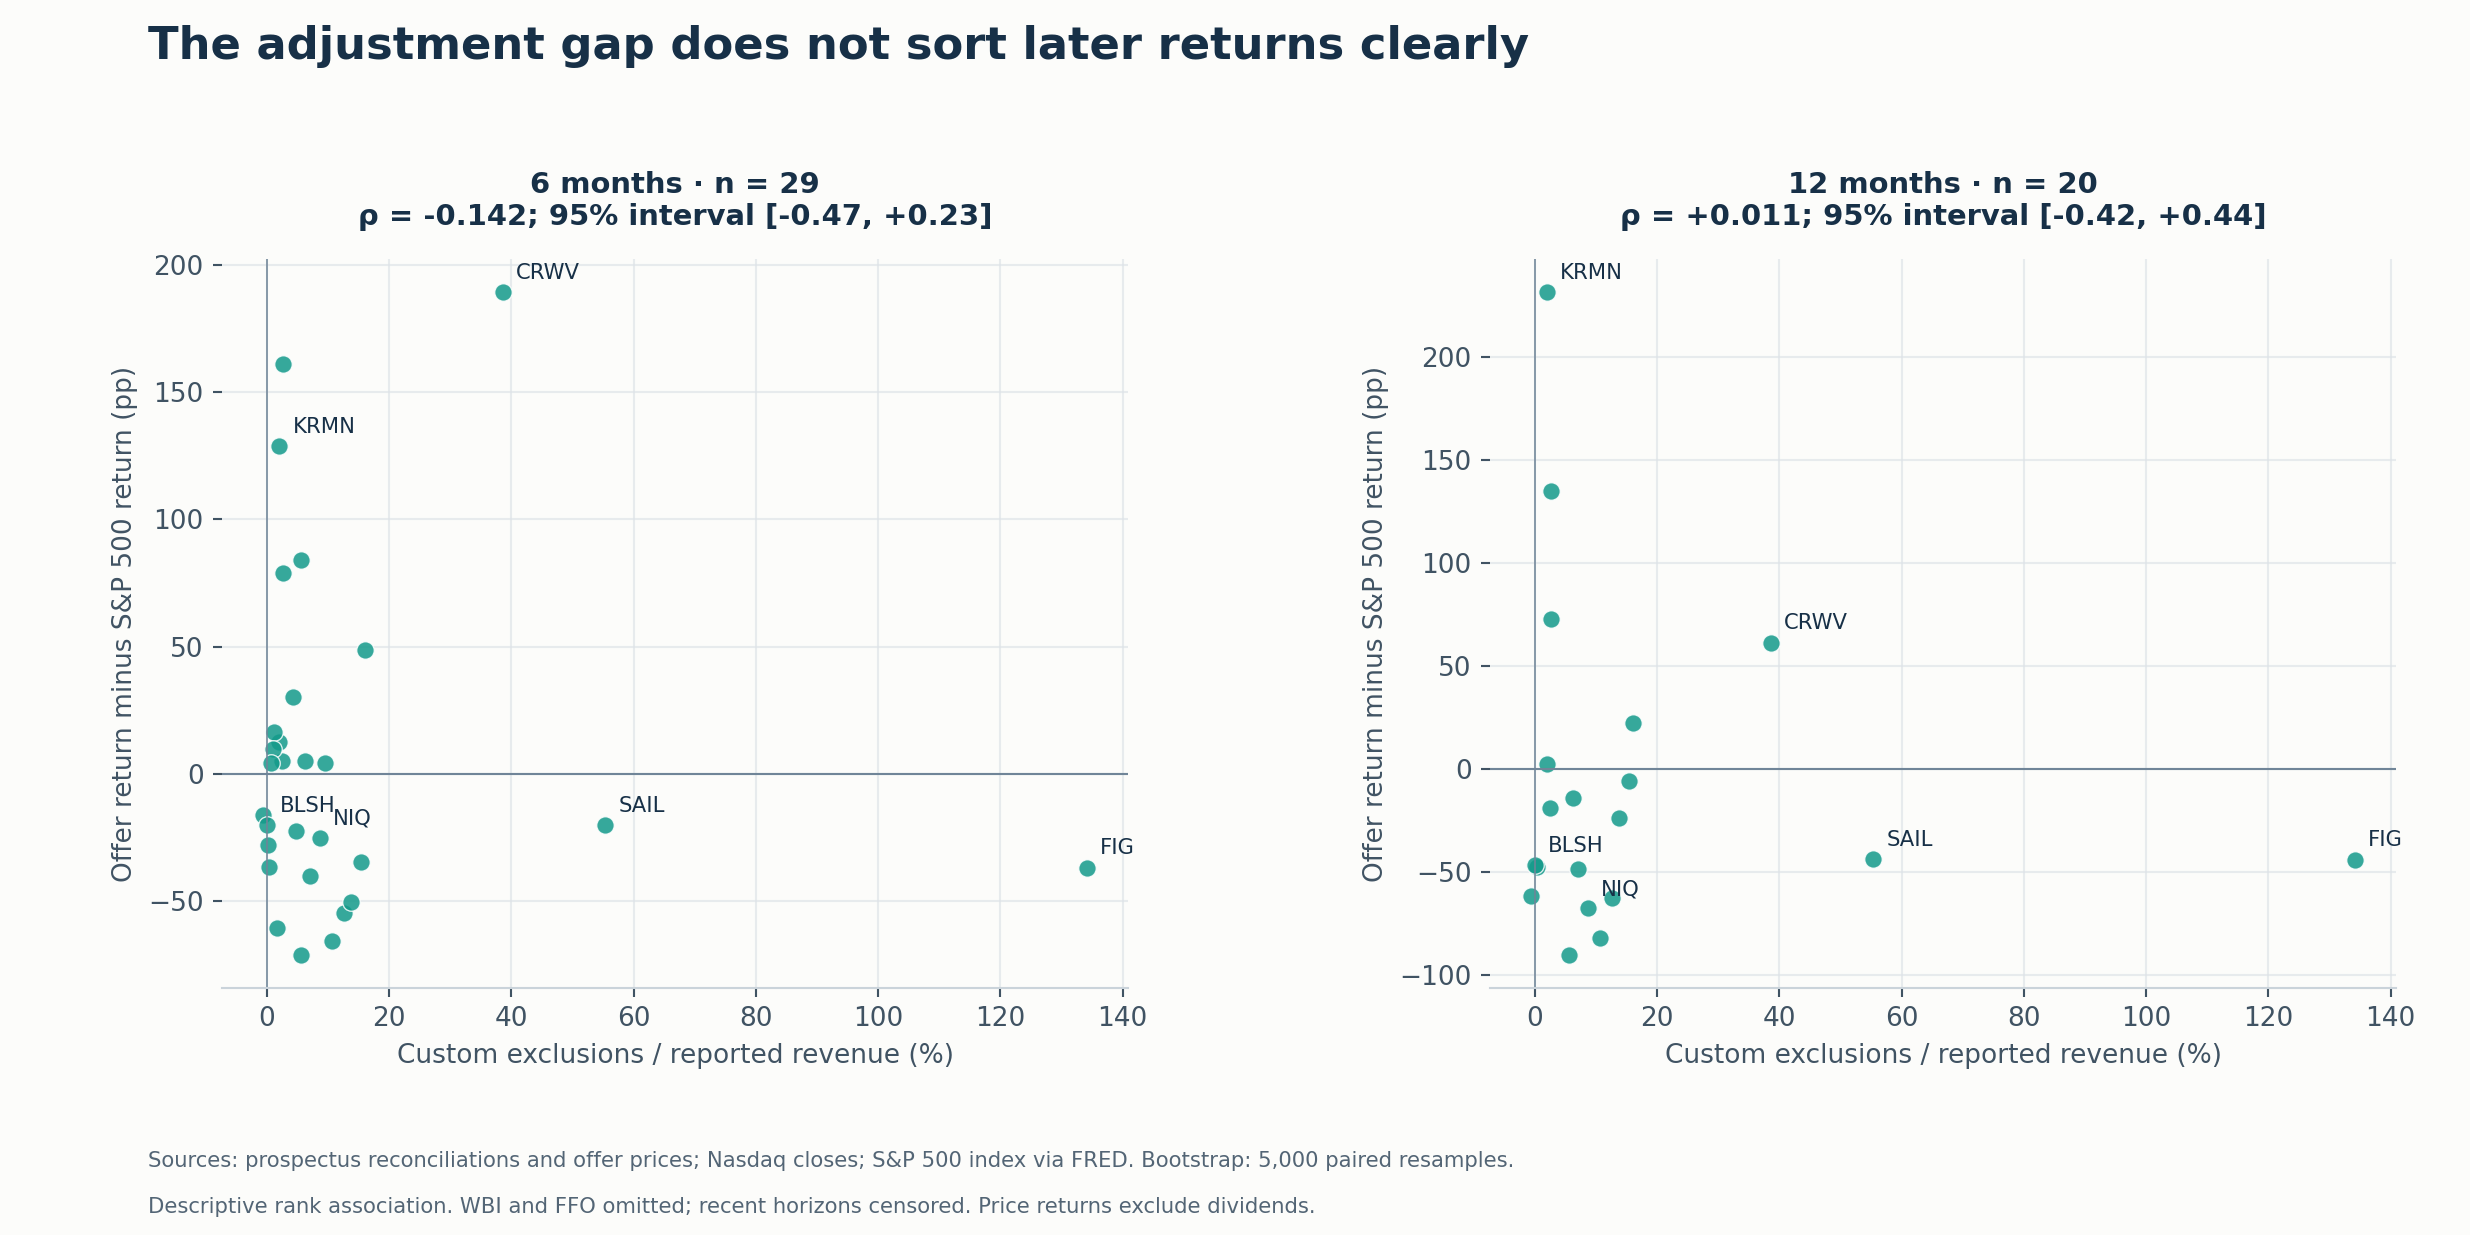
Figure 7. Sources: final-prospectus reconciliations and offer prices, Nasdaq daily closes, and the S&P 500 price index supplied through FRED. Each dot is one eligible issuer. The intervals use 5,000 paired-issuer bootstrap resamples.
The conclusion survives the principal sensitivity checks:
| Specification | Six months: ρ (n) | Twelve months: ρ (n) |
|---|---|---|
| 2025 IPOs only | −0.225 (21) | +0.011 (20) |
| US GAAP only | −0.160 (25) | −0.150 (17) |
| EBITDA measures only | +0.148 (24) | −0.025 (15) |
| Exclude crypto gross denominators | −0.197 (27) | −0.148 (18) |
| Full gap, including ordinary EBITDA items | +0.015 (29) | +0.077 (20) |
| First-day close as entry price | +0.006 (29) | +0.005 (20) |
| Issuer-only proceeds >$500m | +0.014 (20) | +0.308 (13) |
| S-1/F-1 registrations only | −0.141 (28) | +0.032 (19) |
Including the exercised-option entrants adds Caris, Via and Hinge Health to the mature matched samples. Liftoff and ADARx have not reached the six-month horizon; NHP’s FFO measure remains outside the main earnings comparison. This broader scope produces −0.195 at six months, n=32, and −0.041 at twelve months, n=23.
Individual cases show why the overall relationship should not be inferred from a few striking accounting bridges:
| Issuer | Six-month offer return | Six-month excess, pp | Twelve-month offer return | Twelve-month excess, pp |
|---|---|---|---|---|
| CRWV | +206.3% | +189.3 | +72.9% | +61.5 |
| FIG | −27.3% | −36.9 | −26.3% | −44.0 |
| NIQ | −15.6% | −25.2 | −50.3% | −67.7 |
| BLSH | −14.2% | −20.3 | −25.7% | −46.7 |
CoreWeave’s large bridge coexists with a positive twelve-month offer return. Figma and NIQ have negative returns over the comparable horizons. These observations are consistent with many factors affecting a stock’s price; they do not identify which factor caused a particular outcome.
Censoring is especially important for the 2026 cohort. SpaceX and SK hynix account for 62.1% of the base universe’s gross offering proceeds, but neither had completed six months of trading by the cutoff. The twelve-month test consequently says much more about the older 2025 cohort than about the companies dominating 2026 proceeds.spcx, skhy
The model does not control convincingly for sector, valuation, growth, leverage, acquisition strategy or changing market expectations. With the available matched sample, a heavily parameterized regression would risk turning a small, heterogeneous dataset into a precise-looking answer. The rank tests describe the observed sample.
8. Low, base and high cases make the cost decision explicit
The sensitivity cases deduct selected costs from the reported adjusted result.
The three cases here are accounting illustrations, with no assigned probabilities:
| Case | Calculation |
|---|---|
| High | Accept the issuer’s adjusted-profit endpoint. |
| Base | Deduct disclosed SBC, excluding itemized payroll tax, and half of the selected operating-cost exclusions. |
| Low | Deduct that SBC and all of the selected operating-cost exclusions. |
Selected operating costs include identified restructuring, acquisition/integration, litigation, related payroll charges and specified offering or other operating items. The exact source rows selected are flagged in the classification dataset. Acquisition amortization, fair-value changes, impairments and inseparable unidentified baskets are not silently reclassified into this operating-cost exercise.
Ordinary EBITDA adjustments and the other held-constant categories remain unchanged. These cases therefore do not reconstruct GAAP and should not be interpreted as intrinsic-value or cash-flow estimates. Combining the software and earnings sensitivities would require checking for overlapping costs.
| Issuer / selected fiscal period | High, $m | Base, $m | Low, $m |
|---|---|---|---|
| FIG / 2024-12-31 | 127.218 | −848.791 | −877.247 |
| SAIL / 2024-01-31 | 54.250 | −82.340 | −84.110 |
| KLAR / 2024-12-31 | 180.000 | 78.000 | 68.000 |
| SPCX / 2025-12-31 | 6,584.000 | 4,393.500 | 4,150.000 |
| CRWV / 2024-12-31 | 1,219.258 | 1,187.771 | 1,187.771 |
| NAVN / 2025-01-31 | −25.042 | −102.222 | −102.421 |
| NIQ / 2024-12-31 | 740.700 | 636.050 | 536.100 |
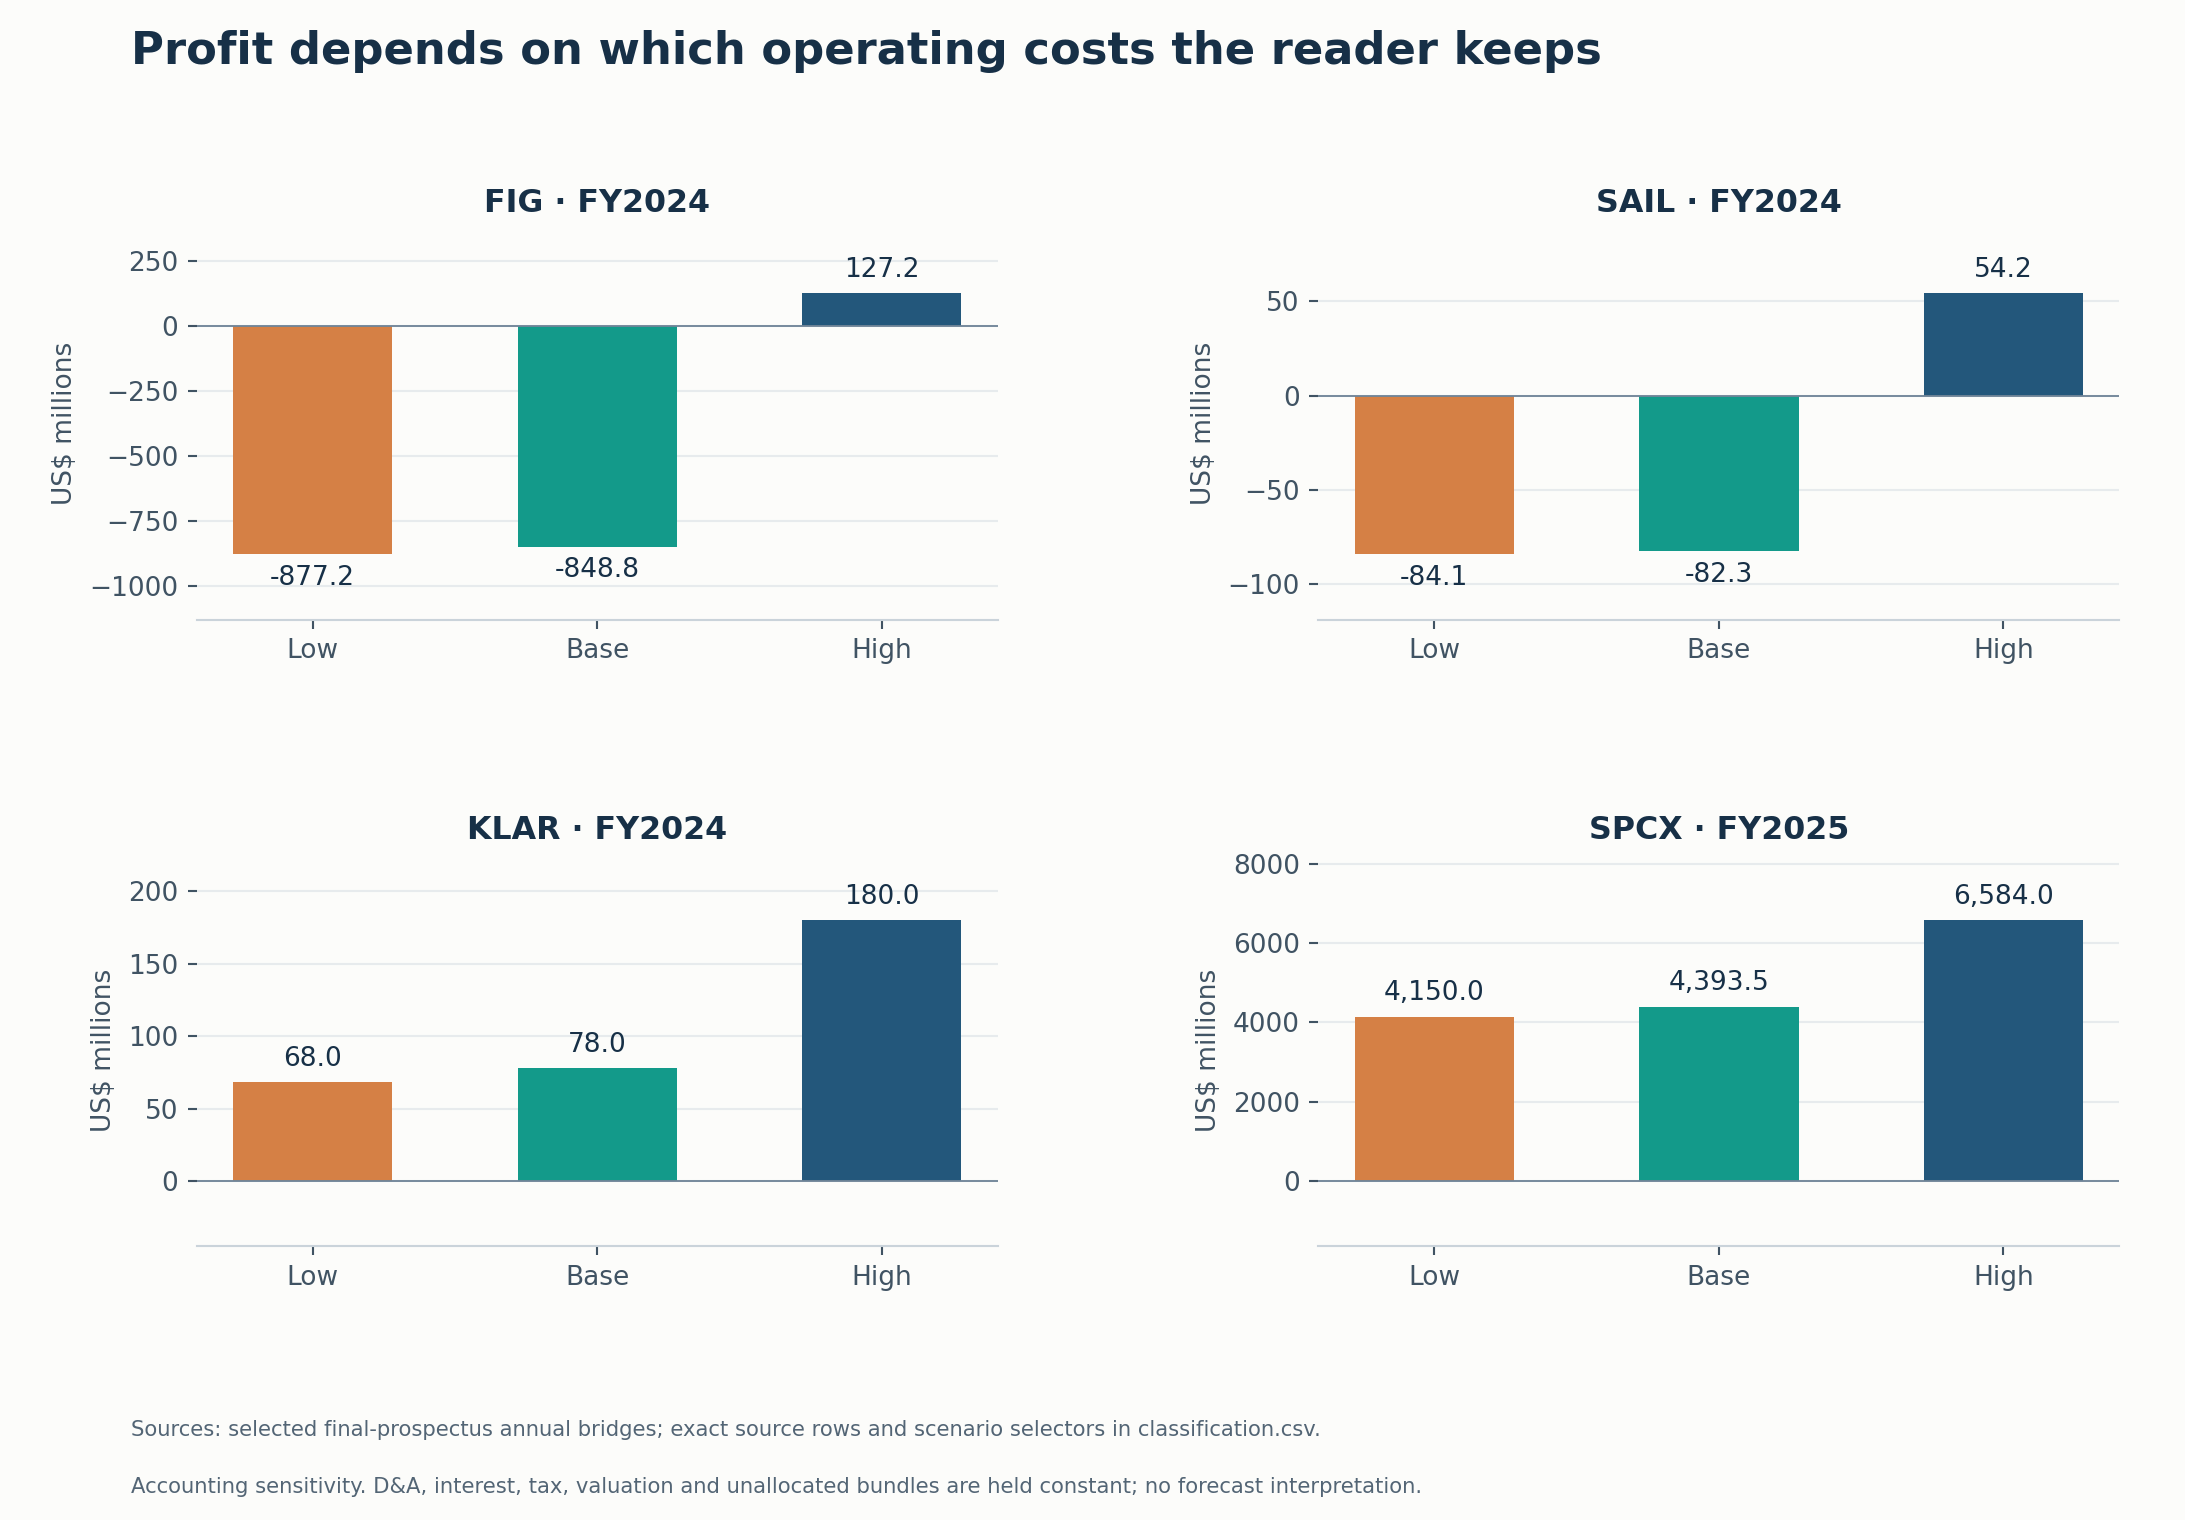
Figure 8. Sources: the selected final-prospectus annual bridges. Formulas and row-level selectors are in the workbook. Fiscal periods are those available at the IPO; SailPoint’s selected year ends in January 2024.
Figma’s result changes sign when stock compensation is deducted. SailPoint’s selected positive adjusted operating result also becomes negative in the base and low cases. Klarna remains positive under these particular cases because the exercise holds its D&A-related exclusions constant. SpaceX remains positive on an EBITDA basis even after the selected compensation and restructuring deductions.
CoreWeave illustrates the limit of this exercise. Its base and low cost-retention cases are identical because the selected operating basket is zero; both remove the disclosed SBC, while leaving the large valuation adjustment unchanged. Testing the valuation adjustment would require a scenario that changes it.
The base case is deliberately mechanical. There is no evidence that half of every selected cost will recur. Its value is transparency: a reader can replace the 50% assumption with a view grounded in the issuer’s program, contract or award schedule and see the arithmetic change.
What would change the conclusion?
Three types of evidence would be consequential.
First, more mature performance observations. Six- and twelve-month outcomes for the large 2026 offerings would materially broaden the sample. A consistent relationship across the raw gap, the custom gap, operating-only comparisons and appropriate sector controls would be stronger evidence than the current unstable, imprecise correlations. Merely obtaining a small p-value in one newly chosen specification would not be enough.
Second, better cost persistence evidence. Completed restructuring programs followed by several periods without replacement exclusions would support treating those costs as temporary. Repeated grants, integration spending or professional-fee baskets would support including more cost in forward earnings. The question is whether the underlying spending continues under the same or a new label.
Third, a clearer ownership bridge. Reconciling opening shares, awards settled, shares issued for acquisitions or financing, repurchases, forfeitures and conversions would permit more precise attribution of economic dilution. Current net share-count growth alone cannot provide that attribution. For software-heavy businesses, additions and amortization by asset vintage would similarly improve the analysis of continuing development cost.
The current evidence supports a practical reading rule: start with the stated accounting anchor, identify the largest signed adjustments, determine which costs persist, and check both ownership and cash consequences. The data show that adjusted profit can change the apparent profitability of an IPO substantially. They do not show that the size of that change, by itself, reliably forecasts the stock’s first year.
Evidence, model and replication notes
The downloadable package contains 350 reconciliation-period records and 3,709 classified rows, including endpoints and preserved subtotals, across the base and supplemental cohorts. Each row shows the original label, sign, currency, period and entity. Links, filing dates, locators and footnotes identify the source. A classification describes each adjustment.
The XLSX includes sourced inputs, formulas and outputs. The workbook calculates offering size and checks each reconciliation. It also shows custom adjustments, returns and benchmark levels. Other sheets report the scenarios, correlations, stock compensation and share counts. Bootstrap intervals and p-values are identified as statistical calculation outputs; they are not hardcoded source facts. The source and model data include the raw CSVs, price observations and calculation outputs.
The three headline checks were independently recalculated:
- Universe count and gross proceeds: cover share counts multiplied by offer prices, summed independently using decimal arithmetic.
- Loss-to-positive comparisons: selected source bridges recounted without relying on the headline summary cell.
- Return association: average ranks and their correlation rebuilt from underlying accounting and price fields, and checked against the displayed coefficient.
CoreWeave and Figma’s prominent accounting examples were checked against their audited statements. Base-cohort price endpoints were cross-checked against a second public history. The price audit records one SpaceX quote discrepancy. SpaceX had yet to reach the first return endpoint.
These controls verify transcription and arithmetic. They do not independently audit the issuers’ underlying books. The tables show rounding residuals and identify reasons for blank observations. Original currencies are not summed, pro forma and historical periods are not merged, and no missing compensation amount is treated as zero.
Covered base offerings
2025: Venture Global, Inc (VG); SMITHFIELD FOODS INC (SFD); Karman Holdings Inc (KRMN); SailPoint, Inc (SAIL); CoreWeave, Inc (CRWV); SmartStop Self Storage REIT, Inc (SMA); eToro Group Ltd (ETOR); Circle Internet Group, Inc (CRCL); Chime Financial, Inc (CHYM); NIQ Global Intelligence plc (NIQ); Accelerant Holdings (ARX); Figma, Inc (FIG); Firefly Aerospace Inc (FLY); Bullish (BLSH); Klarna Group plc (KLAR); Figure Technology Solutions, Inc (FIGR); Legence Corp (LGN); StubHub Holdings, Inc (STUB); WaterBridge Infrastructure LLC (WBI); Netskope Inc (NTSK); Fermi Inc (FRMI); Alliance Laundry Holdings Inc (ALH); Navan, Inc (NAVN); BETA Technologies, Inc (BETA); Medline Inc (MDLN).
2026: EquipmentShare.com Inc (EQPT); York Space Systems Inc (YSS); Forgent Power Solutions, Inc (FPS); SOLV Energy, Inc (MWH); MiniMed Group, Inc (MMED); PayPay Corp (PAYP); Janus Living, Inc (JAN); Arxis, Inc (ARXS); Madison Air Solutions Corp (MAIR); Kailera Therapeutics, Inc (KLRA); X-Energy, Inc (XE); Pershing Square USA, Ltd (PSUS); Fervo Energy Co (FRVO); Blackstone Digital Infrastructure Trust Inc (BXDC); Cerebras Systems Inc (CBRS); Applied Aerospace & Defense, Inc (AADX); INNIO N.V. (INIO); Quantinuum Inc (QNT); ERock, Inc (EROC); Parabilis Medicines, Inc (PBLS); SPACE EXPLORATION TECHNOLOGIES CORP (SPCX); DPC Holdings PLC (DPC); Bending Spoons S.p.A (BSP); SK hynix Inc (SKHY); Csquare, Inc (CSQR); Jersey Mike’s Subs Inc (JMKE); Accelevation Holdings Corp (ACCV).
Sources and data notes
- Offering quantities and prices are transcribed from the final-prospectus covers linked in
universe.csv; registrations, pricing dates, issuer/selling-holder splits and first-trade dates have their own columns. The audit calculations independently reproduce the count, proceeds and sign changes from those inputs. ↩ - Author calculations from
issuer_analysis.csv,returns.csv,association_tests.csvandboundary_association_tests.csv. All correlations use paired available observations; source financial bridges and offer prices and later closes have their own columns. ↩ - SK hynix final prospectus, filed 2026-07-10, front cover and ADS description: 177,900,000 ADS at $149; existing Korean listing disclosed. ↩
- Fermi initial Form S-11, filed September 8, 2025. The base offering count and proceeds include Fermi, and the S-1/F-1 sensitivity excludes it. ↩
- WaterBridge final prospectus, p. 41 and financial statements. FY2024 WBEF historical net loss was $76.803 million and adjusted EBITDA was $191.225 million. The combined pro forma figures also include NDB Operating and Desert Environmental. ↩
- SmartStop Self Storage REIT, Inc. final prospectus, filed 2025-04-02, printed pp. 86; also pp.86–87, adjusted EBITDA footnotes, and FFO offering-cost footnote 9. ↩
- Pershing Square USA final prospectus, filed 2026-04-30, cover, public/private offering description and distributed Pershing Square Inc. shares. Public base 40,516,960×$50; basket includes 0.2 PS per PSUS. ↩
boundary_universe.csvlinks each final cover and the filings documenting exercise or closing. The six linked issuers in the table are the documented threshold entrants. Caris, Via and Hinge Health have mature matched earnings/return observations; later entrants and FFO have their own scope flags. ↩- CoreWeave, Inc. final prospectus, filed 2025-03-31, MD&A / Non-GAAP Financial Measures / Adjusted EBITDA; printed pp. 116; table 414; audited operating statement F-6/table 867 and cash-flow statement F-10/table 872 provide an independent arithmetic route. ↩
- Figma, Inc. final prospectus, filed 2025-07-31, MD&A / Non-GAAP Financial Measures / Non-GAAP operating income; printed pp. 126; table 22; audited income statement and the 2024 liquidity-transaction discussion distinguish pre-IPO compensation from the later IPO event. ↩
- Figma FY2025 financial release, dated 18 February 2026, comparative FY2024 GAAP/non-GAAP reconciliation. Statement-based calculation and component cross-checks are in
headline_independent_crosschecks.csv. ↩ - SPACE EXPLORATION TECHNOLOGIES CORP final prospectus, filed 2026-06-12, printed p.120; table 37; common-control basis and xAI historical combination described in financial-statement notes. ↩
- Cerebras Systems Inc. final prospectus, filed 2026-05-14, printed p.96; table 27; the filing shows non-GAAP operating-loss and net-income reconciliations. ↩
- Bullish final prospectus, filed 2025-08-13, p. 189; HTML table 60 (zero-based); FY2022–24 reconciliation and the nonrecurring-expense footnote. ↩
- Legence Corp. final prospectus, filed 2025-09-15, printed pp. 20; p.20, footnote 5 limits nonrecurring language to described components of strategic initiatives. ↩
- Madison Air Solutions Corp final prospectus, filed 2026-04-17, printed p.100; table 33; pp.100–101, restructuring/professional-fee and equity-appreciation-rights footnotes. ↩
- Via final prospectus, filed 15 September 2025, pp.97–101, annual/standalone-quarter adjusted EBITDA bridges and footnotes2–4. ↩
- StubHub Holdings, Inc. final prospectus, filed 2025-09-17, p. 101; HTML table 375 (zero-based); indirect-tax contingency adjustment and footnotes. ↩
- SEC staff letter to StubHub, dated 21 June 2024, pp.2–3, comment 5. First public availability is not inferred from the letter date. ↩
- CRWV, filed 2025-05-15, Notes 1 and 11; CRCL, filed 2025-08-12, IPO and stock-compensation notes; CHYM, filed 2025-08-11, IPO and stock-compensation notes; FIG, filed 2026-02-18, Notes 1 and 13; STUB, filed 2026-03-05, Notes 1 and15; NTSK, filed 2026-03-31, IPO and equity compensation notes; NAVN, filed 2026-04-02, Notes 1 and equity incentives; HNGE, filed 2025-08-11, 10-Q MD&A Initial Public Offering p26; Note 8 cross-reference. Later-quarter SBC/revenue sources: FIG, filed 2026-11-04, Q3 10-Q share-based compensation note and income statement; NTSK, filed 2026-09-02, Q2 10-Q stock compensation allocation and income statement; SAIL, filed 2026-09-10, Q2 10-Q equity compensation and income statements; NAVN, filed 2026-09-10, Q2 10-Q stock compensation allocation and income statement; CHYM, filed 2026-11-05, Q3 10-Q stock compensation allocation table and income statement; CRCL, filed 2026-11-04, Q3 10-Q stock compensation note and income statement; CRWV, filed 2026-11-10, Q3 release; adjusted operating income reconciliation; USD millions. ↩
- ARX, filed 2025-11-12, Note 1 IPO restructuring and compensation. ↩
- FIGR, filed 2025-09-11, F-59 cash-flow statement, table 122; noncash capitalized SBC on F-60; ARX, filed 2025-07-25, F-9 cash-flow statement, table 580. Reconciliations: Figure p.179; Accelerant pp.99–100. Values refer to the same historical entity as the selected EBITDA. ↩
- Bending Spoons Q2 2026 results, filed 13 August 2026, pp.10–11, revised adjusted-net-income definition and comparative reconciliation. Original definition: final prospectus, filed 1 July 2026, p.16. ↩
- The 31 documented events in
material_metric_changes.csvlink initial/final filings, staff comments, issuer responses and later releases, with page/comment locators. eToro response, 23 January 2025, comment 6; Madison Air response, 9 March 2026, comment 1. Figure first public S-1, 18 August 2025, table 52, compared with final p.179. Coverage limits and release-date unknowns remain explicit. ↩ - SEC, How to Search for EDGAR Correspondence, current guidance checked 12 November 2026; public release no earlier than 20 business days after effectiveness or review completion. See also Non-GAAP Financial Measures C&DIs, especially Questions100.01–100.04 on substance and consistency. ↩
- Nasdaq historical prices, daily-close API URLs listed per ticker in
universe.csv; S&P 500 price series, FRED/S&P Dow Jones Indices, daily data through 11 November 2026.returns.csvrecords exact start/end dates, closes, basket treatment and offer-document URLs. Yahoo daily histories provide the independent price cross-check; the price-audit files describe the exception. ↩ - Drugs Made In America Acquisition II final prospectus, filed 25 September 2025, cover; FY2025 Form 10-K, filed 15 April 2026, Item 5/p.12 and Notes 3/6, says the option was never exercised. SPAC screening and primary threshold checks are preserved in the data package. ↩
Supporting material
- Excel model ↗Sourced inputs, live calculations and reported outputs.
- Source and model data (CSV collection) ↗Data tables, source references and calculation exports.
- Universe ↗Download as CSV.