Financial systems
Rebuilding the Electronic Arts buyout
The $210-a-share buyout produces a 13.2% modeled five-year gross return at a 16× exit multiple.

The Electronic Arts acquisition is complete. The relevant starting point is $210 per share and approximately $18.0 billion of funded acquisition debt against the original $20 billion financing commitment. A reconstruction using management’s disclosed forecast and explicit post-FY2031 extensions produces a five-year gross sponsor IRR of 13.2% and 1.86× invested capital at a 16× exit multiple. It does not independently support a 20% return.
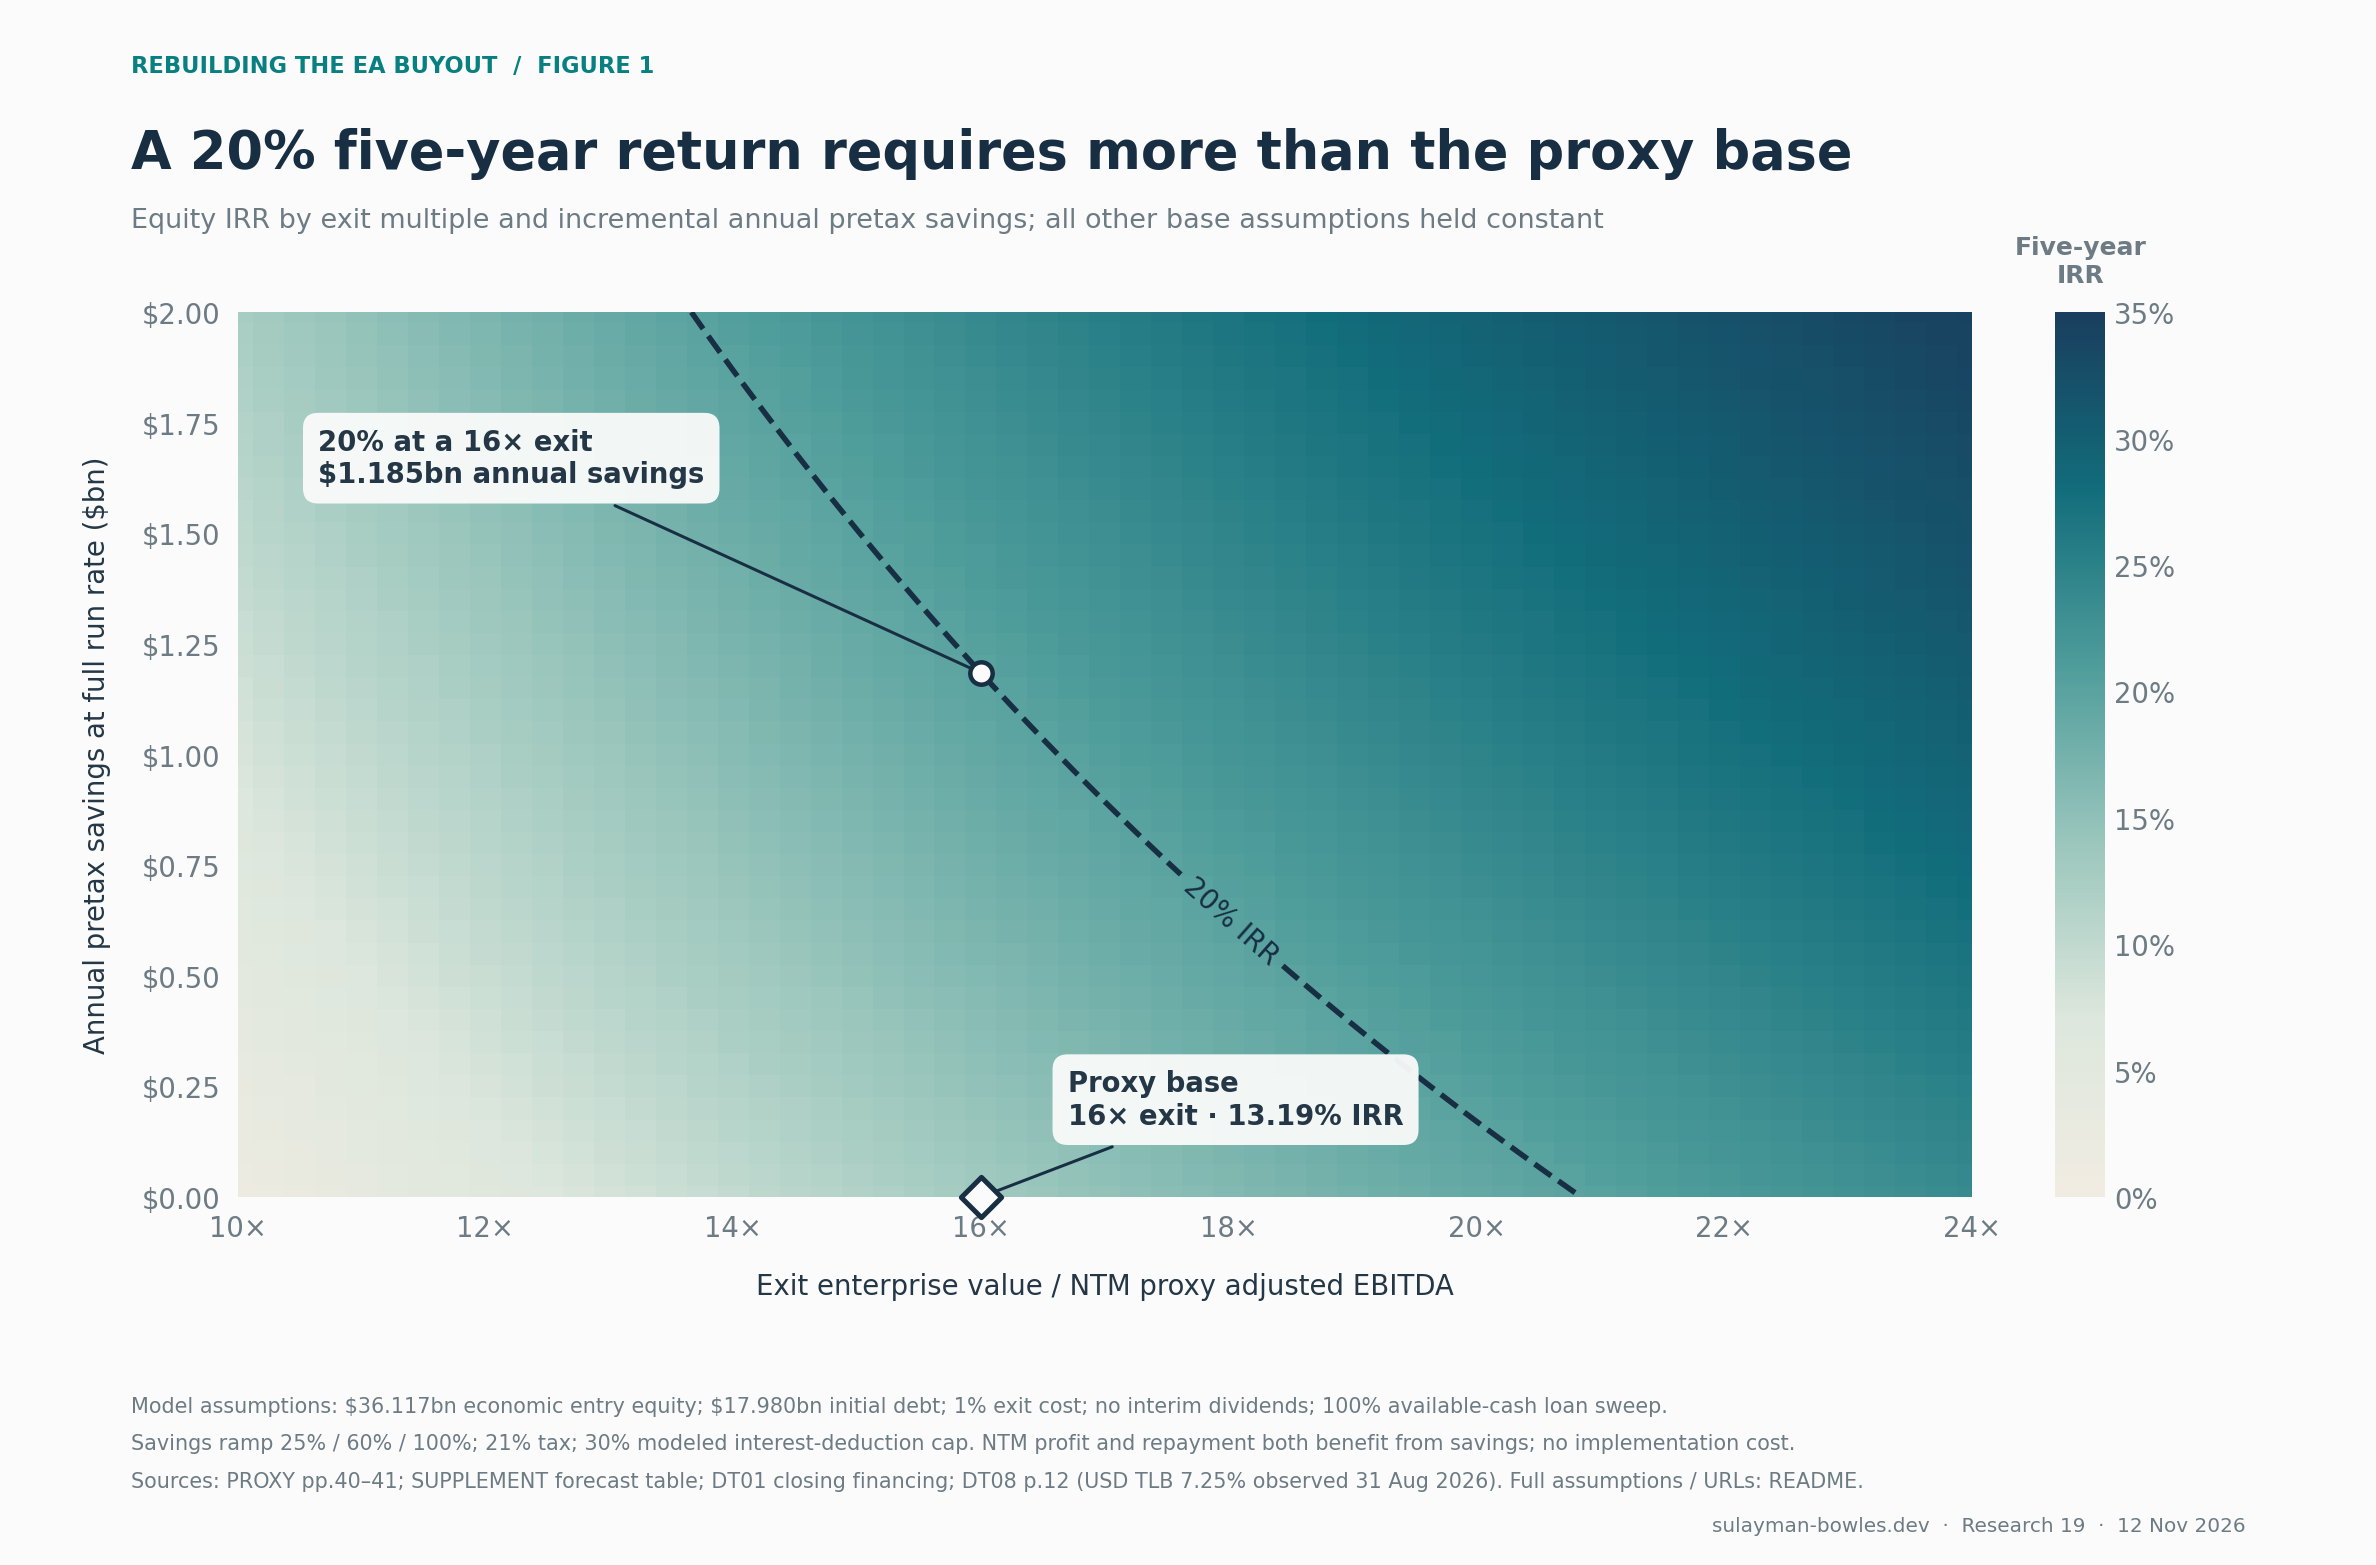
At that same exit multiple, approximately $1.2 billion of additional recurring annual pretax savings, phased in over three years, would be needed to reach a 20% five-year IRR. Alternatively, with no additional savings, the exit multiple would have to rise to approximately 20.8×. The returns and exit multiple follow from the model assumptions. The acquisition closed on 4 August 2026; the closing filing and financing counsel’s completion announcement independently corroborate completion and the final financing scale.close, counsel
The principal risk is the combination of a demanding operating forecast, an unusually important compensation adjustment, and debt maturities that arrive before all the cash has been generated. The proxy forecast already deducts stock compensation in unlevered free cash flow. Subtracting it again understates cash generation; ignoring the need to compensate employees after privatization overstates it. The model deducts that cost once.
The low case produces a negative 4.5% five-year IRR, even assuming that required refinancing succeeds. The high case produces 23.1%, but combines stronger franchise bookings, $500 million of recurring savings, lower floating interest rates, and an 18× exit. The dispersion is the investment question: how much of the management forecast can be converted into durable cash profit without weakening the franchises that support the exit valuation?
There is also material news after the merger. EA’s 21 October portfolio announcement stopped Mass Effect development, announced BioWare’s closure, reduced the skate team, and paused The Sims’ Project Lotus while prioritizing Project Evergreen. It also committed continued investment to major franchises. EA disclosed no numerical savings target in that announcement. The model uses management’s earlier forecast as a historical reference. It does not reflect the latest operating plan.portfolio
All dollar figures below are US dollars. Tables use millions unless marked otherwise. Fact means directly reported; calculation means arithmetic on reported inputs; estimate means an explicit analyst assumption. The accompanying XLSX is the primary analytical asset. Its inputs, operating calculations, debt schedules, returns, evidence register, and checks each have their own sheet.
1. The financing at closing
The merger began with the September 2025 agreement involving PIF, Silver Lake, and Affinity Partners. The consideration remained $210 in cash per common share, subject to the merger agreement’s exceptions. EA’s 4 August 2026 Form 8-K records completion. Its 14 August Form 15 reports one holder of record and no other securities classes still subject to a reporting duty under the cited provisions.close, form15
The latest consolidated operating filing located in the current SEC submissions record is the Form 10-Q filed on 3 August for the quarter labeled 30 June 2026. This research did not locate newer consolidated financial results in the issuer and SEC sources searched. The search covers public issuer and SEC materials.quarter, feed
The final funded principal is $14.750 billion plus €2.805 billion. Translating the euro amount at the ECB’s 4 August reference rate of $1.1515 per euro gives $17.980 billion. Adding the $500 million revolving commitment gives approximately $18.480 billion of committed facilities and notes, consistent with counsel’s rounded $18.5 billion closing description. The revolver is not counted as funded debt without evidence of a draw.close, fx, counsel
| Instrument | Native principal | Pricing used in model | Maturity basis | Evidence status |
|---|---|---|---|---|
| Term loan A-1 | $2,167m | 5.75% | Three years | Split and tenor from April financing announcement; rate estimated |
| Term loan A-2 | $1,083m | 6.00% | Five years | Same qualification; closing filing confirms $3,250m aggregate TLA |
| USD term loan B | $6,125m | 7.25% | 4 August 2033 | August holdings show SOFR + 350bp and 7.25% observed rate |
| EUR term loan B | €1,725m | 6.00% | Seven years | EURIBOR + 350bp observed; future benchmark estimated |
| USD secured notes | $2,875m | 7.25% | 1 July 2033 | Closing filing |
| EUR secured notes | €1,080m | 6.25% | 1 July 2033 | Closing filing |
| USD unsecured notes | $2,500m | 8.75% | 1 July 2034 | Closing filing |
| Revolving facility | $500m commitment | 7.00% drawn; 0.50% undrawn | Not verified | Pricing and availability mechanics estimated |
The loan holdings corroborate the financing terms. Invesco’s August 31 investment schedule, filed November 6, identifies the USD term loan and its pricing. Vanguard’s June 30 holdings identify the floating spreads. Neither holding schedule substitutes for the executed credit agreement; holding a reported floating rate constant for seven years is a modeling choice.invesco, vanguard
The original $20 billion commitment should not be carried forward as closing debt. A February issuer tender document also describes a $1.5 billion cash-flow backstop that was not intended to fund if EA had sufficient balance-sheet cash. Approximately $18 billion funded, $500 million revolving capacity, and that backstop explain the broad original commitment structure. This is a reconciliation inference; the closing filing determines the funded balances used here.tender
The secured notes were issued into escrow in April. Their pre-closing accrual, escrow income, original-issue discount, and ultimate transaction expenses require a closing funds-flow statement to resolve precisely. The model uses an estimated total allowance for those costs.
2. Cash subscriptions and rolled equity
An LBO return should be measured against the capital economically invested. PIF contributed shares. Their value still counts as invested equity.
PIF’s final Schedule 13D amendment reports 24,807,932 shares rolled, valued at approximately $5.21 billion. At $210, the exact arithmetic is $5,209.7 million. The proxy describes approximately $36.4 billion of aggregate equity commitments, but does not disclose the final cash subscription for each sponsor. PIF’s cash subscription, Silver Lake’s funded check, and Affinity’s funded check therefore remain UNKNOWN.pif, proxy
The model uses the July 29 common-share count of 252,387,410 and the June balance sheet. The calculation uses the closest pre-closing public observations identified. The resulting reconstruction is:
| Uses | $m | Classification |
|---|---|---|
| Common-share value: 252.387410m × $210 | 53,001.4 | Calculation from pre-closing share count |
| Legacy-debt settlement cash | 1,500.0 | Estimate using principal as a proxy |
| Fees, financing discount, carry, and other costs | 1,000.0 | Aggregate estimate |
| Opening operating cash kept in the business | 1,000.0 | Estimate |
| Total uses | 56,501.4 | Model reconstruction |
| Sources | $m | Classification |
|---|---|---|
| Funded acquisition debt | 17,980.0 | Reported principal, translated |
| Target cash and short-term investments | 2,404.0 | June 2026 reported balance |
| PIF rolled equity | 5,209.7 | Reported shares × merger price |
| New sponsor cash equity | 30,907.7 | Residual estimate |
| Total sources | 56,501.4 | Model reconstruction |
| Economic sponsor equity, including rollover | 36,117.4 | Return denominator |
This is close to the aggregate commitment, but proximity leaves funding unverified. Adding the $5.21 billion rollover to $36.4 billion and calling the sum disclosed sponsor cash would be unsupported. Likewise, multiplying a press-reported ownership percentage by an estimated equity total would manufacture sponsor checks. The European Commission’s decision identifies PIF’s sole control but redacts relevant percentages; control is not a disclosure of each investor’s cash contribution.ec
The $55 billion headline also does not provide a complete funds-flow bridge. Common-share value plus $1.5 billion of old principal less $2.404 billion of cash gives a $52.097 billion common-share enterprise-value proxy. The $2.903 billion difference from the headline is left visible. Award treatment, measurement dates, transaction perimeter, and rounding need a final capitalization and funds-flow statement; the model does not assign that entire difference to an invented fee or debt item.
Legacy debt requires particular care. Only $68.830 million of the 2031 notes and $7.922 million of the 2051 notes were tendered. For untendered notes, the issuer reported a Treasury-funded defeasance of certain obligations. The remaining $1,423.248 million principal should not simply be added as an uncollateralized operating liability while ignoring the dedicated trust assets. Conversely, the trust’s funding cost cannot be assumed to equal principal. The $1.5 billion model use is an estimate pending those details.tenderfinal
A public docket records EA’s 3 November 2026 lawsuit against U.S. Bank Trust Company, National Association, the trustee named in the closing filing. The free materials retrieved did not include the complaint. This report therefore makes no finding about the claims, merits, or implications for the legacy notes.docket
The equity sensitivity is economically manageable but real: with the same five-year exit proceeds, changing economic entry equity from $35 billion to $38 billion changes the return from approximately 13.9% to 12.0%. Closing precision matters, but it does not eliminate the much larger operating and valuation hurdle.
3. Historical cash generation: what can support the debt?
EA’s historical results provide the starting point for the buyout model. The following figures tie to the 10-K financial statements and net-bookings reconciliations; the raw CSVs record the document and locator for each observation.k26, k25, olderbookings
| Fiscal year ended March | FY2023 | FY2024 | FY2025 | FY2026 |
|---|---|---|---|---|
| GAAP revenue | 7,426 | 7,562 | 7,463 | 7,531 |
| Net bookings | 7,341 | 7,430 | 7,355 | 8,026 |
| Live-services and other bookings | 5,530 | 5,425 | 5,338 | 5,630 |
| GAAP operating income | 1,332 | 1,518 | 1,520 | 1,162 |
| Operating cash flow | 1,550 | 2,315 | 2,079 | 2,553 |
| Capital expenditure | 207 | 199 | 221 | 230 |
| Stock compensation | 548 | 584 | 642 | 656 |
FY2026 GAAP operating margin was 15.4%, down from 20.4% in FY2025. R&D rose from $2.569 billion to $2.828 billion and marketing and sales from $962 million to $1.128 billion. Those reported costs help explain why stronger bookings cannot be translated mechanically into the forecast profit margin.er26
The cash conversion question is more informative than bookings growth alone. FY2026 operating cash flow less capital expenditure was $2.323 billion. Replacing that year’s $656 million noncash compensation charge with an equivalent cash payment reduces the simple cash-availability proxy to $1.667 billion. This calculation does not forecast the exact private compensation plan. It makes the continuing employee cost visible. The operating cash flow, capex, and SBC inputs also reconcile to the annual earnings release.er26
Tax withholding on employee awards should not then be subtracted again as another full compensation expense. That would mix the economic compensation charge with the settlement mechanics of public equity awards. Similarly, standalone share buybacks and dividends are financing distributions. They are not operating costs that should survive automatically in the sponsor debt sweep.
The latest public quarter shows how differently revenue and bookings can move. June-quarter revenue was $1.986 billion, bookings $1.349 billion, and operating cash flow negative $242 million. Revenue grew much faster than bookings. A quarter with revenue recognition from previous bookings is not proof that current consumer spending accelerated at the same rate, and a seasonal negative cash-flow quarter is not by itself evidence of an annual liquidity failure.quarter
Development accounting is already conservative in an important respect
EA’s accounting policy expenses research and development as incurred; game-development costs capitalized to date are described as insignificant because technological feasibility occurs late in the process. Internal-use software is a different asset category. The FY2026 net internal-use software balance was $135 million versus $105 million a year earlier.k26
The model therefore does not capitalize all R&D to create additional EBITDA. It does not deduct the internal-use software balance as if it were an annual cash outflow, either. The low case’s additional $150 million annual development requirement reduces operating profit and after-tax cash once. The model deducts capital expenditure from cash flow. This matters because an aggressive capitalization assumption could make both earnings and debt capacity appear stronger without changing cash spent on games.
The proxy’s “Adjusted EBITDA” label needs its own definition
The forecast footnote defines adjusted EBITDA through operating income, stock compensation, and deferred-revenue adjustments without an explicit depreciation add-back. The workbook preserves that disclosed series under its own label. It does not present it as a reconstructed covenant measure.supplement
Applying the literal disclosed bridge to FY2026 gives $1,162 million operating income plus $656 million SBC plus the $495 million bookings adjustment: $2,313 million. Adding $319 million of disclosed depreciation and intangible amortization would instead give $2,632 million. Against the old $2,759 million forecast, those approaches imply very different apparent shortfalls: about 16.2% or 4.6%. A headline claiming a precise reported EBITDA miss would hide the definition problem.
This is a reason to demand a GAAP-to-lender reconciliation. It is not a reason to select whichever EBITDA produces the preferred leverage ratio. The return model consistently uses the proxy series; its credit coverage also shows the lower profit after cash compensation.
4. The board forecast and fairness opinion
The November merger proxy, supplemented in December, supplies the management forecast used in the transaction process. The model uses projections dated September 2025.proxy, supplement
| Management forecast | FY2026 | FY2027 | FY2028 | FY2029 | FY2030 | FY2031 |
|---|---|---|---|---|---|---|
| Net bookings | 7,850 | 8,250 | 10,000 | 10,400 | 10,820 | 11,250 |
| Proxy adjusted EBITDA | 2,759 | 3,003 | 4,200 | 4,060 | 4,328 | 4,500 |
| Stock compensation | 680 | 680 | 680 | 680 | 680 | 680 |
| Unlevered free cash flow | 1,503 | 1,678 | 2,541 | 2,520 | 2,737 | 2,878 |
| Tax-asset benefits | 46 | 143 | 141 | 126 | 104 | 41 |
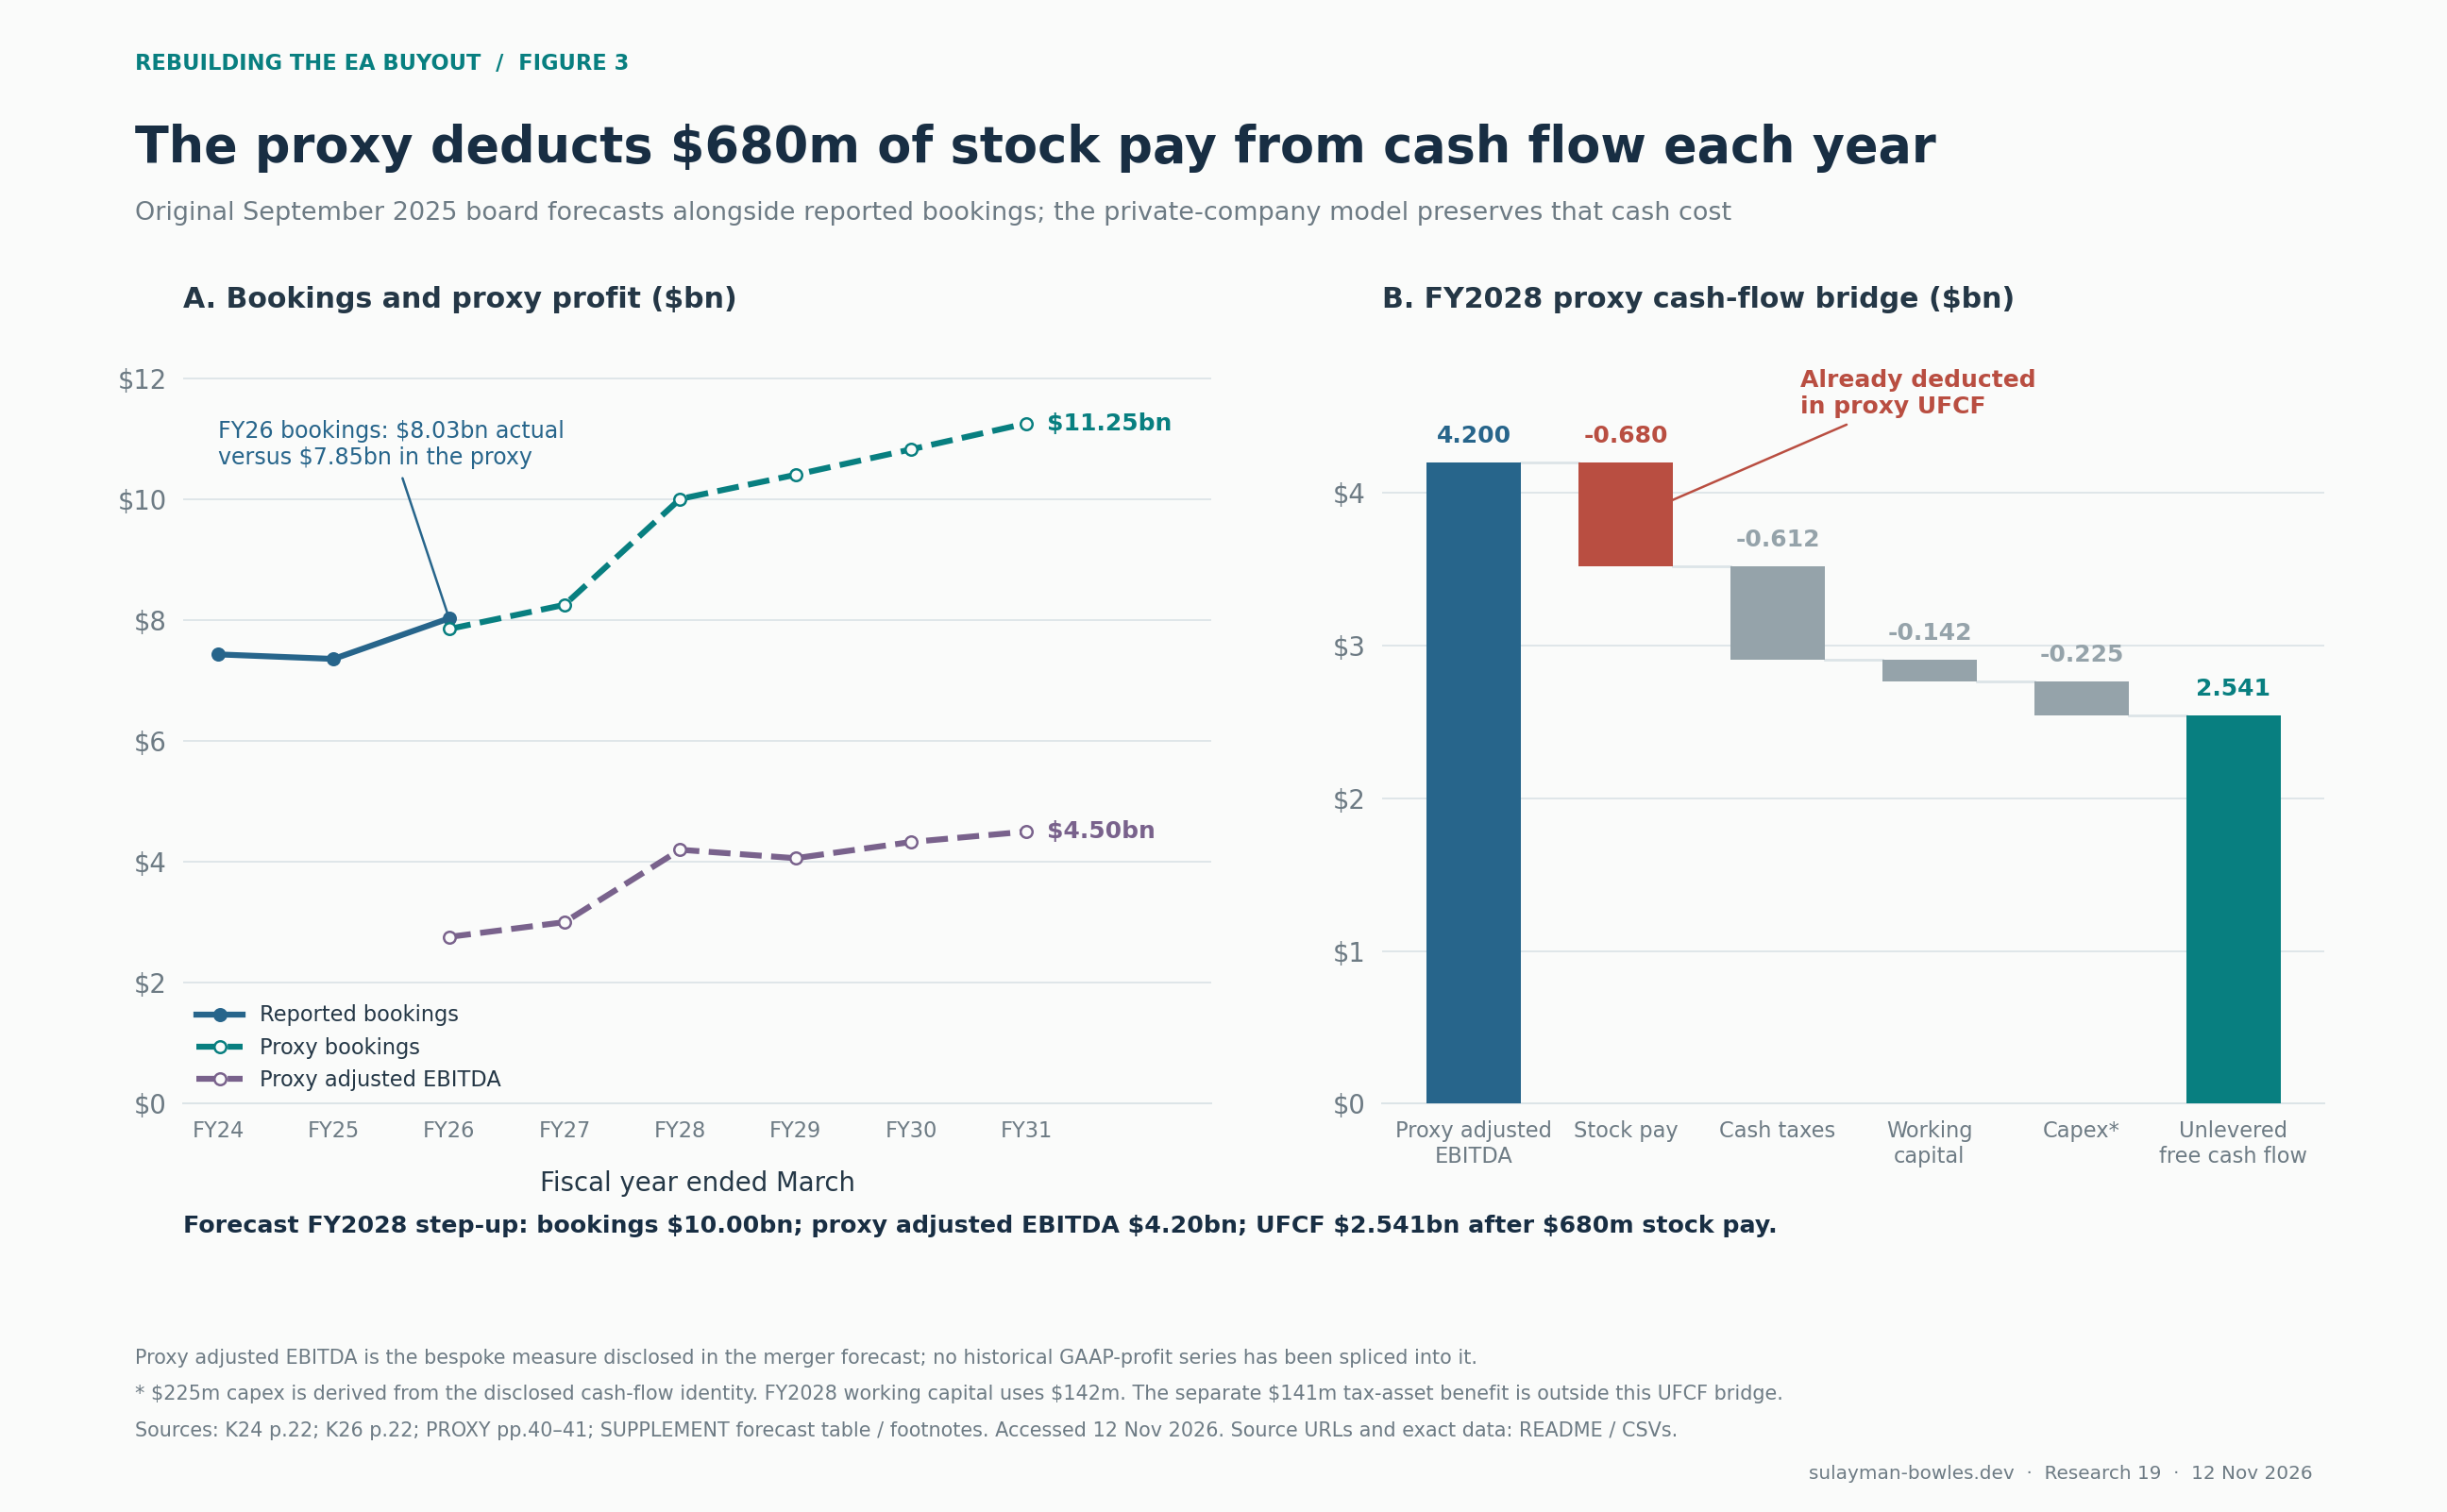
The decisive step is FY2028: bookings rise 21.2%, adjusted profit 39.9%, and the adjusted-profit margin reaches 42% before easing. That step is already in the base case. An analyst should not add another large “release upside” without first identifying what management assumed in the $10 billion bookings year.
The December supplement makes the cash-flow bridge auditable. For FY2028, $4,200 million adjusted profit less $680 million compensation, $612 million cash taxes, $142 million working-capital use, and an implied $225 million capex equals $2,541 million UFCF. Capex is a residual inferred from the disclosed bridge; FY2029’s $226 million result includes rounding. Tax-asset benefits appear on their own line, as in the fairness DCF.
Goldman’s disclosed DCF range was $137–$220 per share, using 7.5%–9.5% discount rates and 2%–3% terminal growth. Its future-share-price analysis produced $157–$236, using 14×–16× forward adjusted EBITDA and an 8.5% equity discount rate. The board’s process moved from a $200 proposal to $210; the proxy describes the decision not to solicit alternative bidders.proxy
Those analyses address value to selling shareholders under their stated methods. The buyers’ return depends on financing costs, the refinancing outcome and cash compensation policy. A $210 acquisition price can be within a seller’s fairness range while producing a low-teens sponsor return at a given exit valuation. The two conclusions are consistent.
5. How the operating cases are constructed
The model starts on 4 August 2026 and measures exits on the fifth, sixth, and seventh closing anniversaries. Each annual operating period blends 239/365 of one March fiscal year and 126/365 of the following year. This aligns the periods without pretending that an undisclosed monthly forecast is available. It does not capture release-season cash troughs or leap-day differences.
The disclosed forecast ends in FY2031. Thereafter, the base extends bookings, proxy profit, cash taxes, working capital, and capex at 4% annually; compensation grows 3%; tax-asset benefits fall to zero. Cash flow is rebuilt from those components. A seven-year exit consequently depends more heavily on analyst extension than a five-year exit.
No complete franchise-dollar forecast was disclosed. To make franchise risks editable, the workbook allocates proxy bookings across the following analyst-estimated shares. The model uses these weights to assign the sensitivity.
| Franchise group | Assumed share | Low case versus proxy | High case versus proxy |
|---|---|---|---|
| EA SPORTS FC | 45% | −10% | +10% |
| American football | 20% | −10% | +10% |
| Apex Legends | 8% | −20% | Flat |
| Battlefield | 10% | −40%; −60% in year two | +20% |
| The Sims | 7% | −10% | +10% |
| Other franchises | 10% | −5% | +5% |
The base uses the proxy totals unchanged. The low allocations reduce aggregate bookings by 13.3% in ordinary years and 15.3% in the additional weak-release year. The high allocations lift bookings 9.7%. Incremental bookings carry an assumed 60% contribution margin. These choices allow the reader to ask which franchise disappointment would cause a particular cash shortfall, while keeping the absence of disclosed franchise dollars visible.
Estimated live-service fractions within the groups are calibrated to the reported FY2026 aggregate live-services-and-other bookings share of approximately 70.1%. They allocate bookings; retention, profitability and stability may vary across FC, Apex, and The Sims. A live-service label does not remove title concentration or player-engagement risk.
The low case also raises floating rates by two percentage points, cash compensation by 20%, and annual development expense by $150 million. The high case lowers floating rates by half a percentage point and adds savings of $100 million, $200 million, $300 million, $400 million, then $500 million annually. Base has no additional savings beyond whatever is already embedded in management’s margins.
EA’s October portfolio changes strengthen the case for testing a different development budget, but they cannot be mapped accurately into these forecast dollars without title economics, severance costs, and release timing. The October 27 Madden stadium-sponsorship announcement adds a potential monetization channel, yet discloses no revenue or profit forecast. Neither announcement receives an invented incremental cash benefit.portfolio, advertising
6. Cash sweep, annual coverage, and refinancing
The cash schedule is explicit:
Cash for debt service = proxy UFCF + tax benefits − cash interest + incremental interest tax shield.
The model assumes a 21% incremental tax rate and limits the current interest deduction to 30% of profit after cash compensation. The tax assumption applies a common rate. A tax model would need the statutory adjustments, country-level taxes and loss carryforwards. A full tax model could move cash materially.
The first $311 million of annual loan amortization follows S&P’s first-twelve-month estimate, carried forward as an assumption. The allocation to earlier maturities is also assumed. Remaining cash sweeps the revolver and loans through one repayment pool. The model holds bonds to maturity because the complete call schedules and redemption economics were not located. Cash accumulates once loans are repaid. Minimum operating cash is $1 billion.
Interest uses beginning-year balances. New revolver drawings are treated as year-end; there is no interest income on surplus cash. These annual conventions are deliberately inspectable, but a monthly liquidity and interest model would be required for underwriting a refinancing.
The base’s first-year bridge is $1,975.9 million UFCF + $142.3 million tax benefits − $1,260.2 million interest + $172.4 million modeled tax shield = $1,030.4 million for principal reduction. After $311 million assumed amortization, $719.4 million remains for the discretionary sweep. Funded debt falls to $16,949.6 million.
| Year after closing | Base cash interest | Base coverage after compensation | Base cash after interest and amortization | Base ending debt | Low coverage | Low cash after interest and amortization |
|---|---|---|---|---|---|---|
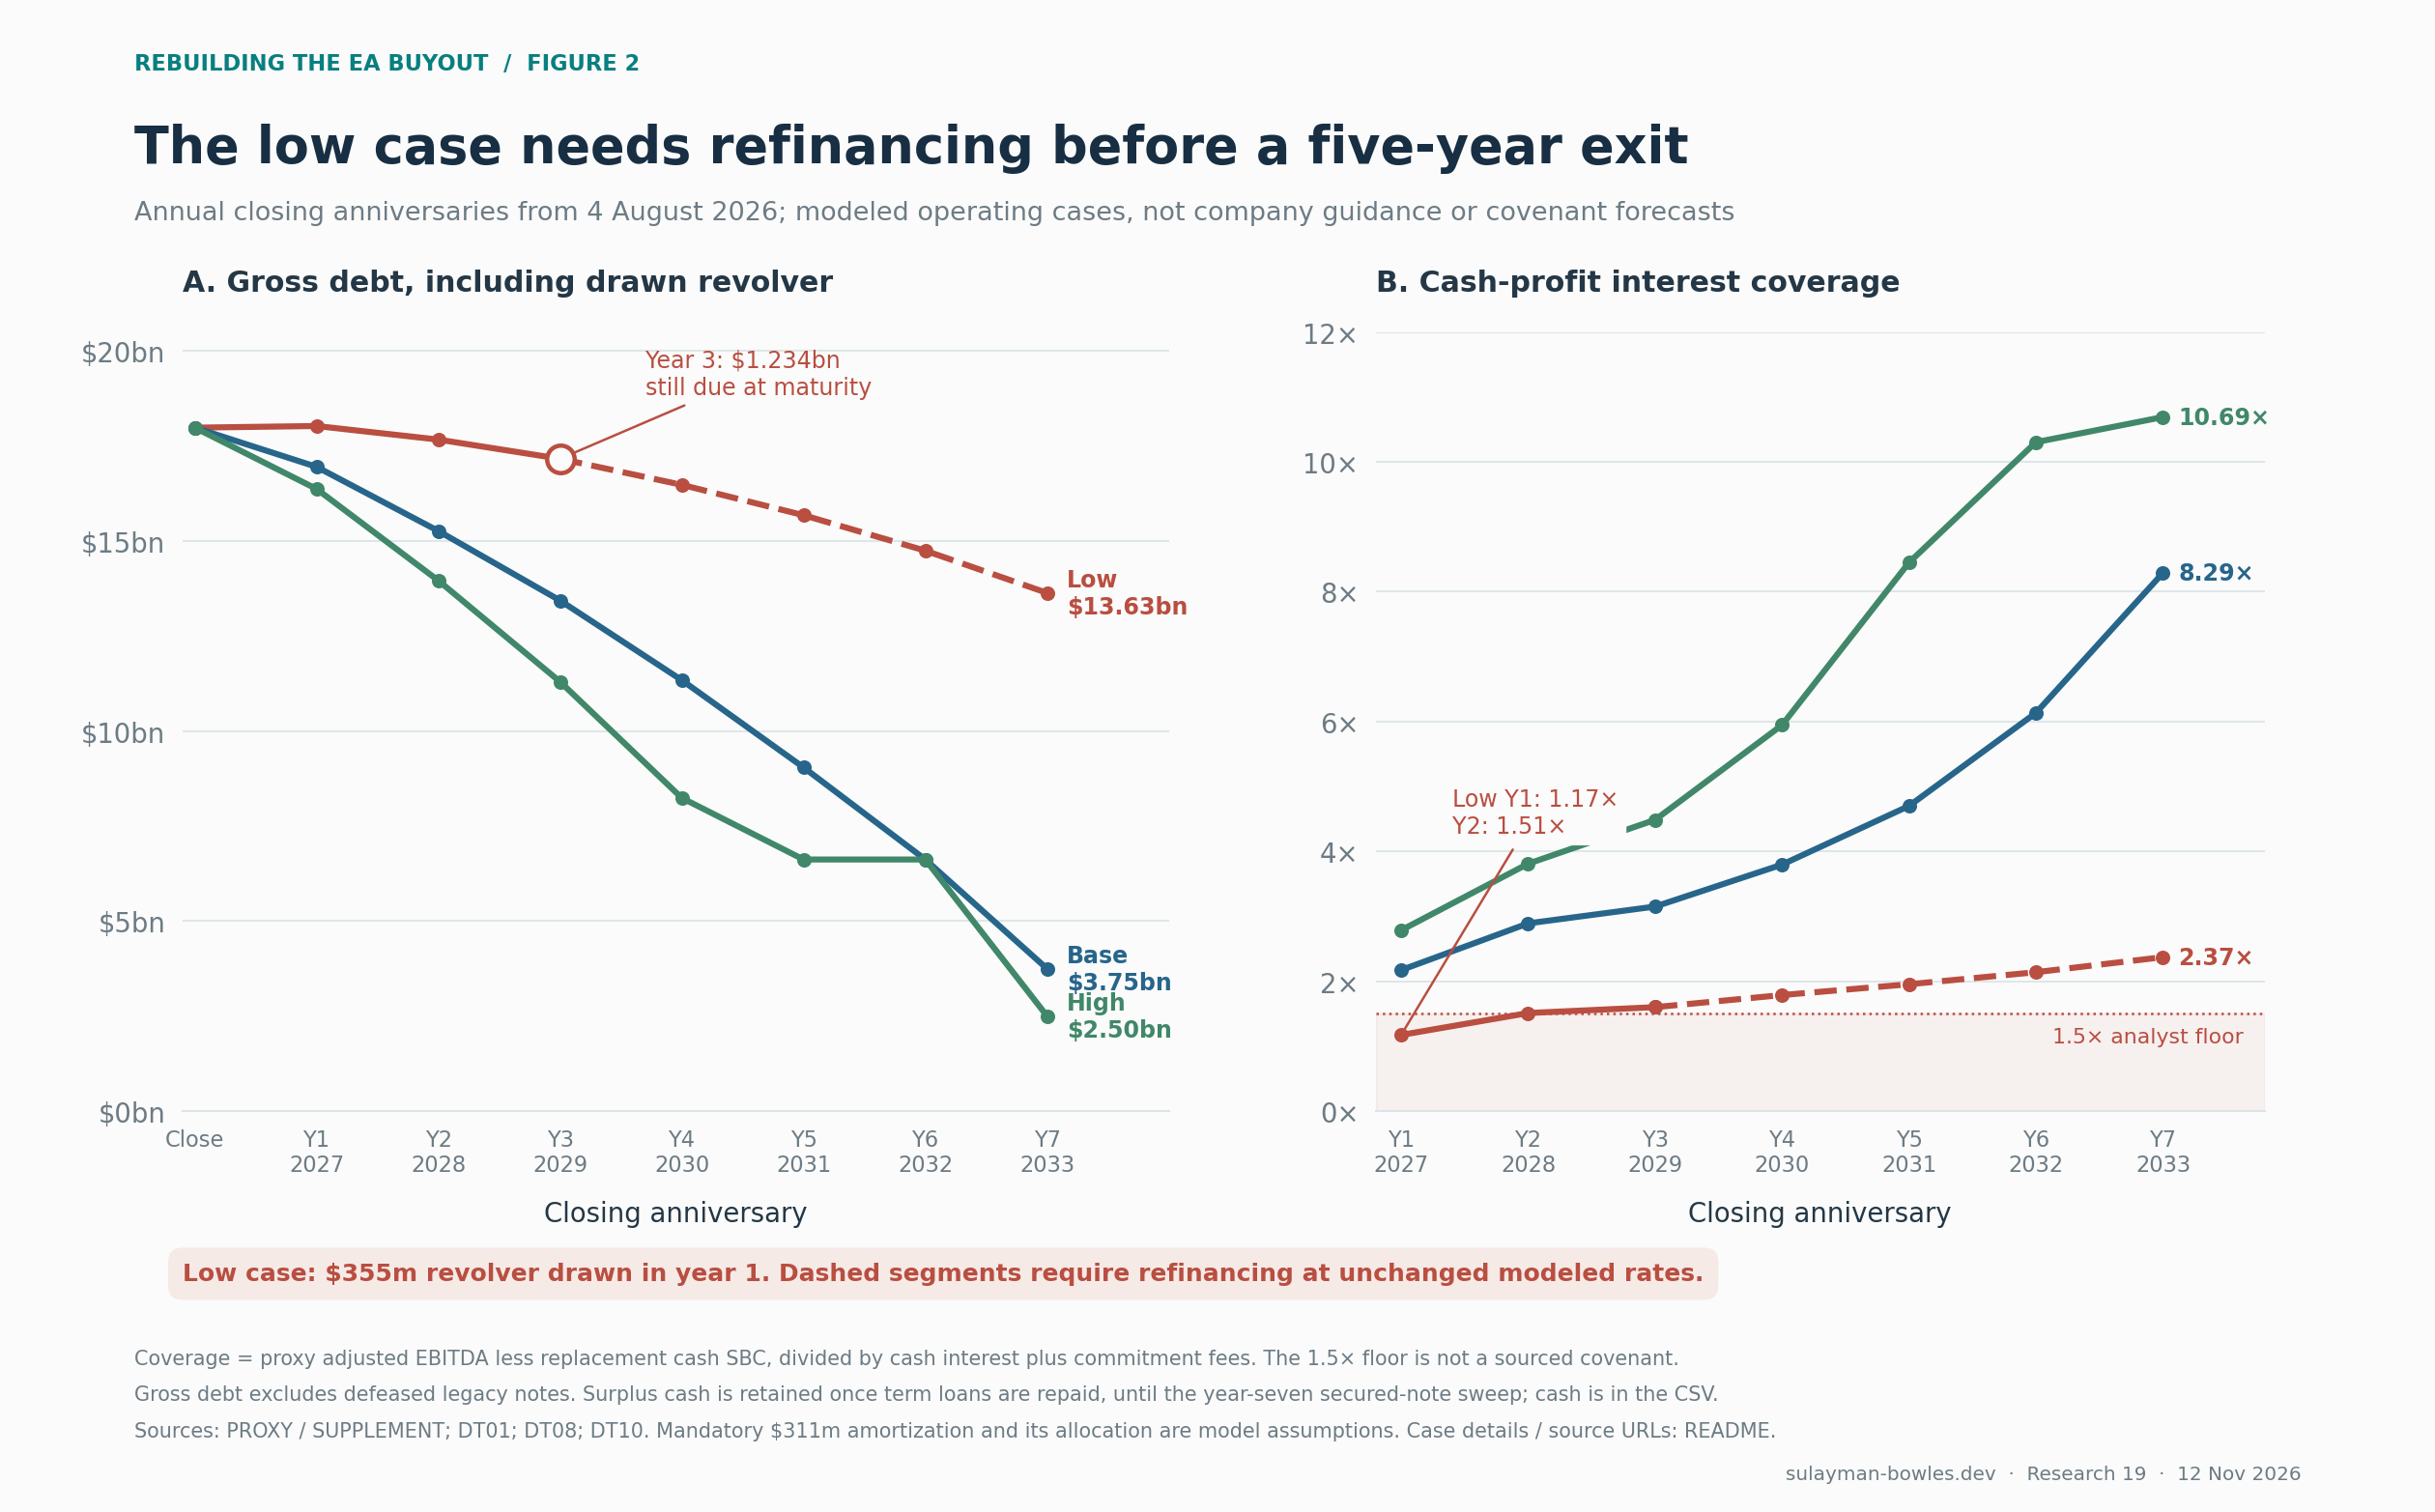
| 1 | 1,260 | 2.17× | 719 | 16,950 | 1.17× | −355 |
| 2 | 1,201 | 2.89× | 1,376 | 15,262 | 1.51× | 46 |
| 3 | 1,103 | 3.15× | 1,518 | 13,433 | 1.60× | 194 |
| 4 | 977 | 3.80× | 1,785 | 11,336 | 1.79× | 375 |
| 5 | 825 | 4.70× | 1,984 | 9,041 | 1.95× | 488 |
| 6 | 658 | 6.13× | 2,213 | 6,619 | 2.14× | 622 |
| 7 | 507 | 8.29× | 2,772 | 3,745 | 2.37× | 801 |
These are annual model results. Cash headroom excludes balloon maturities, which have their own tests. Coverage is profit after replacement compensation divided by cash interest and fees. The 1.5× floor is the analyst’s stress threshold. Base first-year profit headroom over that floor is $846 million; low-case headroom is negative $488 million. Low’s second year clears the threshold by only about $15 million.
The low case draws $354.5 million of the $500 million revolver in year one, leaving $145.5 million undrawn while preserving minimum cash. More importantly, it leaves $1.234 billion due at the assumed year-three TLA maturity and $947 million at year five. Its year-seven maturing balance reaches $11.132 billion. The model carries unpaid maturity balances at unchanged rates solely to calculate conditional exit economics. It does not prove that refinancing is available or price the resulting fees and spread changes.
Base repays its term loans by year six, but still has a $1.245 billion secured-note maturity funding requirement in year seven after applying modeled cash. The secured notes mature July 1, before the August 4 exit anniversary. The modeled sale can repay debt in value terms; timing requires an earlier exit, bridge funding, or refinancing. High has no modeled maturity shortfall under these assumptions.
An isolated weak release is different from a compounded downturn
EA reduced FY2025 bookings guidance from $7.5–$7.8 billion in October 2024 to $7.0–$7.15 billion in January 2025. The midpoint reduction was $575 million, or 7.5%. The issuer attributed most of the reduction to global football weakness and also described Dragon Age engagement below expectations. Player counts are not unit sales. The $575 million is used here only as an observable stress calibration.guidance, reset
| Isolated first-year bookings shortfall | Coverage after compensation | Cash after interest and amortization |
|---|---|---|
| $575m | 1.90× | $425m |
| $1,000m | 1.70× | $208m |
| $1,500m | 1.46× | −$48m |
This calculation includes the loss of interest tax shield when the deduction cap binds. A $575 million miss is absorbable in the modeled base; a larger miss can consume annual debt-service headroom. The compounded low case is more severe because bookings, interest rates, compensation, and development costs deteriorate together.
S&P provides an independent warning against treating every EBITDA definition as interchangeable. Its March 16 preliminary analysis forecast FY2027 adjusted EBITDA of $1.745 billion, interest of $1.104 billion, free operating cash flow of $553 million, and 1.6× coverage; FY2028 coverage improved to 2.3×. It treated cash-settled unvested awards as expenses, with no automatic add-back. Those forecasts use financing assumptions that were current at the time.sp
7. Returns: the exit valuation does much of the work
Exit enterprise value equals next-twelve-month proxy adjusted EBITDA before replacement cash compensation, multiplied by the chosen multiple. The model deducts a 1% sale cost and outstanding debt, adds cash, and assumes no interim sponsor distributions. IRR is the annualized increase from $36.117 billion of economic equity. It excludes fund fees, carry, management dilution, and sponsor-specific waterfalls.
| Case | Exit multiple | Year-five IRR / MOIC | Year-six IRR / MOIC | Year-seven IRR / MOIC |
|---|---|---|---|---|
| Low | 12× | −4.5% / 0.79× | −2.3% / 0.87× | −0.7% / 0.95× |
| Base | 16× | 13.2% / 1.86× | 12.4% / 2.01× | 11.7% / 2.17× |
| High | 18× | 23.1% / 2.82× | 20.3% / 3.03× | 18.3% / 3.24× |
Low returns require refinancing beginning in year three. Base’s year-seven return requires resolution of the secured-note timing gap. The results depend on those financing assumptions.
In year five, the base has $9.041 billion of debt and $4.745 billion of forward proxy profit. A 16× valuation produces approximately $75.914 billion enterprise value and $67.114 billion net equity proceeds. At the same cash generation, a 12× exit yields only a 6.0% IRR. Deleveraging alone does not offset a substantial valuation contraction.
| Base exit multiple | 5-year IRR | 6-year IRR | 7-year IRR | 5-year MOIC | 6-year MOIC | 7-year MOIC |
|---|---|---|---|---|---|---|
| 10× | 1.5% | 3.1% | 4.2% | 1.08× | 1.20× | 1.33× |
| 12× | 6.0% | 6.6% | 7.1% | 1.34× | 1.47× | 1.61× |
| 14× | 9.8% | 9.7% | 9.5% | 1.60× | 1.74× | 1.89× |
| 16× | 13.2% | 12.4% | 11.7% | 1.86× | 2.01× | 2.17× |
| 18× | 16.2% | 14.7% | 13.7% | 2.12× | 2.28× | 2.46× |
| 20× | 18.9% | 16.9% | 15.5% | 2.38× | 2.55× | 2.74× |
| 22× | 21.4% | 18.9% | 17.1% | 2.64× | 2.82× | 3.02× |
| 24× | 23.7% | 20.7% | 18.6% | 2.90× | 3.09× | 3.30× |
A longer hold increases money returned but can reduce annualized return. Here the early profit step is followed by slower extension growth. Waiting seven years does not cure an insufficient five-year investment thesis; the required equity value compounds at the target return throughout the additional holding period.
The valuation denominator is consequential. At year five, 16× the before-compensation proxy measure is approximately 18.8× profit after cash compensation. Calling it simply “16× EBITDA” obscures the cash cost being excluded. A lower-cost future incentive scheme might increase distributable cash, but issuing private equity instead introduces dilution that must appear somewhere in sponsor returns.
Single-variable checks show the relative importance of the assumptions. Raising floating rates by 200bp reduces the base five-year IRR to about 12.9%. Raising cash compensation 20% produces about 13.0%. Even removing all modeled replacement cash compensation while leaving the before-SBC exit metric unchanged produces only 14.2%. The last case sets compensation to zero as an upper bound. The purchase price and terminal valuation remain the larger return constraints.
8. What would be needed for a 20% return?
A 20% annual return requires 2.488× equity in five years, 2.986× in six, and 3.583× in seven. The five-year base therefore needs approximately $89.872 billion exit equity, versus $67.114 billion modeled: a $22.758 billion gap.
The workbook solves for an additional permanent annual pretax saving, realized at 25% in year one, 60% in year two, and fully thereafter. Each dollar contributes through after-tax cash generation and the exit value of the higher recurring profit. To keep the threshold transparent, the main calculation does not credit additional interest savings from faster deleveraging. No incremental implementation or restructuring charge, or savings-related revenue loss, is modeled; including either would increase the required saving. The buyer’s ability to achieve the cost savings remains uncertain.
| Holding period | Additional annual savings at 16× exit | Exit multiple required with no extra savings |
|---|---|---|
| Five years | $1.205bn | 20.84× |
| Six years | $1.789bn | 23.21× |
| Seven years | $2.486bn | 26.01× |
An independent solution through the full debt model, including the interest benefit of accelerated repayment, reduces the five-year requirement to $1.185 billion. That puts the estimated savings hurdle at about $1.2 billion annually.
The scale is demanding: $1.205 billion is about 15% of FY2026 bookings and 43% of FY2026 R&D expense. The ratios show how large the requirement is relative to EA’s bookings and development expense. At a 60% incremental contribution margin, the same recurring profit would require roughly $2.0 billion of extra annual bookings, before considering additional development, marketing, and working-capital needs. Cutting a project may save money while also removing a source of future bookings; a credible plan must measure both.
The requirement is additional to the margins already in management’s forecast. Costs management already intended to remove cannot be counted again as sponsor-created upside. Nor does a temporary release delay create a permanent saving that should be capitalized into the exit multiple.
The closing buyer statements emphasize long-term investment and growth, while EA’s October announcement gives concrete portfolio actions. Neither cited communication provides a numerical $1.2 billion savings commitment or a 20% sponsor hurdle. The analysis therefore identifies the economics required by an analyst-selected target; it does not accuse the buyers of missing a promise they did not make.buyer, portfolio
9. Comparison with major historical buyouts
Large transaction values conceal differences in cash flow, asset backing, and accounting. Each deal uses its own definition of “entry EBITDA”.
| Transaction | Debt-inclusive headline value | Debt used | Earnings denominator | Debt / earnings | Value / earnings |
|---|---|---|---|---|---|
| HCA, 2006 | $33.0bn | $27.833bn | $4.469bn FY2006 company adjusted EBITDA | 6.23× | 7.38× |
| TXU, 2007 | $49.0bn | $40.189bn | $5.235bn LTM June 2007 pro-forma adjusted EBITDA | 7.68× | 9.36× |
| Hilton, 2007 | $26.0bn | $21.737bn | $1.605bn FY2006 continuing operating EBITDA | 13.54× | 16.20× |
| EA, proxy FY2027 basis | $55.0bn | $17.980bn | $3.003bn proxy adjusted EBITDA | 5.99× | 18.32× |
| EA, same basis after compensation | $55.0bn | $17.980bn | $2.323bn after $680m cash compensation | 7.74× | 23.68× |
HCA’s denominator includes part of the post-acquisition period and company adjustments. TXU’s closing presentation uses $49 billion, up from the initial $45 billion headline; its debt includes $2.15 billion associated with plants not yet in service and consolidates ring-fenced Oncor. Hilton’s denominator adds depreciation to continuing operating income. These limitations appear beside the spreadsheet inputs.hca, txu, hilton
EA carries less funded debt relative to the headline purchase value than these older examples, so the sponsor equity requirement is larger. On a before-compensation proxy basis, its leverage looks moderate within this group. After compensation, the debt burden is closer to TXU’s illustrated ratio, while the purchase valuation is substantially richer. This does not imply the same credit outcome: hospitals, utilities, hotels, and games have different operating and asset risks.
EA’s challenge is therefore not simply the biggest possible debt load. It is earning an attractive equity return after paying a high valuation for cash flows that require continuing development, licensing, marketing, and employee incentives. A wide equity cushion can protect lenders while still leaving sponsor returns below a demanding hurdle.
10. Evidence that would change the result
The next valuable evidence is specific:
- A final funds-flow statement and capitalization table. These would replace pre-closing shares and cash, settle transaction expenses and the defeasance cost, and reveal sponsor cash subscriptions. They could shift the return denominator and permit sponsor-level returns.
- Executed credit agreements and complete indentures. The agreements would specify amortization, mandatory sweeps, call economics and refinancing requirements. They would also give the covenant definitions and testing triggers, add-back caps, restricted-payment baskets and guarantees. Legal covenant headroom remains UNKNOWN without them.
- A post-close operating plan reconciled to the proxy. Franchise bookings, release dates, live-service retention, and the October portfolio decisions would show whether the FY2028 step survives. A fresh top-line target alone would not resolve cash conversion.
- A compensation and restructuring cash schedule. This would distinguish converted awards running off from recurring replacement compensation, management dilution, severance, and genuine ongoing savings. The perpetual $680 million starting assumption could then be changed coherently.
- Tax, FX, hedging, and monthly liquidity information. These could materially alter the timing of cash available for debt reduction, especially around release dates and the July 2033 notes maturity.
Three independent checks support the principal findings. Funded principal was rebuilt from the closing tranche disclosure and reconciled to counsel’s aggregate; lender holdings independently cross-check loan pricing and maturity observations. The compensation treatment was checked against historical cash flow, the proxy cash-flow bridge, and the rating analysis. Base returns and the savings hurdle were independently reconstructed outside the workbook; the model equations and live spreadsheet calculations agree to rounding.
The practical underwriting decision is clear. The management-forecast-based reconstruction supports a low-teens modeled equity return at a 16× exit, with improving annual debt coverage. A 20% return requires a substantial additional operating gain, a higher exit valuation, or a lower economic entry basis. The October portfolio changes make a refreshed plan more urgent, but do not yet provide the quantified evidence needed to choose among those paths.
Sources and audit notes
All sources accessed 12 November 2026. Page references are printed document pages unless otherwise specified. The raw-data package and workbook Evidence sheet contain observation-level source IDs, URLs, dates, periods, and locators. The workbook labels calculations, scenario assumptions and issuer facts. The following are the principal references used in this manuscript.
- Electronic Arts, Form 8-K, filed 4 August 2026, introductory note and Items 1.01, 2.01, 7.01; pp.1–5. Period: acquisition closing, 4 August 2026. Debt principal, coupons, maturity dates, consideration, and defeasance disclosure. ↩
- Kirkland & Ellis, closing announcement, 5 August 2026, financing paragraph; and financing announcement, 9 April 2026, financing list. Periods: final closing and pre-closing financing respectively. April TLA splits and tenors are not mislabeled as a reproduced final agreement. ↩
- Electronic Arts, Form 15-12G, 14 August 2026, p.1, classes covered and holder footnote. Period: post-merger deregistration/reporting suspension notice. ↩
- Electronic Arts, Form 10-Q filed 3 August 2026, cover; pp.3–8; Notes 8, 11, 14; MD&A bookings reconciliation. Period: quarter labeled 30 June 2026; exact cover share count as of 29 July. The fiscal quarter ended 4 July under EA’s reporting calendar. ↩
- SEC, EA submissions metadata, CIK 0000712515,
filings.recentform, filingDate, reportDate, and primaryDocument fields. Period: current metadata downloaded 12 November 2026; The search covers public metadata. ↩ - European Central Bank, USD/euro reference-rate calendar, August 2026 calendar, day 4: 1.1515. Period: 4 August 2026 reference rate. ↩
- Invesco Senior Income Trust, N-CSRS filed 6 November 2026, Consolidated Schedule of Investments p.12, Oak-Eagle row. Period: investments at 31 August 2026; USD TLB rate, spread, and maturity. ↩
- Vanguard Core-Plus Bond Fund, investment schedule filed 28 August 2026, Oak Eagle TLB1/TLB2 rows. Period: 30 June 2026 holdings; floating-rate spread observations. ↩
- Oak-Eagle AcquireCo, Offer to Purchase and Consent Solicitation Statement, 10 February 2026, printed p.7, PDF page 16, “The Financing.” Period: preliminary February financing commitments; $1.5bn cash-flow backstop and conditional funding purpose. ↩
- Public Investment Fund, Schedule 13D/A filed 5 August 2026, Items 4–5 narrative. Period: 4 August rollover; 24,807,932 shares and approximately $5.21bn value. SEC filing read in native XML and its rendered version. ↩
- Electronic Arts, DEFM14A, 20 November 2025, merger history pp.31–35; forecasts pp.40–41 and footnotes; fairness analyses pp.42–49; equity-financing discussion and Annex B. Period: 2025 transaction process and September 2025 forecasts for FY2026–FY2031. ↩
- Electronic Arts, DEFA14A supplemental disclosure, 15 December 2025, amended Financial Forecasts table and footnotes, supplementing proxy p.40. Period: same FY2026–FY2031 management forecast; additional tax, depreciation, and working-capital disclosure. ↩
- European Commission, Case M.12213 PIF / Electronic Arts, decision 22 July 2026, p.3, paragraph 7. Period: proposed ownership/control at merger clearance; public version contains redactions. ↩
- Oak-Eagle AcquireCo, final tender results and settlement announcement, 4 August 2026, results table and following defeasance paragraph. Period: July 30 expiration and August 4 settlement. Issuer release distributed by PR Newswire. ↩
- Public court-docket metadata, Electronic Arts Inc. v. U.S. Bank Trust Company, National Association, SDNY 1:26-cv-09623, entry 1, complaint filed 3 November 2026; feed updated 6 November. Filing metadata corroborated by Justia docket. Period: case filing; complaint text and merits not retrieved. ↩
- Electronic Arts, FY2026 Form 10-K filed 11 May 2026, bookings p.22; revenue disaggregation p.26; financial statements pp.36–39; policies pp.43–48; property/software and intangible notes pp.56–58; commitments and stock-compensation notes. Periods: fiscal years ended March 2024–2026; balances March 2025–2026. ↩
- Electronic Arts, Q4 and FY2026 earnings release, 5 May 2026, Fiscal Year Financial Highlights, annual statements of operations and cash flows. Periods: FY2026 and FY2025; independent cross-check against the subsequently filed 10-K. ↩
- Electronic Arts, FY2025 Form 10-K filed 13 May 2025, bookings p.21 and financial statements pp.35–38. Periods: fiscal years ended March 2023–2025; overlapping observations cross-check the FY2026 filing. ↩
- Electronic Arts, FY2023 Form 10-K, 24 May 2023, p.23, and FY2024 Form 10-K, 22 May 2024, p.22, MD&A net-bookings tables. Periods: FY2023 and FY2024 bookings and their GAAP revenue bridges. ↩
- Electronic Arts, Q2 FY2025 earnings release, 29 October 2024, full-year outlook. Period: original FY2025 guidance of $7.5–$7.8bn bookings. ↩
- Electronic Arts, preliminary Q3 FY2025 release, 22 January 2025, business update and full-year outlook. Period: revised FY2025 bookings guidance and title commentary. ↩
- S&P Global Ratings, Oak-Eagle preliminary issuer analysis, 16 March 2026, Key Metrics, Liquidity, and Credit Highlights. Period: forecasts for FY2027/FY2028 under March financing assumptions. Public article content read from its ordinary HTML response; no subscription access used. ↩
- Electronic Arts / consortium, completion announcement, 4 August 2026, published by Silver Lake, transaction details and buyer/company statements. Period: closing strategy statements; no numerical savings or 20% IRR commitment identified. ↩
- Electronic Arts, “Building EA’s Next Chapter,” 21 October 2026, “Our Portfolio Choices.” Period: post-close portfolio and organizational decisions. No quantified cost savings or restructuring cash budget supplied. ↩
- Electronic Arts, Madden NFL Virtual Stadium Sponsorship Program, 27 October 2026, opening announcement and Key Program Highlights. Period: 2026 sponsorship initiative. No financial forecast supplied. ↩
- HCA, S-4 filed 1 August 2007, pp.10–11, acquisition sources and uses; FY2006 results, 6 February 2007, adjusted-EBITDA reconciliation; merger announcement, 24 July 2006. Periods: November 2006 closing capitalization and full FY2006 earnings. ↩
- TXU / Energy Future Holdings, closing financing presentation filed 15 October 2007, slides 1, 3, 5. Periods: October 2007 transaction and pro-forma June 2007 capitalization / LTM earnings. ↩
- Hilton, September 30, 2007 pro-forma financial statements, pro-forma balance sheet, FY2006 statement of operations, and Note 1; closing release, 24 October 2007. Periods: acquisition capitalization and restated FY2006 continuing operations. Primary PDF downloaded and read directly. ↩
Supporting material
- Excel model ↗Sourced inputs, live calculations and reported outputs.
- Source and model data (CSV collection) ↗Data tables, source references and calculation exports.
- 12 source register ↗Download as CSV.