Financial systems
What AT&T’s media detour cost shareholders
At an 8% return hurdle, the DirecTV and Time Warner round trips cost a modeled $8.77 per year-end 2014 AT&T share.
For sulayman-bowles.dev. Research cutoff: November 12, 2026. Dollars are nominal US dollars unless explicitly described as present values. Figures in tables are rounded; calculations use the accompanying model’s unrounded inputs.
The strongest answer is an opportunity cost: approximately $8.77 per AT&T share outstanding at the end of 2014. The base model values the two media round trips at an 8% annual return requirement and puts their combined shortfall at $45.5 billion, measured at December 31, 2014. The shortfall measures the deals against the stated return hurdle. DirecTV contributes approximately $25.9 billion, or $4.99 per 2014 share; Time Warner/WarnerMedia contributes $19.6 billion, or $3.78 per 2014 share.
Three numbers explain the result. AT&T committed $163.5 billion of enterprise capital: cash, shares and assumed debt, less acquired cash. The original Warner Bros. Discovery distribution ultimately delivered $7.50 in cash for each AT&T share entitled to the April 2022 distribution, assuming its recipient kept the distributed shares until WBD’s completed October 2026 cash acquisition. And the dated cash-and-value recovery ledger falls $45.5 billion short of an 8% return. Acquisition filings, the WBD cashout filing and an independent exchange notice corroborate those headline inputs.dtv-final, tw-final, tw-ev, wbd-cashout, nasdaq
The narrower nominal result is much smaller. After estimated operating cash, disposals, distributions, the WBD cashout and a $6.97 billion estimated funding charge, the combined base shortfall is $4.44 billion, or $0.63 per year-end 2025 AT&T share. Plausible operating-cash scenarios produce $0.7–$8.2 billion. On that later share base, DirecTV accounts for an estimated $1.59 nominal cost and Warner for a $0.96 nominal surplus. The estimates depend on the transaction scope and incomplete financing records. It should never be added to the $45.5 billion present-value figure.
DirecTV failed to recover its modeled capital even before requiring a positive return. WarnerMedia eventually recovered more nominal dollars than its purchase capital, helped materially by WBD’s 2026 cashout, but the money arrived too late to earn an adequate return in this model. The case against the detour is strongest when expressed as capital tied up for years at poor returns.
1. The starting bill was $163.5 billion, with $69.3 billion paid in stock
Announcement values are useful descriptions of negotiations. Closing values are the appropriate starting point for this reconstruction. DirecTV’s announced $48.5 billion equity value and $67.1 billion transaction value changed before its July 24, 2015 closing. Time Warner’s October 2016 announcement quoted $85.4 billion for equity and $108.7 billion including debt; the June 14, 2018 closing occurred at a different AT&T share price.dtv-announcement, tw-announcement
| Closing capital, $ billion | DirecTV, July 2015 | Time Warner, June 2018 | Combined |
|---|---|---|---|
| Cash consideration | 14.378 | 42.100 | 56.478 |
| AT&T shares issued, closing value | 32.727 | 36.599 | 69.326 |
| Awards, other consideration and preheld interest | 0.304 | 0.659 | 0.963 |
| Equity purchase consideration | 47.409 | 79.358 | 126.767 |
| Assumed debt | 20.585 | 22.865 | 43.450 |
| Less acquired cash | (4.797) | (1.889) | (6.686) |
| Enterprise capital committed | 63.197 | 100.334 | 163.531 |
Source: finalized acquisition accounting. DirecTV’s debt includes the obligations in its purchase-price allocation; Warner’s $22.865 billion combines current and long-term debt. The $100.334 billion Warner total also appears independently in AT&T’s 2019 pro forma filing.dtv-final, tw-final, tw-ev
Stock was a real cost. AT&T issued approximately 954.4 million shares for DirecTV and 1,125.5 million for Time Warner. Those shares gave the sellers continuing claims on AT&T’s connectivity businesses. Treating them as free financing would omit $69.3 billion of consideration and much of the dilution.dtv-2015, tw-close
Debt also needs careful treatment. AT&T’s May 2015 bond tranches totaled $17.5 billion. That financing belongs in the funding history; it is not another $17.5 billion to add to the purchase price. The Time Warner announcement’s $40 billion bridge commitment subsequently became a $30 billion bridge and a $10 billion term facility. Drawn bridge advances had a 364-day maturity. The later mix included term borrowing and the redemption of acquisition-contingent notes when closing was delayed. Commitments, issuance, refinancing and purchase consideration describe different things.dtv-2015, tw-close
The financing overlay used here charges the $49.792 billion net cash consideration—$9.581 billion for DirecTV and $40.211 billion for Time Warner—at an assumed 4.4% borrowing rate, reduced by a 25% assumed tax benefit, during consolidated ownership. The rate is anchored to AT&T’s disclosed debt cost, with the precise transaction-specific rate unavailable. It produces $1.90 billion for DirecTV and $5.07 billion for Warner. Interest already embedded in operating cash is not charged again. Parent-level interest on refinanced inherited debt is not fully allocable from public segment disclosures, so the calculation covers only the financing expense that can be identified.tw-close
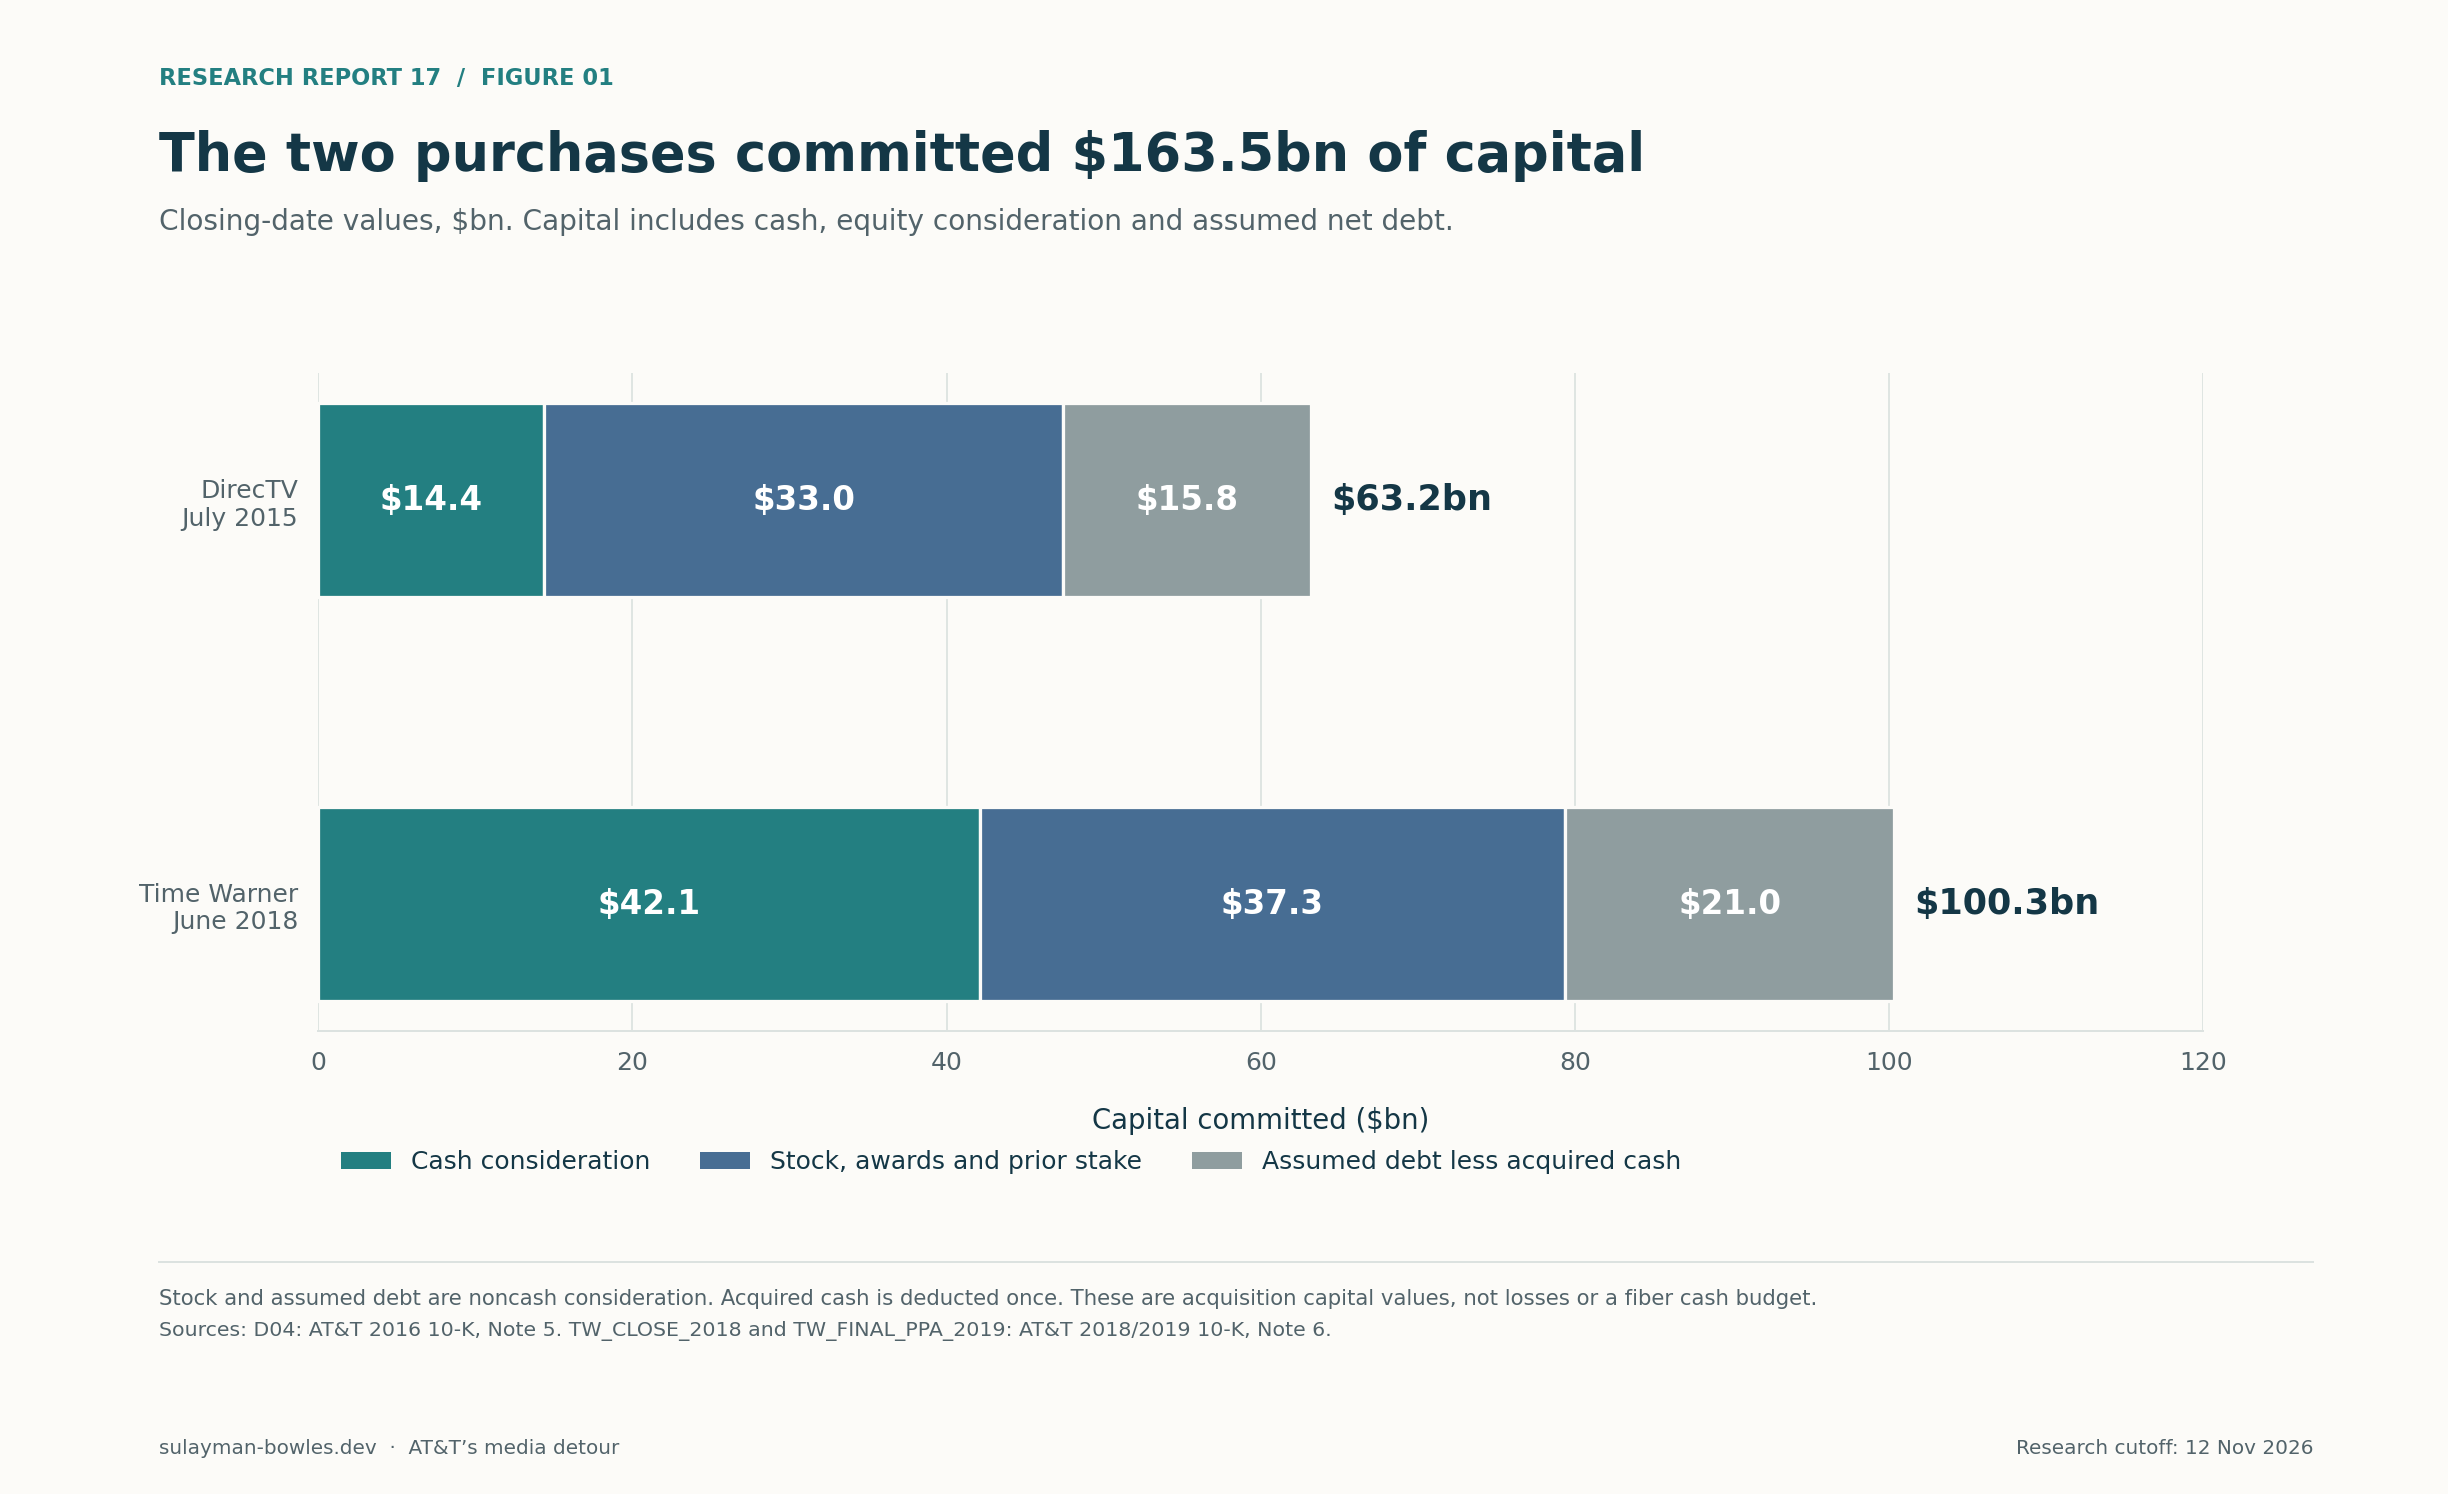
Figure 1 — $ billion at closing. Sources: AT&T’s finalized DirecTV and Time Warner purchase-price allocations; independent Warner enterprise-value reconciliation. Author calculations.dtv-final, tw-final, tw-ev
2. DirecTV returned substantial cash, but still did not recover its modeled cost
DirecTV’s later history is not captured by subtracting a sale headline from its acquisition headline. There were operating receipts, preferred distributions, debt-funded JV proceeds, an interest AT&T kept, a final sale and amounts still payable.
The largest early cash input is also a limitation: AT&T’s 2019 shareholder letter said DirecTV had generated approximately $22 billion of cash flow since acquisition. This is management’s cumulative attribution, with no audited annual cash-flow statement covering the originally acquired company. The model allocates it in proportion to owned days across 2015–2019, placing each annual receipt at year-end. For 2020 and January–July 2021, it assumes a $5 billion annual rate, with $4–$6 billion tested around it. The 2021 JV announcement described annual cash flow above $4 billion, providing a benchmark for the estimate.dtv-cash, dtv-jv
When the JV formed in July 2021, AT&T kept a 70% economic interest and TPG obtained 30%. TPG’s $1.8 billion investment came with preferred economics; the preferred terms prevent a simple common-equity valuation based on its 30% stake. The transferred US video business also included AT&T’s U-verse and other video operations. The original 2015 acquisition included Latin American assets and investments. These changing boundaries prevent a pristine original-DirecTV-only return calculation.dtv-jv, dtv-2023
| DirecTV recovery ledger, $ billion | Base value | Classification |
|---|---|---|
| Cash generation, acquisition through 2019 | 22.000 | Management cumulative attribution |
| Cash generation, 2020 | 5.000 | Estimate |
| Cash generation, January–July 2021 | 2.917 | Estimate |
| 2021 JV proceeds, net of cash conveyed | 7.170 | Reported corporate receipt |
| Debt relief when the JV formed | 0.195 | Reported noncash credit |
| Distributions: 2021 / 2022 / 2023 | 1.942 / 4.457 / 3.715 | Reported receipts |
| Distributions: 2024 / pre-sale 2025 | 2.955 / 1.926 | Reported receipts |
| NFL note repayments, 2021–2023 | (1.800) | Cash outflows |
| Allocated cash taxes, 2023–2025 | (1.689) | Company cash-tax allocationsfiber-2025 |
| Game Show Network sale, excluding presale dividend | 0.367 | Buyer-reported consideration, adjusted |
| Vrio receivable | 0.610 | Face-value credit; collection timing unverified |
| Remaining-stake sale receipts, 2025 / first quarter 2026 | 3.100 / 0.574 | Reported, with rounding |
| Contractual 2029 installments | 0.500 | Future, uncollected |
| Total modeled recovery | 53.939 | Mixed cash and explicitly identified value credits |
| Less closing enterprise capital | (63.197) | Acquisition cost |
| Nominal shortfall before funding overlay | 9.258 | Calculated |
Sources: AT&T’s ownership letter, JV announcement, annual investment notes, sale note disclosures and October 2026 filing; Sony’s purchase disclosure for Game Show Network. Cash-tax allocations for 2023–2025 come from AT&T’s supplemental cash-flow reconciliation. The recast 2023–2024 values use estimates; AT&T’s methodology disclosed a 24.6% assumed cash-tax rate, so these are not an independently traced standalone tax ledger.dtv-tax, dtv-cash, dtv-jv, dtv-2023, dtv-2024, dtv-2025, dtv-sale-note, latest, gsn, fiber-2025
Two double-counting traps materially change the answer. First, the $7.170 billion from forming the JV included a $1.8 billion NFL-related borrowing that AT&T later repaid. The repayments must reduce recovery. Second, the $7.6 billion expected package announced with the September 2024 agreement to sell the remaining stake included distributions beginning in the second half of 2024. It was not an additional $7.6 billion sale check. The stake sale closed July 2, 2025; receipts extended into 2026, with $500 million contractually scheduled for 2029.dtv-2023, dtv-sale-announcement, dtv-sale-note, latest
An independent package check combines $1.695 billion of second-half 2024 distributions, $1.926 billion in 2025 distributions, approximately $3.1 billion of 2025 sale receipts, $574 million received in 2026 and $500 million due in 2029, then deducts the identified $251 million 2025 tax allocation. The result, $7.544 billion, is consistent with the announced approximately $7.6 billion after allowing for rounding and timing. It is already represented in the ledger.
Realized JV proceeds, distributions and sale receipts through September 2026 total $25.839 billion gross, or $22.350 billion after the $1.8 billion NFL repayments and $1.689 billion of identified taxes. The ledger flags future and uncertain receipts. Vrio’s $610 million is a receivable valuation assumption. The sale price of the acquired Sky Mexico interest remains unvalued in the reviewed filings and receives no modeled credit; the retained interest remains unpriced in the model.dtv-2022, dtv-2024
Earlier distribution taxes, some transition costs and the exact allocation between acquired DirecTV and legacy AT&T video remain incomplete. A disclosed approximately $300 million NFL support commitment and approximately $200 million of 2021 costs AT&T kept also require care about payment dates and overlap. The base does not silently claim these uncertain allocations were zero. Its adjustable reserve is zero because a precise incremental cash charge remains unknown. The management cash-flow attribution could also overlap with part of the Game Show Network transaction; excluding its $367 million credit is a straightforward downside test.att-2021, gsn
The resulting capital-recovery IRR is −2.77%, and the financing-adjusted nominal shortfall is $11.16 billion. The IRR is a dated recovery measure built from the stated mixed inputs. It is not an audited equity or unlevered project IRR.
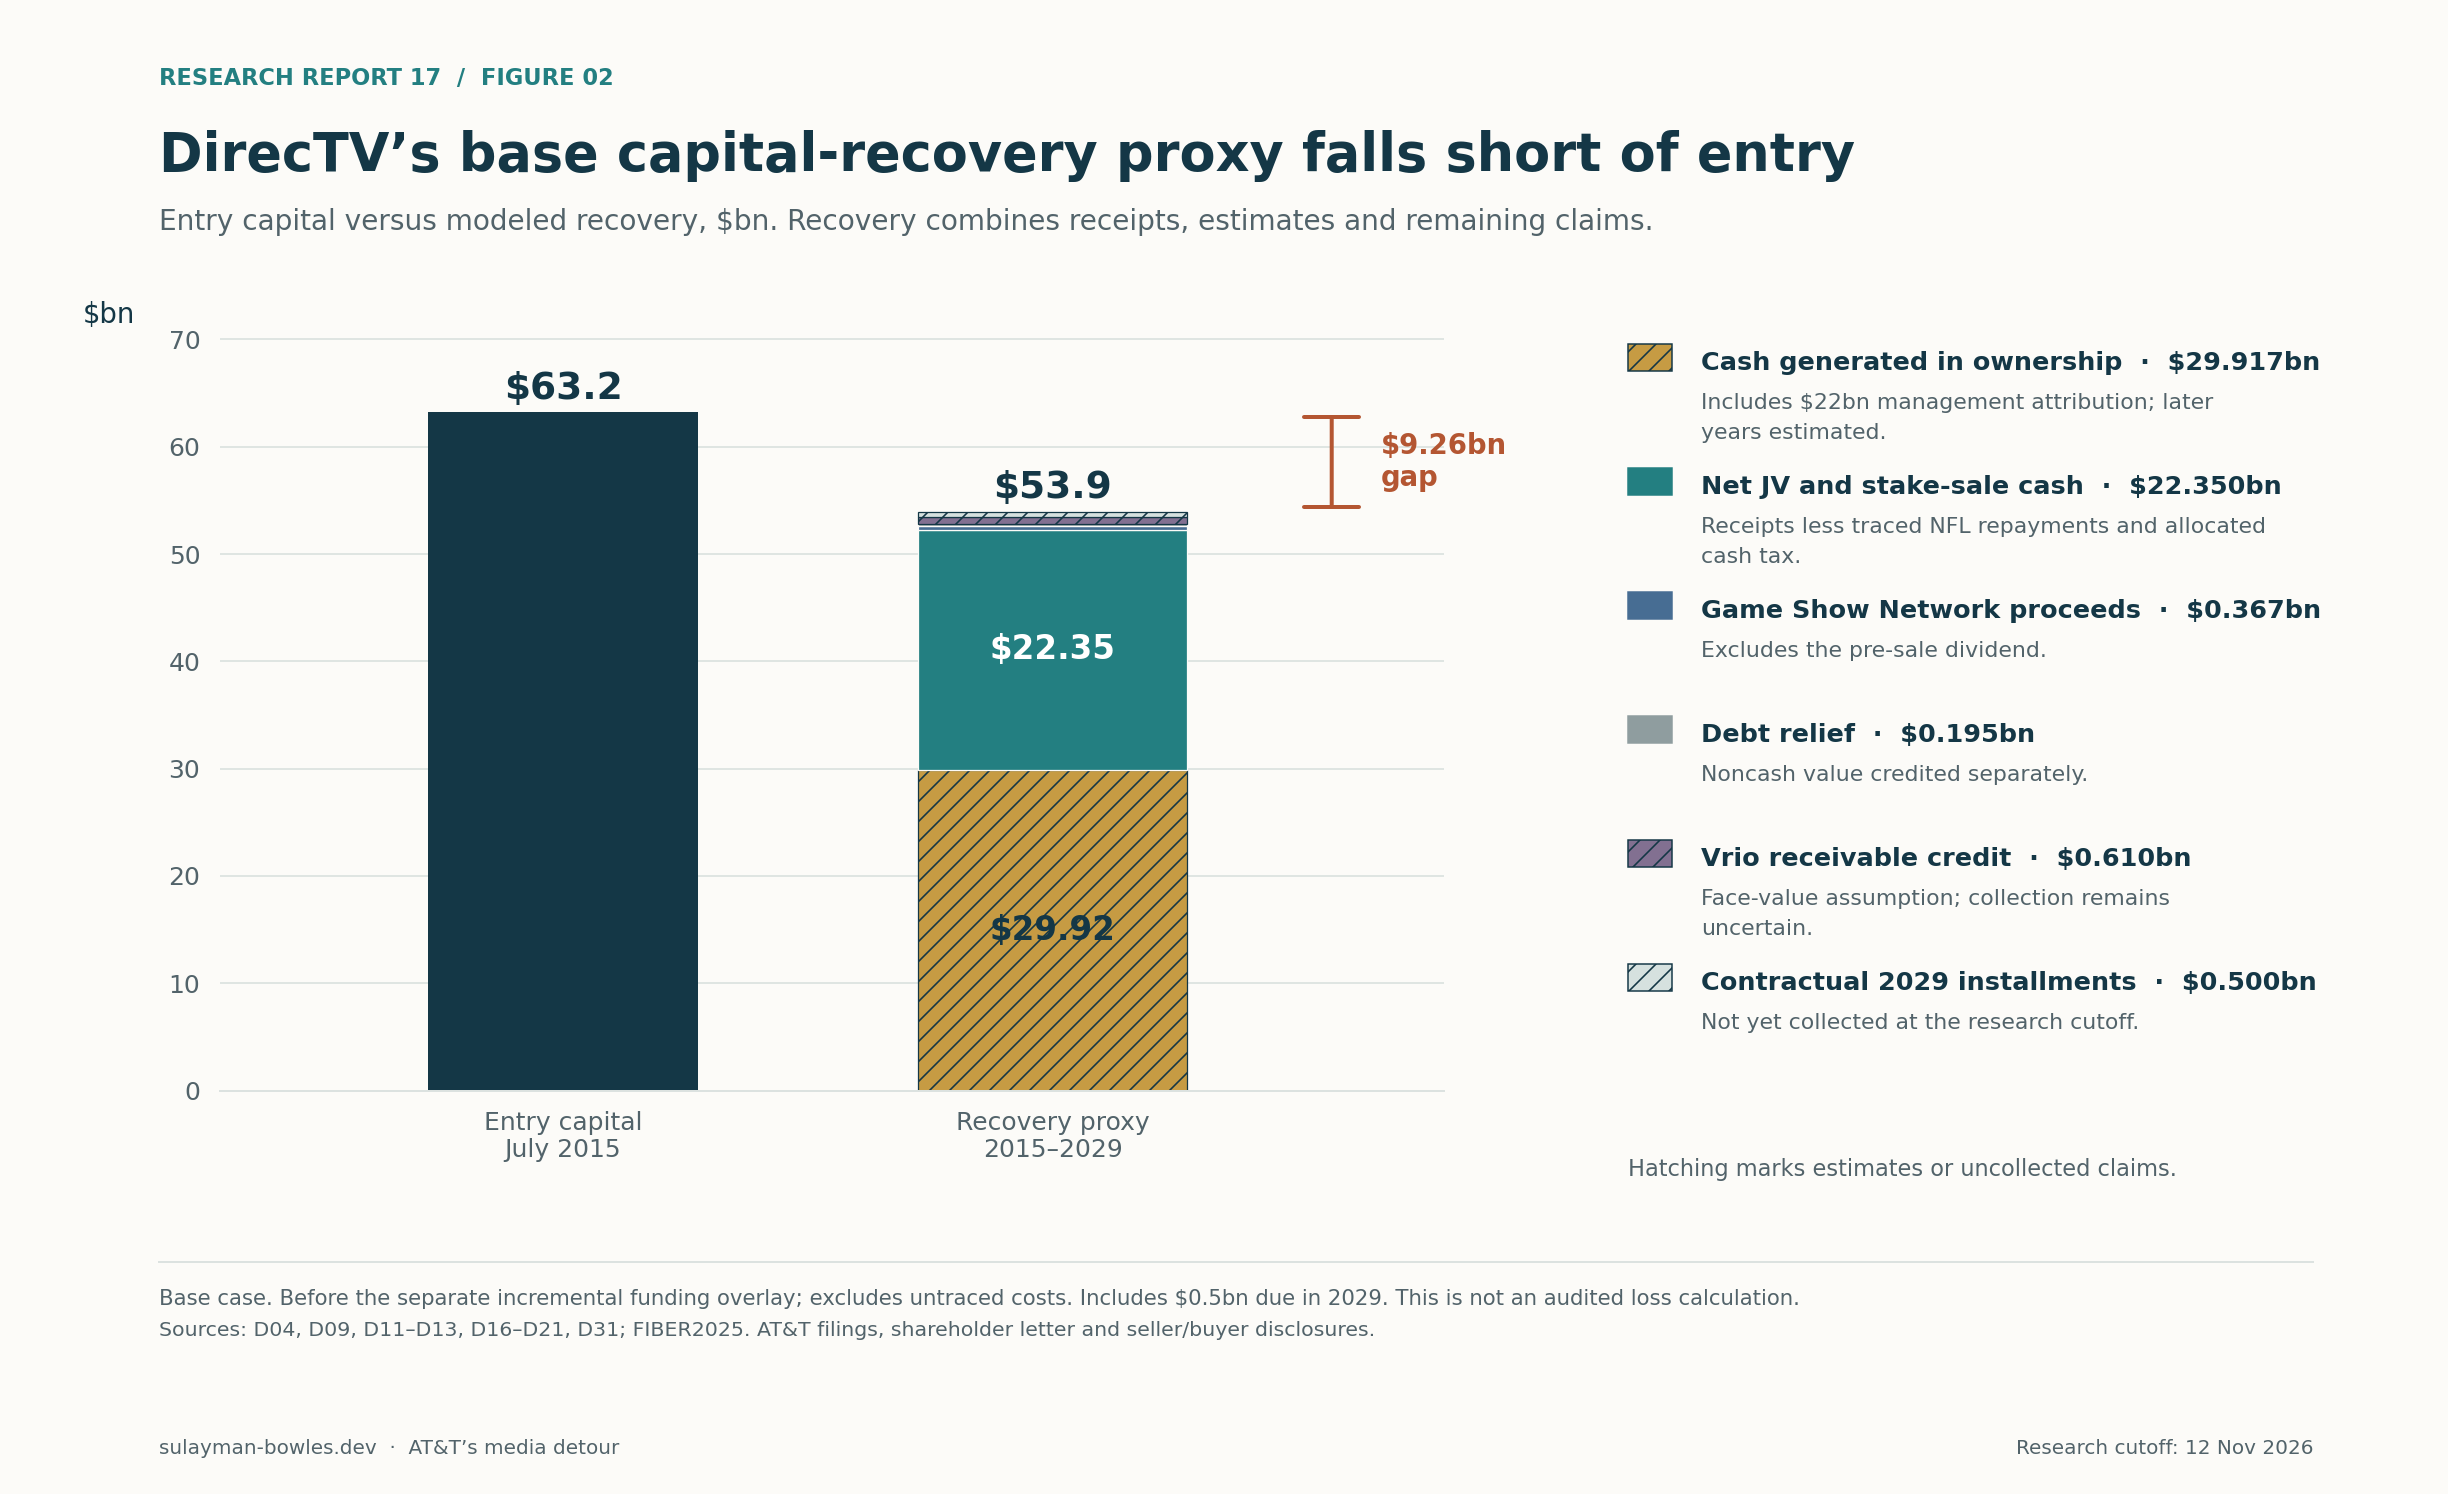
Figure 2 — $ billion. Distinguish reported receipts from operating estimates, debt relief, the Vrio valuation assumption and uncollected 2029 installments. Sources: ledger and cited acquisition, JV formation and sale filings.
3. WarnerMedia’s answer changed when WBD became cash in 2026
The Warner round trip has two recipients of value: AT&T itself and the shareholders who received WBD shares. They must be combined economically without confusing their bank accounts.
For operating cash, WarnerMedia’s audited carveout statements report the following. “Cash generation” here means operating cash less capital expenditure; it does not mean EBITDA, accounting profit or sustainable annual earning power.warner-carveout
| Ownership-period operating cash, $ billion | Operating cash | Capital expenditure | Cash generation used |
|---|---|---|---|
| Owned portion of 2018 | — | — | 2.432, estimated |
| 2019 | 8.883 | (0.675) | 8.208 |
| 2020 | 4.655 | (0.608) | 4.047 |
| 2021 | 3.243 | (0.769) | 2.474 |
| 2022 through spin-off | — | — | (3.000), estimated |
| Total | 14.161 |
The 2018 estimate takes Time Warner’s 2017 continuing operating cash of $5.094 billion less $656 million of capital expenditure and prorates the $4.438 billion result over 200 days. It is not represented as reported 2018 cash. The 2022 estimate recognizes that the first-quarter discontinued-business calculation was already approximately negative $2.078 billion, while the full-year discontinued operating-cash line was negative $3.789 billion before unidentified capital expenditure. The April stub and changes in business scope cannot be isolated perfectly. Assuming zero cash use before the spin would be unjustified.tw-2017, att-q122, att-q123, att-2022
The 2019–2021 carveout also contains $527 million of net investing cash beyond capital expenditure. Its boundary excludes Xandr, Crunchyroll, Chilevisión and Playdemic, while including some Otter operations. Cash pooling, receivables monetization and allocated expenses further limit comparison with the exact 2018 purchase perimeter. The model uses the disclosed carveout series as a proxy for the acquired business. It excludes Xandr sale proceeds, because Xandr was not part of the original Time Warner acquisition.warner-carveout
Disposals traced to specific acquired assets returned $5.981 billion gross: Hulu, $1.430 billion; Hudson Yards, $2.081 billion; CME, approximately $1.1 billion; and Playdemic, $1.37 billion. The small carveout investing rows do not contain those same receipts. Hudson Yards was a sale and leaseback: later lease costs belong in operating cash and the value of the business sold. Unidentified taxes, incremental property investment and transaction costs are not presumed absent.tw-final, att-2020, att-2022
The April 2022 spin-off requires a further reconciliation. AT&T reported $38.8 billion in cash and $1.6 billion of legacy debt that stayed with WarnerMedia, a $40.4 billion cash-and-debt package. For this enterprise-capital ledger, the consistent exit credit is instead $41.6 billion of debt conveyed less $2.660 billion of cash conveyed: $38.940 billion. The difference of $1.460 billion is a reconciliation of cash and debt, with no disclosed charge attached to it. Adding both the cash distribution and all the debt that funded it would count the monetization twice. AT&T’s subsequent $1.2 billion August 2022 payment to WBD is deducted as an additional cash outflow.att-2022
The shareholder side is now unusually concrete. This report uses one convention throughout: keep the approximately 1.732 billion WBD shares originally distributed, value that fixed block at the stated market price before cashout, and recognize its October 6, 2026 cash consideration afterward. The original ratio was 0.241917 WBD shares per entitled AT&T share. No later repurchases or changes in WBD’s shares outstanding alter the original block. WBD’s subsequent operating cash is not added to it.wbd-2022, wbd-cashout
| Fixed original WBD distribution | Price per WBD share | Value of original block, $bn | Value per entitled 2022 AT&T share |
|---|---|---|---|
| April 8, 2022 reference close | $24.43 | 42.313 | $5.91 |
| December 30, 2022 | $9.48 | 16.419 | $2.29 |
| December 29, 2023 | $11.38 | 19.710 | $2.75 |
| December 31, 2024 | $10.57 | 18.307 | $2.56 |
| December 31, 2025 | $28.82 | 49.916 | $6.97 |
| October 6, 2026 completed cashout | $31.01666668 | 53.721 | $7.50 |
Sources: WBD’s acquisition accounting, proxy price disclosures, completed-merger filing and Nasdaq corporate-action notice. The 1.732 billion share count is rounded in the filing. The initial calculated block differs from the reported $42.309 billion fair value by approximately $3.8 million, a difference attributable to the rounded share count. Values exclude personal taxes and fractional-share adjustments.wbd-2022, wbd-prices, wbd-cashout, nasdaq
The cashout under Skydance’s completed acquisition supersedes earlier standalone valuations and abandoned transaction or break-up plans. WBD paid no ordinary dividend during the modeled post-spin holding period. A shareholder who sold at the 2022 or 2024 trough had a different realized result; the convention here deliberately follows the original distribution through its terminal cash event.wbd-2025, wbd-cashout
The full Warner ledger therefore recovers $112.130 billion: $14.161 billion of operating-cash proxies, $0.527 billion other net investing cash, $5.981 billion of identified asset sales, $38.940 billion of net debt transfer, less the $1.2 billion true-up, plus $53.721 billion paid to the original WBD shareholders. Against $100.334 billion at entry, that is an $11.796 billion nominal surplus before the funding overlay, or $6.728 billion afterward. The capital-recovery IRR is only 2.05% because the final shareholder receipt came more than eight years after acquisition.
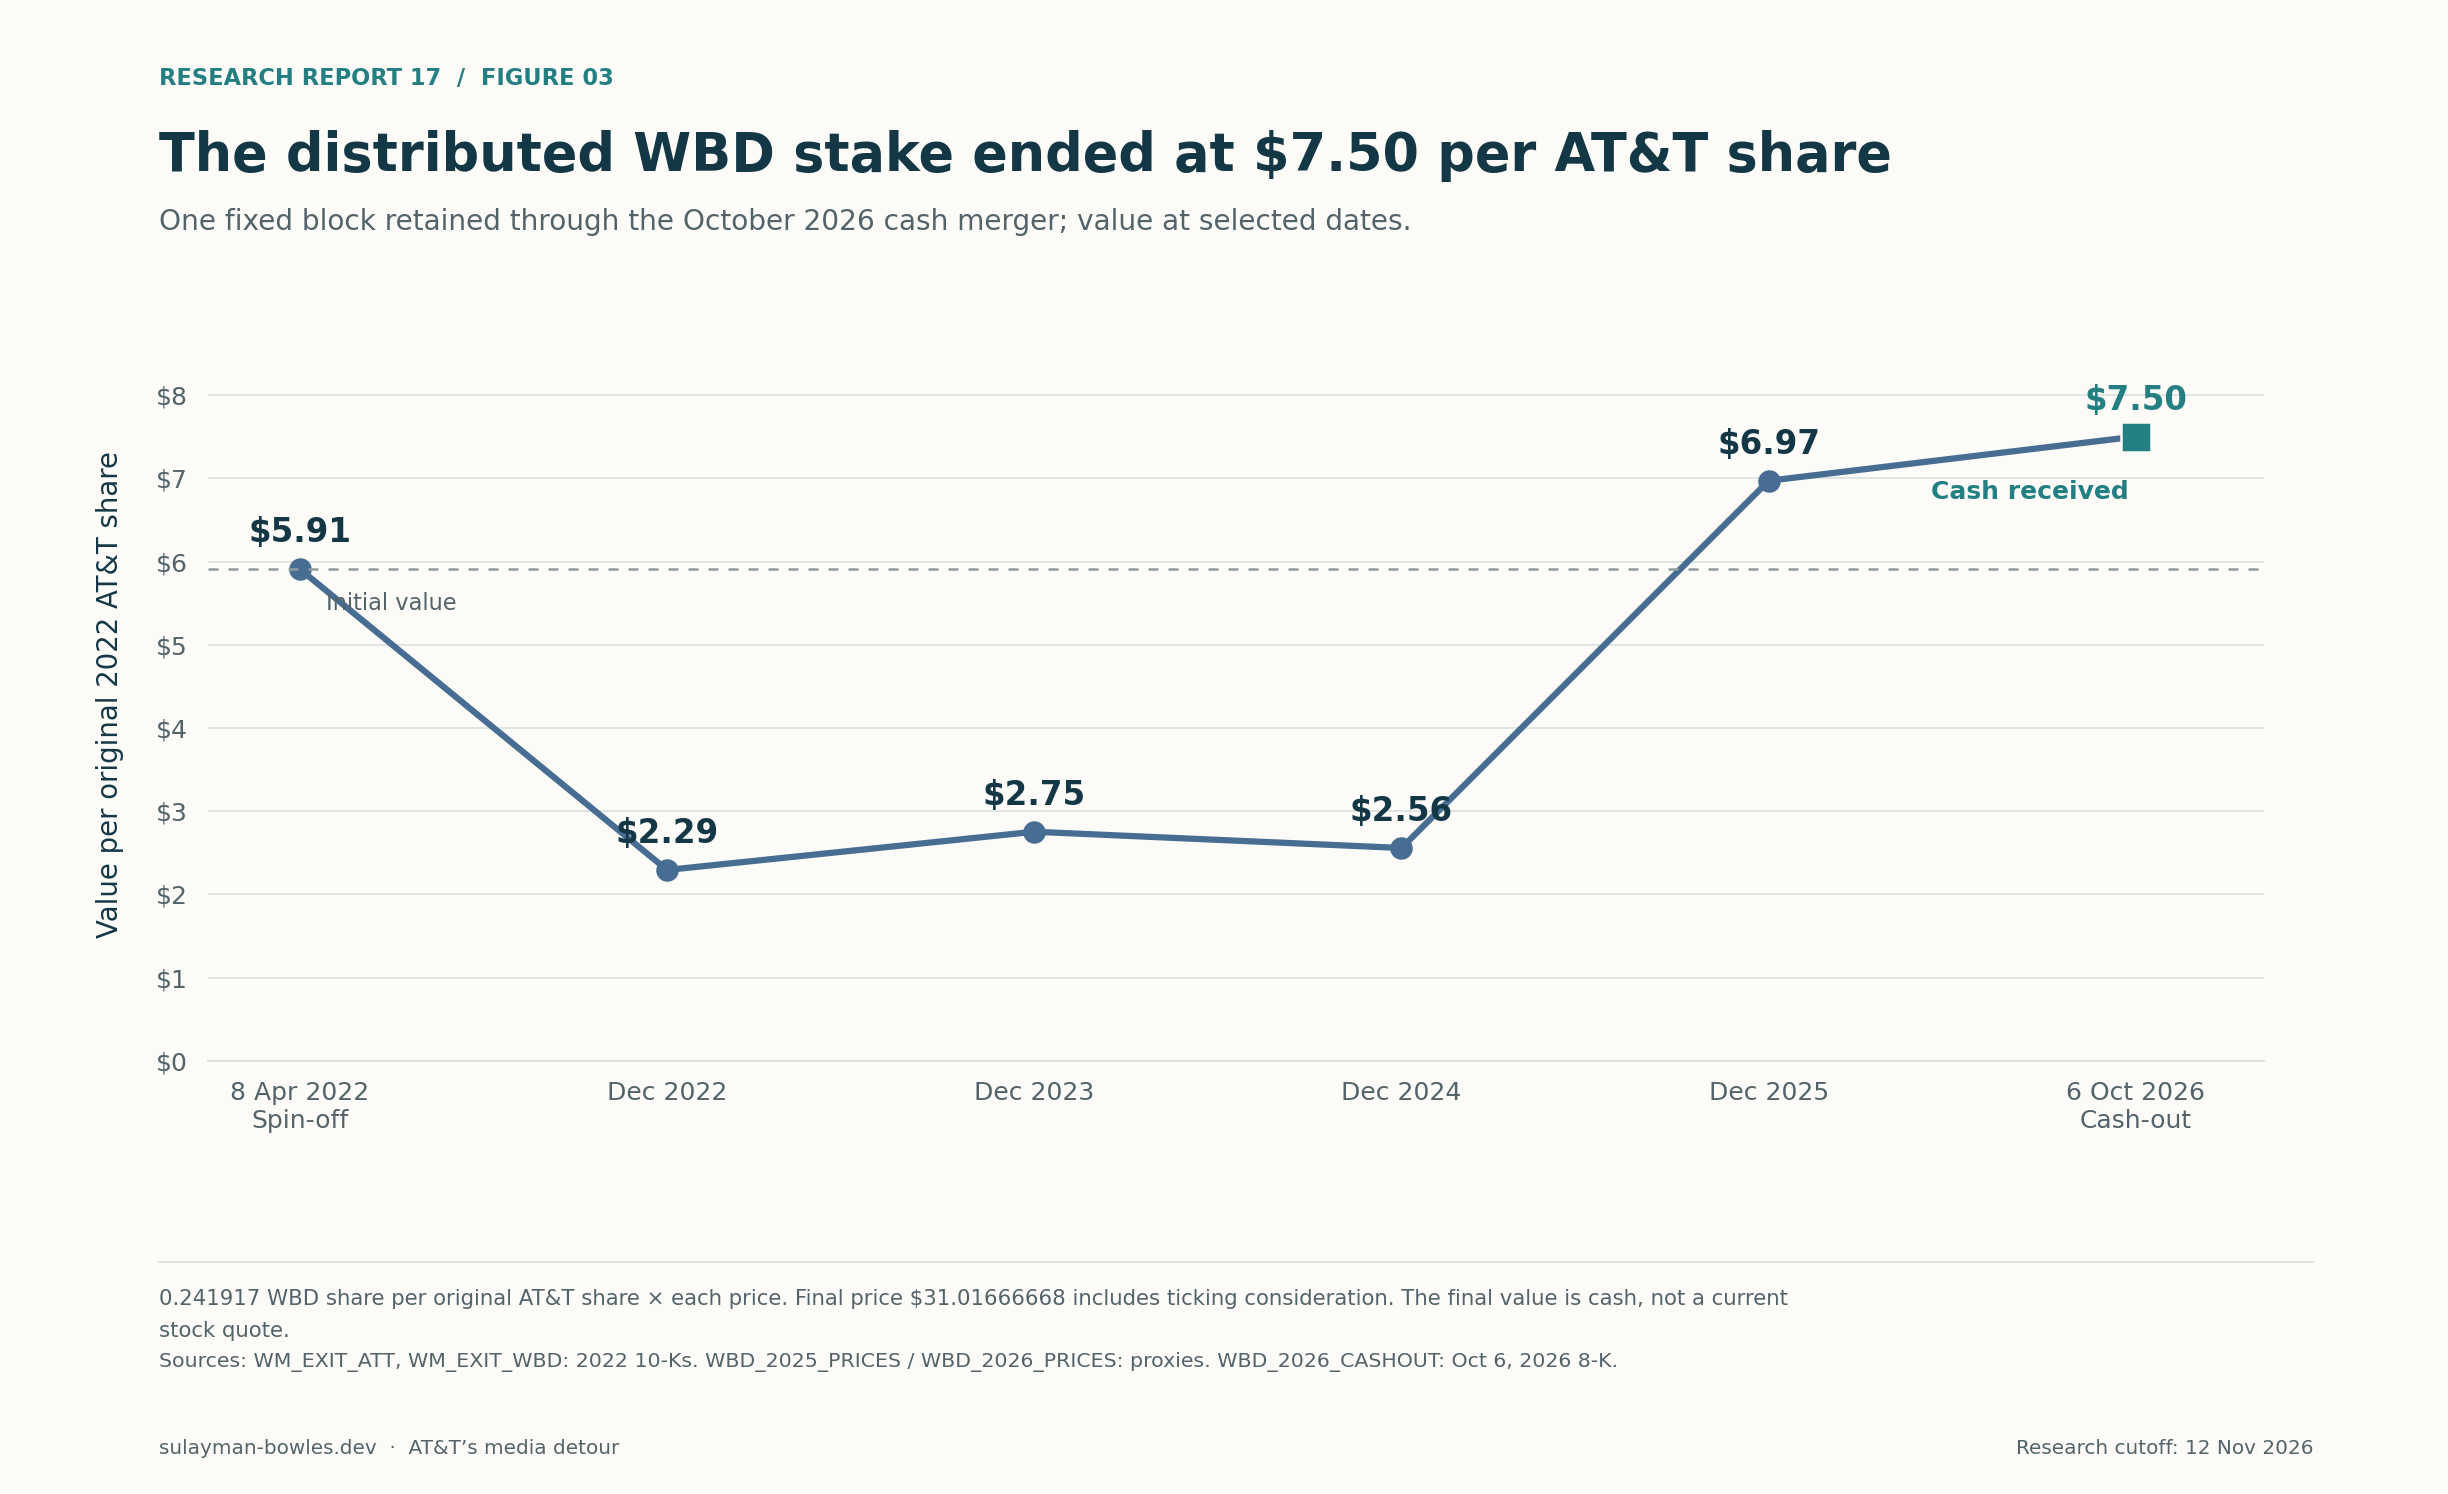
Figure 3 — Value per original AT&T share entitled to the 2022 distribution, using a fixed 0.241917-share WBD entitlement (April 2022 8-K) and the same approximately 1.732 billion-share block throughout. The terminal point is completed cash consideration; earlier points are market values. Sources: WBD filings and Nasdaq.wbd-2022, wbd-prices, wbd-cashout, nasdaq
4. The economic shortfall is large; the exact nominal loss is uncertain
The model asks two questions. First, how many nominal dollars of capital and value were recovered? Second, what would those dated recoveries be worth if capital needed to earn a stated annual return?
For the second question, every acquisition outlay and recovery is discounted to December 31, 2014, with transaction dates where known and stated year-end or quarter-end conventions otherwise. The model uses an 8% return hurdle throughout. The present-value shortfall is the negative sum of those discounted ledger entries. Dividing by the 5.186913 billion shares outstanding at year-end 2014 produces the opening $8.77 figure.att-2014 Nominal figures use the 7.037502 billion shares at year-end 2025, the latest completed fiscal year. The September 2026 share count is disclosed below. These per-share ratios measure capital-allocation magnitudes; they are not payments owed to individual holders.att-2025
The capital-recovery IRRs use the same dated ledger before the funding charge on new cash. Operating cash already includes some target interest, whereas the entry and exit include enterprise debt. Public data do not support complete unlevered adjustments or an exact equity contribution account. Calling these figures conventional acquisition IRRs would imply precision that the evidence does not provide.
| Combined scenario | Low estimated cost | Base | High estimated cost |
|---|---|---|---|
| DirecTV 2020 cash run rate, $bn | 6.0 | 5.0 | 4.0 |
| Warner 2018 cash proxy multiplier | 150% | 100% | 50% |
| Warner 2022 cash proxy, $bn | (2.078) | (3.000) | (4.000) |
| Nominal shortfall after funding, $bn | 0.714 | 4.435 | 8.235 |
| Per year-end 2025 AT&T share | $0.10 | $0.63 | $1.17 |
| 8% shortfall at December 2014, $bn | 43.090 | 45.492 | 47.938 |
| Per year-end 2014 AT&T share | $8.31 | $8.77 | $9.24 |
These scenarios vary identified operating-cash uncertainties. They are not statistical confidence intervals, and they do not pretend to bound every undisclosed cost. In the base case, the 8% shortfalls divide into $25.890 billion for DirecTV and $19.602 billion for Warner. Lowering the hurdle to 6% still leaves $37.634 billion, or $7.26 per 2014 share. At 10%, the result is $51.543 billion, or $9.94 per share. The nominal recovery conclusion is sensitive; the failure to earn a reasonable positive hurdle is more resistant to the modeled operating ranges.
The scope and financing sensitivities are also material. Reducing only the $25.839 billion of historical gross DirecTV JV receipts by 10% removes $2.584 billion from recovery, increasing the nominal cost by about $0.37 per 2025 share; the future 2029 note is unchanged. Giving the Vrio receivable no value adds approximately $0.09 per share. In the base operating case, changing the funding-rate assumption from 4.4% to 3.5% or 5.5% changes the nominal shortfall to $3.009 billion or $6.179 billion—approximately $0.43 or $0.88 per 2025 share. These amounts show how the model responds to lower terminal values.
Financing cannot be made exact by multiplying every assumed debt dollar by one coupon. Warner’s carveout reports $629 million of cash interest across 2019–2021, already inside operating cash. Its 2019 debt exchange moved substantial obligations to AT&T, so those target disclosures do not capture all subsequent parent interest. The statements also identify $389 million of cash redemption premiums and costs in financing activities. Those premiums appear outside the recovery calculation because opening assumed debt is already valued at fair value, so charging their full amount again requires a reconciliation against that entry value. An optional full-gross charge would add approximately $0.055 per 2025 share. The $6.97 billion overlay does not exhaust all financing charges.warner-carveout
Impairments receive the same discipline. AT&T’s major 2020 US-video impairments were $15.508 billion; Vrio added $2.212 billion in 2020 and $4.555 billion in 2021. The charges show lower expected value. The cash-flow model already counts purchase cost and realized recovery. Warner’s carveout also records noncash impairments. Conversely, AT&T’s approximately $5.6 billion 2025 DirecTV disposal gain included a roughly $2.9 billion tax-liability release, so it is not a $5.6 billion cash profit. AT&T’s large 2022 goodwill charge concerned AT&T’s continuing businesses.att-2020, dtv-2022, warner-carveout, dtv-sale-note
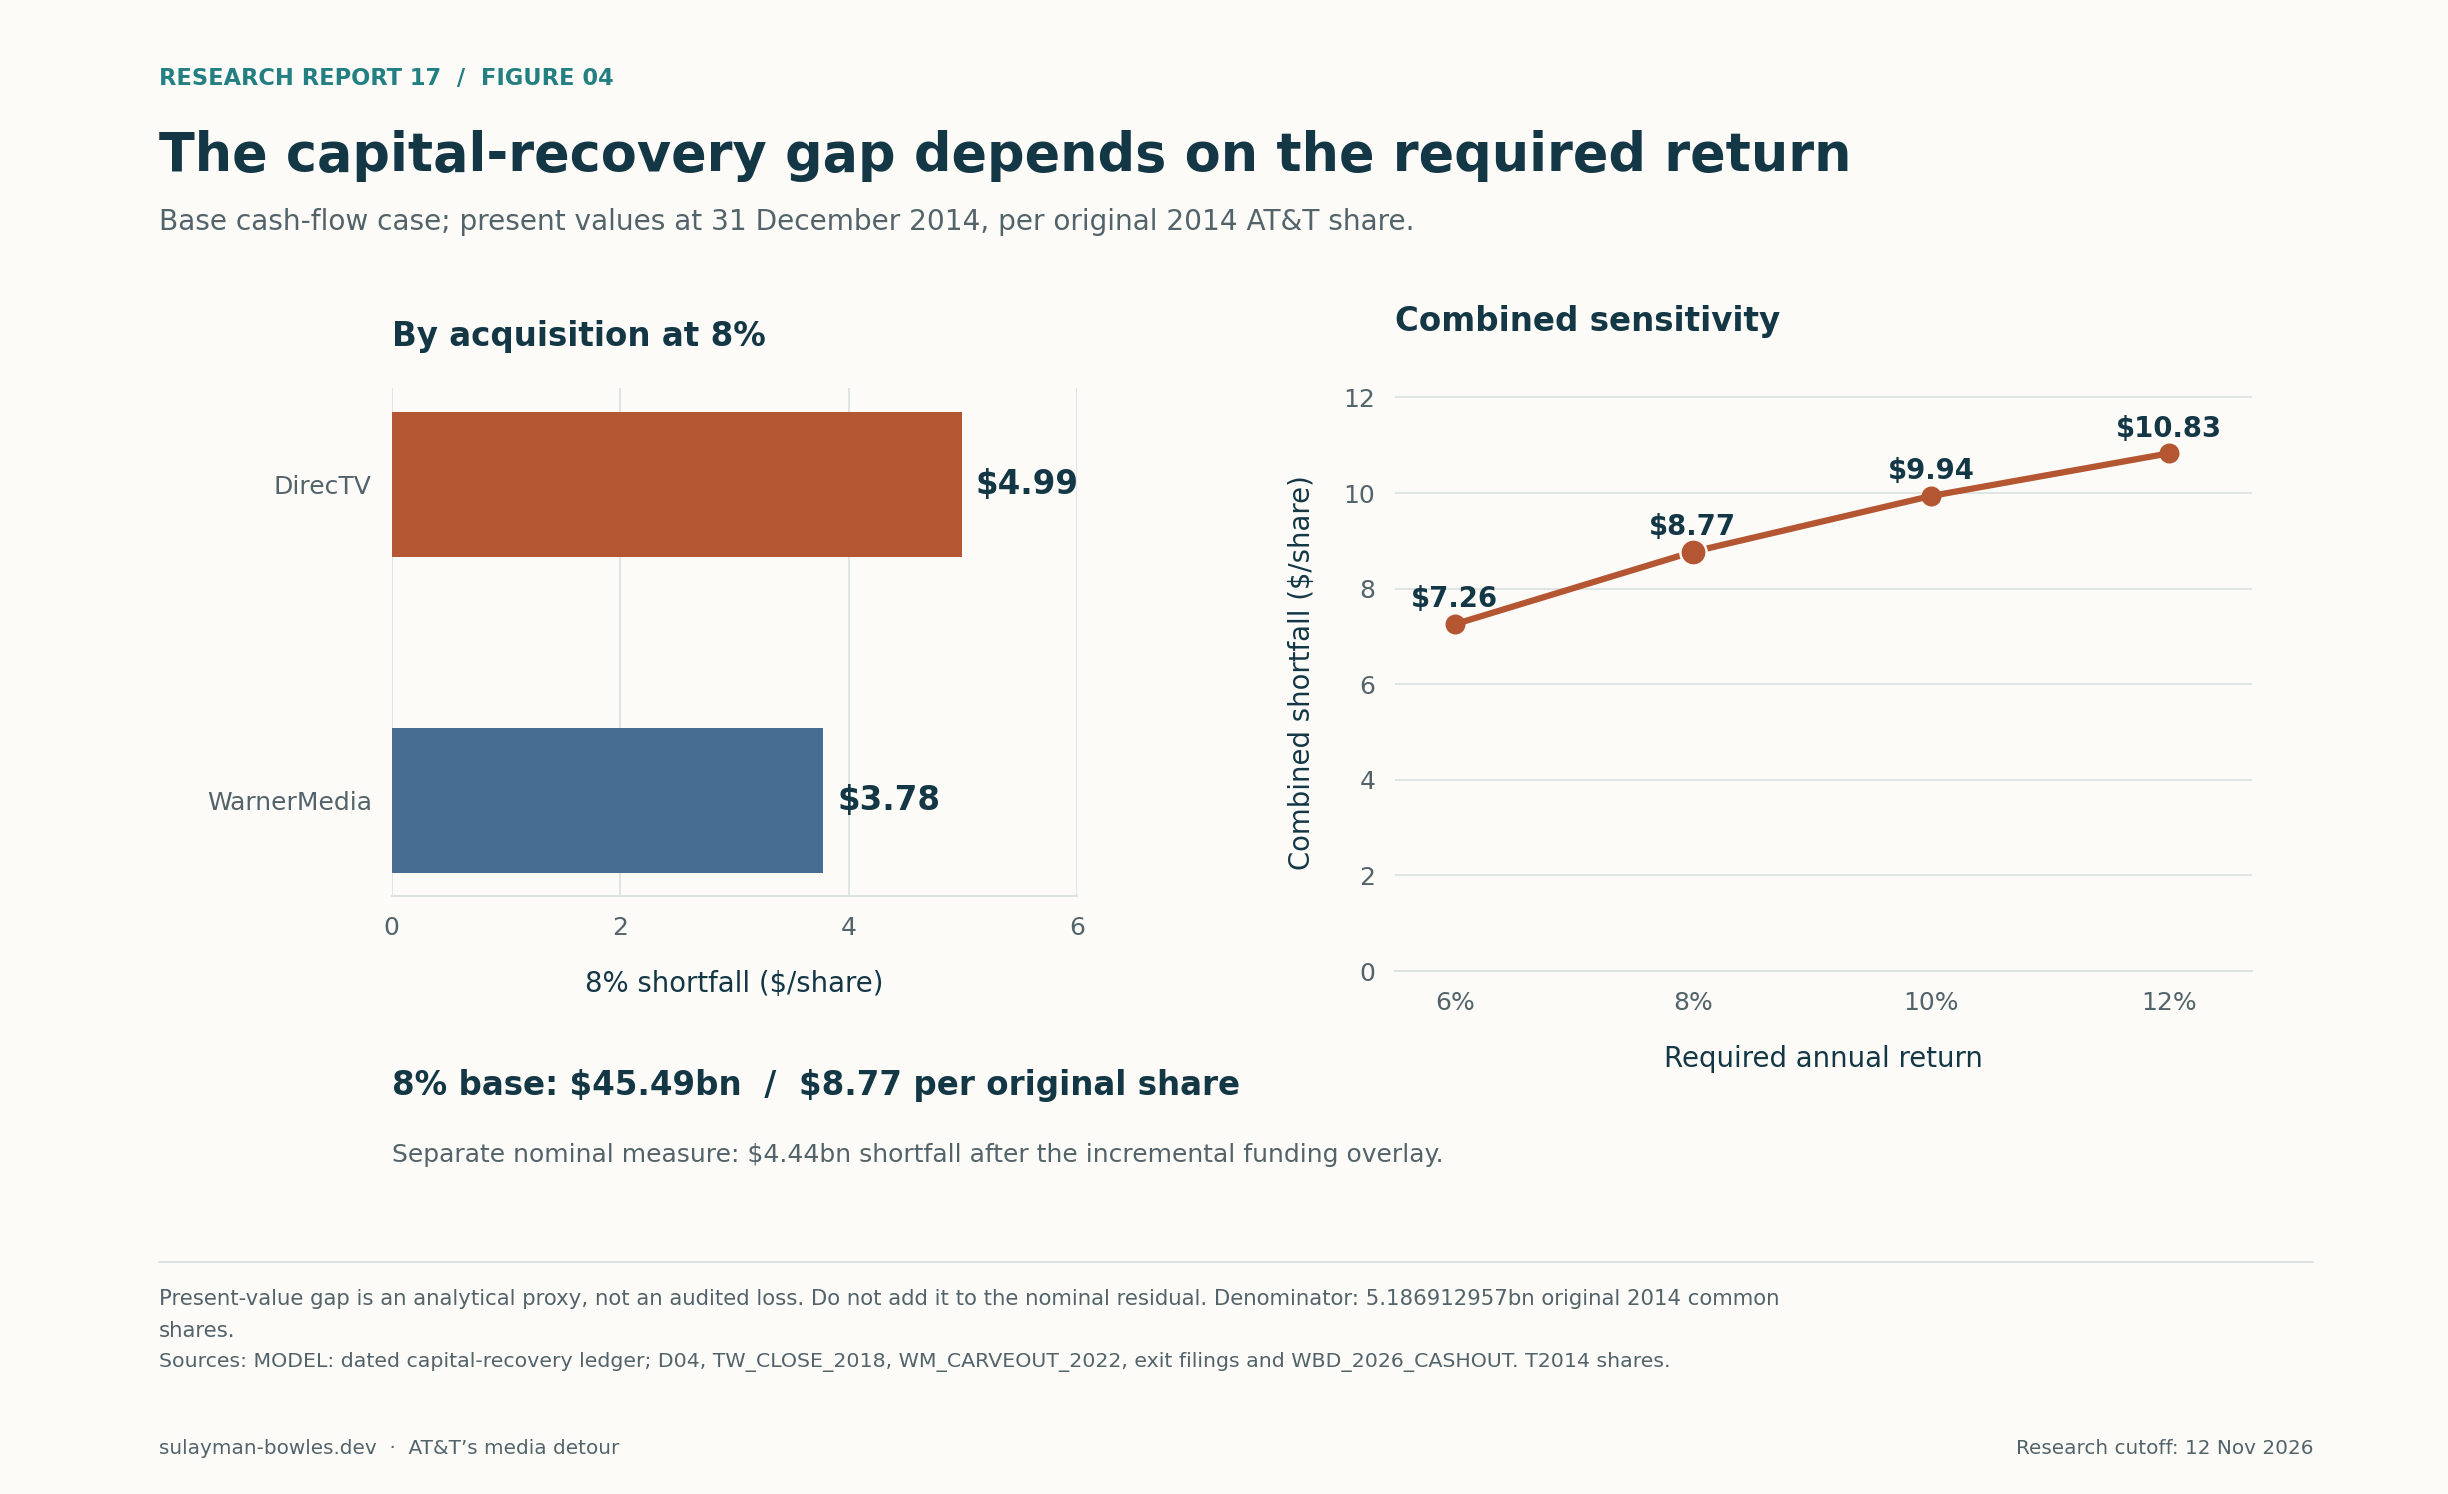
Figure 4 — Left: each deal’s 8% present-value shortfall, expressed per year-end 2014 AT&T share. Right: the combined shortfall at 6%, 8%, 10% and 12% hurdles. All present values are at December 31, 2014, before the financing charge. Source: dated ledger and stated hurdle assumptions.
5. The dividend, share count and debt per share tell different parts of the story
The balance-sheet bridge shows why acquisition arithmetic should not be confused with an individual investor’s account. Shares were issued, dividends paid, debt incurred and repaid, assets distributed, and more connectivity investments made after the media exit.
| Year-end, unless stated | AT&T shares outstanding, bn | Gross debt, $bn | Gross debt per share | Common dividend paid per share that year |
|---|---|---|---|---|
| 2014 | 5.187 | 82.067 | $15.82 | $1.84 |
| 2015 | 6.145 | 126.151 | $20.53 | $1.88 |
| 2017 | 6.139 | 164.346 | $26.77 | $1.96 |
| 2018 | 7.282 | 176.505 | $24.24 | $2.00 |
| 2021 | 7.141 | 177.354 | $24.84 | $2.08 |
| 2022 | 7.128 | 135.890 | $19.07 | $1.3525 |
| 2025 | 7.038 | 136.100 | $19.34 | $1.11 |
| September 30, 2026 | 6.761 | 159.627 | $23.61 | $1.11 paid through November 2 |
Sources: contemporaneous AT&T balance sheets, share disclosures and common-dividend history. Gross debt adds current and long-term debt. The series uses historical filing vintages. Later filings may reclassify some items. The annual bridge CSV includes each year; the accompanying corporate_source_facts.json supplies filing tags and accession records.att-2014, dtv-2015, tw-close, att-2021, att-2022, att-2025, latest, dividends
Debt per share fell between 2017 and 2018 despite higher aggregate debt because the Time Warner stock issuance enlarged the denominator. Issuing shares spread the debt across more shares. Conversely, the 2017 gross-debt total included acquisition prefunding and should be read alongside $50.498 billion of cash. By September 2026, later connectivity acquisitions and capital choices were also affecting debt. It would be incorrect to attribute the entire current balance to media.tw-close, latest
The annualized common dividend fell from $2.08 to $1.11, a 46.6% cut. Calendar 2022 cash was $1.3525 per share because one old-rate quarterly payment preceded three at the new rate. A continuously held share received $20.4825 in common cash dividends during 2014–2025, or $21.5925 through November 2, 2026, without reinvestment. These payments belong in the shareholder experience, but adding them to the acquisition recovery ledger would count corporate cash a second time.dividends
The spin also delivered an asset alongside the lower recurring dividend. The original WBD distribution ultimately became $7.50 per entitled AT&T share under this report’s holding convention. That does not restore the old dividend stream, but omitting it would substantially overstate the shareholder cost.
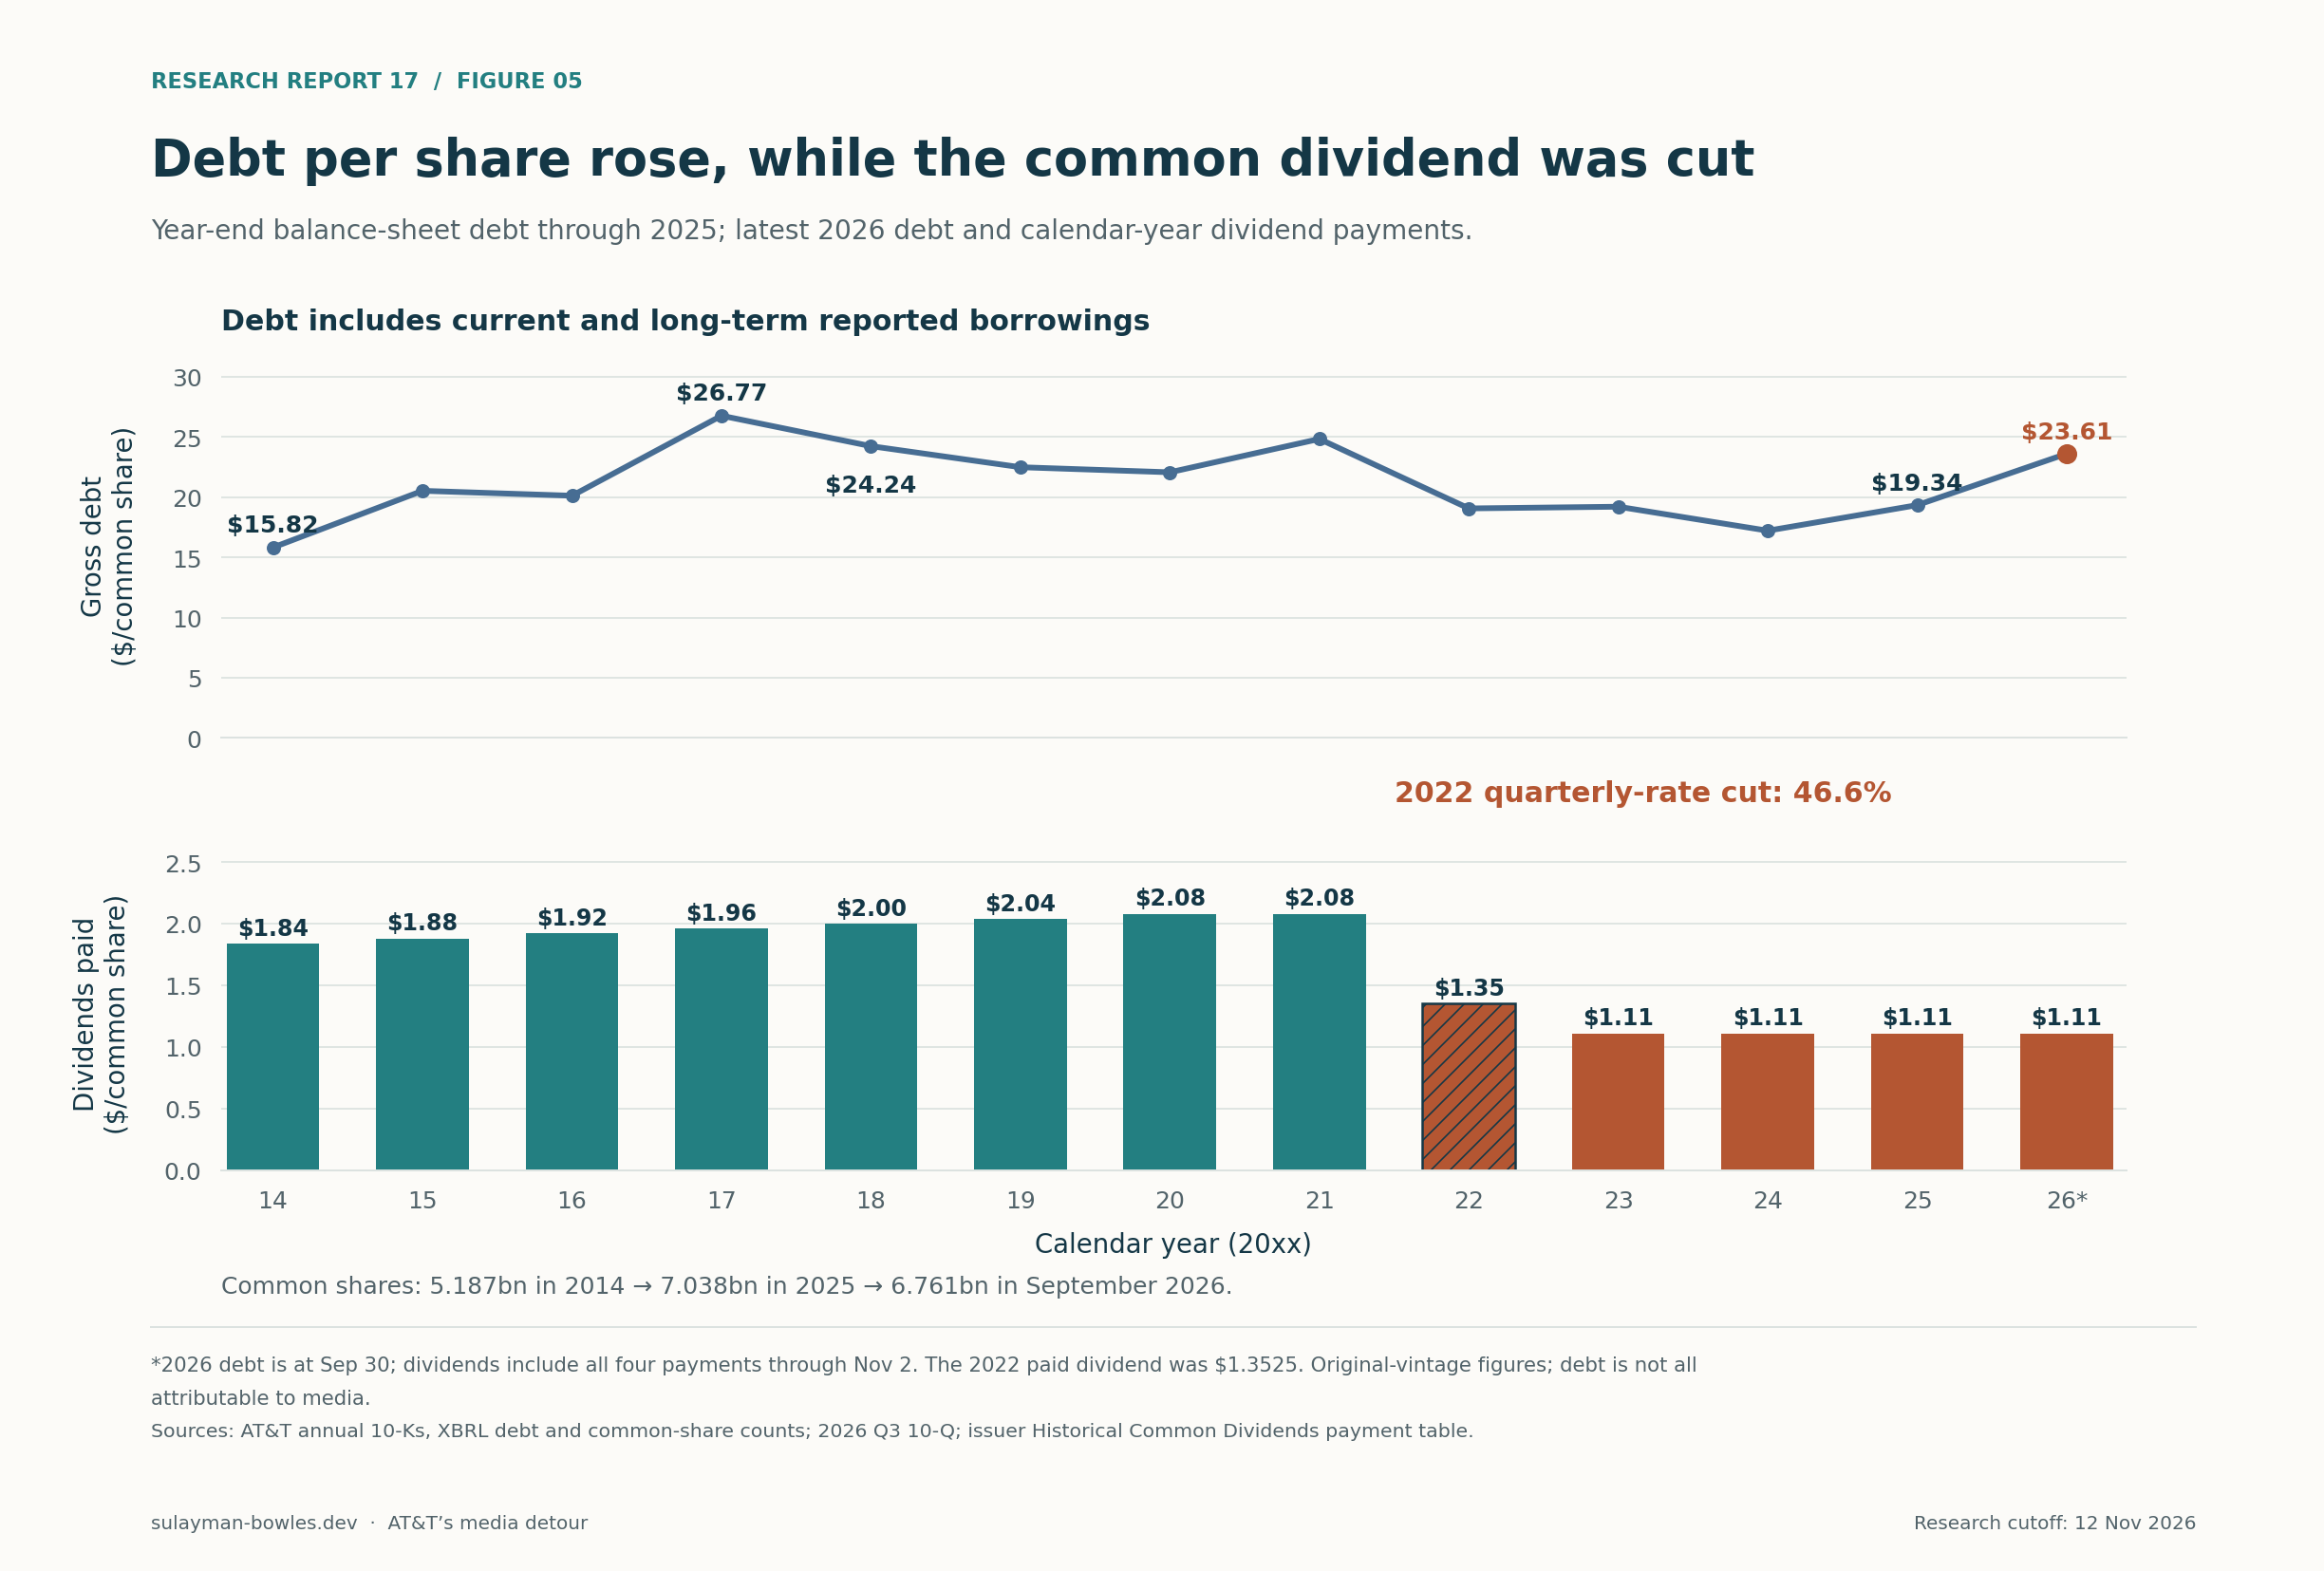
Figure 5 — AT&T gross debt per share and common cash dividends per share, with share-count observations identified in the footer. The September 2026 balance-sheet observation covers an interim period. Sources: balance-sheet tags and AT&T dividend history; accompanying annual CSV.
6. What $49.8 billion in cash could have funded
The full enterprise purchase price was not an available cash budget that AT&T could have poured into fiber. It included sellers’ stock consideration and inherited obligations. A more disciplined alternative starts with $49.792 billion of net cash consideration, committed in two tranches at the acquisition dates. The repurchase illustration uses those dates; the fiber analysis below tests the economics of individual connections.
Debt repayment is the cleanest comparison. At a 4.4% borrowing cost and a 25% assumed tax shield, permanently avoiding $49.792 billion of borrowing saves approximately $1.643 billion per year after tax once the full budget is deployed. The exact realized return would depend on which securities were retired, refinancing and tax capacity. Less debt could also preserve capacity for future investment, but the model assigns no speculative dollar value to that flexibility.
Historical-price repurchases make the dilution tradeoff tangible. At the unadjusted acquisition-date AT&T closes of $34.29 in July 2015 and $32.52 in June 2018, the corresponding net cash could have purchased approximately 279 million and 1.237 billion shares, respectively: 1.516 billion in total. At the current $1.11 annual dividend, that is $1.683 billion less annual dividend cash required. The calculation holds observed prices fixed. Orders of this size could move the market. The two deals also issued approximately 2.080 billion shares. Avoiding that issuance would have reduced dilution. The repurchase budget comes from cash consideration.dtv-2015, tw-close
Fiber requires a more demanding model. AT&T has described fiber as earning attractive returns and presented a mid-teens IRR objective in 2023. Its 2024 investor discussion distinguished the cost of passing a location from connecting and maintaining a customer, reported improving deployment economics and described an annual construction pace of approximately three million locations. The 2025 operating data provide a $73.12 monthly consumer fiber revenue-per-user anchor and approximately 40% penetration.fiber-2022, fiber-2024, fiber-2025
The cost to AT&T varies by project. The filings give no companywide dollar cost per new passing suitable for all historical years. Accordingly, the model assumes $800, $1,000 and $1,600 per passing. Each new customer requires another assumed $500 connection cost. The model uses a 25-year life, no price growth, zero terminal value and a five-year ramp to mature penetration. Its cash margin is after assumed maintenance and tax; it is not AT&T’s reported segment EBITDA margin.
| Fiber unit model | Favorable | Base | Adverse |
|---|---|---|---|
| Build cost per passing | $800 | $1,000 | $1,600 |
| Mature penetration | 55% | 50% | 40% |
| Cash margin | 45% | 40% | 35% |
| Passing plus eventual connection cost | $1,075 | $1,250 | $1,800 |
| Unit IRR | 17.5% | 11.8% | 3.9% |
| Locations supported, million | 30.0 | 30.0 | 27.7 |
| Cash deployed including connections, $bn | 32.250 | 37.500 | 49.792 |
| Remaining cash budget, $bn | 17.542 | 12.292 | — |
Three million passings a year for ten years sets a 30 million-location gross capacity envelope. The estimate leaves open whether AT&T could have added 30 million locations beyond the ones it built. It assumes no specific dates for the ten-year rollout. The 11.8% base result is one cohort’s unit IRR. The base could eventually support 15 million connected customers and $5.265 billion of annual mature cash generation, once the full build reaches steady state. Its unit present value at an 8% hurdle is approximately $450 per passing. Undeployed funds remain available for debt repayment; they do not receive an invented fiber return.
The test uses 2025 economics. Locations, costs and competition may have differed in 2015. A proper historical backcast would require local construction costs, build permissions, take rates, available households and contemporaneous prices. The adverse case earns only 3.9%, showing why “they should have built fiber” is incomplete without cost and penetration assumptions. The stronger conclusion is that AT&T needed to compare media expansion against concrete network and balance-sheet opportunities, with explicit limits on scale.
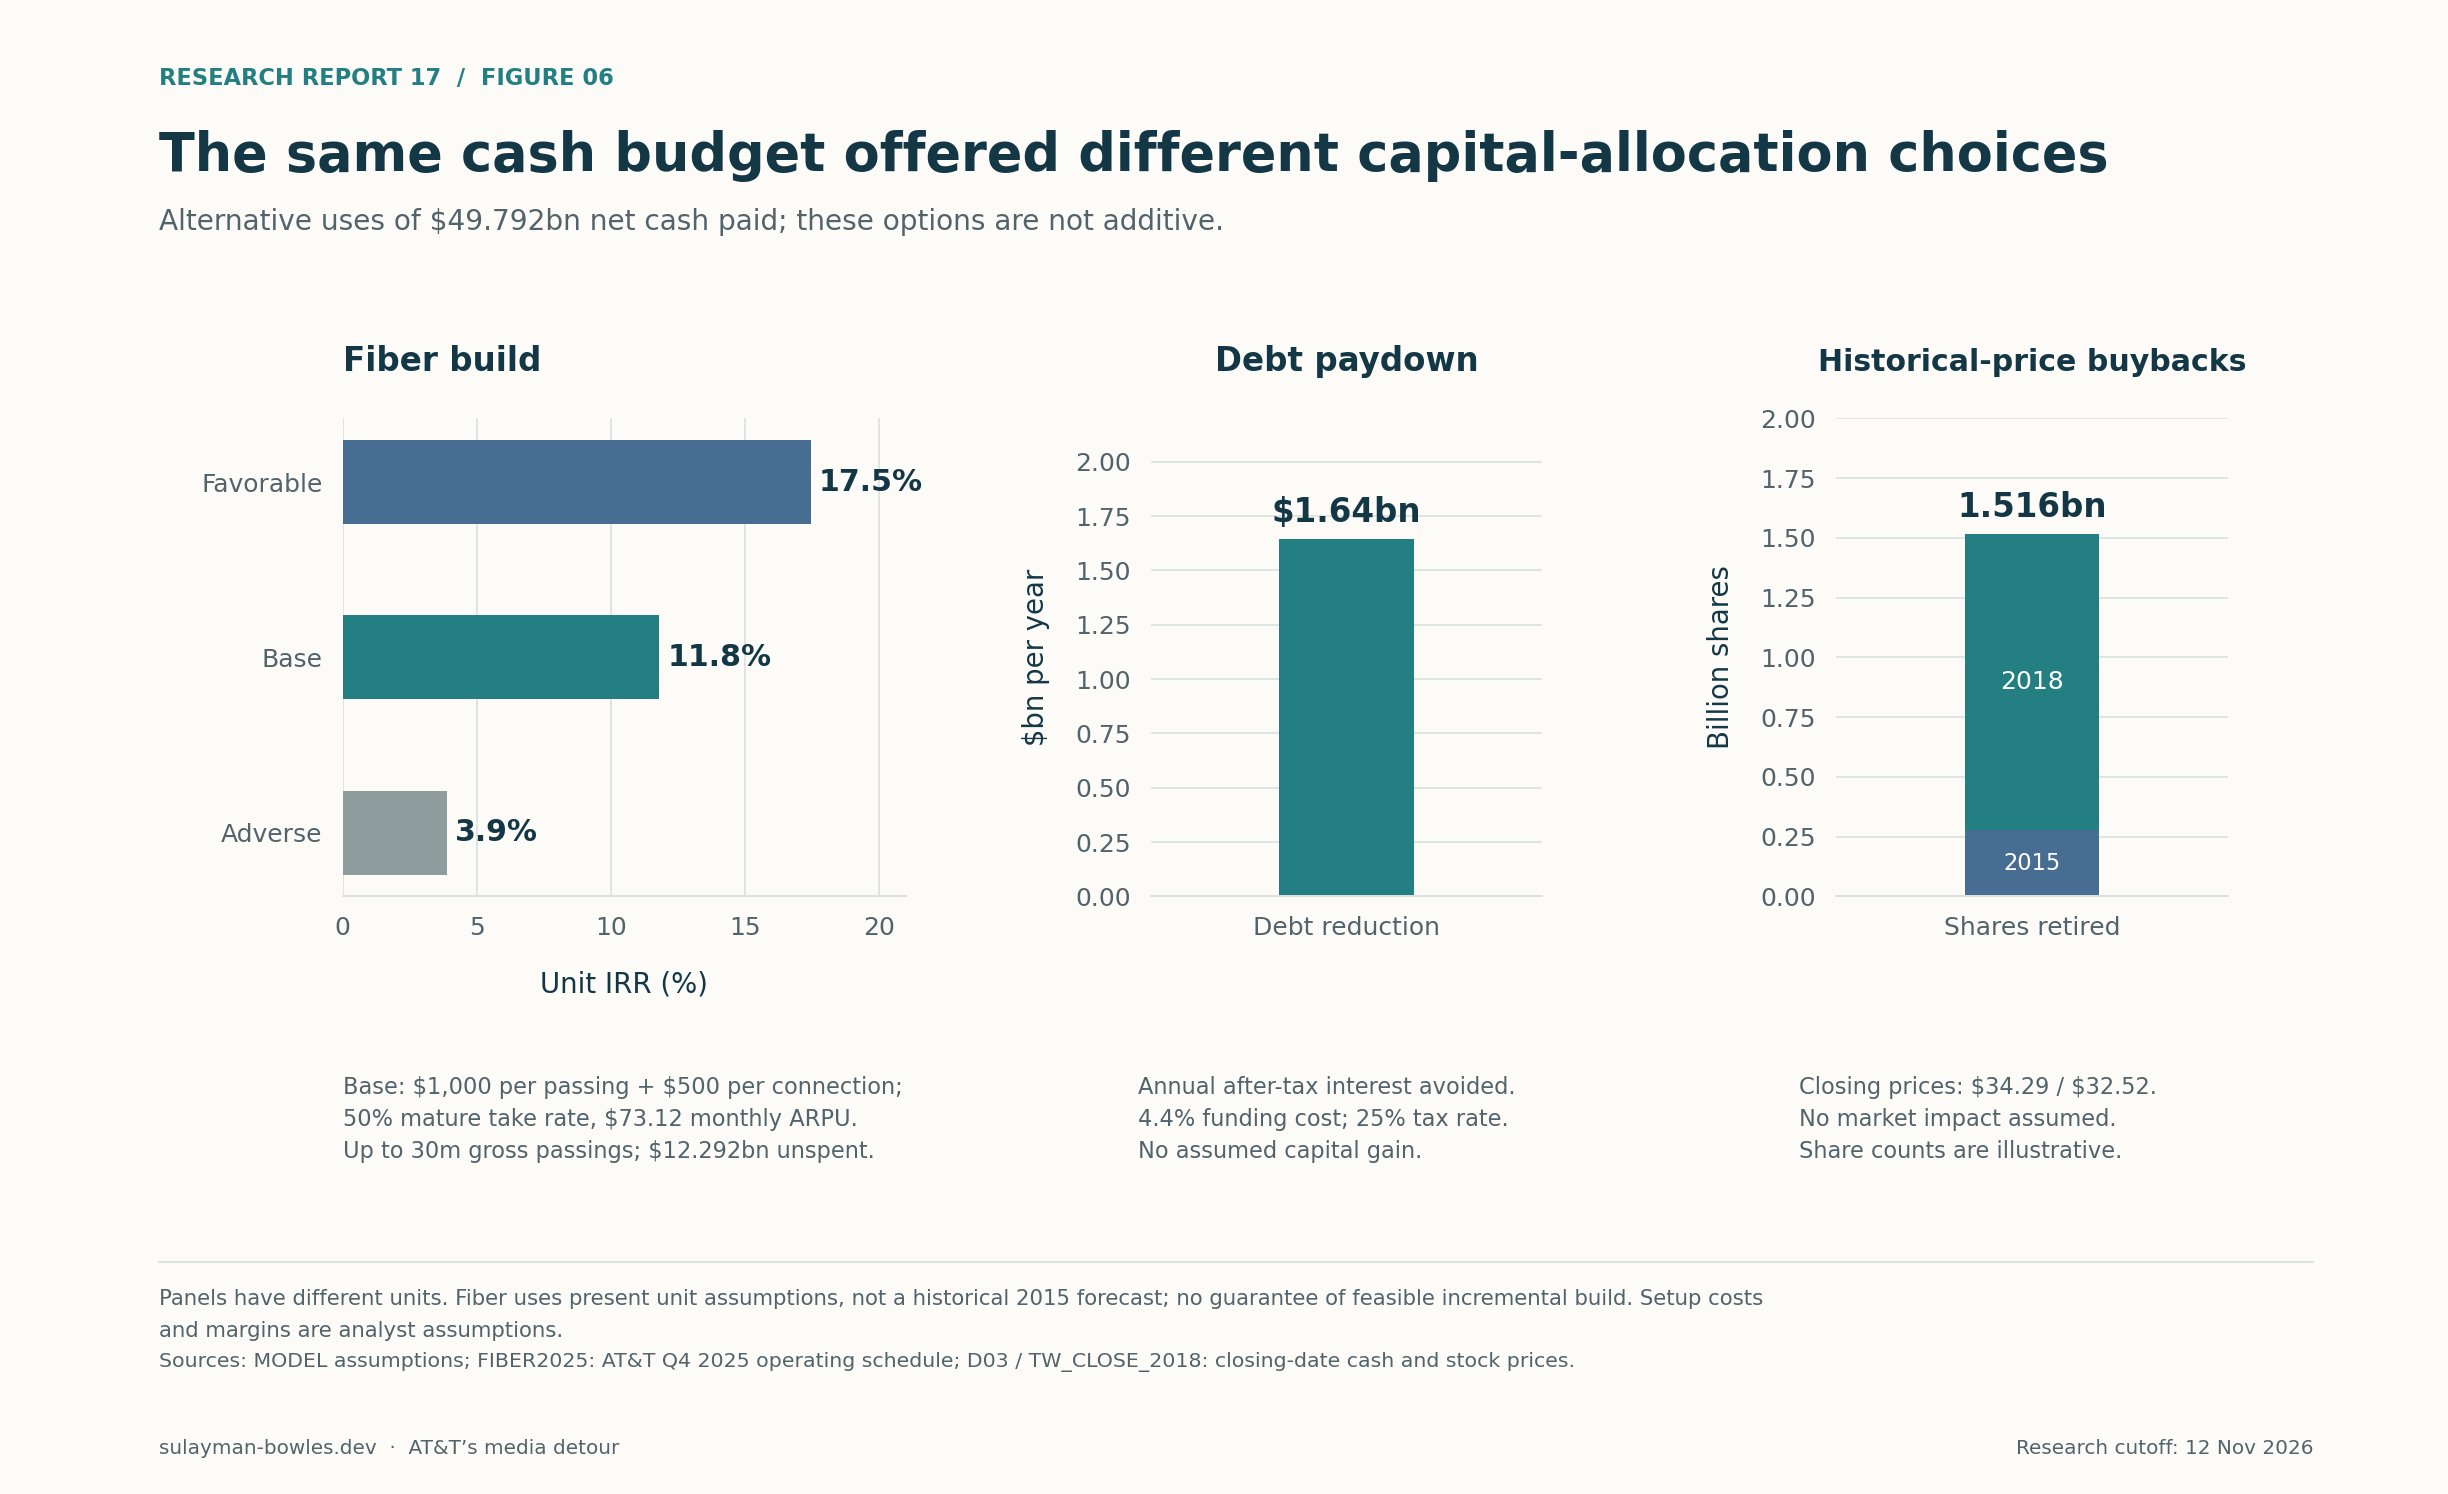
Figure 6 — Fiber unit IRRs under stated assumptions, with the $49.792 billion common cash budget and alternative debt and buyback arithmetic shown alongside it. Sources: AT&T’s fiber presentations and operating statistics; author assumptions and formulas.fiber-2022, fiber-2024, fiber-2025
7. AT&T beat Verizon’s shareholder return but trailed T-Mobile
Peer returns constrain an easy narrative. AT&T shareholders did not universally lose money, and avoiding these particular acquisitions did not automatically produce superior returns at every competing carrier.
Chaining the companies’ published dividend-reinvestment performance series over the common December 31, 2014–December 31, 2025 period gives the following approximate results. The model chains issuer graph values at overlapping dates.tsr-att, tsr-vz, tsr-tmus
| $100 invested at December 31, 2014 | End-2025 value | Cumulative total return | Annualized return |
|---|---|---|---|
| AT&T | $187.35 | 87.3% | 5.9% |
| Verizon | $154.18 | 54.2% | 4.0% |
| T-Mobile | $779.82 | 679.8% | 20.5% |
AT&T’s rebound is material: its issuer series rose approximately 55% during 2020–2025. The peer comparison therefore supports a narrower finding—AT&T lagged the strongest large US wireless operator substantially, while outperforming Verizon over this window. It does not isolate the causal effect of media acquisitions. T-Mobile’s Sprint combination, spectrum position and different starting scale matter. Verizon made its own investment and portfolio choices.
The issuer TSR convention also differs from the report’s fixed-block WBD convention. Published performance series assume dividend reinvestment and apply their own corporate-action treatment; AT&T’s graph does not fully explain that treatment. The WBD block calculated above is used for the deal ledger. It should not be bolted onto AT&T’s published total return, which risks counting a distribution twice.
Capital intensity provides context, with a warning about comparability. In 2025, cash capital expenditure divided by consolidated revenue was 16.6% for AT&T, 12.3% for Verizon and 11.3% for T-Mobile. Adding AT&T’s vendor-financing payments raises its broader measure to 17.5%. Spectrum purchases and acquisitions are outside these ratios, and different equipment, leasing and business mixes affect them. They compare cash spending with revenue.capex-att, capex-vz, capex-tmus
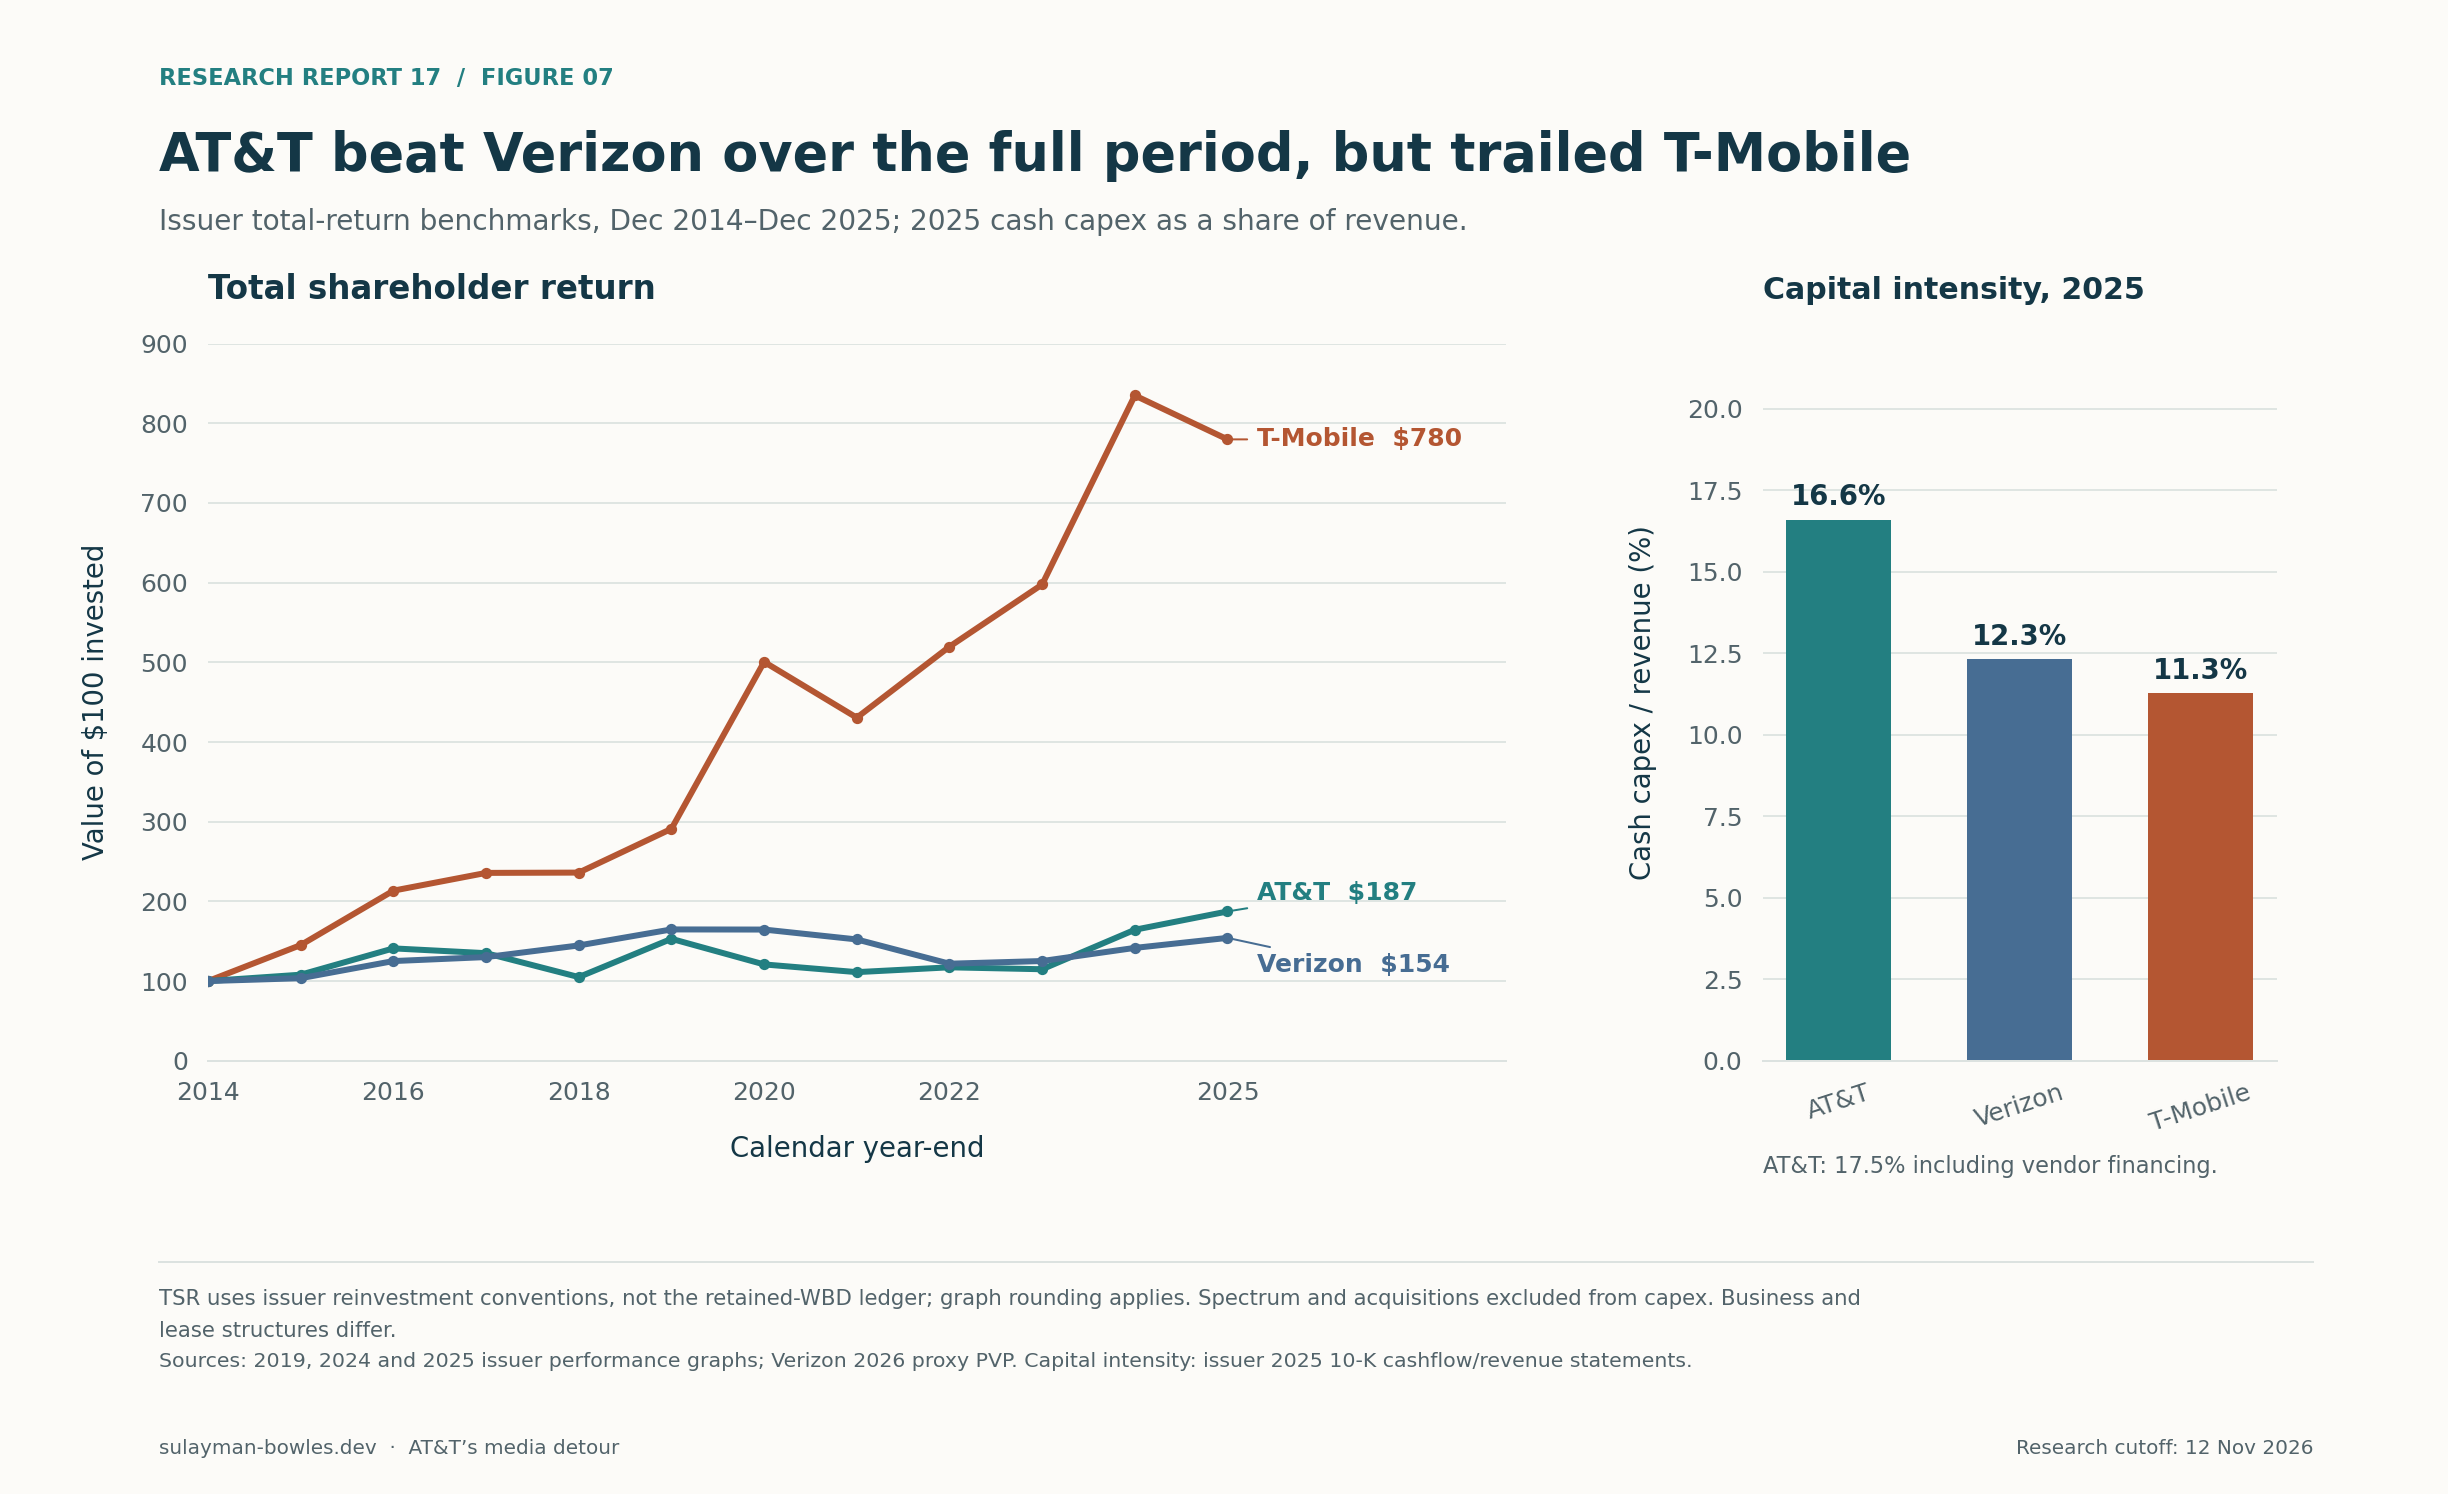
Figure 7 — Dividend-reinvested issuer series chained to $100 at December 31, 2014, through December 31, 2025; companion panel for 2025 cash capital expenditure/revenue. Source values and overlap calculations are included in the raw CSVs.tsr-att, tsr-vz, tsr-tmus, capex-att, capex-vz, capex-tmus
8. The rationale was explicit, the risks were disclosed, and the outcomes fell short
AT&T’s strategic case had an understandable structure. The 2014 DirecTV proxy described a national video platform, broader bundles, content-purchasing scale and cash-generation opportunities. The initial annual savings target was at least $1.6 billion by year three, subsequently raised to $2.5 billion. The Time Warner case joined owned content to distribution and customer relationships, promised direct-to-consumer opportunities and sought a less capital-intensive mix. At closing, the Warner synergy target reached $2.5 billion annually by the end of 2021, comprising $1.5 billion of cost and $1 billion of revenue synergies.dtv-proxy, dtv-synergies, tw-proxy, tw-synergies
The merger documents did not promise the absence of risk. The Time Warner proxy warned that pro forma debt could rise from approximately $125 billion to $190 billion and that debt service and dividends could constrain capital expenditure and repurchases. It did not assure the continuation of AT&T’s current dividend. Time Warner’s board’s fairness analysis addressed the consideration received by its sellers. AT&T’s modeled long-term return fell short’s purchasers, and the transaction did not require an AT&T shareholder vote.tw-proxy
There is also evidence against the claim that integration produced nothing. AT&T reported approximately $700 million of Warner synergy run-rate achievement by late 2019. In its June 2021 transaction defense, it argued that entertainment bundles had reduced churn and that global streaming’s capital requirements now favored a spin-off. Those are management’s claims about operating effects and changed investment demands. The analysis credits reported cash generation; it does not add promised or realized “synergies” again on top of that cash.tw-synergy-progress, att-defense
Elliott’s September 2019 letter challenged both portfolio logic and execution. It argued that DirecTV had been bought near a peak in linear television, questioned the necessity of owning Time Warner and urged portfolio discipline, debt reduction and capital returns. Elliott forecast a higher share price under its proposal. AT&T’s October response promised modest dividend increases, no major acquisitions, substantial repurchases and debt reduction. The subsequent media separations and dividend reset diverged materially from that integrated-company plan. Comparisons of its old earnings targets with the smaller post-spin company need corresponding perimeter adjustments.elliott, att-2019-plan
Executive pay is one part of the governance record. Randall Stephenson’s disclosed Summary Compensation Table totals for 2014–2020 sum to $196.6 million. These totals include grant-date equity values and pension changes; they are not all cash received. The later proxy also reports a 2018–2020 award realization of approximately $9.6 million against a $13.7 million target, a roughly 70% outcome. His 2020 salary waiver and reduced annual incentive are relevant counterevidence to any assertion that compensation was wholly insulated from performance.pay-2017, pay-2020, pay-2021
John Stankey’s disclosed 2025 total was approximately $29.9 million, versus $22.9 million in 2022. The 2026 proxy describes a 112% annual-incentive outcome and a 124% payout for the 2023–2025 long-term cycle, using measures including adjusted earnings, return on invested capital and shareholder return. Those measures can reward a successful recovery after divestiture without measuring the lifetime return on the original acquisitions.pay-2026
The governance question supported by the evidence is whether incentives and board reviews consistently assessed the full cost of capital, dilution and alternative uses across acquisition and disposal cycles. The report does not infer undisclosed intent or wrongdoing. Large compensation totals also are not deducted again from the acquisition ledger: ordinary compensation expenses already affect reported operating cash where allocated.
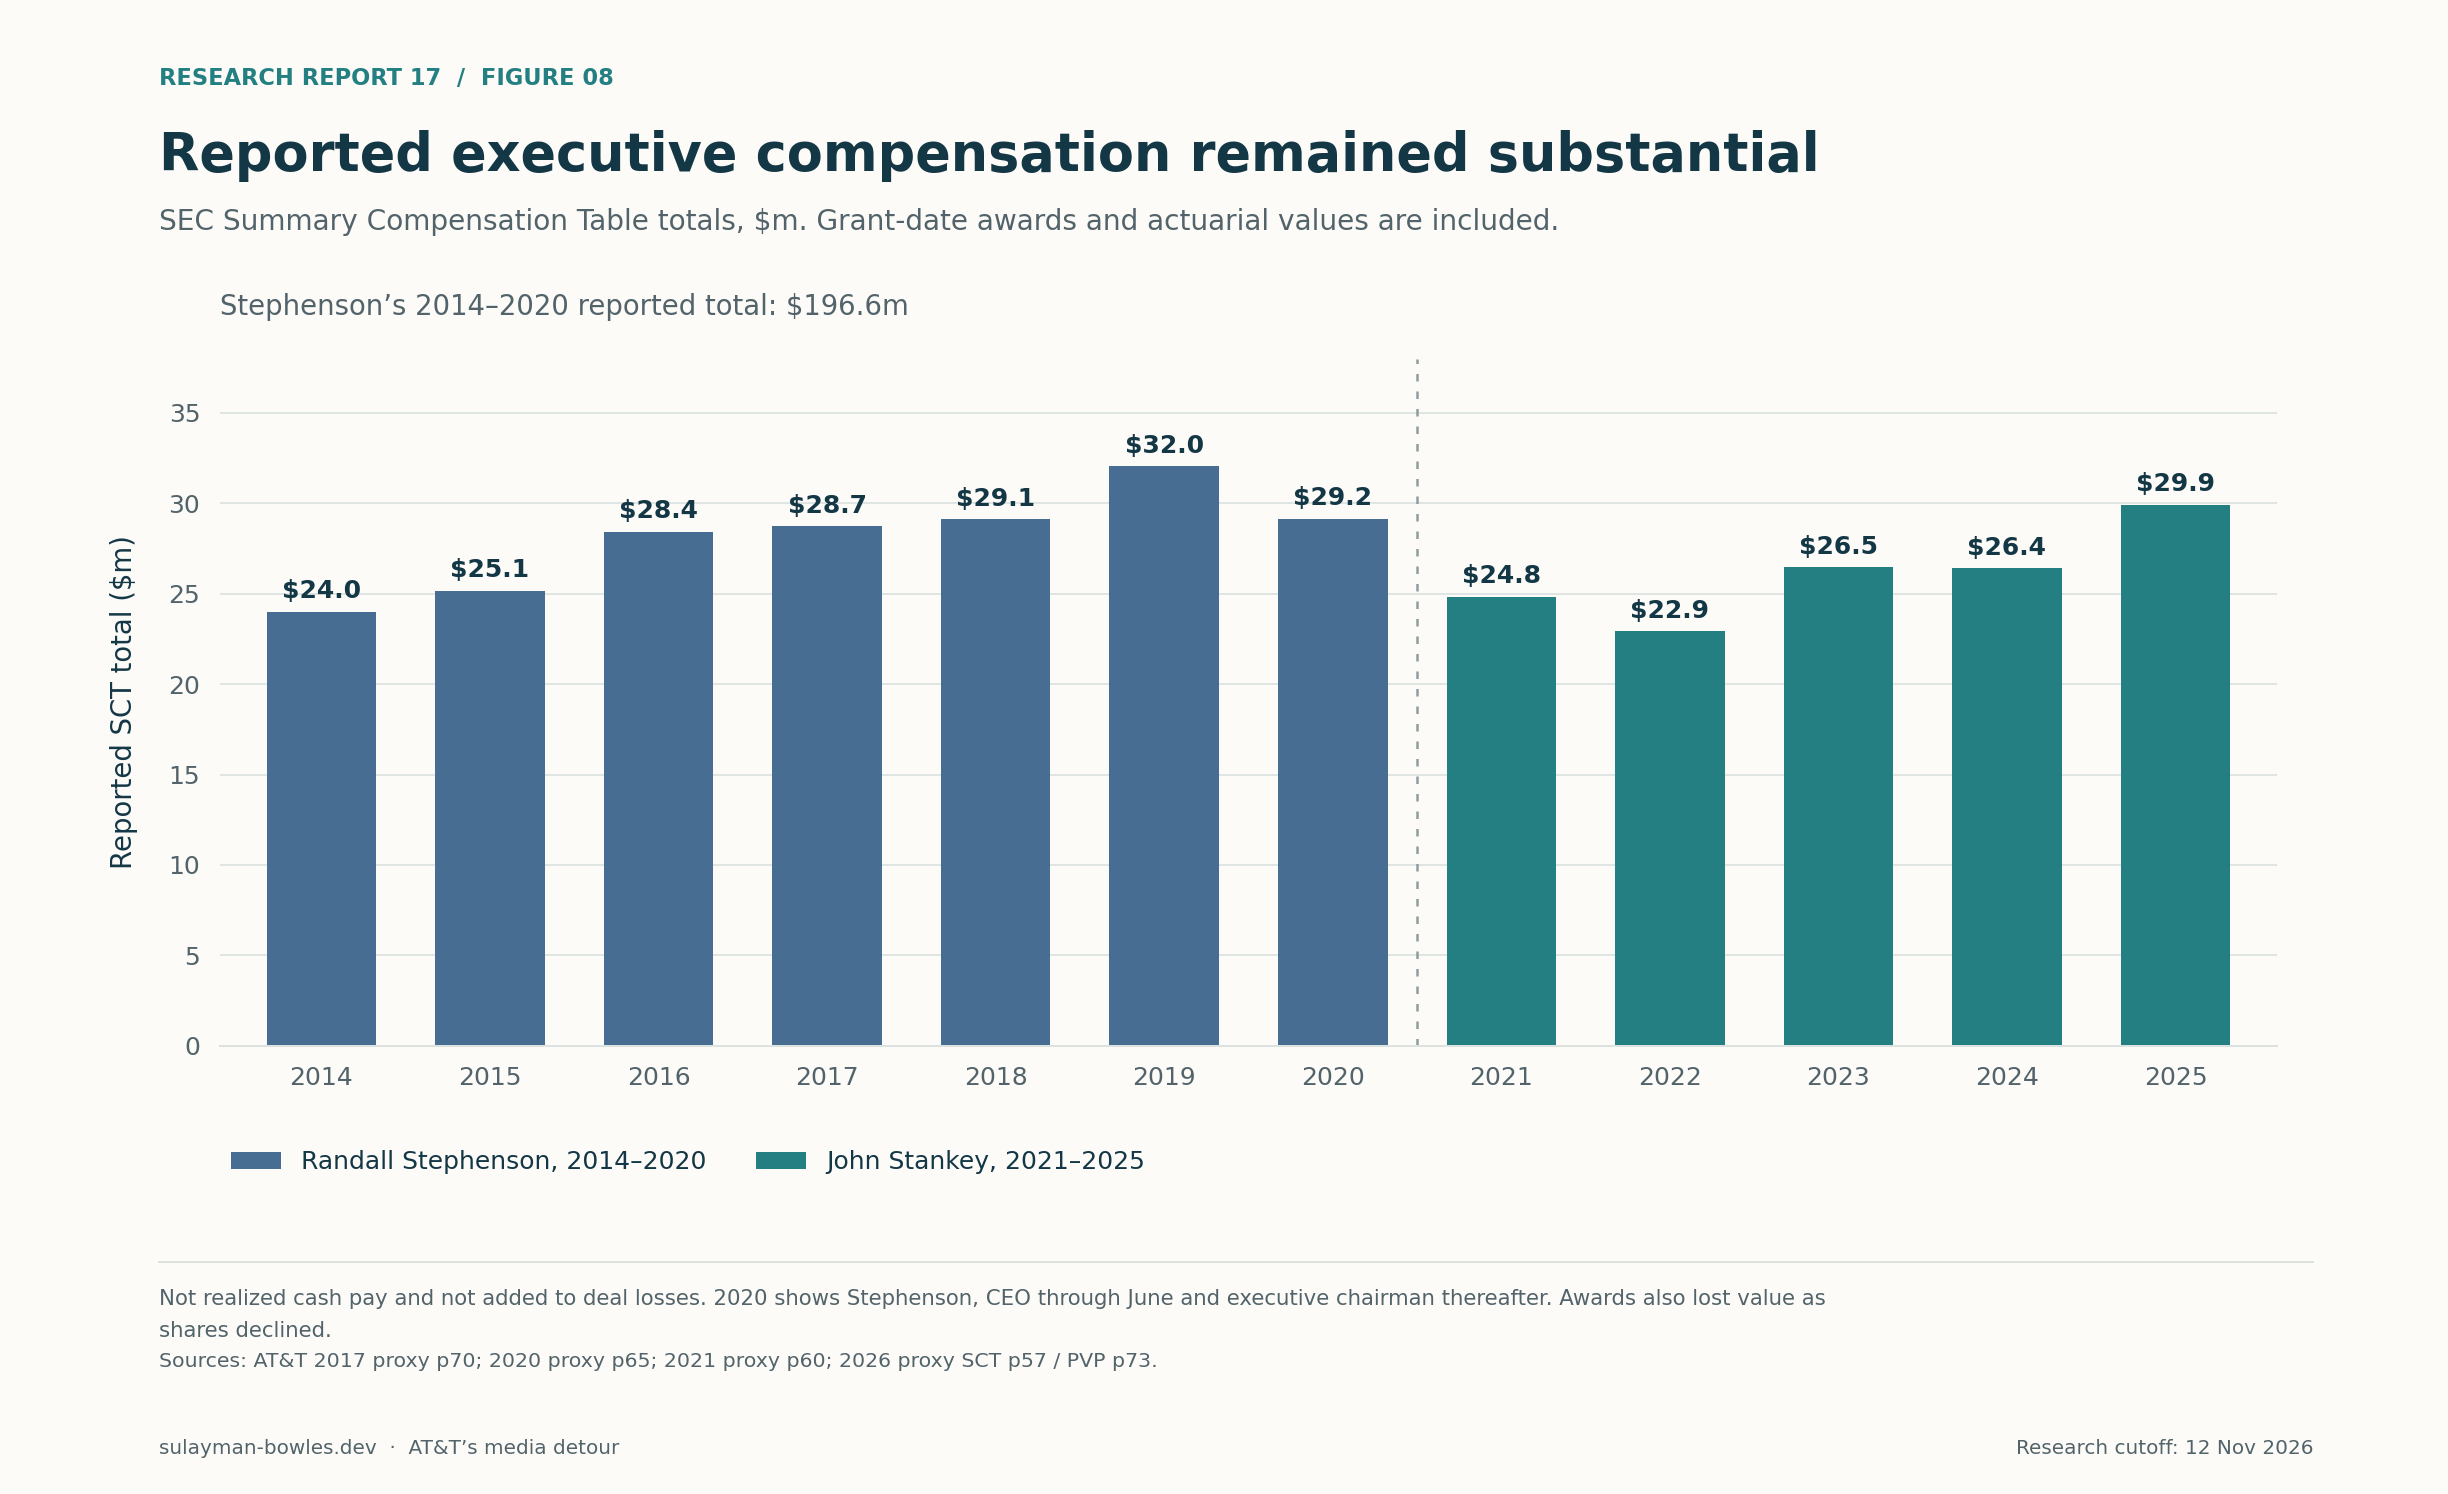
Figure 8 — Annual SEC Summary Compensation Table totals, $ million: Randall Stephenson for 2014–2020 and John Stankey for 2021–2025. Stephenson was CEO through June 2020 and executive chairman for the rest of that year. Totals include grant-date awards and pension changes, and are not realized cash pay. Sources: AT&T proxies.pay-2017, pay-2020, pay-2021, pay-2026
What would change the conclusion?
The conclusion is strongest about low returns on a large capital commitment and weaker about a precise nominal loss. Several specific pieces of evidence would improve or change it.
A complete original-DirecTV cash-flow bridge could validate or revise management’s $22 billion attribution and isolate the legacy AT&T operations later transferred to the JV. Exact 2020–2021 cash, early distribution taxes, transition support, Sky Mexico proceeds and proof of Vrio collections would narrow that ledger. Because the base nominal result is relatively small, seemingly secondary items matter.
For Warner, standalone cash statements covering the owned parts of 2018 and 2022, a full bridge from the acquired perimeter to the carveout, and an allocation of parent interest would permit a more conventional return calculation. Gross asset-sale proceeds need net-tax and incremental-investment checks. A reconciliation should show how much cash came from receivables monetization and how much from recurring earnings. The cash flows remain unresolved.
For fiber, verified location-level construction and connection costs, feasible incremental build areas and contemporaneous take rates would determine whether the modeled 11.8% base unit return was historically attainable at scale. Higher costs or weaker penetration could make debt repayment more attractive. Buyback comparisons would need to allow for price effects and the shareholder value of the network investments forgone.
The three headline controls are reproducible. Closing purchase-price components sum to $163.531 billion, with an independent Warner enterprise-value filing check. The original distribution ratio multiplied by the exchange-confirmed $31.01666668 cashout produces $7.503459 per entitled AT&T share. Recomputing dated present values from the raw ledger produces $45.491969 billion and dividing by the filed 2014 share count produces $8.770529. Independent arithmetic verifies these calculations; it does not make uncertain operating inputs certain.
The completed WBD cashout makes an outdated “Warner shares collapsed and stayed there” account untenable. Crediting that recovery still leaves a 2.05% capital-recovery IRR for Warner and a negative one for DirecTV. AT&T eventually returned to a connectivity strategy with a lower dividend and a changed share base. The documented lesson is that recovering nominal purchase dollars years later is a demanding hurdle’s starting point, not proof of successful capital allocation.
Sources and calculation notes
- AT&T, announcement dated May 18, 2014, Exhibit 99.1, purchase terms and synergy target: Primary document. ↩
- AT&T/DirecTV, S-4/A filed August 14, 2014, “AT&T’s Reasons for the Merger,” “DIRECTV’s Reasons for the Merger,” and risk factors: Primary document. ↩
- AT&T, 2015 annual financial review, filed February 18, 2016, Note 5, pp. 57–58; financing discussion, pp. 26–27; debt note: Primary document. May issuance total is the sum of six disclosed tranches. ↩
- AT&T, 2016 Form 10-K, filed February 17, 2017, Note 5, finalized DirecTV purchase-price allocation: Primary document. ↩
- AT&T, April 22, 2015 earnings release, updated DirecTV synergy expectation: Primary document. ↩
- AT&T, 2019 shareholder letter, published with 2019 annual reporting, printed p. 3/PDF p. 4, cumulative DirecTV cash-flow attribution: Primary document. ↩
- AT&T, February 25, 2021, Exhibit 99.1, TPG transaction terms and footnote 1: Primary document. ↩
- AT&T, 2023 Form 10-K, filed February 23, 2024, Notes 6 and 19, JV formation receipts, preferences, distributions and NFL note: Primary document. ↩
- AT&T, 2024 Form 10-K, filed February 12, 2025, Note 19, DirecTV and Sky Mexico: Primary document. ↩
- AT&T, 2025 Form 10-K, filed February 9, 2026, Note 19, distributions and transactions with DirecTV: Primary document. ↩
- AT&T, September 30, 2024 Form 8-K, Items 1.01 and 7.01, remaining-interest transaction and payment terms: Primary document. ↩
- AT&T, 2025 Form 10-K, filed February 9, 2026, Note 10, notes receivable, DirecTV disposal gain, tax-liability release and sale collections: Primary document. ↩
- AT&T, 2022 Form 10-K, filed February 13, 2023, Notes 6 and 19, Vrio disposal/receivable and DirecTV investment: Primary document. ↩
- Sony filed its fiscal 2020 Form 20-F on June 26, 2020. See Note 16, Stockholders’ equity, subsection (4), Equity transactions with noncontrolling interests. The final paragraph gives the Game Show Network consideration and presale dividend. Primary document. ↩
- AT&T/Time Warner, October 22, 2016 announcement, Exhibit 99.1, consideration, enterprise value, bridge commitment and synergies: Primary document. ↩
- AT&T/Time Warner, final merger proxy filed January 9, 2017, p. 12, voting; pp. 47–48, debt/dividend risks; pp. 60–63, target-board rationale; pp. 83–84, AT&T rationale: Primary document. ↩
- AT&T, 2018 annual financial review, filed February 20, 2019, Note 6, pp. 76–78, acquisition; Note 11, debt, bridge amendment, term loans and note redemption; balance sheets: Primary document. ↩
- AT&T, 2019 Form 10-K, filed February 20, 2020, Note 6, pp. 89–90, finalized acquisition accounting; Notes 6/10, Hulu and Hudson Yards: Primary document. ↩
- AT&T, May 6, 2019 pro forma financial information, acquisition-consideration table, explicit $100.334 billion enterprise value: Primary document. ↩
- Time Warner, 2017 Form 10-K, filed February 22, 2018, pp. 72–74, cash-flow statements: Primary document. Continuing operating cash is used in the 2018 proxy; discontinued cash is excluded. ↩
- AT&T, second-quarter 2018 earnings presentation, July 24, 2018, slide 14, Warner synergy objectives: Primary document. ↩
- AT&T, fourth-quarter 2019 investor briefing, January 29, 2020 (linked file version 022820), WarnerMedia synergy run-rate update: Primary document. ↩
- Discovery/WarnerMedia, 424B3 filed March 28, 2022, WarnerMedia statements F-7; scope F-9; receivables F-53–54; cash interest and redemption costs, Note 19 and cash-flow statements: Primary document. ↩
- AT&T, first-quarter 2022 Form 10-Q, filed April 22, 2022, consolidated cash-flow statement: Primary document. ↩
- AT&T, first-quarter 2023 Form 10-Q, filed April 20, 2023, cash-flow statement with restated first-quarter 2022 continuing/discontinued operations: Primary document. ↩
- AT&T, 2022 Form 10-K, filed February 13, 2023, Note 6, Warner spin-off; Note 23, discontinued operations; MD&A, $1.2 billion financing true-up; goodwill note: Primary document. ↩
- AT&T, 2020 Form 10-K, filed February 25, 2021, acquisition/disposition and goodwill/long-lived-asset notes, CME sale and video impairments: Primary document. ↩
- WBD, 2022 Form 10-K, filed February 24, 2023, Note 4, 1.732 billion shares, $24.43 reference price, $42.309 billion fair value and distribution mechanics: Primary document. ↩
- WBD, 2026 proxy, filed April 30, 2026, pay-versus-performance disclosure, footnote 2(a), year-end common-stock prices for 2022–2025: Primary document. Trading-date labels follow the last trading day of each year. ↩
- WBD, October 6, 2026 Form 8-K, Item 2.01, completed merger and $31.01666668 per-share cash consideration: Primary document. ↩
- Nasdaq Trader, corporate-action notice ECA2026-710, October 2026, WBD merger consideration and trading treatment: Primary document. Independently checked November 12, 2026. ↩
- WBD, 2025 Form 10-K, filed February 27, 2026, Item 5, cash-dividend history: Primary document. ↩
- AT&T, 2014 annual financial review, filed February 20, 2015, balance sheet and Note 9, p. 55; shares derived from issued less treasury shares: Primary document. ↩
- AT&T, 2021 Form 10-K, filed February 16, 2022, consolidated balance sheet and stockholders’ equity; Note 20, DirecTV obligations and costs AT&T kept; contemporaneous gross-debt presentation: Primary document. ↩
- AT&T, 2025 Form 10-K, filed February 9, 2026, balance sheet, cash-flow and stockholders’ equity statements, pp. 43–46: Primary document. ↩
- AT&T, third-quarter 2026 Form 10-Q, filed October 21, 2026, balance sheet, notes receivable and MD&A; tags CommonStockSharesIssued, TreasuryStockCommonShares, DebtCurrent, LongTermDebtAndCapitalLeaseObligations: Primary document. ↩
- AT&T, historical common dividends, payment-date records, accessed November 12, 2026: Primary document. Calendar totals and the 46.6346% annualized reduction are calculated. ↩
- AT&T, fourth-quarter 2022 earnings presentation, January 25, 2023, “Fiber: A Return-focused Growth Opportunity”: Primary document. ↩
- AT&T, Analyst and Investor Day transcript, December 3, 2024, pp. 9–10, construction, connection costs, penetration and build pace: Primary document. ↩
- AT&T, fourth-quarter 2025 trending schedule, January 28, 2026, p. 10, fiber ARPU/penetration; p. 13, definitions; p. 4, DirecTV cash-tax allocations: Primary document. ↩
- AT&T stock-performance graphs: 2019 Form 10-K, Item 5, p. 24, February 20, 2020, Primary document; 2024 Form 10-K, Item 5, p. 18, February 12, 2025, Primary document; 2025 Form 10-K, Item 5, p. 18, February 9, 2026, Primary document. ↩
- Verizon performance series: 2019 annual-report Exhibit 13, February 21, 2020, Primary document; 2024 Form 10-K, Item 5, p. 22, February 12, 2025, Primary document; 2026 proxy, pay-versus-performance pp. 61–62, Primary document. ↩
- T-Mobile stock-performance graphs, Item 5: 2019 Form 10-K, p. 28, February 6, 2020, Primary document; 2024 Form 10-K, p. 29, January 31, 2025, Primary document; 2025 Form 10-K, p. 29, February 11, 2026, Primary document. ↩
- AT&T, 2025 Form 10-K, February 9, 2026, consolidated income/cash-flow statements and capital-investment reconciliation: Primary document. Cash capital expenditure $20.842 billion; including vendor-financing payments $22.023 billion; revenue $125.648 billion. ↩
- Verizon, 2025 Form 10-K, February 17, 2026, consolidated income/cash-flow statements: Primary document. Cash capital expenditure $17.011 billion; revenue $138.191 billion. ↩
- T-Mobile, 2025 Form 10-K, February 11, 2026, consolidated income/cash-flow statements: Primary document. Cash capital expenditure $9.955 billion; revenue $88.309 billion. ↩
- Elliott Management, original letter to AT&T’s board, September 9, 2019, pp. 4–5 and 15–19; free mirror of the authored primary document: Primary document. ↩
- AT&T, October 28, 2019, Exhibit 99.1, three-year capital-allocation plan and financial outlook: Primary document. ↩
- AT&T, Rule 425 communication filed June 1, 2021, pp. 3–5, strategic rationale for the WarnerMedia spin-off and management’s transaction-value argument: Primary document. ↩
- AT&T, 2017 proxy, filed March 10, 2017, Summary Compensation Table, p. 70, Stephenson 2014–2016: Primary document. ↩
- AT&T, 2020 proxy, filed March 11, 2020, Summary Compensation Table, p. 65, Stephenson 2017–2019: Primary document. ↩
- AT&T, 2021 proxy, filed March 11, 2021, p. 49, long-term award realization; p. 60, Summary Compensation Table; compensation discussion, salary waiver and incentive outcome: Primary document. ↩
- AT&T, 2026 proxy, pp. 42 and 49–50, incentive outcomes; p. 57, Summary Compensation Table; p. 73, pay-versus-performance: Primary document. The accompanying compensation CSV keeps observations from each source year. ↩
- AT&T, fourth-quarter 2024 supplemental cash-flow reconciliation, January 27, 2025, cash-tax rows: Primary document; fourth-quarter 2025 reconciliation, January 28, 2026: Primary document; Analyst and Investor Day non-GAAP reconciliations, December 3, 2024, p. 1 cash-tax estimation footnote: Primary document. ↩
Supporting material
- Excel model ↗Sourced inputs, live calculations and reported outputs.
- Source and model data (CSV collection) ↗Data tables, source references and calculation exports.
- Source register ↗Download as CSV.