Texas business
What Texas bank Call Reports show about balance-sheet risk
Commercial real estate concentration and securities valuation gaps fell after March 2023. The noncurrent loan share rose.

By June 2026, Texas banks’ net securities valuation gap had fallen by more than half from March 2023. Fewer banks crossed commercial real estate concentration thresholds, while a larger share of loans were noncurrent. The banks with the largest exposures differ across measures.
The Texas census shows three changes.
- 61 of 349 insured banks, or 17.48%, meet at least one of the model’s CRE concentration screens, compared with 97 of 387, or 25.06%, in March 2023.
- The net amortized-cost-to-fair-value gap on AFS and HTM securities is $20.079 billion, compared with $42.644 billion in March 2023. Relative to aggregate tangible equity, it fell from 69.30% to 27.18%.
- Noncurrent loans increased to $3.061 billion, or 0.7849% of gross loans, from $2.217 billion, or 0.5095%, in March 2023. FDIC data give 0.7903% for June 2026 because of a difference in TransPecos Banks’ reported balance.data, audit
The highest current CRE-to-capital ratio belongs to State Bank of Texas in Irving. The highest construction ratio belongs to Texas Bank in Henderson. TrustTexas Bank in Cuero has the largest securities-gap-to-tangible-equity ratio, but its gap is entirely AFS and already affects reported equity. TIB in Farmers Branch has the largest uninsured-deposit share. Texas Exchange Bank in Crowley has the largest brokered-deposit share. Monet Bank in Plano has the largest FHLB-advances-to-assets ratio and reported noncurrent-loan ratio. These rankings use June 30, 2026 Call Reports.data
In the nationwide December 2022 comparison, SVB, Signature and First Republic ranked 9th, 16th and 79th nationally on uninsured deposits, using the defined reporting basis. None met the complete CRE concentration screen. First Republic ranked only 2,003rd on the securities-gap ratio; its much larger disclosed fair-value shortfall was in loans. A narrow securities or CRE screen cannot stand in for a full balance-sheet analysis.backtest, frb
The downloadable tables link each ranked bank to its filing. Construction exposure is a starting point for reviewing collateral and maturity. Securities marks and uninsured or brokered deposits raise questions about liquidity and replacement funding. Noncurrent loans point to borrowers and collateral that warrant a closer look.
What “every Texas bank” means
The core census includes every FFIEC Call Report filer whose reported regulatory main office was in Texas in that quarter. It contains 11,830 bank-quarter observations, 446 filers and 30 quarters, from March 2019 through June 2026. Earlier 2016–2018 observations supply the three-year CRE growth comparisons; they are not presented as additional quarters in the requested historical panel.data
At the latest date there are 352 Texas filers: 349 FDIC-insured banks and three uninsured specialty institutions. All remain in the data. Rankings and statewide aggregates use the 349 insured banks, which report $804.404 billion of assets. The data flag the three specialty institutions and exclude them from insured-bank comparisons. Names are accompanied by city and FDIC certificate number because several unrelated banks have similar names.
USAA needs special treatment. Its corporate headquarters are in San Antonio, but its regulatory home office is Phoenix. USAA’s June 2026 capital disclosure states both locations. The workbook and a 30-quarter CSV therefore include USAA Federal Savings Bank, certificate 32188, as a corporate-headquarters supplement. It is not added to the regulatory-Texas denominator. In June 2026, the supplement reports $106.188 billion of assets, a 69.90% securities-gap-to-tangible-equity ratio, a 5.19% uninsured-deposit share and a 1.07% noncurrent-loan ratio.usaa
Conversely, Sunflower Bank belongs in the Texas regulatory census even though its parent, FirstSun, is headquartered elsewhere. FirstSun’s 2025 annual report records Sunflower’s main-office move to Dallas in November 2023. Its April 2026 acquisition of First Foundation also changes what a same-bank growth comparison contains.sunflower
Acquisitions changed the membership of the Texas census. Relevant examples are SouthState’s acquisition of Independent on January 1, 2025, Huntington’s acquisition of Veritex on October 20, 2025, and Fifth Third’s acquisition of Comerica on February 1, 2026. The quarterly data follow the legal-bank identifiers and reported offices, and preserve earlier observations for institutions that subsequently merged.mergers
“Latest” means the latest complete common bulk dataset available at the research cutoff. The FFIEC selector and FDIC financials dataset supplied June 2026. FFIEC says initial quarterly bulk files begin 45 calendar days after quarter-end and are subsequently regenerated for amendments. Individual September reports and September holding-company 10-Qs can already exist. Those later company filings inform context here; they do not turn a June bank census into a complete September census.timing
| Measure | March 31, 2019 | March 31, 2023 | June 30, 2026 |
|---|---|---|---|
| Insured banks in the quarterly Texas census | 432 | 387 | 349 |
| Banks meeting either complete CRE screen | 57 | 97 | 61 |
| Median CRE / concentration capital | 112.16% | 145.59% | 137.78% |
| Median construction / concentration capital | 42.79% | 57.18% | 50.78% |
| Median securities gap / tangible equity | 0.63% | 20.42% | 6.97% |
| Pooled noncurrent loans / gross loans | 0.7690% | 0.5095% | 0.7849% |
| Median annualized quarterly NIM | 3.93% | 3.71% | 4.15% |
Source: model calculations from FFIEC schedules and FDIC identities and quarterly income fields. “Pooled” divides summed numerators by summed denominators; “median” describes the middle bank. These are different statistics.data, income
The changing population matters. Acquisitions, charter combinations and office moves can change statewide totals without a corresponding change at every continuing bank. The matched comparison follows 346 bank identities headquartered in Texas at both March 2023 and June 2026. For that cohort, the median individual change in CRE/capital is −3.28 percentage points; the median individual change in the securities-gap ratio is −12.52 points. The noncurrent-loan ratio rises by a median 0.0549 points, using 345 banks with valid loan denominators. These continuing-bank results support the direction of the broader findings, while still including acquisitions within surviving charters.data
The change in securities gaps can be traced across continuing banks, exits and entrants. The 346 continuing identities had $32.410136 billion of securities gaps in March 2023 and $20.034067 billion in June 2026. Thus, the decline is visible within that matched group. The 41 banks that leave the Texas census contributed $10.233664 billion of the March 2023 total; the three entrants contribute $45.065 million to the June 2026 total. The exiting group includes March 2023 gaps of approximately $5.878 billion at USAA and $2.724 billion at Comerica. An exit can reflect a regulatory-office move, merger or other change in the census; it does not mean that a securities loss was realized or disappeared economically.data
| Securities-gap decomposition | March 2023 | June 2026 |
|---|---|---|
| 346 identities present in both Texas censuses | $32.410136bn | $20.034067bn |
| 41 identities present only in the earlier Texas census | $10.233664bn | Outside the later census |
| Three identities present only in the later Texas census | Outside the earlier census | $0.045065bn |
| Complete quarterly Texas census | $42.643800bn | $20.079132bn |
Source: matched legal-bank identifiers in the supplied quarterly model. This decomposition tracks census membership; it does not restate the financial statements of merged predecessors into surviving banks.data
Finding 1: CRE concentration has eased, but construction remains the more common screen
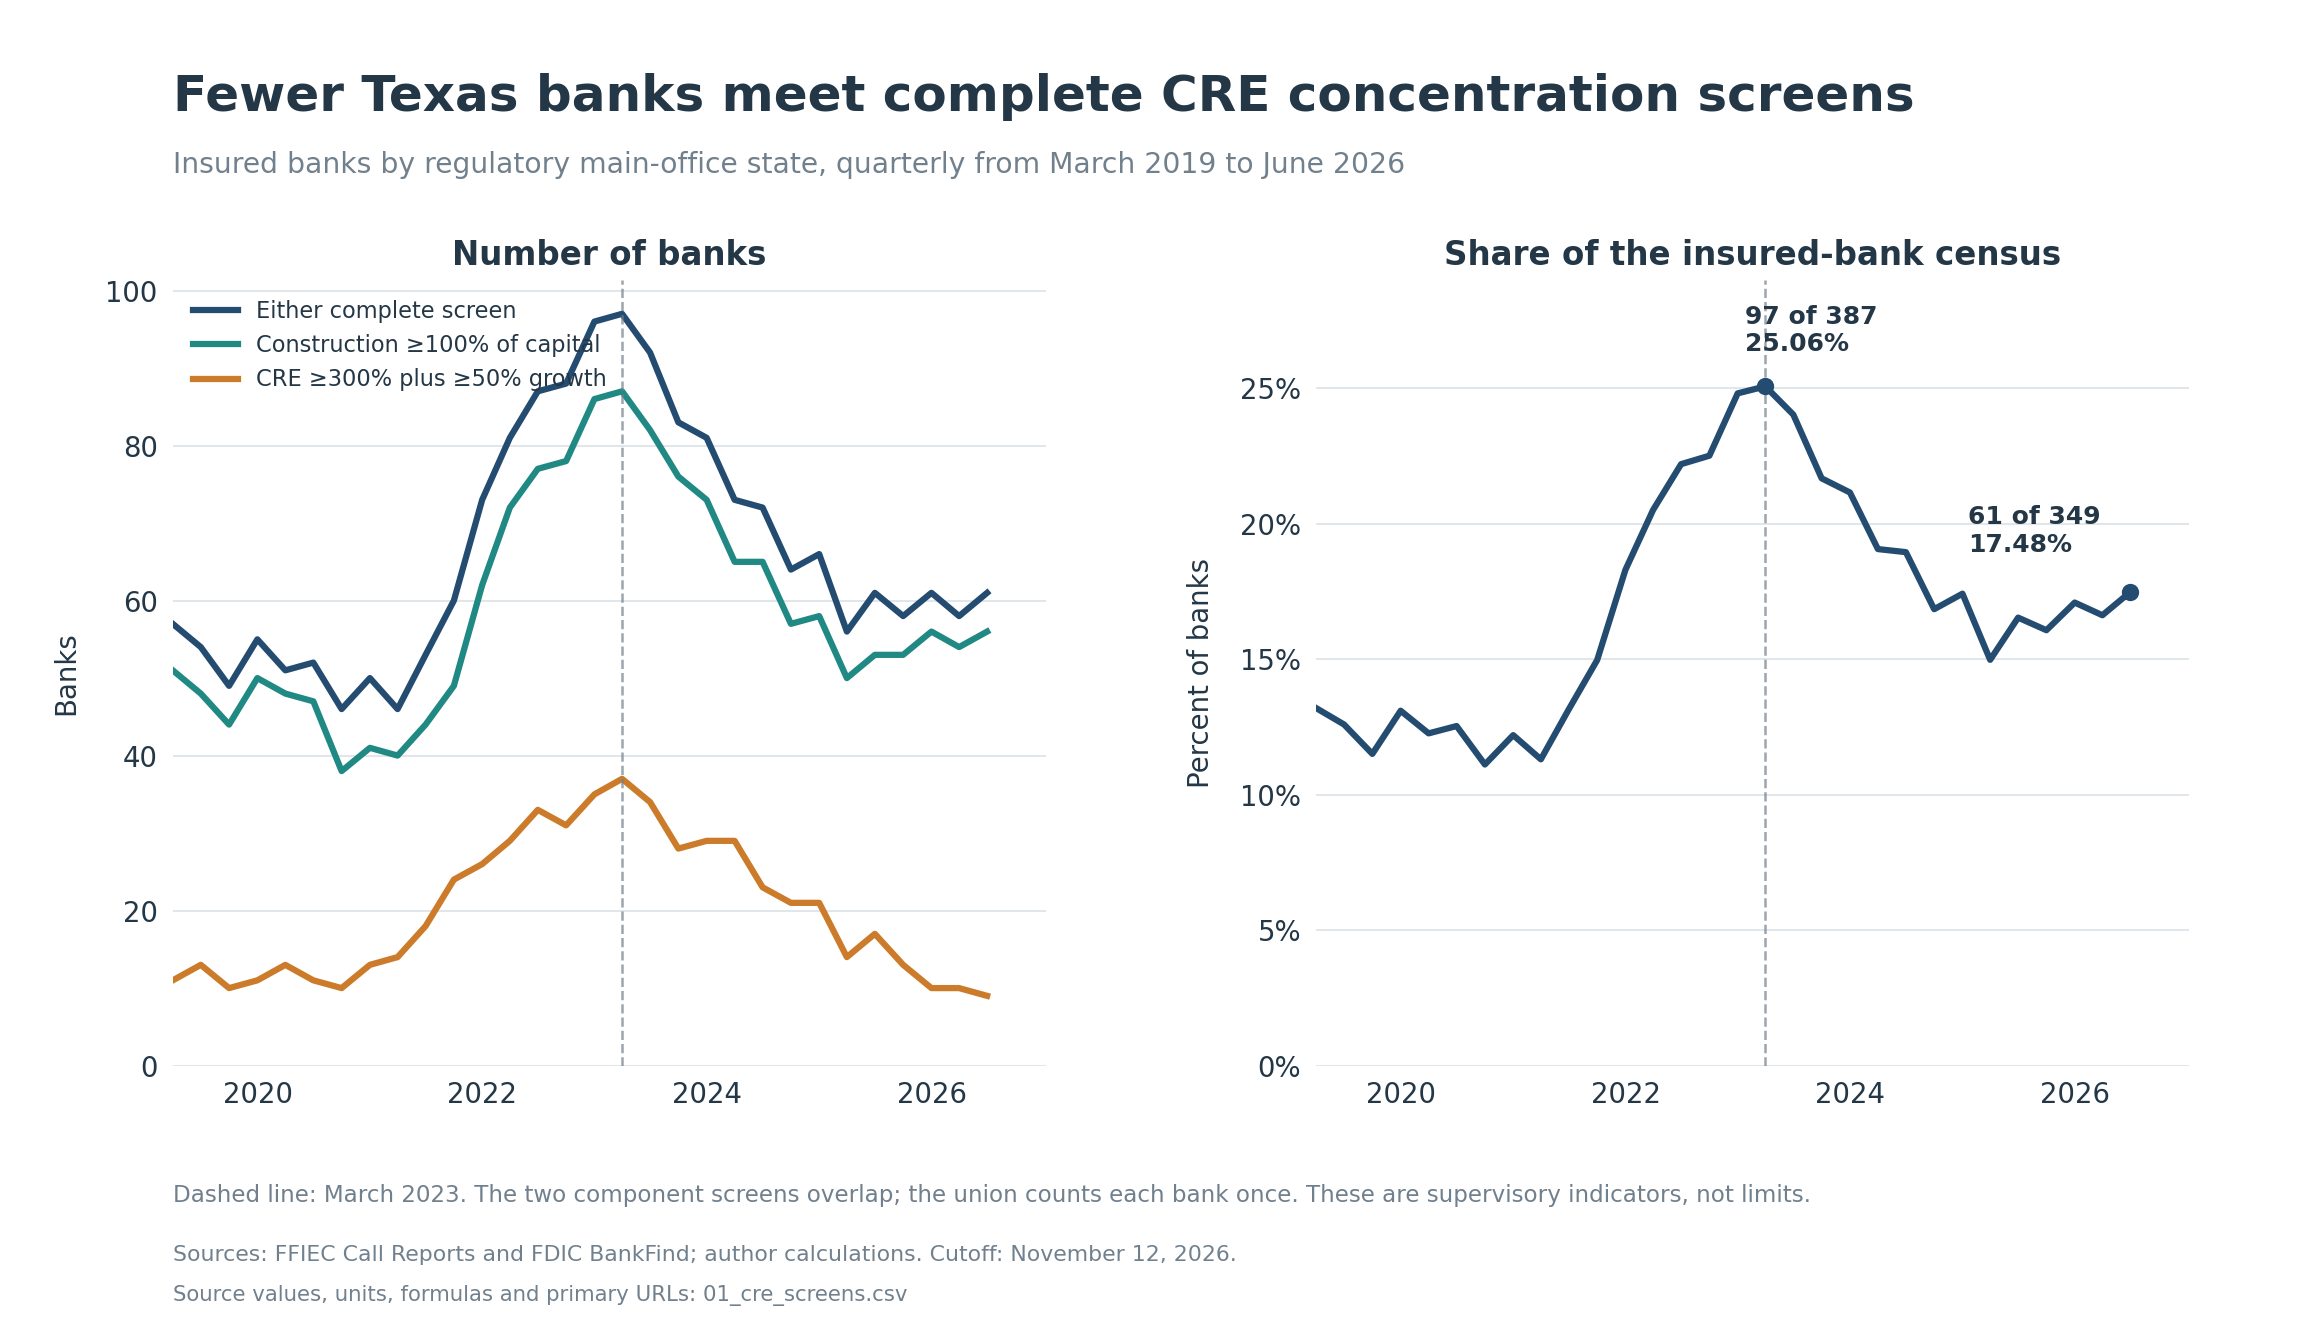
The final 2006 interagency guidance identifies two high-level screens: construction, land-development and other land loans of at least 100% of capital; or CRE loans of at least 300% of capital together with at least 50% CRE growth over 36 months. Supervisors use these thresholds to decide where further analysis is warranted.cre
The agencies shifted the concentration denominator from total risk-based capital to Tier 1 capital plus the loan-and-lease allowance in March 2020. The FFIEC Uniform Bank Performance Report (UBPR) also removes overlapping CECL phase-in capital where applicable. This model uses the unadjusted sum of Tier 1 capital and the loan-and-lease allowance throughout, so historical ratios for banks phasing in CECL can differ from their official UBPR ratios. The workbook includes an alternative calculation using the original total-risk-based-capital denominator where available.capital
The CRE numerator includes construction, multifamily, nonowner-occupied nonfarm nonresidential loans, and reported loans financing CRE activity that are not secured by real estate. The concentration measure excludes loans secured by owner-occupied commercial property. FDIC’s LNCOMRE captures the financing component alone.creformula
At June 2026, 56 banks meet the construction screen and nine meet the CRE-plus-growth screen. Four meet both, giving the union of 61. 33 banks have CRE balances above 300% of capital. It would be incorrect to call all 33 complete CRE-growth-screen cases: only nine also satisfy the required growth condition.
The grouping is explicit. There are 52 construction-only cases, five CRE-and-growth-only cases and four cases meeting both. Ten additional banks exceed 300% CRE/capital, have growth below 50%, and do not meet the construction screen. The remaining 278 are below both complete screens. These groups describe the numerical tests; they do not substitute for supervisors’ bank-specific assessment.
| Bank; city; FDIC certificate | CRE / capital | Construction / capital | CRE growth over 36 months | Complete screen |
|---|---|---|---|---|
| State Bank of Texas; Irving; 27074 | 460.80% | 32.25% | 19.33% | Neither |
| UBank; Huntington; 18344 | 440.24% | 183.24% | 80.57% | Both |
| Texas Bank; Henderson; 21074 | 361.72% | 194.93% | 13.85% | Construction |
| Prosperity Bank; El Campo; 16835 | 174.75% | 68.51% | 13.48% | Neither |
| Frost Bank; San Antonio; 5510 | 125.85% | 53.61% | 5.38% | Neither |
| Texas Capital Bank; Dallas; 34383 | 124.93% | 23.45% | −11.74% | Neither |
| Charles Schwab Bank; Westlake; 57450 | 0.79% | 0.00% | −91.53% | Neither |
June 30, 2026; the model’s concentration-capital denominator. Full component balances, ranks and source links are in the downloadable table.data
State Bank of Texas illustrates why the full rule matters. Its $2.069 billion of CRE divided by $448.910 million of concentration capital gives the state’s highest ratio. That ratio has fallen from 546.96% in March 2023 to 460.80%. Its 19.33% three-year growth is below the second test’s 50% condition, and its construction ratio is below 100%. This does not make the exposure unimportant; it changes the correct description of the finding.
UBank presents a different combination: $452.280 million of CRE against $102.735 million of concentration capital, with both substantial construction and rapid three-year balance growth. Texas Bank in Henderson leads the construction ranking even though its construction ratio has declined from 236.15% in March 2023. A bank can remain highly concentrated while its measured ratio improves.
At the low end, Charles Schwab Bank’s 0.79% CRE/capital ratio reflects a very different asset mix. Several other large specialty banks report little or no CRE. This ratio compares exposure. Underwriting quality requires loan-level information.
The original 2006 capital denominator remains available for 185 of the 349 latest banks. The other 164 elect the community bank leverage ratio framework and lack a reported total-risk-based-capital amount in this model. Their sensitivity cells remain blank. Substituting zero, Tier 1 alone or an invented Tier 2 amount would produce false precision. For advanced-approaches banks in the national panel, the sensitivity uses the capital amount associated with the binding total-capital ratio.capital
Finding 2: Apartments are measurable; statewide office exposure remains unknown
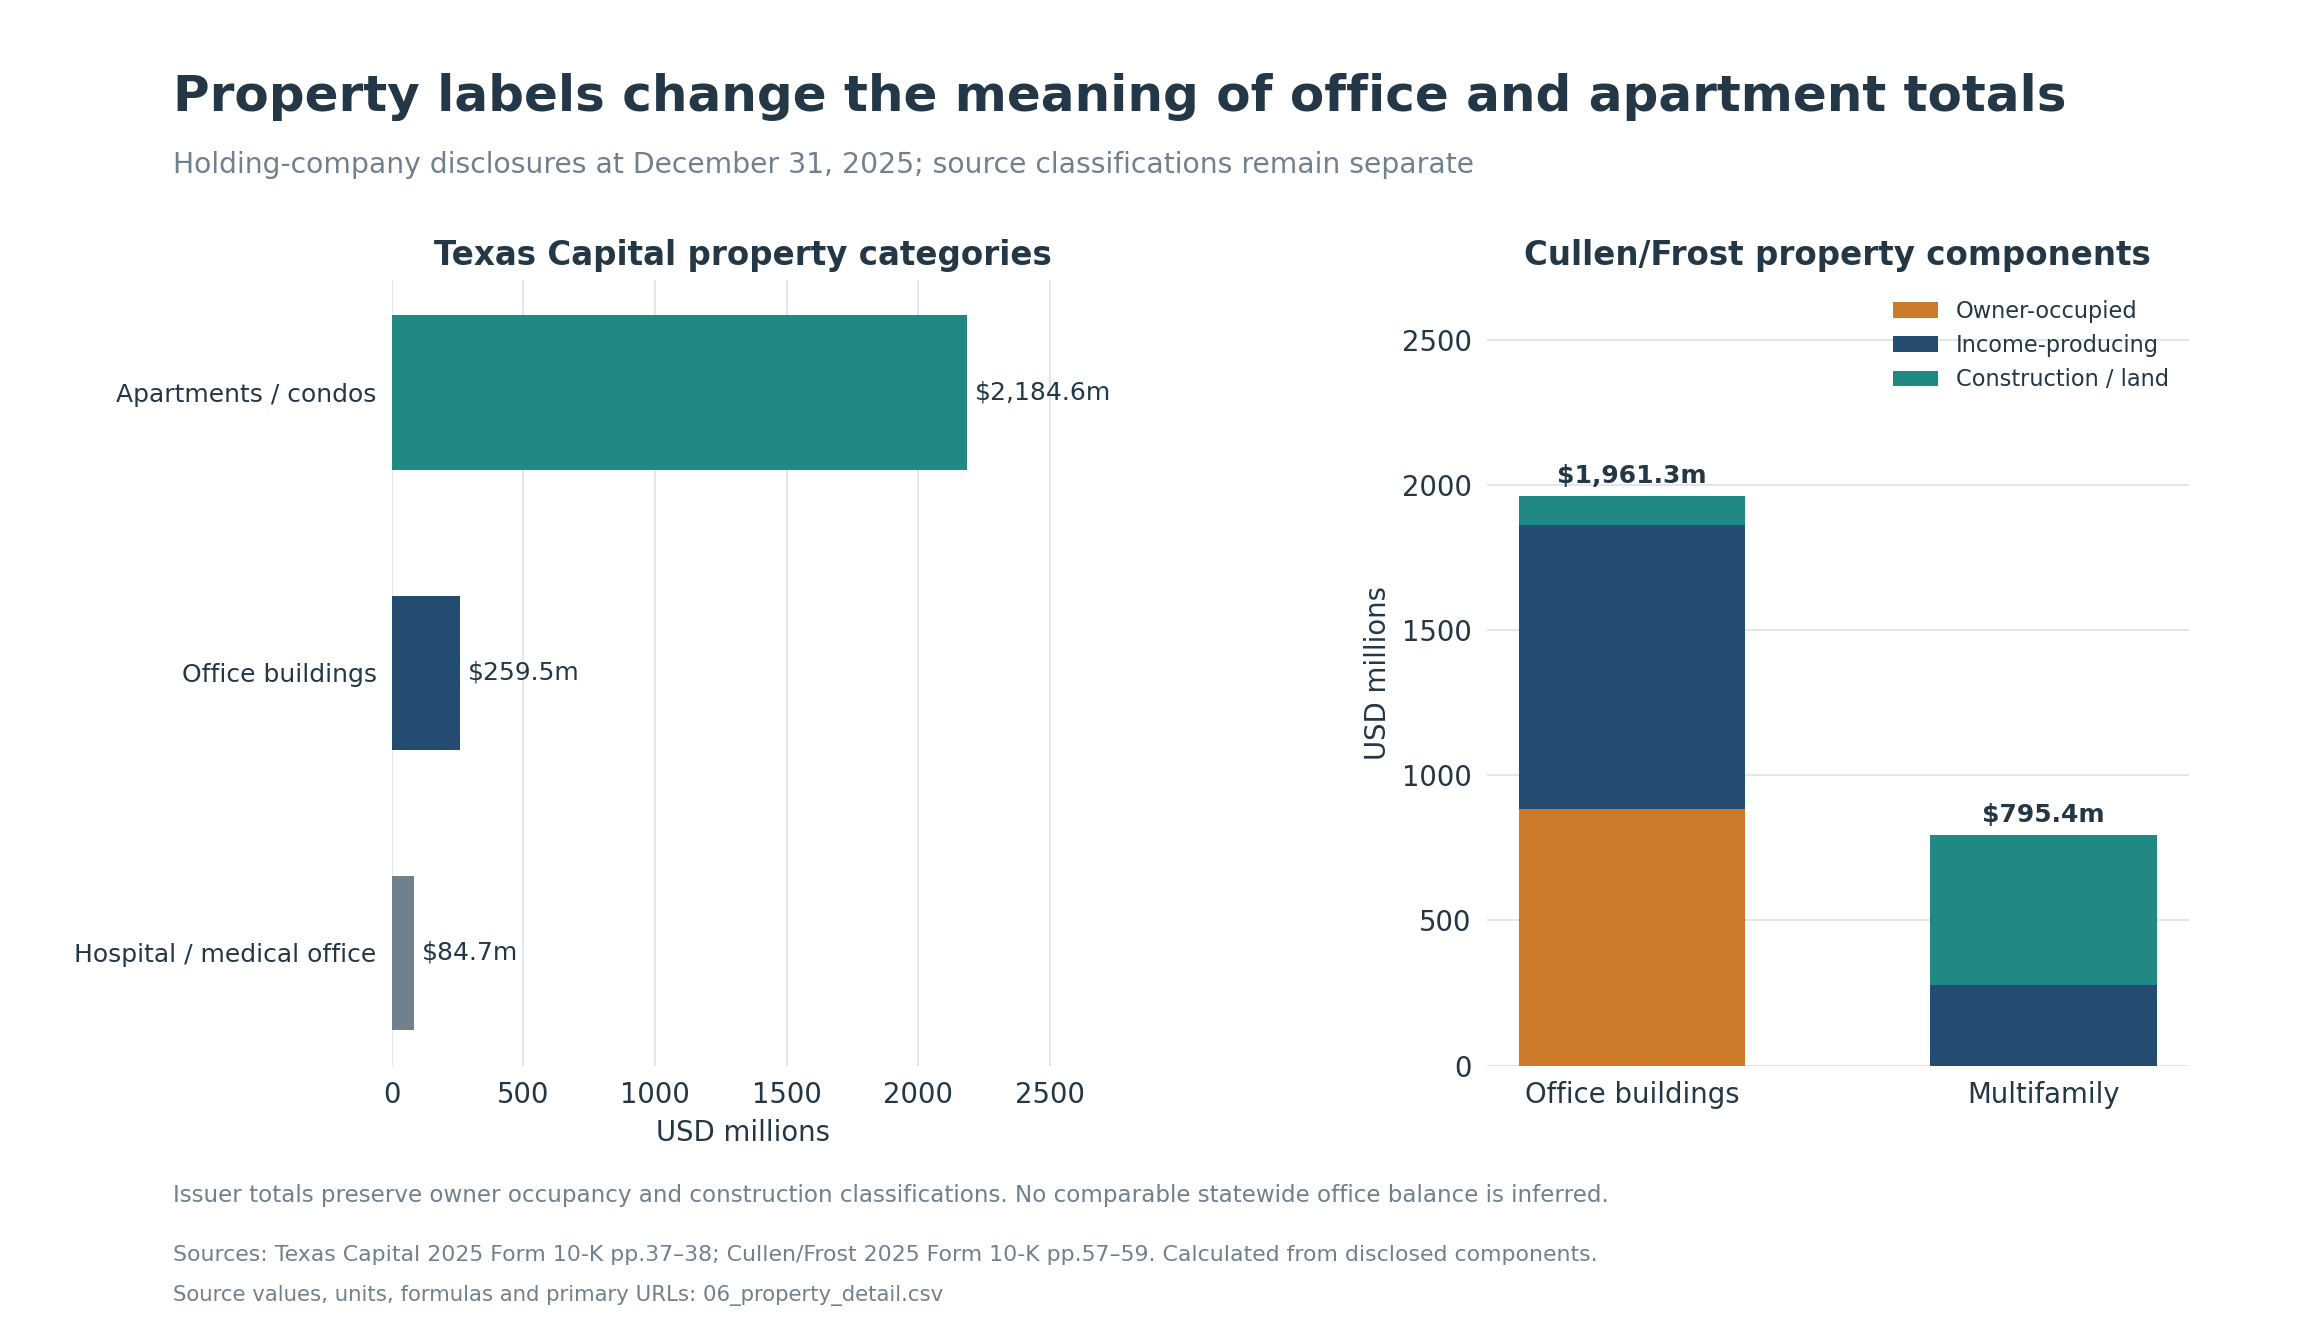
The Call Report gives a comparable multifamily category, generally property with five or more dwelling units. It does not supply one uniform office-loan total across this universe. Multifamily also does not capture every apartment construction loan: construction remains in the construction categories. A blank statewide office field marks an unknown exposure.forms
Sunflower has the highest reported multifamily-to-concentration-capital ratio in the latest Texas census: 138.12%, from $2.613 billion of multifamily loans. Titan Bank in Mineral Wells follows at 85.46%, and UBank at 82.15%. Sunflower’s acquisition history is essential context for that ranking and for its three-year balance growth.data, sunflower
Selected holding-company annual reports add property detail where management discloses it. The table shows the annual disclosures for the two holding companies.
| Issuer disclosure at December 31, 2025 | Calculated exposure | Scope |
|---|---|---|
| Texas Capital apartments/condominiums | $2.185bn; 40.49% of its disclosed $5.396bn CRE table | Issuer property classification |
| Texas Capital office | $259.507m; 4.81% of the same table | Issuer has a medical-office category |
| Cullen/Frost income-producing office plus office construction | $1.077bn | $977.374m completed plus $100.100m construction |
| Cullen/Frost all office buildings | $1.961bn | Includes $883.804m owner-occupied |
| Cullen/Frost multifamily | $795.446m | Includes $518.606m construction |
Source: Texas Capital 2025 Form 10-K, pp. 37–38; Cullen/Frost 2025 Form 10-K, pp. 57–59. Percentages use the unrounded underlying amounts.property
These disclosures answer different questions. Calling all of Frost’s $1.961 billion office-building category income-producing office would add owner-occupied loans excluded from the supervisory CRE concept. Calling its $795.446 million multifamily total completed apartment loans would add construction. Office/warehouse and medical-office categories also differ.
A property-level assessment would need property-level maturities, occupancy, debt-service coverage, current collateral values and recourse. Those details are not consistently observable from Call Reports, so the model does not infer them from a bank’s name, Texas address or aggregate CRE balance.
Finding 3: Securities gaps fell sharply, but “equity after losses” requires an accounting correction
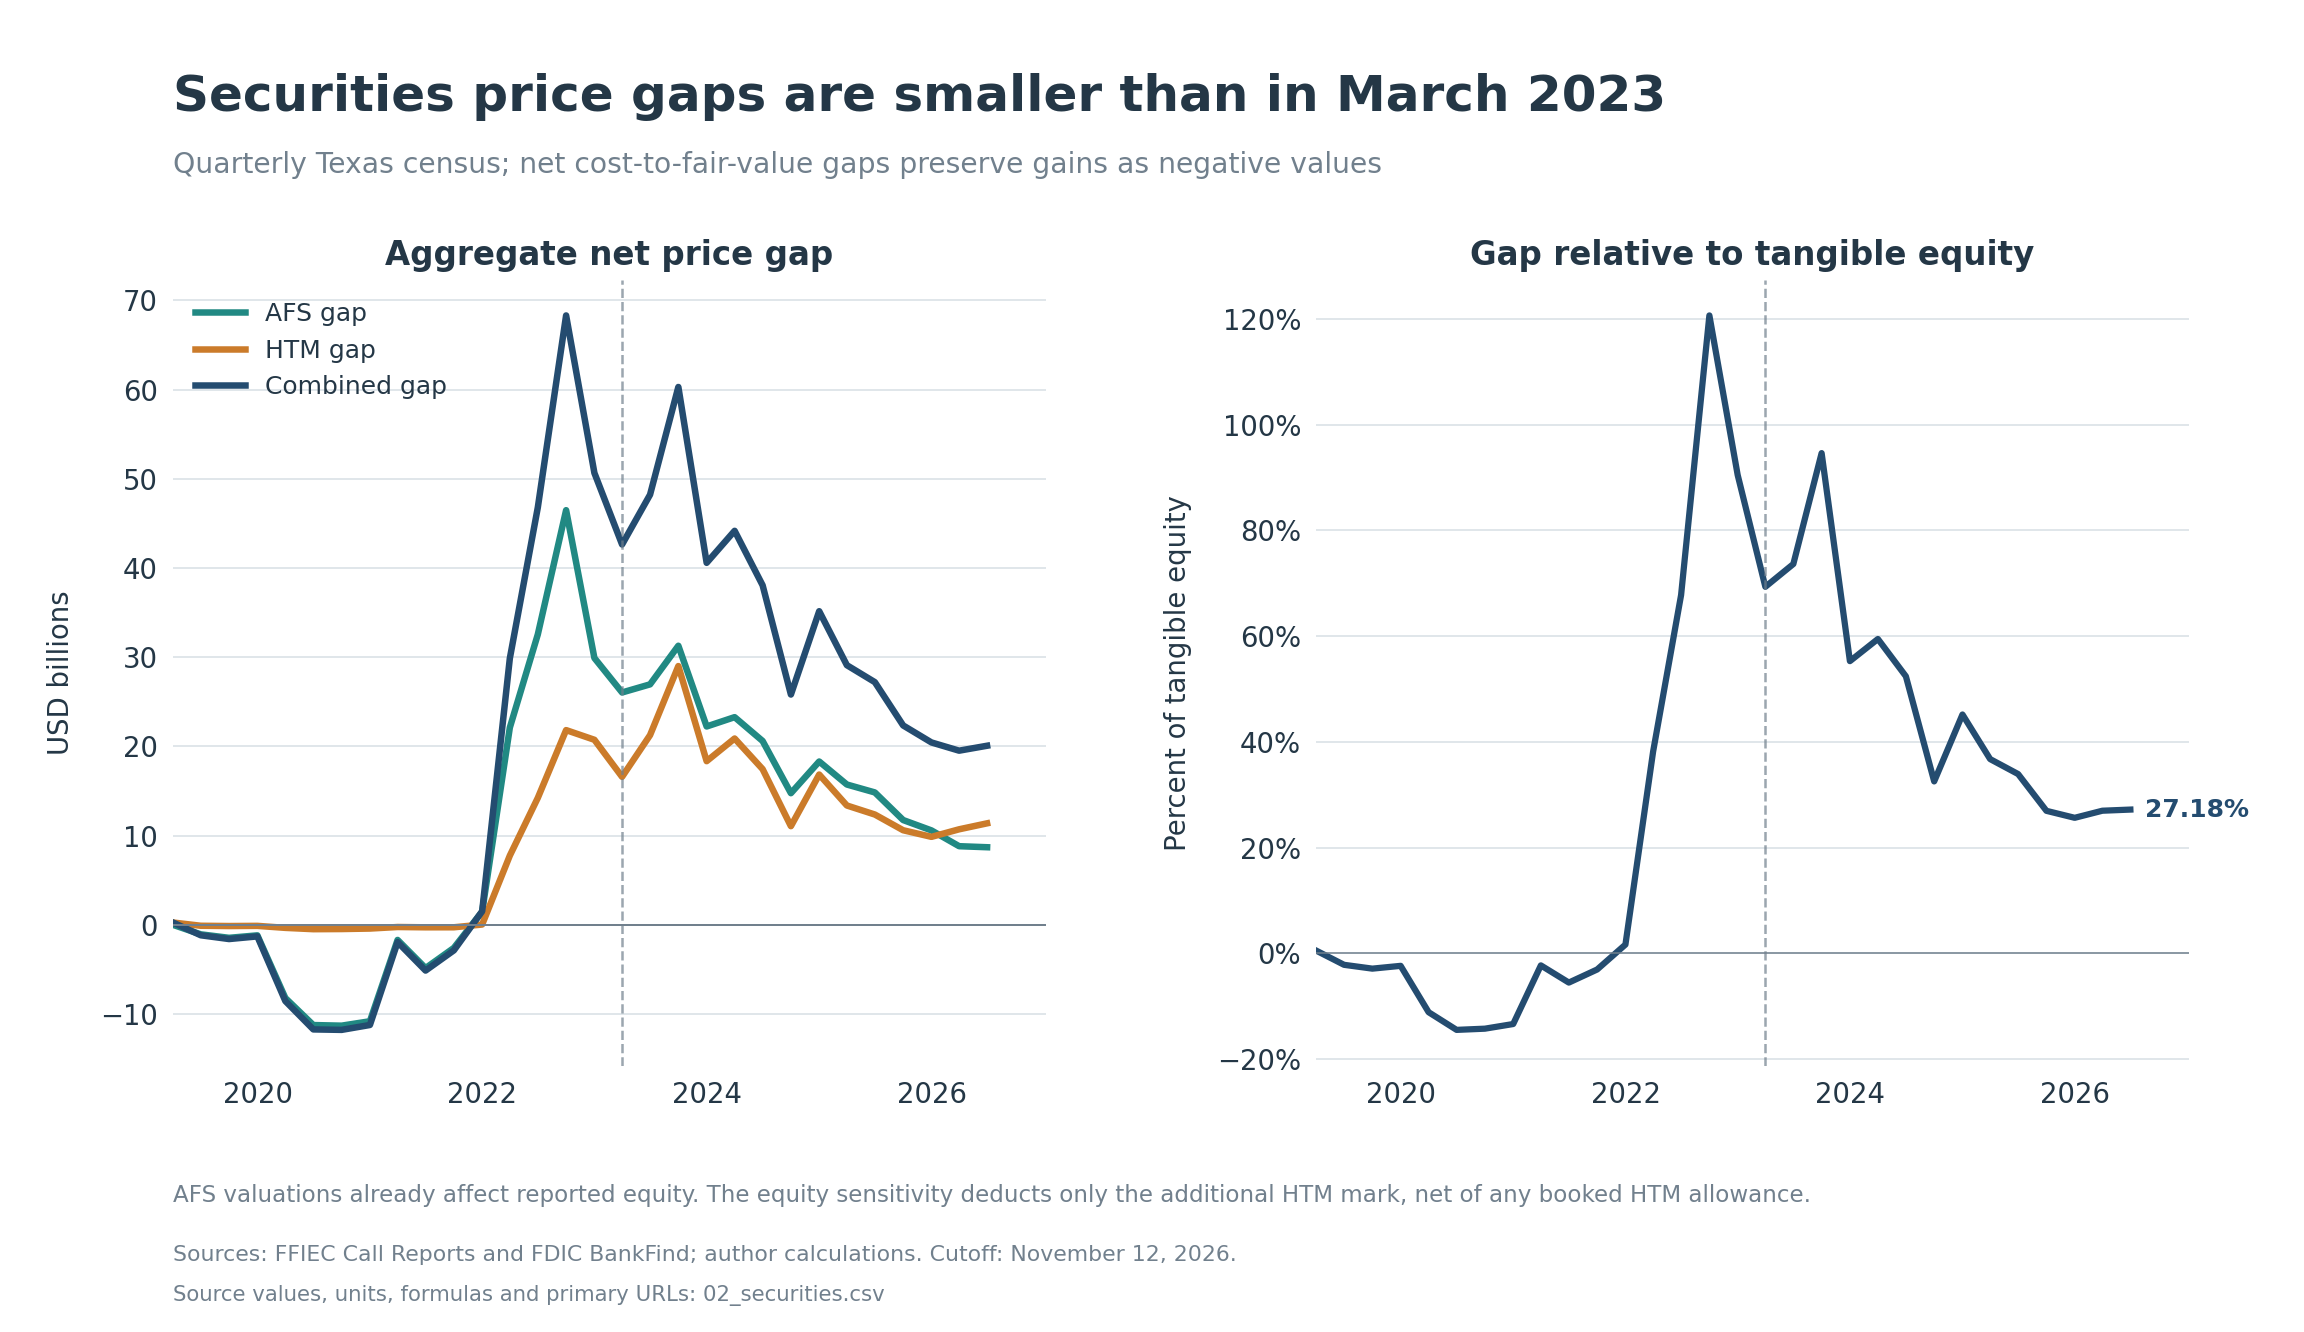
The latest $20.079 billion statewide securities gap consists of $8.699 billion AFS and $11.380 billion HTM, measured as amortized cost less fair value and netting gains against losses within those categories. This is a securities price-gap measure. It is not the same as a new charge to equity.data
AFS securities are already carried at fair value, with the relevant valuation effects reflected in reported equity. Deducting their gap from that equity again would double-count the adjustment. HTM securities require a different calculation: the incremental mark is their net carrying value, after any already-booked HTM allowance, less fair value.forms
This report defines tangible equity as reported bank equity less reported intangible assets. It includes preferred equity; a tangible-common-equity column subtracts preferred stock. Neither measure is a regulatory capital ratio.
The primary “equity after HTM losses” calculation is:
Tangible equity − max(HTM net carrying value − HTM fair value, 0).
The calculation grants no tax benefit. A sensitivity applies a 21% tax benefit to the incremental HTM mark. A bank’s ability to use that benefit depends on its tax position.
| Bank; FDIC certificate | AFS + HTM gap / tangible equity | Tangible equity | Additional HTM mark deducted | Tangible equity after mark |
|---|---|---|---|---|
| TrustTexas, Cuero; 28515 | 599.35% | $5.836m | $0 | $5.836m |
| First National Bank of Lake Jackson; 18895 | 307.12% | $6.436m | $0 | $6.436m |
| American National Bank of Texas, Terrell; 23474 | 83.36% | $303.001m | $0 | $303.001m |
| Charles Schwab Bank; 57450 | 66.82% | $18.079bn | $8.507bn | $9.572bn |
| Frost; 5510 | 29.97% | $3.970bn | $134.691m | $3.835bn |
| Prosperity; 16835 | 21.32% | $4.183bn | $891.755m | $3.292bn |
| Texas Capital; 34383 | 4.35% | $3.405bn | $75.512m | $3.330bn |
June 30, 2026. Dollar figures rounded for display; the spreadsheet reports amounts in $000.data
TrustTexas’s striking ratio comes from a $34.978 million AFS price gap against a small remaining tangible-equity denominator. It reports no additional HTM price gap to deduct. First National Bank of Lake Jackson is similar: its $19.766 million gap is AFS. Those facts do not erase the economic significance of the marks, but they rule out describing the same marks as an additional unrecognized equity loss.
At the low end, Texas Exchange Bank reports a small net securities gain, and Third Coast Bank also has a negative net gap. Negative means fair value exceeds the relevant amortized-cost aggregate; the exposure ranking preserves those negative values.
No bank in the latest 349-bank sample has negative tangible equity after the defined incremental pretax HTM adjustment. Eight did in the March 2023 Texas population. That is an accounting sensitivity result. It does not measure available cash, deposit behavior, collateral haircuts, loan fair values or the capacity to earn future income.
Schwab’s parent filings give a broader view across multiple bank subsidiaries. Its 2025 10-K identifies three bank subsidiaries. The June bank-level table above concerns Charles Schwab Bank alone. At the consolidated parent, recomputing the securities tables gives a combined net gap of $21.478 billion in March 2023 and $17.975 billion in September 2026. Bank-subsidiary FHLB borrowings in the parent’s disclosures declined from $45.6 billion to $2.0 billion between those dates. The later filing also reports that more than 80% of bank deposits were FDIC insured. These company disclosures provide later context alongside the common June bank snapshot.schwab
Finding 4: Uninsured deposits, brokered deposits and FHLB borrowing identify different funding structures
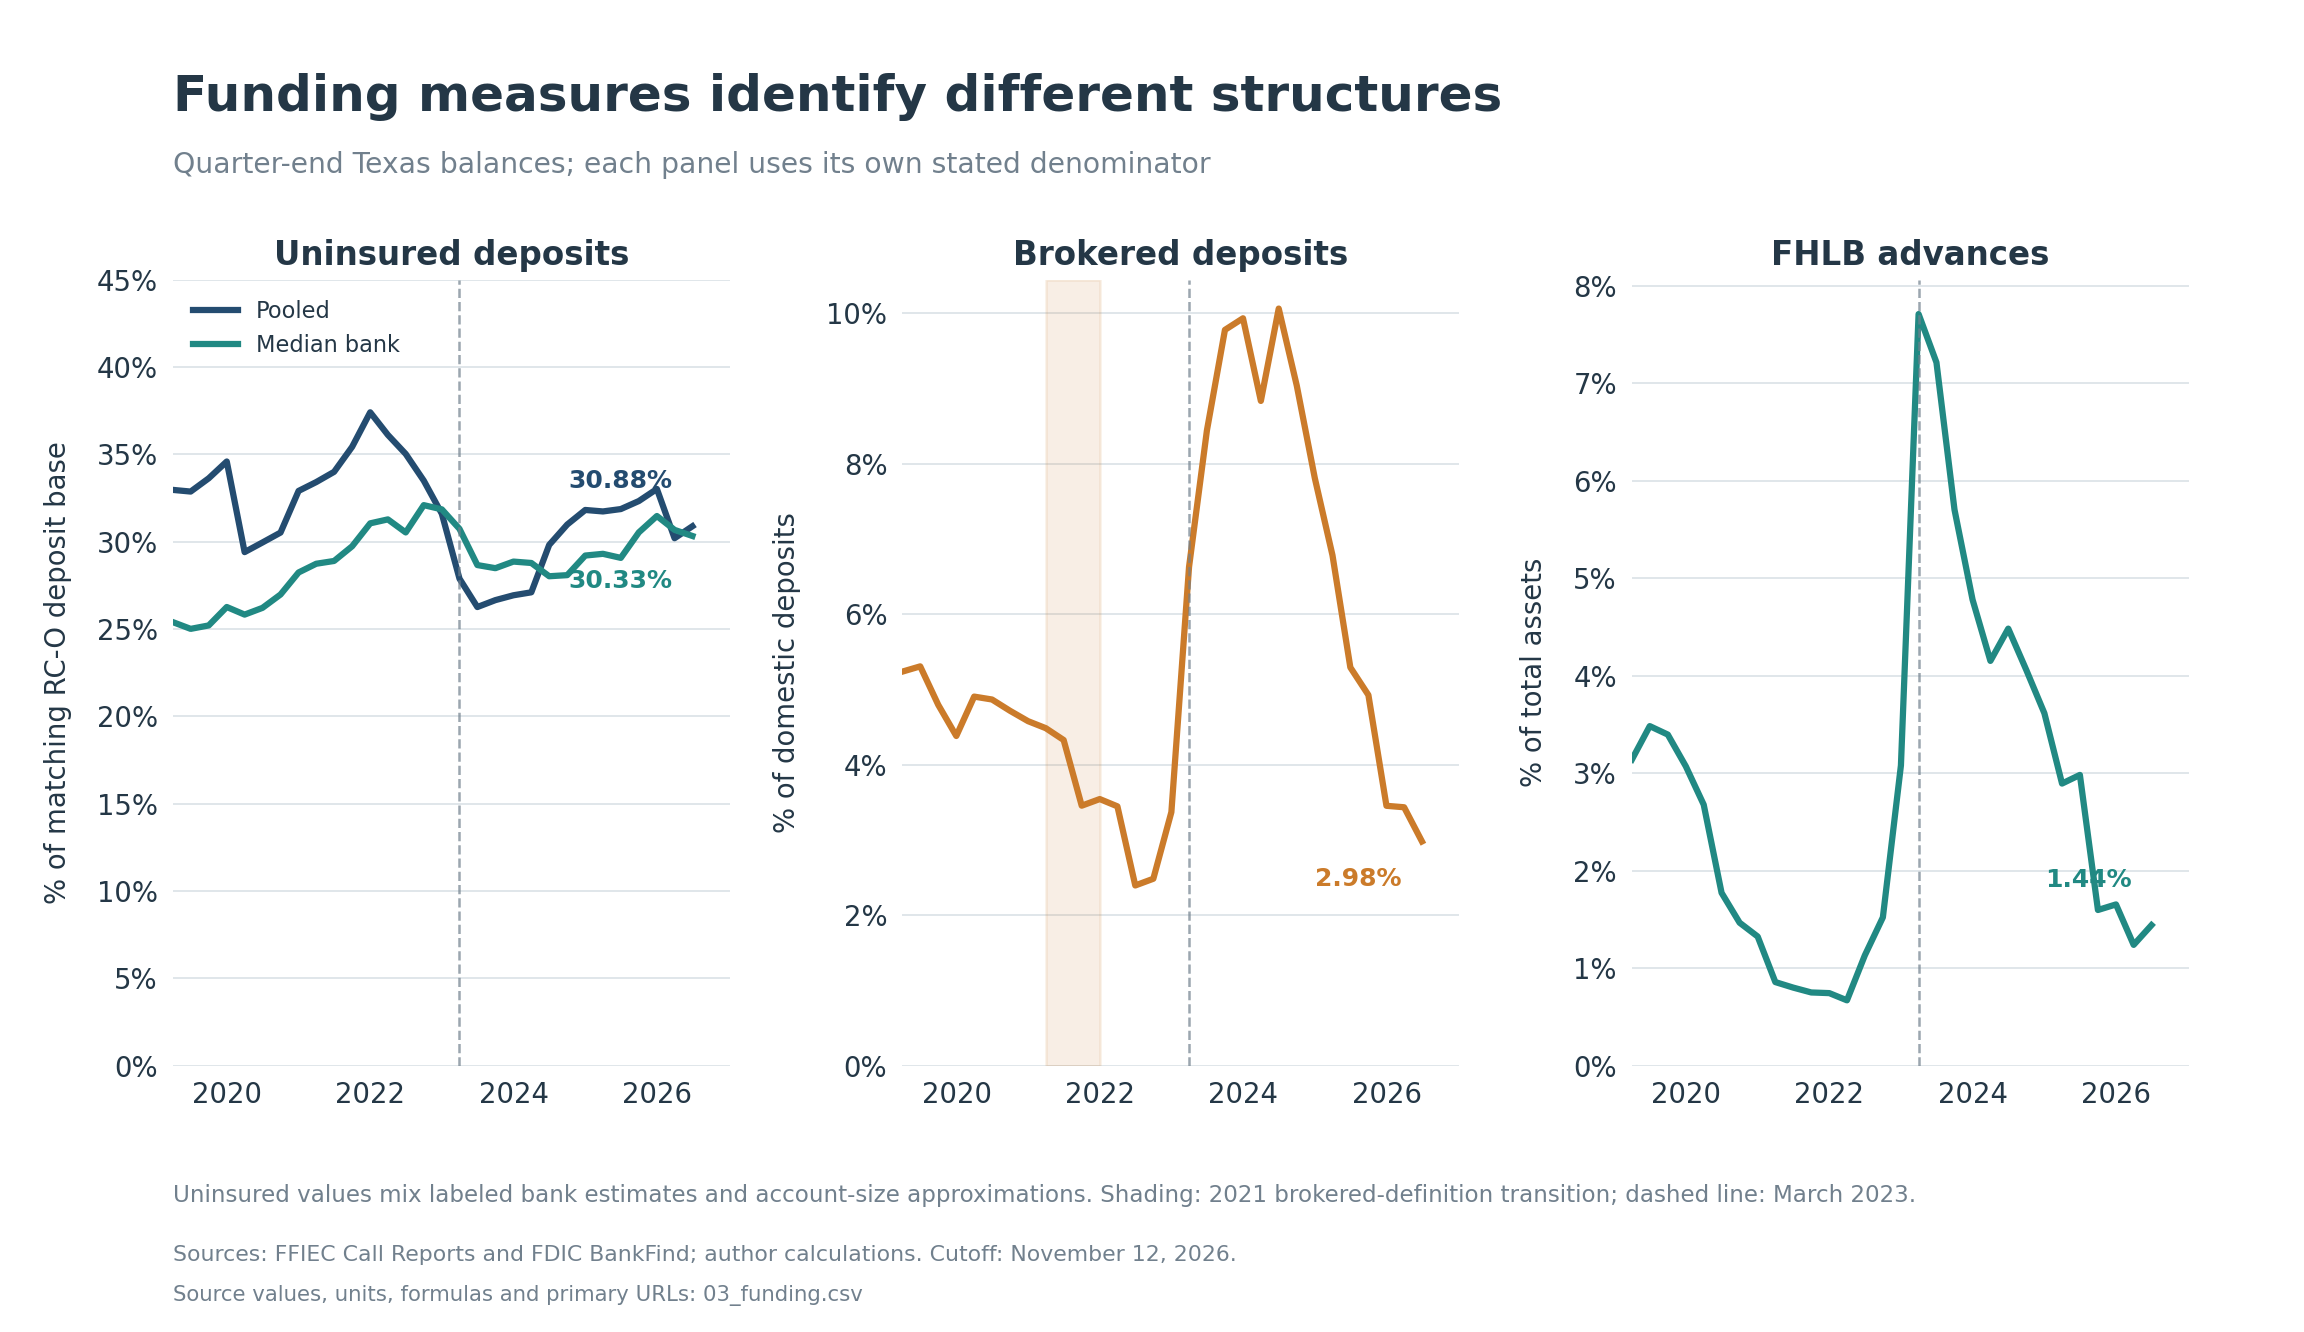
The latest pooled uninsured-deposit share is 30.88%, compared with 27.88% in March 2023. The median bank moves slightly in the opposite direction, from 30.73% to 30.33%. The difference is consistent with changing bank sizes and membership; a pooled measure gives larger deposit bases greater influence.data
Only 84 of the 349 latest banks provide the bank-reported uninsured estimate used here. For 265, the model uses an explicitly labeled large-account approximation. The estimate subtracts $250,000 per reported large account from the balances in the relevant account categories. It cannot perfectly reconstruct ownership categories, aggregation across accounts or pass-through coverage.uninsured
The primary denominator is deposit liabilities on the corresponding assessment-reporting basis, RC-O F236 minus F237. It includes items such as accrued interest and certain deposits not identical to the balance-sheet domestic-deposit total. Using the corresponding denominator avoids silently mixing different reporting bases. The resulting ratio uses assessable deposit liabilities.uninsured
| Bank; FDIC certificate | Uninsured / assessable deposits | Brokered / domestic deposits | FHLB advances / assets |
|---|---|---|---|
| TIB, Farmers Branch; 23647 | 91.45% | 0.00% | 0.00% |
| Frost; 5510 | 51.85% | 0.00% | 0.00% |
| Monet; 32574 | 48.69% | 38.65% | 31.64% |
| Texas Capital; 34383 | 37.60% | 11.42% | 1.04% |
| Charles Schwab Bank; 57450 | 19.04% | 3.39% | 0.20% |
| Texas Exchange; 20099 | 1.30% | 96.20% | 31.40% |
June 30, 2026. These example banks use bank-reported uninsured estimates. Brokered and FHLB measures have different denominators and must not be added to uninsured percentages.data
TIB’s uninsured share increased from 86.71% in March 2023 to 91.45%. Frost combines a high uninsured share with no reported brokered deposits or FHLB advances at the quarter-end. Texas Exchange combines a very low uninsured share with the highest brokered share. An insured deposit can still arrive through a brokered funding channel.
Statewide brokered deposits declined from 6.63% to 2.98% of domestic deposits between March 2023 and June 2026. FHLB advances declined from $84.934 billion to $11.592 billion, or from 7.71% to 1.44% of assets. The Call Report records the outstanding balance on the quarter-end date.
The longer brokered-deposit history crosses a definition change. The revised deposit-broker and primary-purpose framework became effective April 1, 2021, with full compliance by January 1, 2022. Some movement around 2021 may reflect reclassification. The March 2023–June 2026 comparison starts after this transition.brokered
The current-rule check also matters. The FDIC withdrew its 2024 proposed brokered-deposit revisions in 2025; a proposal should not be treated as an adopted reporting change. The June 3, 2026 technical correction states that it introduces no new substantive requirements. Those documents do not justify inventing another break in the observed series.brokeredcurrent
The next questions concern concentration within depositor groups, contractual maturity, collateral already pledged, available borrowing capacity and the price of replacement funds. Call Reports give balances at quarter-end. Withdrawal speed and replacement cost require funding and depositor details.
Finding 5: Credit deterioration is visible, with important outlier context
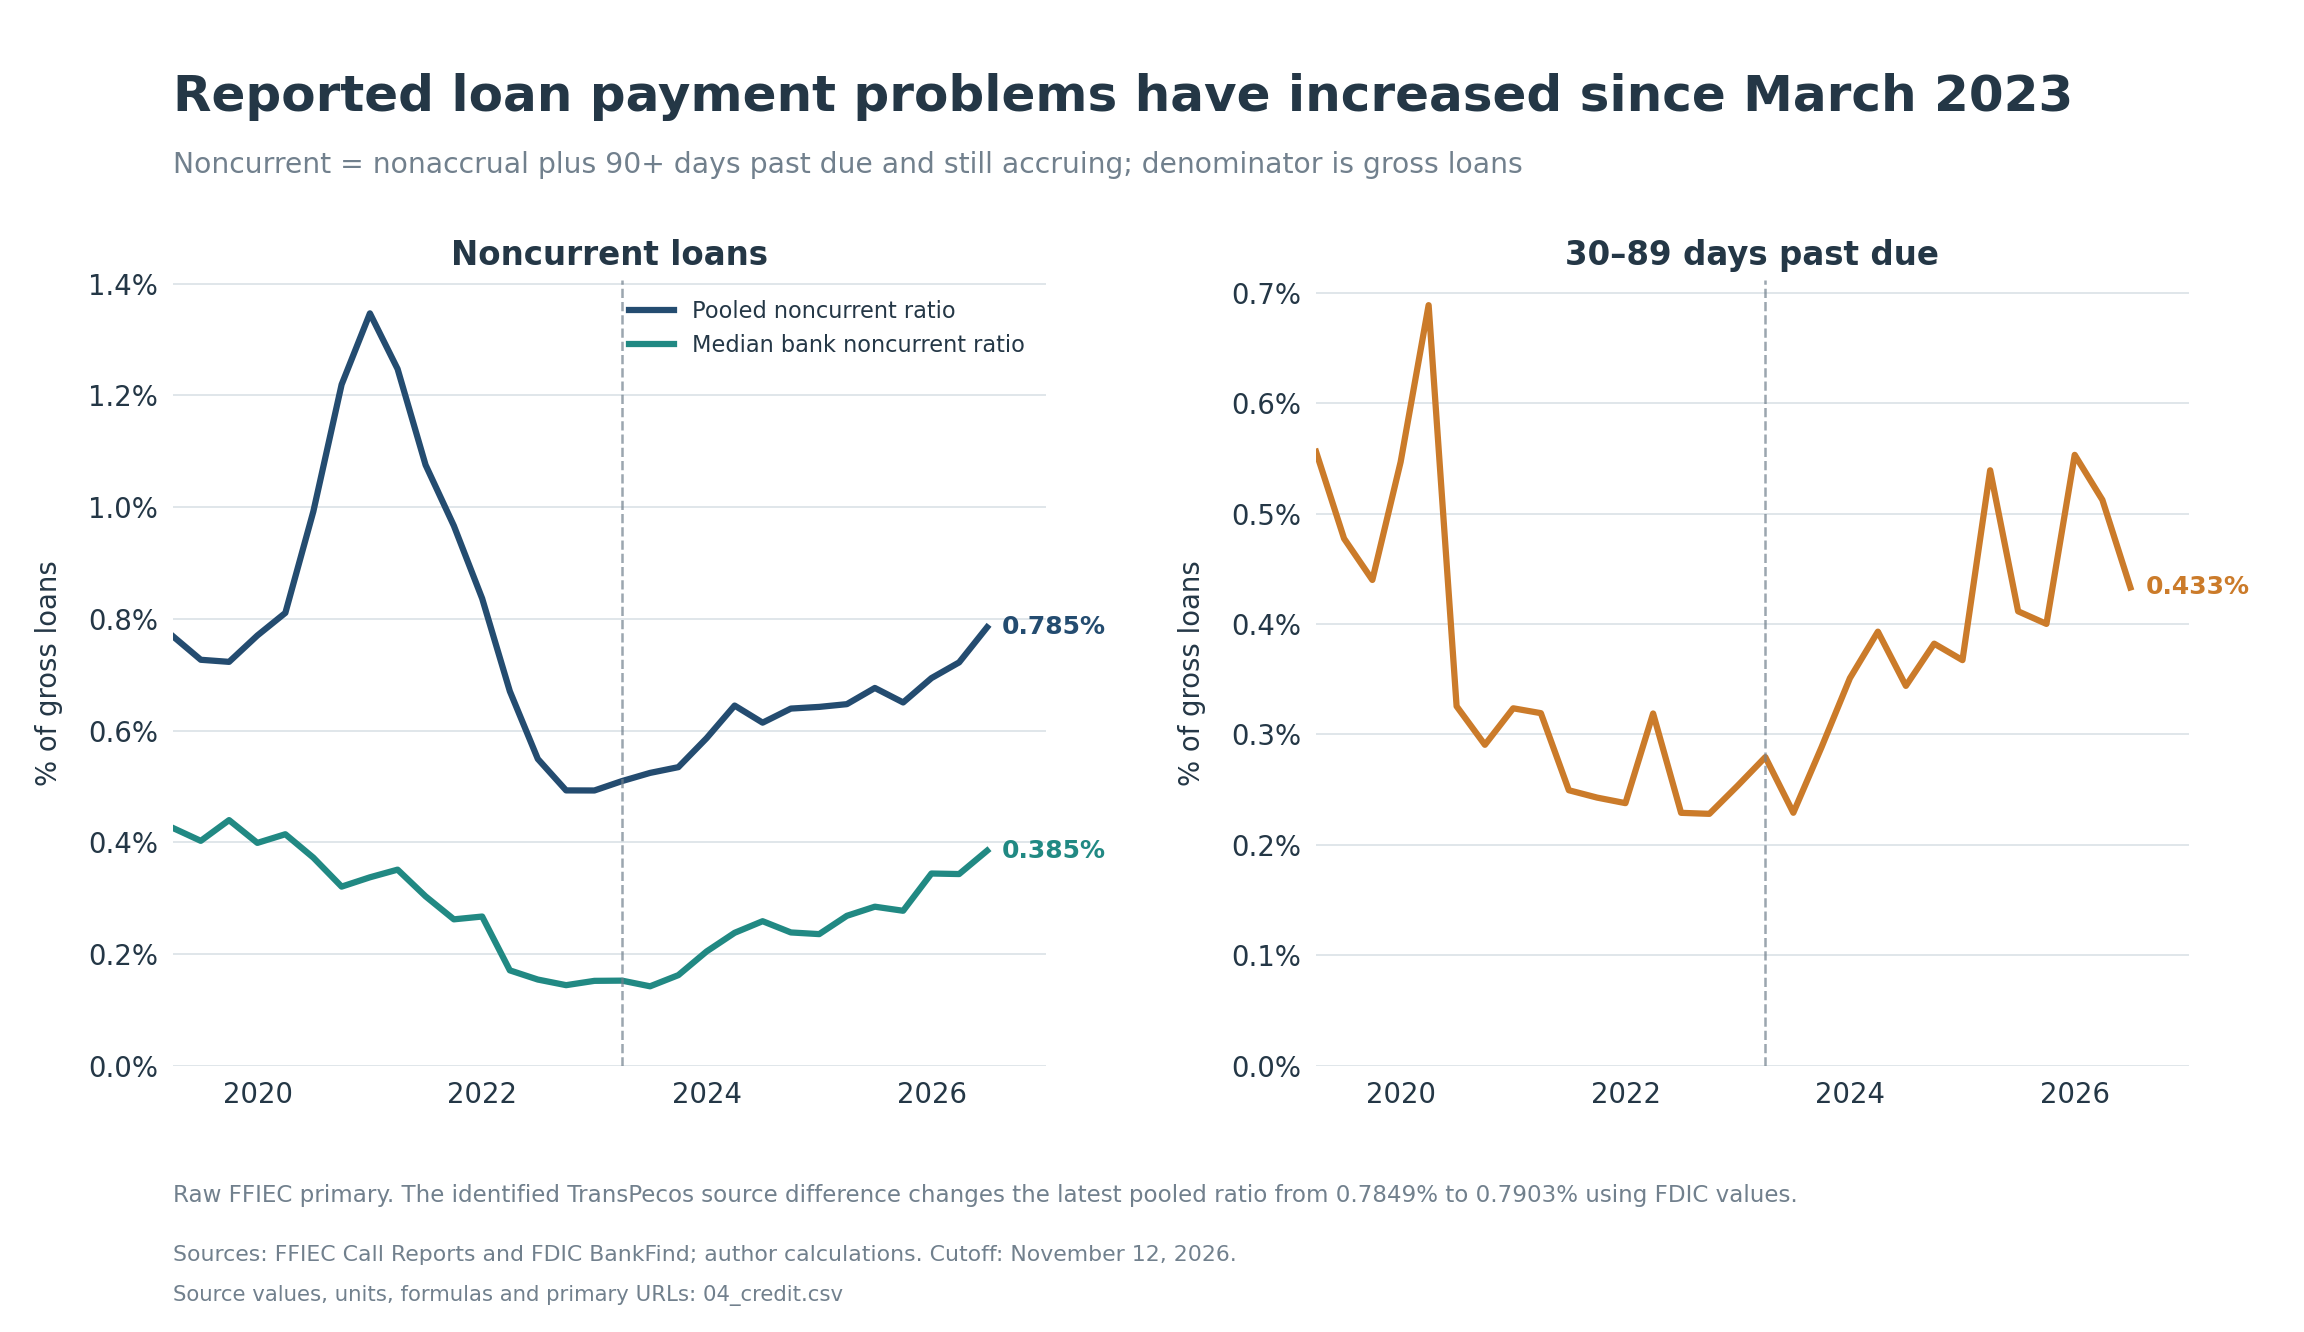
The model defines noncurrent loans as nonaccrual loans plus loans at least 90 days past due that are still accruing, divided by gross loans and leases before the allowance, including loans held for sale. The early-stage delinquency measure covers loans 30–89 days past due.forms
The pooled noncurrent ratio rises from 0.5095% in March 2023 to 0.7849% in June 2026. The median rises from 0.1521% to 0.3848%. Median 30–89-day delinquency rises from 0.2794% to 0.4331%. These figures document deterioration in reported payment status; they are not estimates of eventual loss severity.data
Monet’s 25.76% ratio is the highest latest observation: $117.000 million of noncurrent loans divided by $454.267 million of gross loans. Its balance sheet also reports $997.007 million of equity and $3.160 billion of assets. Loans make up about 14% of Monet’s assets. The 25.76% ratio applies to that loan book.
Raw RC-N detail puts $105.983 million of Monet’s nonaccrual balance in nonowner-occupied CRE; corresponding financial-difficulty modification fields report the same amount. Reported federal-guarantee and rebooked-GNMA items do not explain the outlier. Private guarantees, collateral and other recoveries remain unverified.outliers
International Bank of Commerce in Brownsville, certificate 25679, reports $144.524 million of noncurrent loans against $1.575 billion of gross loans, or 9.17%. Its nonaccrual detail consists of $99.800 million C&I and $44.476 million multifamily. It is a different legal bank from the similarly named IBC in Laredo.
International Bancshares’ June 2026 10-Q says the consolidated nonaccrual increase primarily involved several loans secured by interests in affordable-housing projects, moved to nonaccrual in the second quarter. That is parent-level context across multiple bank subsidiaries. The public evidence here does not justify assigning the entire described relationship to Brownsville.ibc
For lower examples, Charles Schwab Bank reports 0.0372%, Texas Capital 0.4988%, Frost 0.5510%, and State Bank of Texas 2.1553%. Several banks above $1 billion of assets, including Texas Exchange and Dallas Capital, report zero under this particular noncurrent definition. A zero means the bank reported no noncurrent loans at quarter end under that definition.
One source disagreement is material to an individual rank. TransPecos Banks’ raw FFIEC figures produce $32.621 million and 4.9478%, while the FDIC version produces $53.711 million and 8.1466%, using the same $659.308 million loan denominator. That changes its ranking from eighth to third. The statewide ratio moves only from 0.7849% to 0.7903%. Available timestamps leave the ordering of the two filings uncertain. The main tables use raw FFIEC balances and credit fields. The data also include the FDIC figures.audit
Prosperity’s subsequent parent filing supplies another denominator lesson. Its reported nonperforming assets rose from $150.842 million at December 2025 to $193.872 million at September 2026, while the recomputed ratio to the reported denominator fell from 0.6913% to 0.6043% amid acquisitions. Stellar merged on July 1, after this report’s June census; it appears under its own charter in June. A falling ratio can coexist with rising problem-asset dollars.prosperity
Finding 6: Margins recovered, but interest-bearing deposits still cost more
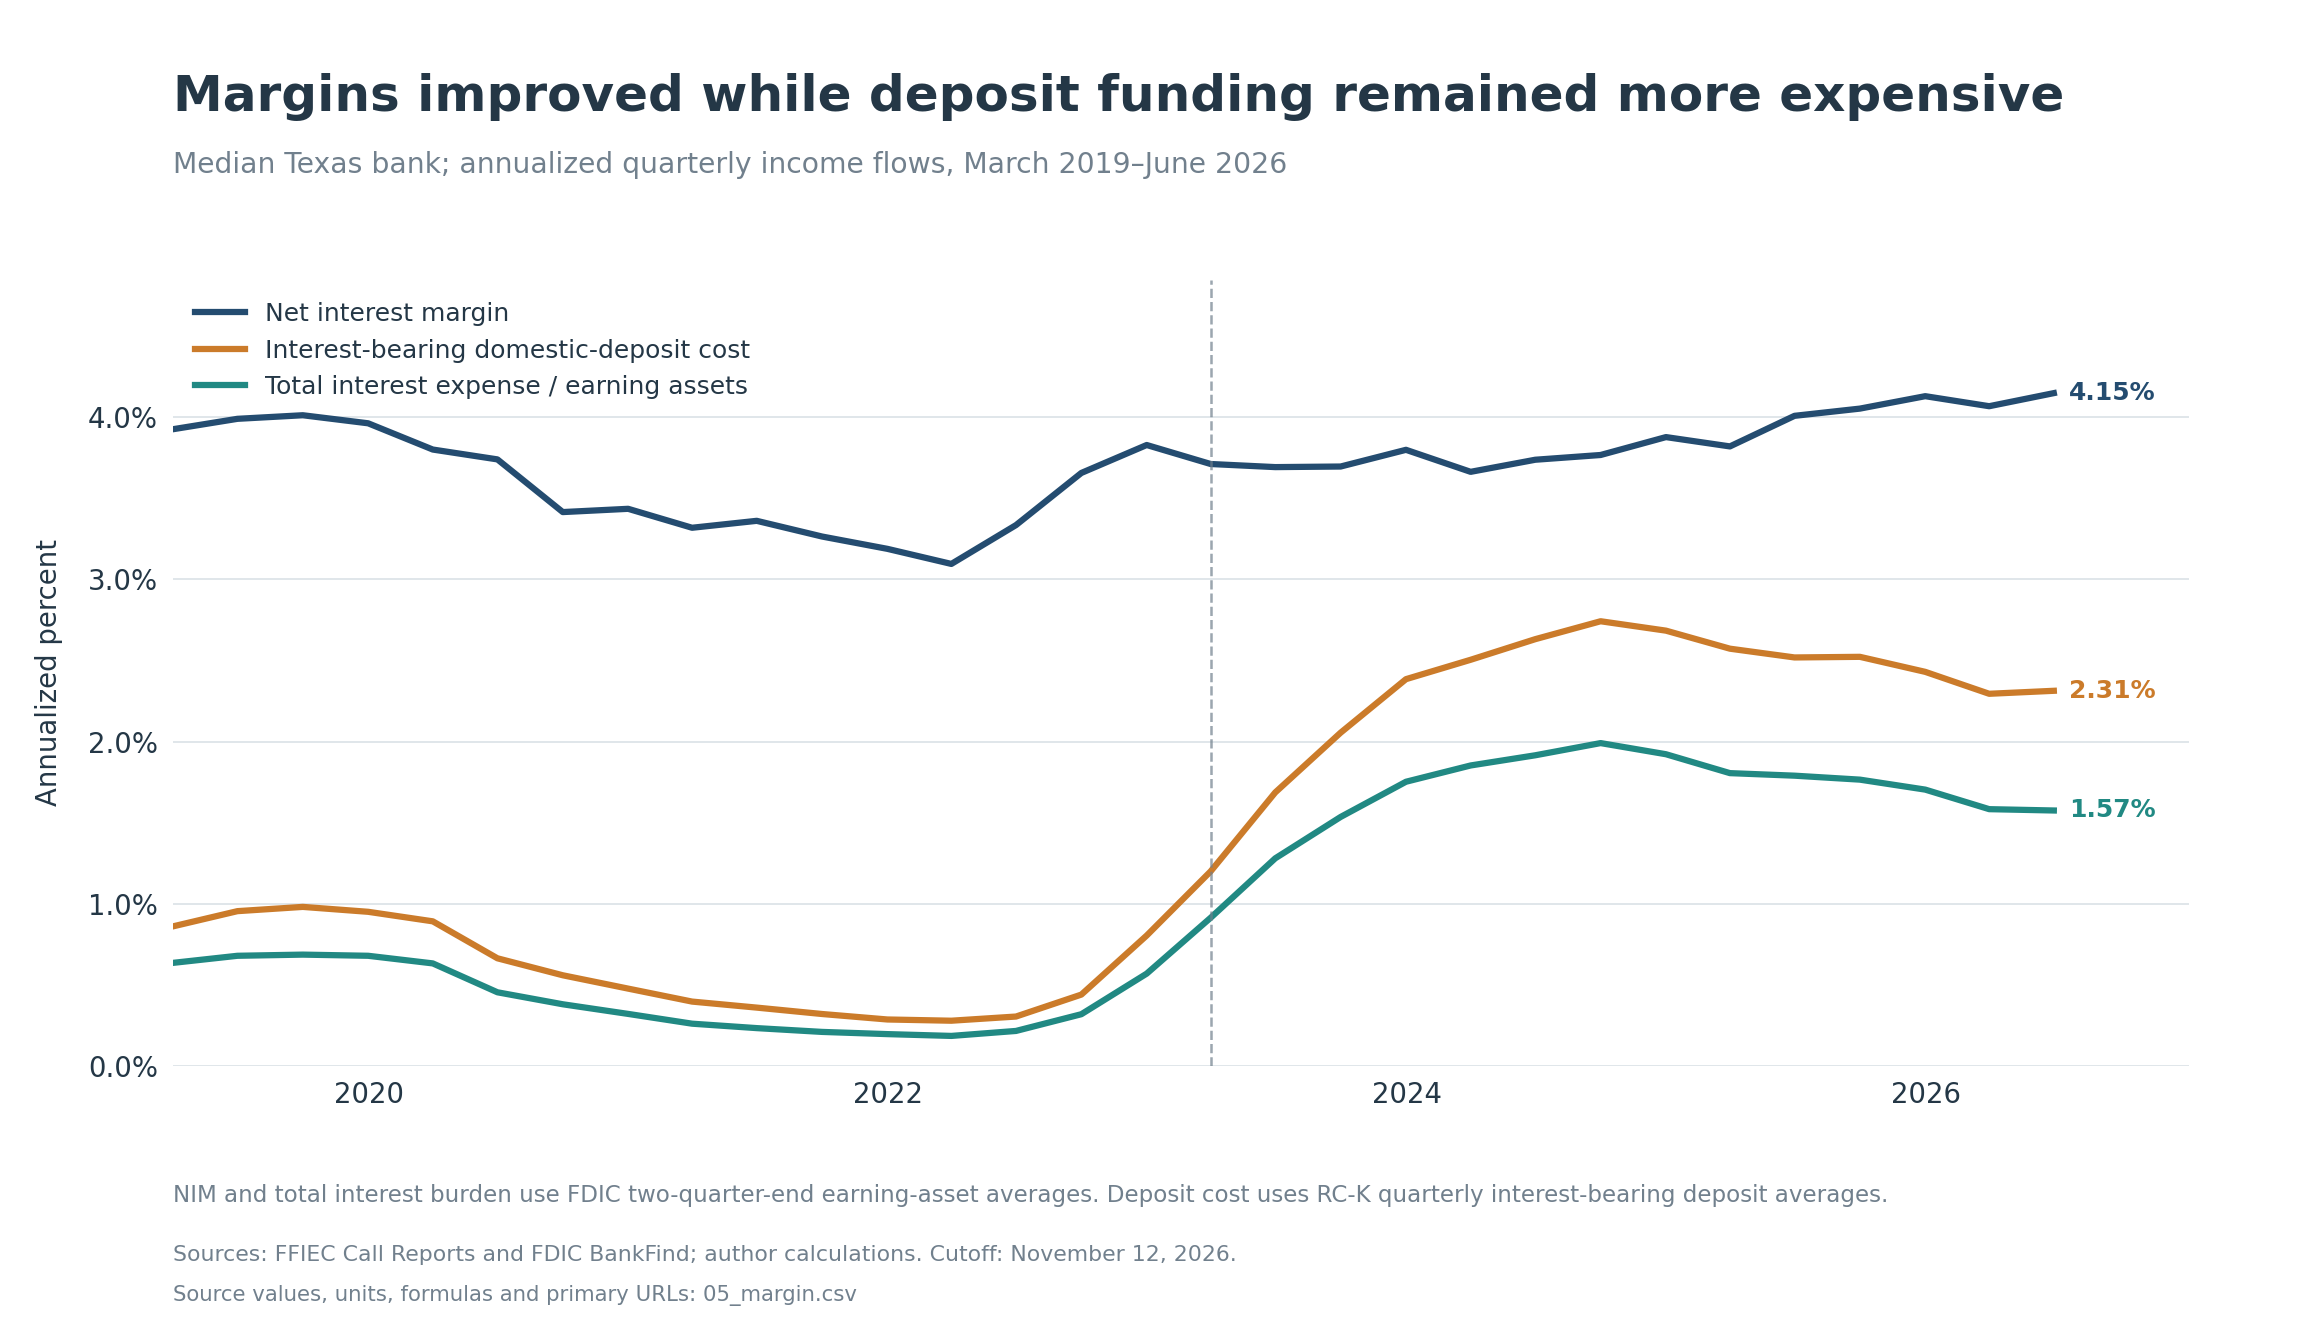
The median annualized quarterly net interest margin rose from 3.7127% in March 2023 to 4.1501% in June 2026. Over the same period, the median cost of interest-bearing domestic deposits rose from 1.1986% to 2.3131%, and median total interest expense divided by earning assets rose from 0.9123% to 1.5744%.income
The denominators give each measure a different meaning. NIM is net interest income divided by earning assets. Deposit cost measures interest expense against the interest-bearing deposit base. Total interest expense divided by earning assets measures the funding burden on the earning-asset base; it is not an all-liabilities cost rate.
For a consistent comparison, the main model uses FDIC quarterly income flows, four-times annualization and FDIC’s average of two quarter-end earning-asset balances. The domestic deposit-cost denominator uses reported quarterly averages from RC-K. A holding company’s tax-equivalent margin also reflects its own reporting perimeter and tax adjustment.income
The reported RI income statement is year-to-date. Simply subtracting one reported year-to-date statement from the next can create misleading quarterly flows around accounting resets, acquisitions or source-version differences. The model therefore uses FDIC’s quarterly series consistently for the primary income ratios. It does not assert a cause for a bank-specific difference without supporting transaction evidence.
For the 346 continuing Texas bank identities, the median individual NIM change since March 2023 is +0.3656 percentage points, while the median individual interest-bearing-deposit-cost change is +0.9461 points. The median changes show margins and funding costs rising together across the matched sample. Individual banks’ results vary.
Texas Capital’s June bank-level NIM is 3.3195%, and its interest-bearing domestic-deposit cost is 3.3679%. Frost’s corresponding values are 3.6576% and 1.6026%. A deposit cost above NIM is not inherently inconsistent: the two ratios have different numerators and denominators.
Finding 7: December 2022 ranks explain exposures better than they predict failures
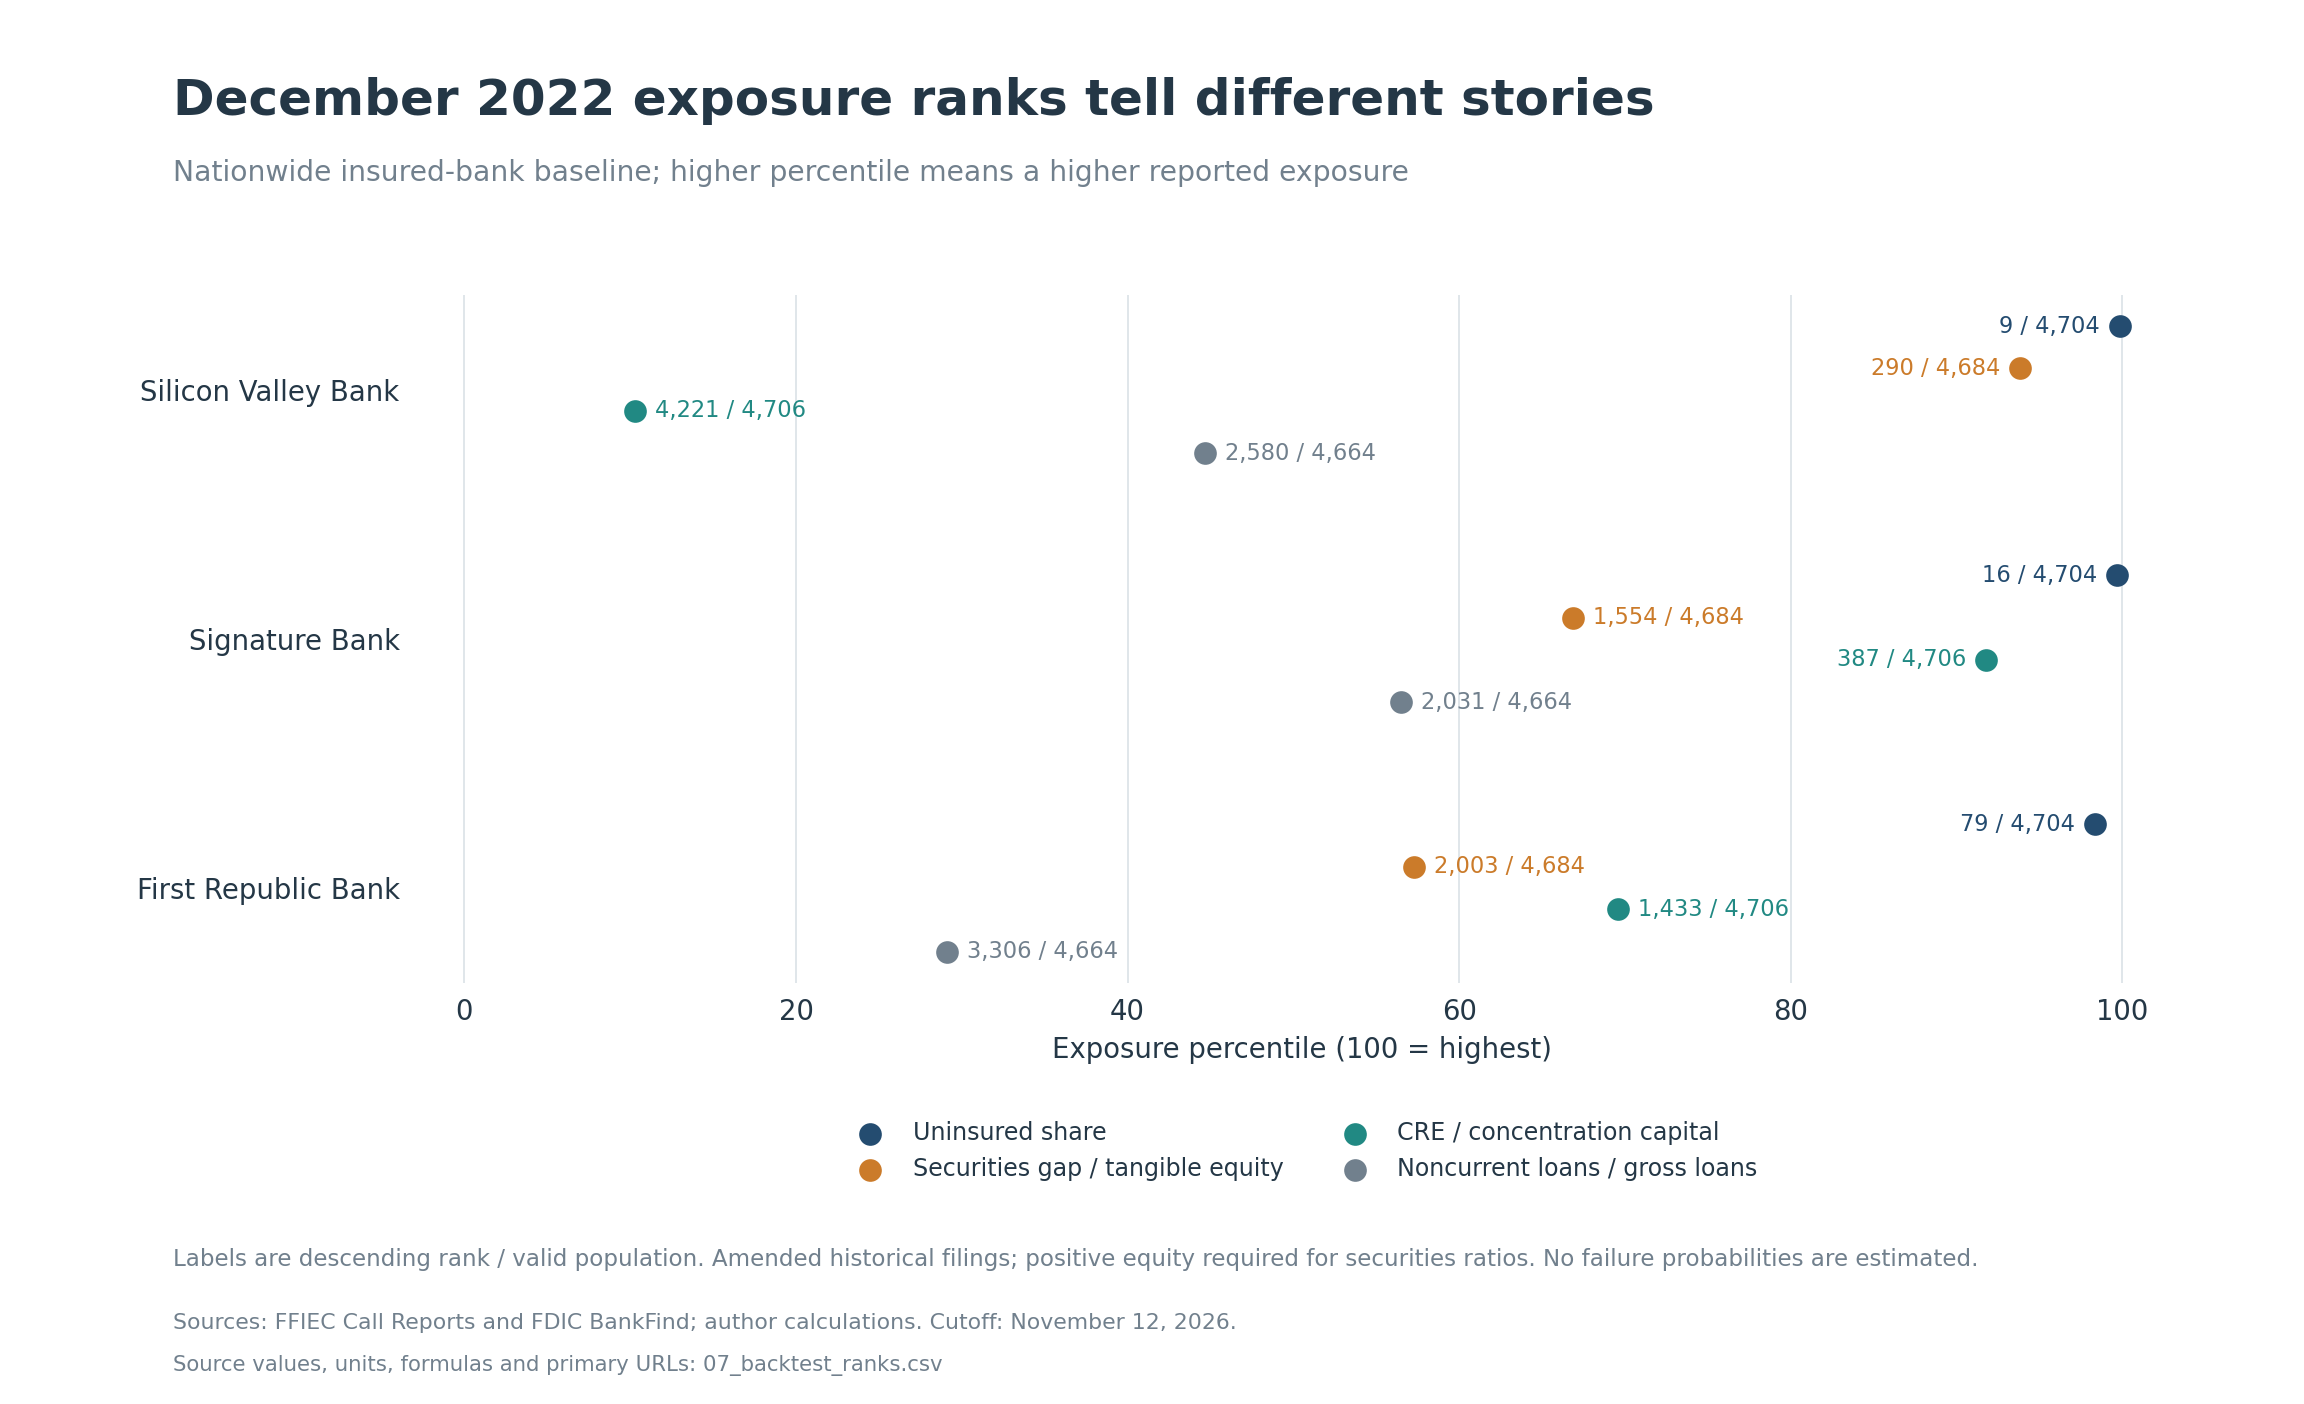
The retrospective national panel contains 4,706 FDIC-insured domestic Call Report banks at December 31, 2022. The starting population includes institutions that subsequently merged or closed. There are 4,704 valid uninsured-share observations and 4,684 valid positive-tangible-equity securities ratios. The data flag 22 banks with nonpositive tangible equity. The securities ranking uses positive-equity banks.backtest
Rank 1 means the highest observed exposure. Ties receive the same minimum rank.
| December 2022 bank | Uninsured share; national rank | Securities gap / tangible equity; rank | CRE / modeled concentration capital | Complete CRE screen |
|---|---|---|---|---|
| Silicon Valley Bank; 24735 | 93.82%; 9 / 4,704 | 116.57%; 290 / 4,684 | 13.70% | No |
| Signature Bank; 57053 | 89.30%; 16 / 4,704 | 40.13%; 1,554 / 4,684 | 314.52% | No |
| First Republic Bank; 59017 | 67.45%; 79 / 4,704 | 30.44%; 2,003 / 4,684 | 196.41% | No |
Ranks use amended December 2022 filings at the bank level. CRE ratios use the model’s concentration-capital denominator.backtest
The national noncurrent-loan ranks, among 4,664 banks with valid loan ratios, show a different part of the same balance sheets. SVB reported 0.1872%, ranking 2,580th; Signature 0.3187%, ranking 2,031st; and First Republic 0.0652%, ranking 3,306th, with rank 1 again the highest ratio. These payment-status observations do not measure the fair-value effect of a change in market rates. First Republic’s low reported delinquency and much larger disclosed loan valuation gap can therefore coexist without contradicting one another.backtest, frb
Signature’s 314.52% CRE/capital ratio is above 300%, but its three-year CRE growth is 24.64%, below the 50% condition. Its construction ratio is 15.62%. Calling it a complete CRE-screen case would therefore misstate the rule. With original total risk-based capital, its CRE ratio is 300.01%; the growth condition still is not satisfied.
SVB’s uninsured estimate is $151.592 billion, divided here by $161.582 billion of corresponding assessable deposits, giving 93.82%. Its bank-level securities gap is $17.685 billion against $15.171 billion of tangible equity. Subtracting the $15.153 billion incremental HTM mark, without subtracting AFS again, leaves $18 million before any tax sensitivity. The Federal Reserve’s review of SVB identified a concentrated business model, dependence on uninsured deposits and weaknesses in interest-rate and liquidity risk management. The FDIC’s Signature review identified a run triggered by contagion and found that Signature had funded rapid growth with uninsured deposits without adequate liquidity controls.backtest, failure-context
First Republic’s incremental HTM adjustment is $4.761 billion after its booked HTM allowance. The FDIC’s September 2023 review documents a $22.159 billion loan fair-value shortfall at December 2022: $166.084 billion carrying value less $143.925 billion fair value. The much larger loan mark explains why a securities-only ranking omits a material part of the historical balance-sheet exposure.frb
Entity consistency also matters. SVB Financial Group’s 10-K is a parent filing; the bank Call Report has a different reporting perimeter. The analysis does not mix parent preferred stock, parent equity or parent deposits with bank securities. Among the 923 banks reporting their own uninsured estimate, SVB ranks third, Signature eighth and First Republic 34th. The tables give both sets of ranks.svb, backtest
The December 2022 baseline includes all 15 FDIC-insured banks identified as failing from January 1, 2023 through November 12, 2026. The downloaded FDIC API snapshot listed 13. FDIC closing announcements confirm Tioga-Franklin on August 21, 2026, and Nano Banc on September 25, 2026.failures
| Fixed December 2022 screen | Banks flagged | Recorded failures among flagged | Share of the 15 recorded failures captured |
|---|---|---|---|
| Complete CRE concentration union | 566 | 1 | 6.67% |
| Uninsured share at least 50% | 355 | 5 | 33.33% |
| Securities gap at least 100% of positive tangible equity | 385 | 5 | 33.33% |
| Nonpositive tangible equity | 22 | 0 | 0.00% |
CRE and uninsured screens have 4,704 valid observations; the positive-equity securities screen has 4,684. The analysis uses two descriptive cutoffs of 50% for uninsured deposits and 100% for the securities gap.backtest
The observed failure share among flagged banks is 0.18% for CRE, 1.41% for uninsured deposits and 1.30% for the positive-equity securities screen. These proportions describe observed outcomes in the December 2022 comparison sample. Combining the securities threshold with the nonpositive-equity flag produces 407 flagged banks and the same five observed failures.
There are important limits to the word “backtest.” The historical downloads include amendments filed since December 2022. A real-time test would require the vintages available before March 2023. The exercise does not adjust the observation period for mergers or estimate competing risks. It does not optimize thresholds on outcomes or claim causation. Its documented lesson is narrower: each balance-sheet measure captures one exposure, and no one of these screens captured most subsequent failures.
Finding 8: Transparent low, base and high cases show the model’s sensitivity
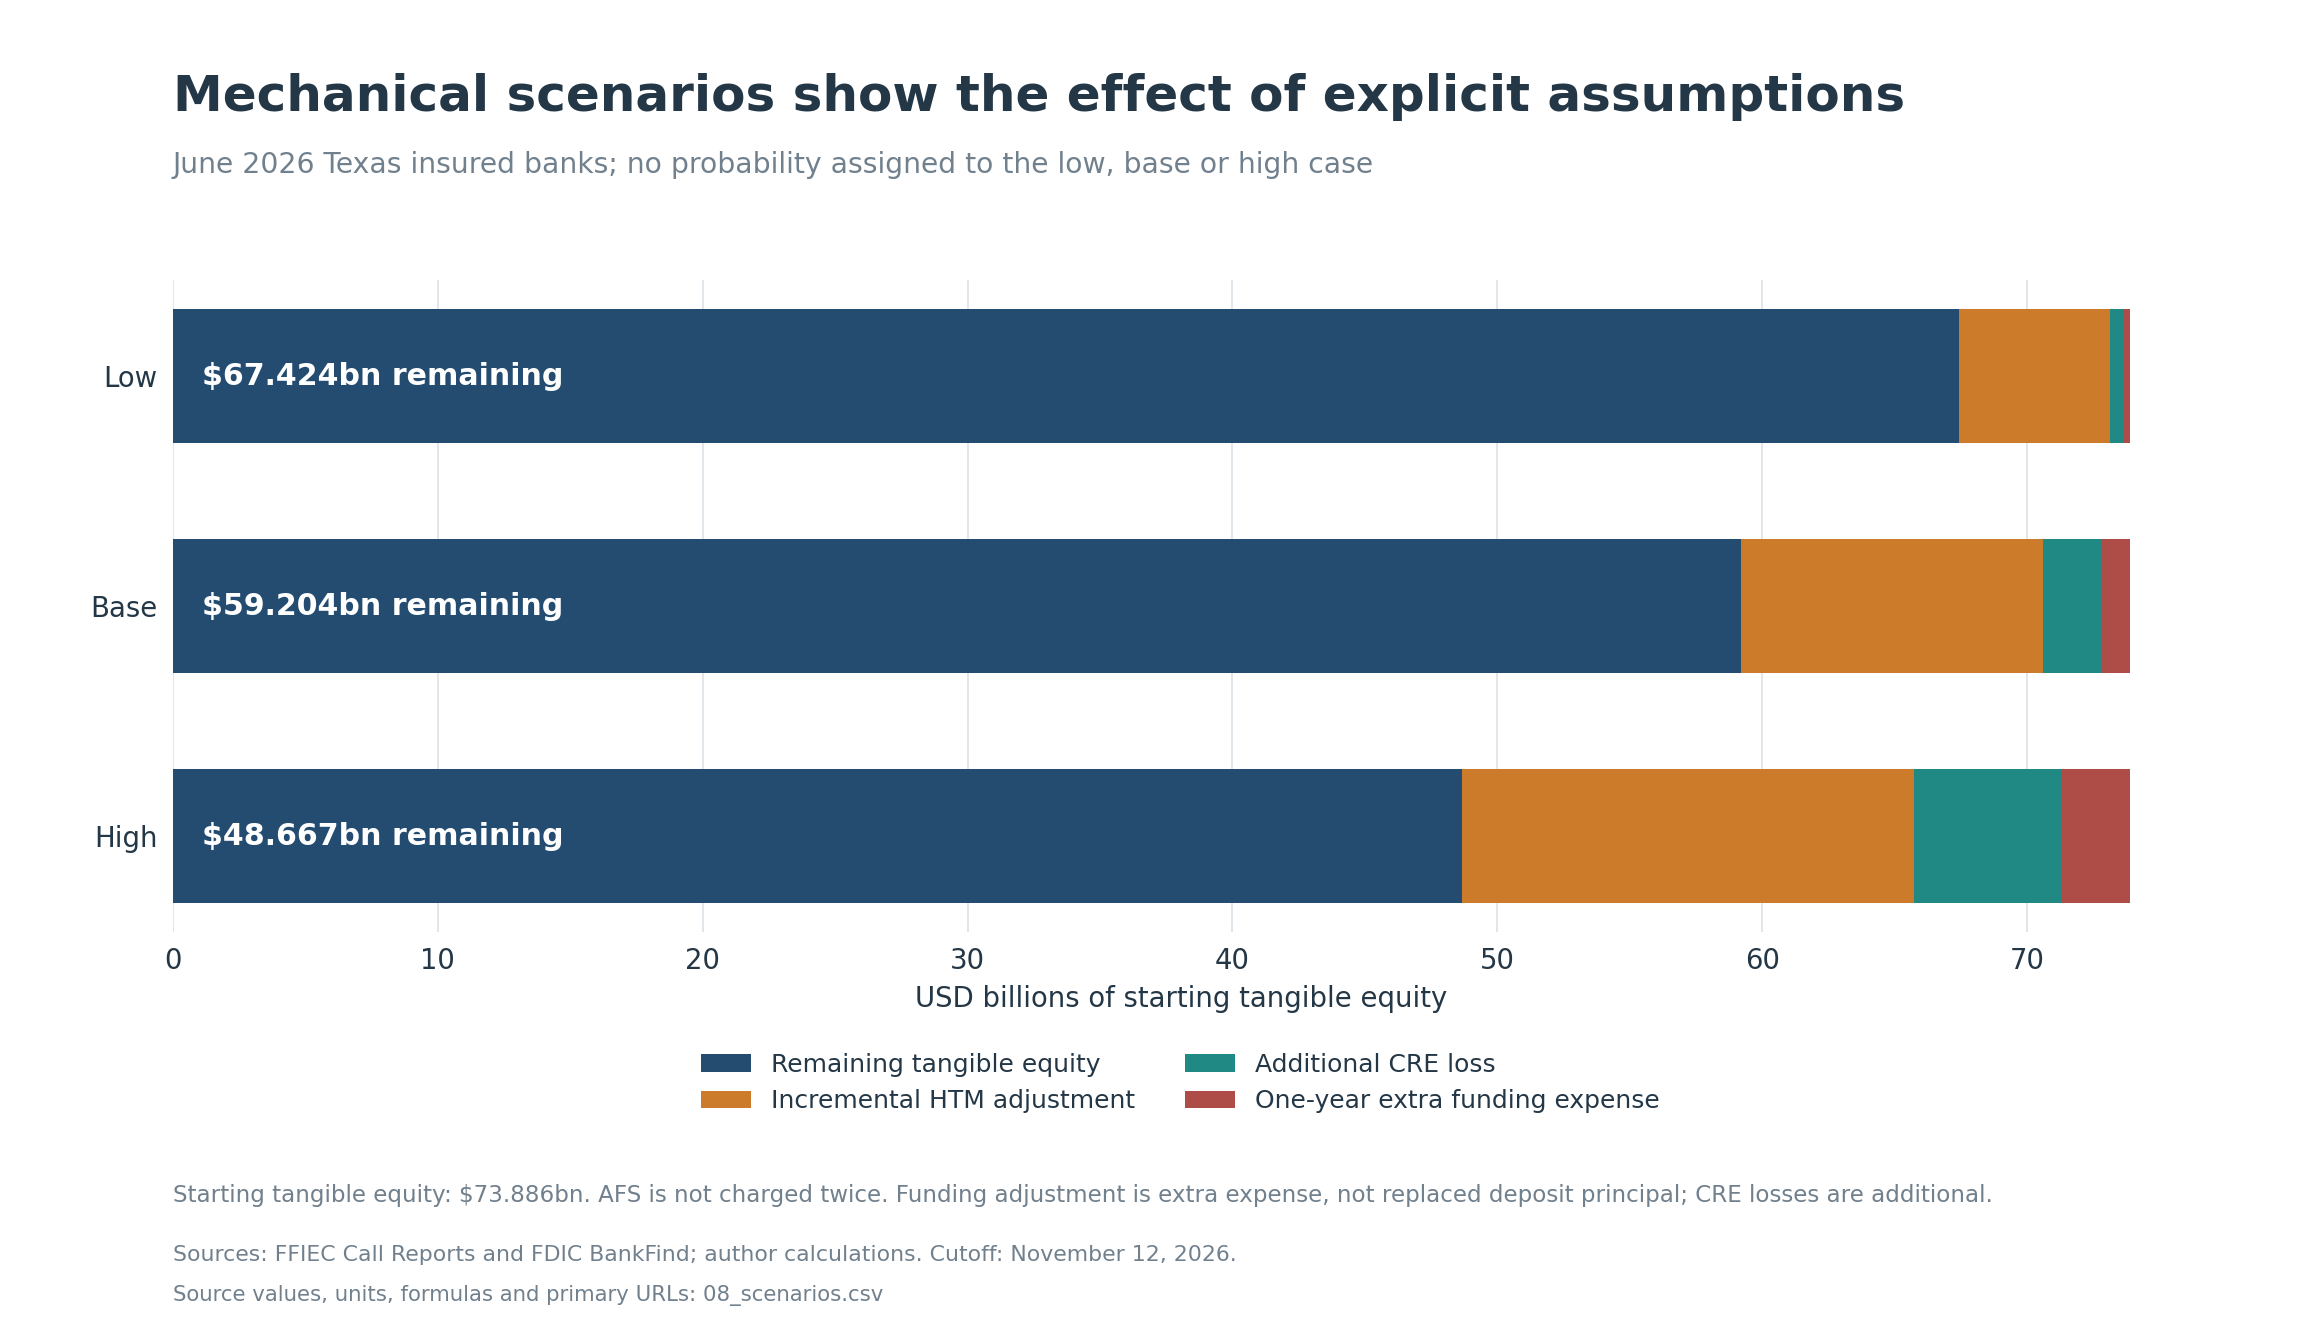
The scenario model starts with $73.886 billion of tangible equity across the latest 349 insured Texas banks. It applies three explicitly hypothetical adjustments. The labels low, base and high describe the size of those adjustments; “base” is not a forecast or the most likely future.
| Analyst assumption | Low | Base | High |
|---|---|---|---|
| Multiplier on each bank’s positive incremental HTM price gap | 0.5× | 1.0× | 1.5× |
| Additional CRE loss beyond amounts already allowed for | 0.5% of CRE | 2.0% | 5.0% |
| Share of uninsured deposits replaced | 10% | 25% | 40% |
| Additional annual cost of replacement funds | 1 percentage point | 2 points | 3 points |
| Tax benefit | 0% | 0% | 0% |
For each bank, the arithmetic is:
Remaining tangible equity = starting tangible equity − HTM adjustment − additional CRE loss − one year of incremental replacement-funding expense.
The funding shock subtracts the extra funding expense. The deposits and their replacements offset at principal, and reported equity already reflects AFS marks. Existing loan allowances already affect the starting balance sheet; the assumed CRE losses are expressly additional. Positive HTM gaps are calculated bank by bank, so gains at one bank do not offset another bank’s assumed mark.
| Aggregate result | Low | Base | High |
|---|---|---|---|
| HTM adjustment | $5.689bn | $11.379bn | $17.068bn |
| Additional CRE loss | $0.559bn | $2.236bn | $5.591bn |
| One-year extra funding expense | $0.213bn | $1.066bn | $2.559bn |
| Remaining tangible equity | $67.424bn | $59.204bn | $48.667bn |
Calculated from June 2026 bank inputs and the disclosed assumptions. These are mechanical sensitivities, with no probabilities attached.scenario
Every bank remains above zero tangible equity in these particular calculations. That result is conditional on the chosen adjustments. The model does not translate an HTM multiplier into a specified interest-rate move, because duration, prepayments and hedges would be required. It also does not test the availability of replacement funding, recognize future operating earnings, mark the whole loan portfolio to market, model collateral calls or assume capital raising.
Three marginal sensitivities make the arithmetic easy to audit:
- Each extra one percentage point of CRE loss reduces aggregate equity by $1.118 billion.
- Each extra one percentage point of replacement-funding cost, holding replacement at 25% of uninsured deposits, adds $533.165 million of annual expense.
- Each 10% change in the positive incremental HTM gap changes the adjustment by $1.138 billion.
A 21% tax-benefit sensitivity raises the base HTM-only adjusted equity calculation by approximately $2.390 billion across the sample. That is not included in the primary cases and is not a claim about tax recoverability, tax elections or regulatory treatment. Readers can change the assumptions in the workbook.
What would change the conclusions
The strongest current conclusion is that the measured securities and concentration exposures are lower than in March 2023, while reported credit problems are higher. Several specific pieces of evidence could change its magnitude or interpretation.
First, a complete September 2026 bulk release could alter the rankings and population. The model should be rerun on that common quarter, and reflect completed mergers across the full census.
Second, resolved source discrepancies could change individual credit rankings. TransPecos is an identified case. The FFIEC-versus-FDIC difference is too small to reverse the statewide credit trend, but it is large enough to change that bank’s position materially.
Third, property-level and loan-level disclosures could change the assessment of a high CRE ratio. Current appraisals, debt-service coverage, refinancing dates, occupancy, recourse and loss allocations would be more informative about loss severity than replacing “CRE” with an unsupported office estimate.
Fourth, a fuller economic-value analysis could materially change the securities picture. First Republic’s historical loan marks show the importance of assets outside the securities schedules. Liability values, hedges, pledged collateral and borrowing capacity would also matter.
Fifth, deposit detail could change the interpretation of the funding ratios. Reported uninsured estimates and large-account approximations do not reveal the same level of information. Verified pass-through coverage, depositor concentration, collateralized public deposits and maturity distributions could distinguish banks with similar headline shares.
Finally, future credit charges and recoveries would determine how delinquency translates into losses. The report records payment status and existing allowances; it does not invent recovery rates from those balances.
Data and calculations
Every published model number is recomputed from the supplied inputs. Monetary amounts in the raw and calculation data are $000. CSV ratio columns labeled _pct contain percentages on a 0–100 scale; change columns labeled _pp contain percentage points. Spreadsheet percentage cells use the corresponding decimal values with percentage formatting. The source and metric dictionaries identify units explicitly. Unknown inputs remain blank or explicitly labeled. Reported zeroes remain zeroes.
I checked the opening numbers against the underlying balances.
| Headline | Independent check | Result |
|---|---|---|
| 61 of 349 banks meet either CRE screen | Independently extracted FFIEC components and FDIC loan/capital fields, including CRE financing without real estate collateral and the three-year base | Exact screen-membership agreement |
| $20.079132bn securities gap | AFS and HTM cost-minus-fair-value calculations | Exact agreement: $8.699356bn plus $11.379776bn |
| 0.7849214% noncurrent ratio | Independent raw-schedule arithmetic and FDIC comparison | Raw calculation verified; FDIC version gives 0.7903291%, with the $21.090m difference reconciled to TransPecos |
The two workbooks contain sourced inputs, formulas and outputs for the current census, March 2023 comparisons, national December 2022 reconstruction and USAA supplement. The complete quarterly history is also supplied as a clearly labeled sortable snapshot. The rank columns describe the publication snapshot. They are fixed when readers change model inputs. The CSV package includes normalized inputs, selected raw FFIEC tags, prior-period CRE components, source manifests, data definitions, reconciliations, failure events, scenarios and chart data.
Each bank row carries its FDIC certificate, RSSD identifier, reporting period and primary-source links. The source manifests record downloaded bulk-file hashes and retrieval dates. The workbooks show the formulas, and the issuer-input register identifies the relevant filing, date and page or table.
The bank tables show which institutions account for each exposure and link to their reported balances.
Source and calculation notes
- FFIEC, Call Report bulk downloads, quarterly files March 2016–June 2026, retrieved November 12, 2026; public panel begins March 2019. FDIC, BankFind financial data/API documentation, financials and insurance-status fields, retrieved the same date. Row-level facsimile and API URLs, periods, raw tags and SHA-256 receipts are in the supplied data. CRE uses RC-C F158+F159+1460+F161+2746; capital uses RC-R 8274 plus RC 3123. Securities use RC-B 1772−1773 and 1754−1771. Tangible equity uses RC 3210−2143. Rankings and trends are the author’s calculations. ↩
- Independent audit files accompany the model. June 2026 NPL uses RC-N 1403+1407, divided by B528+5369. TransPecos, CERT 11178/RSSD 908861: raw nonaccrual 23,848 plus 90-day 8,773, versus FDIC NALNLS 26,496 plus P9LNLS 27,215, all $000. Both sources give statewide gross loans 390,004,127. Raw POR update 2026-08-18T21:38:13; FDIC index risview_20260819185831 created 2026-08-19T18:58:33Z. Index creation is not a bank-specific extraction timestamp. Johnson City has an offsetting reclassification with no effect on total NPL. ↩
- FFIEC, About CDR public data, “Reports of Condition and Income,” accessed November 12, 2026: individual reports versus bulk publication and monthly amendment regeneration. The saved bulk selector shows June 30, 2026 as the latest available complete period. ↩
- USAA Federal Savings Bank, June 2026 Pillar 3 disclosures, p. 1 locations; pp. 5–6 capital reconciliation. FFIEC NIC profile, RSSD 619877. Supplemental ratios calculated from the bank’s June 2026 Call Report. ↩
- FirstSun Capital Bancorp, 2025 Form 10-K, filed March 6, 2026, Item 1 “Our History”; April 1, 2026 Form 8-K, Item 2.01, First Foundation bank merger. ↩
- SouthState, completion announcement furnished with its January 2, 2025 Form 8-K, Exhibit 99.1, Independent acquisition completed January 1; Huntington, Form 8-K reporting the Veritex acquisition, Item 8.01, completed October 20, 2025; Fifth Third, Form 8-K reporting the Comerica acquisition, Item 2.01, completed February 1, 2026. Transaction context supplements the quarterly bank-identifier census; it does not substitute corporate headquarters for regulatory main-office state. ↩
- Federal Reserve/OCC/FDIC, final interagency CRE guidance, December 6, 2006, published December 12; “Scope” and “Supervisory Oversight.” The final version includes the 36-month growth condition. ↩
- Federal Reserve, SR 20-8, March 30, 2020, revised April 2. FFIEC, March 2020 UBPR changes, pp. 1, 3, and UBPR user’s guide, p. 28, UBPR3792, for the CECL transition adjustment. Original-RBC sensitivity uses RCFA/RCOA3792, with binding advanced-approaches selection where applicable; see 2014 interagency reporting guidance. ↩
- Federal Reserve, CRE analysis appendix, updated May 2, 2013, five-component formula including RC-C memorandum 3, tag 2746, for CRE financing without real estate collateral. FDIC field dictionary: LNRECONS+LNREMULT+LNRENROT+LNCOMRE. ↩
- FFIEC, reporting forms and instructions, RC, RC-B, RC-C, RC-K, RC-M, RC-N and RC-O; September 2026 031/041 instructions, current reference checked November 12. Historical raw description rows and field dictionaries are included. Incremental HTM mark uses JJ34−1771; net-carrying fallback before CECL is 1754. FHLB advances sum F055–F058; brokered deposits use 2365. The model never adds overlapping prefix variants. ↩
- Texas Capital Bancshares, 2025 Form 10-K, filed February 10, 2026, pp. 37–38: apartments/condos 2,184,619, office 259,507, total 5,395,753 ($000). Cullen/Frost, 2025 Form 10-K, filed February 5, 2026, pp. 57–59: office and multifamily by owner occupancy/construction. Source rows and calculated percentages are supplied. ↩
- Charles Schwab Corporation, 2025 Form 10-K, filed February 25, 2026, bank subsidiaries; March 2023 Form 10-Q, filed May 8, 2023, pp. 34–35 and borrowings note; September 2026 Form 10-Q, filed November 6, 2026, pp. 19–20, 39 and Note 10. Parent net securities gaps equal AFS cost less fair value plus HTM cost less fair value. ↩
- FDIC, uninsured-deposit reporting clarification, July 24, 2023; FFIEC RC-O instructions, memorandum 2, printed RC-O-15. FDIC, August 6, 2024 request for information, printed p. 63952, account-size fallback. Formula in $000: F051+F047−250×(F052+F048). Primary share divides 5597 or the labeled approximation by F236−F237. ↩
- FDIC, FIL-113-2020, final rule on brokered deposits and interest-rate restrictions, December 15, 2020: effective April 1, 2021; full compliance January 1, 2022. FDIC, statement on sweep-deposit reporting, first reflection of the revised rule in June 30, 2021 Call Reports. This definition break affects comparisons across that transition. ↩
- FDIC, withdrawal of proposed rules related to brokered deposits, 2025, withdrawal of the 2024 proposal; FDIC, technical correction, Federal Register, June 3, 2026, document 2026-11044, explanation of the correction’s nonsubstantive scope. Checked for the November 12, 2026 research cutoff. ↩
- June 30, 2026 raw FFIEC schedules for Monet CERT 32574 and IBC Brownsville CERT 25679: RC-N F183, 1608, 3501, 1403, 1407 and K039–K044; Monet modification fields HK28/K119. The CSV collection includes the underlying bank inputs. ↩
- International Bancshares, June 2026 Form 10-Q, filed August 6, 2026, printed pp. 19–21; consolidated affordable-housing relationship and nonaccrual tables. ↩
- Prosperity Bancshares, September 2026 Form 10-Q, filed November 9, 2026, pp. 15, 40–41, 49–52, 60; acquisition dates and nonperforming-assets table. Ratios recomputed from 193,872/32,083,192 and 150,842/21,818,664, in $000. The denominators are reported total loans plus other real estate: 32,060,408+22,784 and 21,805,368+13,296. NPA is broader than this report’s loan-only NPL measure. ↩
- FDIC financial-field dictionary, NIMQ, EINTXQ, EDEPDOMQ, ERNAST2; downloaded November 12, 2026. Main NIM=4×NIMQ/ERNAST2; total interest burden=4×EINTXQ/ERNAST2. Domestic interest-bearing deposit cost=4×EDEPDOMQ/(RC-K 3485+B563+HK16+HK17). Pre-2017 time-deposit tags use A514/A529; the published panel begins 2019. ↩
- December 31, 2022 FFIEC bulk Call Reports and December 31, 2019 CRE comparison, reconciled to FDIC INSALL, CERT and RSSDID. Full 4,706-bank baseline, raw components, ranks, missing-denominator flags and independent rank audit are supplied. The backtest joins observed failures by FDIC certificate number and reports the resulting ranks and counts. ↩
- FDIC, Supervision of First Republic Bank, September 8, 2023, Table 2, printed p. 15: loan and securities carrying values/fair values at December 2022. HTM net $4.760723bn adjustment recomputed from Call Report cost $28.358907bn less allowance $0.010681bn less fair value $23.587503bn. ↩
- SVB Financial Group, 2022 Form 10-K, filed February 24, 2023, consolidated balance sheet and securities note. Bank-level calculations use CERT 24735/RSSD 802866; parent figures are not substituted into bank ratios. ↩
- Federal Reserve, Review of the Federal Reserve’s Supervision and Regulation of Silicon Valley Bank, April 2023. FDIC, Supervision of Signature Bank, April 2023, pp. 2–3. ↩
- FDIC failures API, retrieved November 12, 2026; snapshot index created August 25, 2026. Official FDIC releases for Tioga-Franklin, August 21, 2026, and Nano Banc, September 25, 2026, supplement events absent from that API snapshot. Event dates, identities and sources are preserved in failure_events_2023_2026.csv. ↩
- The scenarios use the author’s stated assumptions. Inputs trace to June 2026 RC, RC-B, RC-C, RC-O and RC-R. Positive incremental HTM gaps sum 11,378,864 ($000); CRE 111,820,614; uninsured deposits 213,265,874; tangible equity 73,886,014. Bank-level scenario results, aggregate calculations and editable assumptions are supplied. ↩
Supporting material
- Excel model ↗Sourced inputs, live calculations and reported outputs.
- National backtest Excel model ↗Sourced inputs, live calculations and reported outputs.
- Source and model data (CSV collection) ↗Data tables, source references and calculation exports.
- Source register ↗Download as CSV.
- Texas banks latest ↗Download as CSV.