Financial systems
Why are gas prices so high?
Crude acquisition accounted for 56 cents of each extra gasoline dollar in the March–August 2026 model. Refining accounted for 31 cents.

The short version
- I estimate U.S. drivers paid $78.1 billion more for gasoline in March–August 2026 than at February prices.
- I assign 56 cents of each extra dollar to crude, 31 cents to refining and 12 cents to distribution and marketing.
- Regular gasoline was $3.995 a gallon nationally on November 9, with California at $5.562 and Texas at $3.408.
- Gasoline added 0.644 percentage points to March 2026’s monthly consumer-price increase, according to the Bureau of Labor Statistics.
In March–August 2026, the United States spent an estimated $78.1 billion more on gasoline than it would have at February prices. The model assigns 56 cents per extra dollar to crude acquisition, 31 cents to refining, and 12 cents to distribution and marketing. Each component includes operating costs. 1
Last updated November 12, 2026. The latest weekly price survey is November 9. The gasoline volume series runs through November 6, and the national component data run through August.
Who controls gas prices at the pump?
The price reflects crude oil, turning it into usable fuel, moving and selling that fuel, and taxes. The largest part of this episode’s increase appears in crude acquisition costs, followed by the difference between wholesale gasoline and crude costs.
A higher crude acquisition bill is revenue somewhere upstream, including foreign suppliers and intermediaries. It is not automatically a U.S. producer’s profit. The refining component must pay refinery costs. The distribution and marketing component must pay transport, storage, station expenses and other costs before any profit remains. A company may operate in several of these businesses, so adding its consolidated cash flow to the national component table would double-count value.2
For March–August, the latest period with matching monthly prices, component shares and consumption-proxy volumes, the allocation is:
| Component | Extra spending, $bn | Cents per extra $1 | What it measures |
|---|---|---|---|
| Crude acquisition value | 43.988 | 56.3 | Crude acquisition cost; ultimate profit recipients unknown |
| Refining costs + profits | 24.498 | 31.4 | Wholesale-minus-crude spread, before refinery costs |
| Distribution + marketing | 9.536 | 12.2 | Residual, including relevant costs and the rounding adjustment |
| Pump taxes | 0.091 | 0.1 | Roughly unchanged; rounded source percentages |
| Total | 78.113 | 100.0 | March–August regular-price-equivalent difference |
Source: U.S. Energy Information Administration (EIA) monthly pump-component history and finished motor gasoline product supplied; author’s formula model. “Distribution and marketing” is the residual needed to reconcile the rounded source shares to the published price. Totals use unrounded values; displayed amounts may not add exactly.
Crude acquisition accounts for 56 cents of each extra dollar spent on gasoline, and refining for 31 cents
Extra national gasoline spending versus February 2026 prices by cost component, March–August 2026, regular-price equivalent, USD billions
Show the numbers
| USD billions | Extra spending |
|---|---|
| Crude acquisition value | $44.0bn |
| Refining costs + profits | $24.5bn |
| Distribution + marketing | $9.5bn |
| Pump taxes | $0.1bn |
What are gas prices today?
EIA’s latest weekly survey puts regular gasoline at $3.995 per gallon nationally on November 9, 2026, with Texas at $3.408, the Gulf Coast at $3.481, and California at $5.562.3
EIA’s weekly national series reached $4.500 on May 11, compared with $2.937 on February 23, the final weekly observation before military action began on February 28. The monthly February price used in the model is $2.908; a monthly baseline and a single weekly observation are different comparisons.3, 4
EIA still described a de facto Strait of Hormuz closure in its April 28 assessment. Its subsequent accounts describe increased tanker movements after the June 17 memorandum of understanding, followed by renewed disruption in early July. The model therefore treats the high-price episode as ongoing through the latest observations.4
EIA’s November 10 forecast expects regular gasoline to average $3.73 per gallon in 2027, compared with its $3.89 forecast for 2026. It assumes most Middle Eastern production outside Iran returns to pre-conflict levels around the middle of 2027, while petroleum-product supply remains constrained through that year.5
How much more did drivers pay for gas?
The base estimate is $78.1 billion for March–August 2026, plus a provisional $34.0 billion for September 1–November 6. Together they imply $112.2 billion more regular-price-equivalent spending than at February’s price, but the later amount cannot yet be allocated using the published monthly component history.1, 6
| Period | Base extra spending | Allocation status |
|---|---|---|
| March–August 2026 | $78.1 billion | Monthly four-component cost allocation available |
| September 1–November 6, 2026 | $34.0 billion | Weekly total only; component allocation unavailable |
| March 1–November 6, 2026 | $112.2 billion | Provisional combined total; later portion remains unallocated |
The full-period low, base and high benchmarks are $93.2 billion, $112.2 billion and $121.4 billion. They use the same baseline rules described below, with the later weekly price assigned to its Monday survey month. Each figure uses a different assumed price path.
“Regular-price-equivalent” values EIA’s all-grade gasoline consumption proxy at the regular gasoline price. EIA’s product supplied measures the volume reaching the domestic market, including gasoline used outside households. The model prices that volume at two price paths.
For each month, convert average barrels per day into gallons by multiplying by the number of days and the 42 gallons in a barrel. Multiply those gallons by that month’s component price minus the baseline component price. Add the monthly differences. The matched March–August period represents 68.901 billion gallons. All four components add back to the published retail price for every month with published component inputs.7
The later estimate uses weekly volumes, the retail survey from the same supply week, and only the days falling in the selected interval. It does not count September days twice or project quantity beyond November 6. The November 9 price is newer than the quantity endpoint.
Three assumptions carry most of the result: the price path that would have prevailed without the measured increase, the use of product supplied as the volume proxy, and the allocation method used for crude and refining. The model tests all three.
Would gas have become more expensive anyway?
Some seasonal increase would have been ordinary; assuming February prices lasted indefinitely produces a larger estimate than a seasonal benchmark. The model’s low, base and high cases span $62.6 billion to $84.9 billion for March–August, for the same period and quantities.
| Case | Baseline | March–August extra bill |
|---|---|---|
| Low | February 2026 plus the ordinary-season benchmark | $62.6 billion |
| Base | Each February 2026 component held flat | $78.1 billion |
| High | Each January 2026 component held flat | $84.9 billion |
Source: EIA monthly component history and product supplied; author’s baseline comparisons. Each case changes the benchmark while holding the period and observed volumes constant.
The estimated extra bill runs from $62.6 billion to $84.9 billion depending on the baseline price
Extra national gasoline spending versus each baseline, March–August 2026, same observed gallons in every case, USD billions
Show the numbers
| USD billions | Extra spending |
|---|---|
| Seasonal benchmark (low) | $62.6bn |
| Prewar EIA forecast | $70.8bn |
| February held flat (base) | $78.1bn |
| January held flat (high) | $84.9bn |
The seasonal case adds the average same-month change from February in 2019, 2023, 2024 and 2025 to the February 2026 baseline. I chose those years to avoid the pandemic and the initial 2022 energy shock. The case removes ordinary seasonal changes in crude, refining and distribution before calculating the remainder.
The base case uses the most recent monthly component observation before the March jump. The high case uses January’s lower price. A further check uses EIA’s February 10, 2026 forecast, prepared before the conflict: spending above that forecast is $70.8 billion for the same March–August gallons. That benchmark falls between the seasonal and flat-February cases.8
The chosen baseline also changes the explanation. Under the seasonal case, refining’s extra dollars fall from about $24.5 billion to $12.3 billion, while crude accounts for about 70.0% of the smaller total. The claim that crude was the largest component survives; the precise size of the refining increment is less secure.
The sensitivity table changes the base price and represented volume directly. A positive baseline adjustment means the comparison price is higher, so the measured extra bill is lower.
| Volume assumption | Baseline −$0.10/gal | No change | Baseline +$0.10/gal | Baseline +$0.20/gal |
|---|---|---|---|---|
| 95% of observed proxy volume | 80.8 | 74.2 | 67.7 | 61.1 |
| 100% of observed proxy volume | 85.0 | 78.1 | 71.2 | 64.3 |
| 105% of observed proxy volume | 89.3 | 82.0 | 74.8 | 67.5 |
March–August 2026, extra regular-price-equivalent spending in $ billions. The volume factors are scenario assumptions. Formula: volume factor × [base extra spending − baseline-price adjustment × gallons].
For a household using 50 gallons every month, March–August prices imply $340.60 more spending than the same use at February’s regular price. The calculator adds 50 times each monthly price difference.
Did oil companies or gas stations keep the increase?
Crude and refining explain most of the additional cost in the national model. Reported gross margins do not measure net profit from the national gasoline increase, but company results show that different businesses had different outcomes.
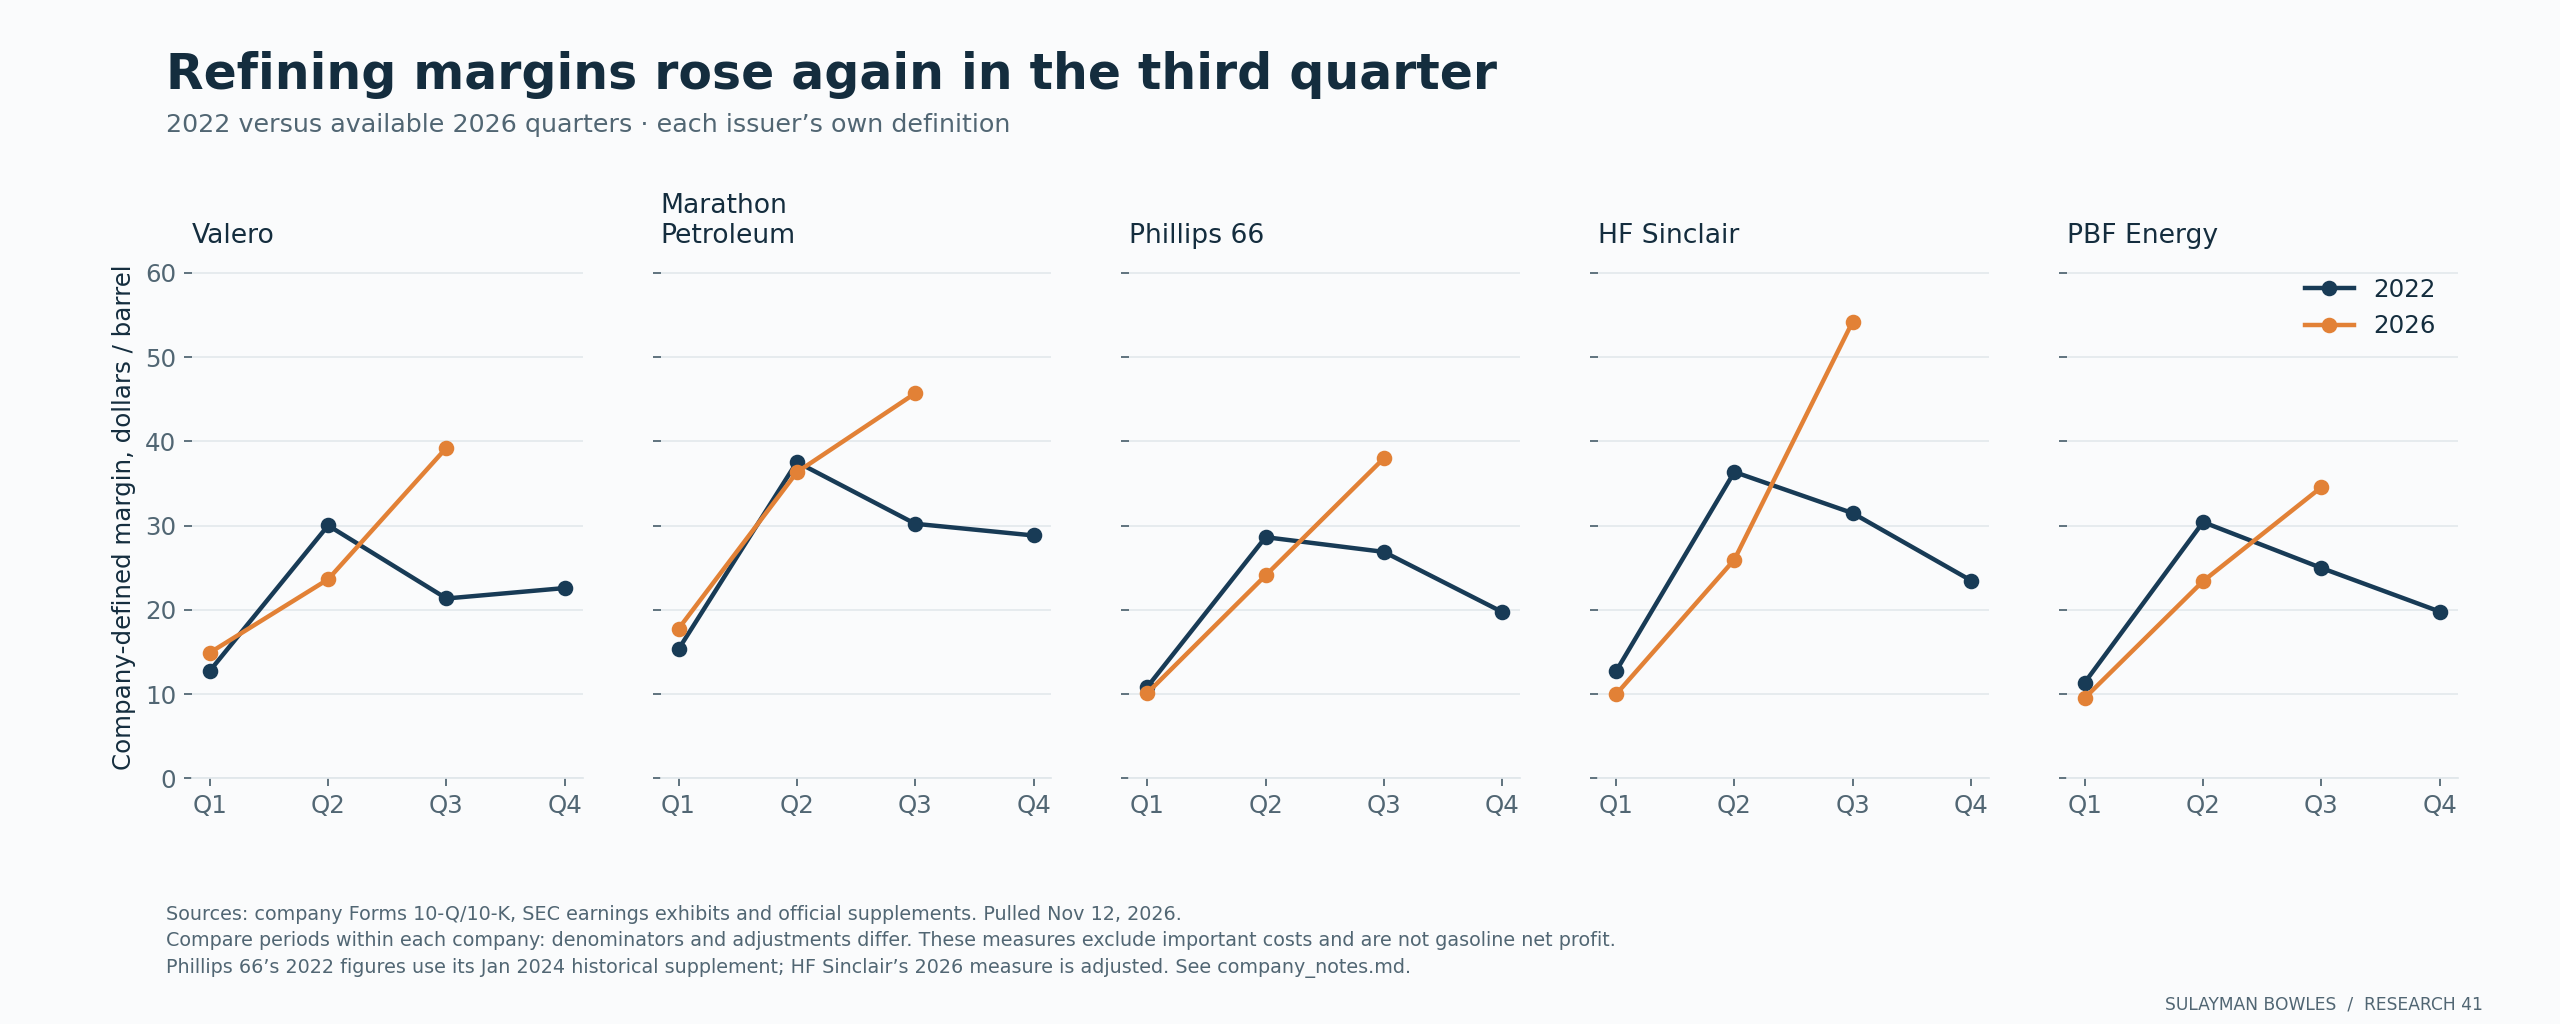
All five refiners in this panel reported higher company-defined margins in the quarter ended September 30, 2026 than in the quarter ended June 30. Their reported measures are shown beside 2022, each on the company’s own denominator.
| Company | 2022 Q1 | 2022 Q2 | 2022 Q3 | 2022 Q4 | 2026 Q1 | 2026 Q2 | 2026 Q3 |
|---|---|---|---|---|---|---|---|
| Valero | 12.74 | 30.01 | 21.34 | 22.58 | 14.90 | 23.62 | 39.24 |
| Marathon Petroleum | 15.31 | 37.54 | 30.21 | 28.82 | 17.74 | 36.33 | 45.70 |
| Phillips 66 | 10.83 | 28.62 | 26.87 | 19.73 | 10.11 | 24.08 | 38.00 |
| HF Sinclair | 12.69 | 36.36 | 31.47 | 23.47 | 9.95 | 25.95 | 54.22 |
| PBF Energy | 11.36 | 30.41 | 24.96 | 19.78 | 9.53 | 23.40 | 34.56 |
Dollars per barrel under each company’s definition; calendar quarters. Sources: the companies’ Forms 10-Q, Forms 10-K, SEC earnings exhibits and official financial supplements.
 (opens the full-size image)
Marathon describes its per-barrel measure as “Sales revenue less cost of refinery inputs and purchased products, divided by net refinery throughput.” Operating and distribution expenses are not deducted in that measure. Valero also excludes operating expenses and depreciation from refining margin. Phillips 66 uses processed inputs, including its proportionate affiliate share. HF Sinclair uses produced refined-product barrels sold; PBF uses crude and feedstock throughput and the selected measure excludes special items.9
These definitions make within-company changes more informative than a league table. Phillips 66’s 2022 values come from its January 2024 historical supplement, which supersedes the original 2022 presentation. HF Sinclair’s 2026 measure is adjusted gross margin, whereas the older releases use the gross-margin label; the panel is not fully harmonized. PBF’s first-quarter 2026 measure excludes an inventory write-down reversal.
The producer comparison tells a different third-quarter story. All five selected realized-price measures declined from the second to the third quarter of 2026. A realized price is what the company reports receiving for its specified product mix, with the treatment of hedges identified in the source.
| Company | Reported realization measure | 2022 Q3 | 2026 Q1 | 2026 Q2 | 2026 Q3 |
|---|---|---|---|---|---|
| ExxonMobil | U.S. crude realization (USD/bbl) | 91.69 | 70.12 | 97.58 | 84.82 |
| Chevron | U.S. crude oil and natural gas liquids realization (USD/bbl) | 76.00 | 51.94 | 70.80 | 62.72 |
| ConocoPhillips | Total average realized price (USD/BOE) | 83.07 | 50.36 | 62.33 | 61.40 |
| EOG Resources | Composite crude oil and condensate realization (USD/bbl) | 96.04 | 72.47 | 98.15 | 86.72 |
| Diamondback Energy | Unhedged oil realization (USD/bbl) | 89.79 | 73.47 | 96.82 | 87.30 |
Quarterly realization measures use different products and units; they are not a ranking. “bbl” means a barrel; BOE means a barrel of oil equivalent, an energy-based unit combining oil and gas. All observations above are reported quarterly averages.
| Company | 9M 2022 operating cash flow, $bn | 9M 2026 operating cash flow, $bn |
|---|---|---|
| ExxonMobil | 59.176 | 57.910 |
| Chevron | 37.104 | 41.161 |
| ConocoPhillips | 21.722 | 18.924 |
| EOG Resources | 7.649 | 11.448 |
| Diamondback Energy | 4.884 | 8.016 |
GAAP means generally accepted accounting principles. Operating cash flow is GAAP net cash from operating activities, in $ billions, for the nine months ended September 30 of each year. It includes working-capital changes and, for integrated companies, activities beyond producing crude. Acquisitions and other changes in company footprints limit same-asset comparisons. The supporting CSV includes every 2022 quarter and every available 2026 quarter, with the original source for each value.10
Retail outcomes differed too. Murphy USA’s retail fuel margin fell from 35.1 cents per gallon in Q2 2026 to 27.4 cents in Q3, compared with 39.3 cents in Q3 2022. Its broader Q3 2026 fuel contribution was 37.0 cents, including supply and renewable-credit activity. Substituting that broader measure for its station retail margin would change the question.11
Casey’s reported 47.8 cents per gallon for the three months ended July 31, 2026, compared with 44.7 cents for the equivalent period ended July 31, 2022. Its fiscal calendar differs from the refiners’ calendar quarters, and its margin excludes credit-card fees. Results for the quarter ended October 31, 2026 were not available at the research cut. Fuel margin also has to cover relevant business costs; it is not net earnings on a gallon.11
The full company table shows where commercial conditions improved or deteriorated. It is not a second allocation of the national bill.
Why do gas prices go up faster than they go down?
The initial association between weekly crude and pump-price changes was steeper in rising-crude weeks than in falling-crude weeks. In the January–October 2026 sample, both directions had their largest positive correlation at the first Monday survey among the tested delays. The largest fitted response occurs at that delay.
| Sample | Rising-week slope (95% reference interval) | Rising weeks | Falling-week slope (95% reference interval) | Falling weeks |
|---|---|---|---|---|
| 2019–2025 | 6.8¢ (5.2 to 8.3) | 201 | 4.0¢ (3.0 to 5.1) | 164 |
| 2022 | 8.9¢ (4.0 to 13.7) | 29 | 3.3¢ (-1.1 to 7.7) | 23 |
| 2026 | 8.9¢ (5.7 to 12.1) | 25 | 3.6¢ (0.9 to 6.4) | 19 |
Estimated regression slopes, scaled to a 10-cent-per-gallon difference in the weekly Brent crude-equivalent change, at the first following Monday survey. Fits for rising and falling crude weeks each have their own intercept. The values describe a marginal association within each group; they are not predicted pump changes after an exact positive or negative 10-cent crude move. The 2026 sample covers January–October, through the crude-price week ended October 30; it is not restricted to the conflict. The 2019–2025 comparison includes 2022.
Pump prices rose about 7 to 9 cents per 10-cent crude rise in rising-crude weeks, against 3 to 4 cents in falling weeks
Change in the following Monday’s U.S. regular pump price per 10-cent change in Brent, cents, fitted separately for rising and falling weeks
Show the numbers
| cents per 10¢ change in crude | Rising-crude weeks | Falling-crude weeks |
|---|---|---|
| 2019–2025 | 6.8¢ | 4.0¢ |
| 2022 | 8.9¢ | 3.3¢ |
| 2026 | 8.9¢ | 3.6¢ |
In 2026 the link between crude and pump changes faded after the first Monday in rising-crude weeks
Simple correlation between Brent change and the pump-price change 0 to 6 additional weeks after the first Monday, 2026
Show the numbers
| correlation | Rising-crude weeks | Falling-crude weeks |
|---|---|---|
| 0 | 0.77 | 0.56 |
| 1 | 0.47 | 0.41 |
| 2 | −0.05 | 0.12 |
| 3 | −0.31 | 0.42 |
| 4 | −0.07 | 0.40 |
| 5 | −0.23 | 0.49 |
| 6 | 0.03 | 0.51 |
The calculation divides Brent’s dollar-per-barrel change by 42, then compares it with the following Monday’s change in the national regular price. The workbook also tests up to six additional weekly delays. These separate regressions do not add to a cumulative response: their observations overlap, and subsequent crude and product-market changes matter.
The table’s 95% intervals come from an ordinary least-squares fit and assume independent regression errors. Weekly fuel markets can violate that assumption, so the intervals leave the strength of any asymmetry uncertain. They cannot show whether adjustment became faster or slower than in 2022; a causal speed estimate would require controls for product-market conditions and a model of the full adjustment path.13
Brent fell from $124.61 per barrel in the week ended April 10 to $69.70 in the week ended July 3. National regular gasoline fell from its May 11 peak to $3.777 on July 6, a decline of 72.3 cents per gallon, but remained above February’s level. Crude later rose again; this was not one uninterrupted decline.12
An ordinary mechanism is the timing difference between wholesale and retail repricing, together with inventories and continuing demand for refined products. EIA’s methodology explicitly describes how this timing moves apparent margins between refining and distribution. The descriptive regressions cannot separate these mechanisms, estimate an exact adjustment time, or show which participants changed prices first.2
Why is gas so expensive in California vs Texas?
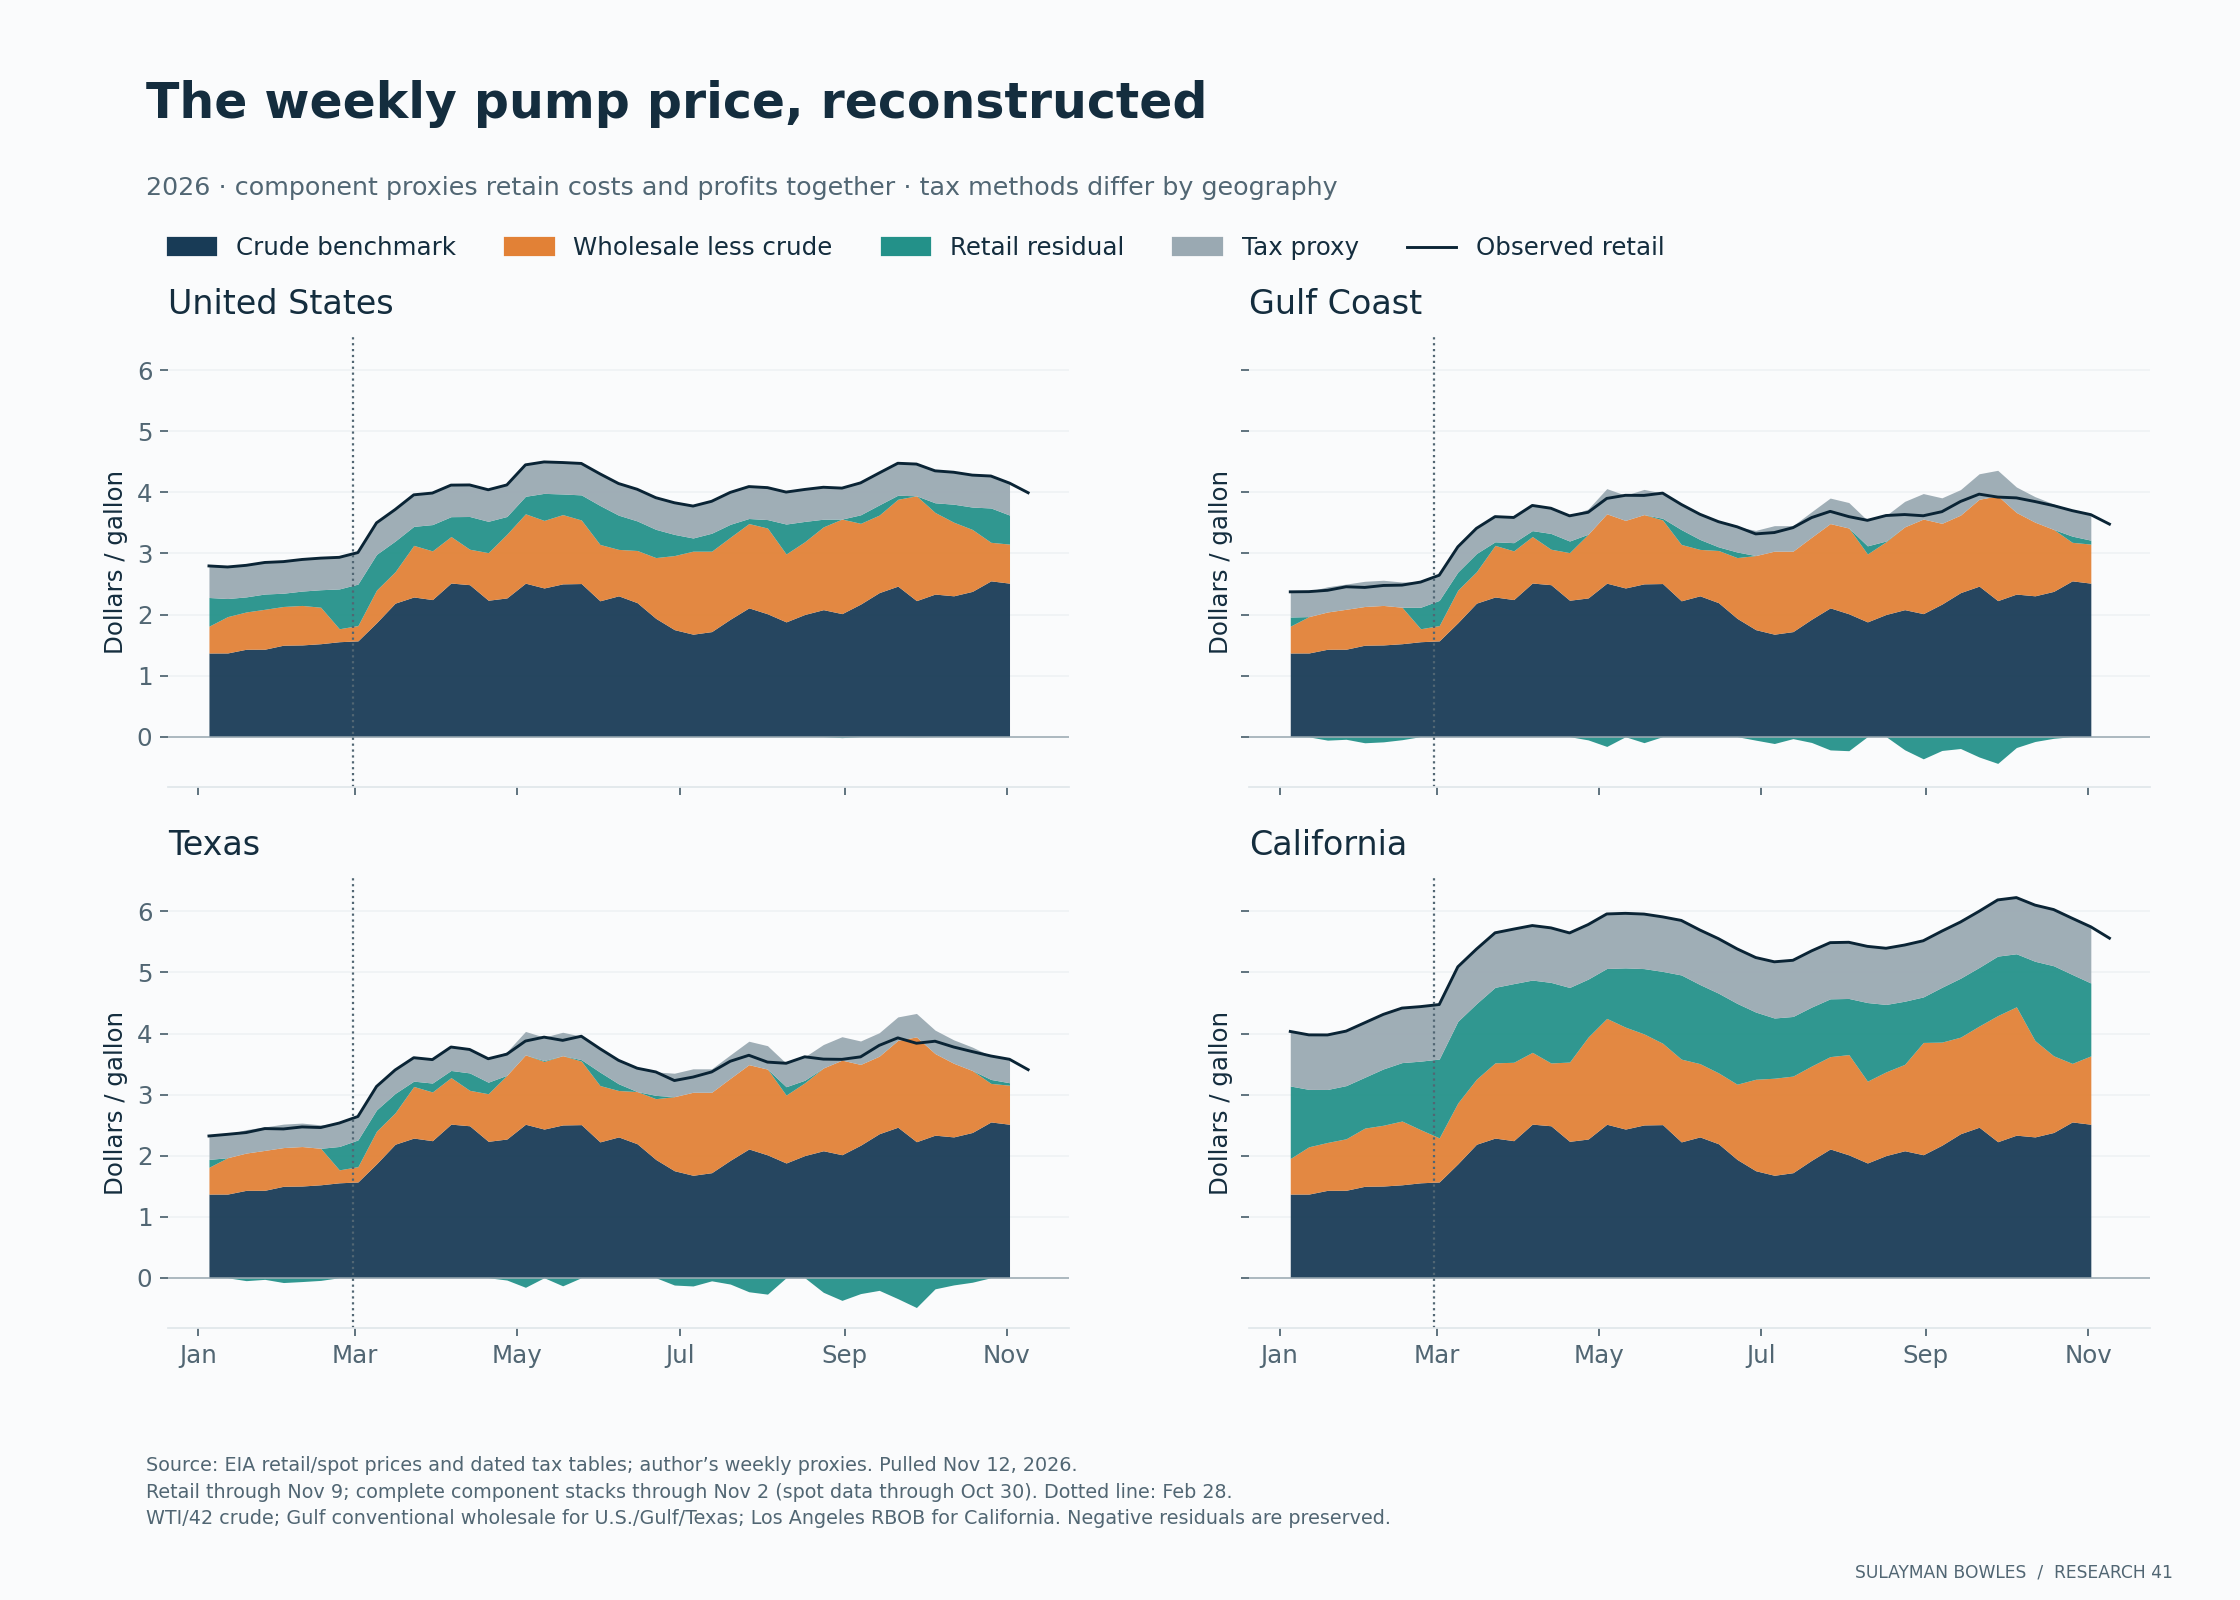
California’s November 9 regular price was $2.154 per gallon above Texas’s. Taxes explain part of the gap; different gasoline specifications, regional supply constraints, shipping and refinery conditions also matter.3, 14
The weekly charts below reconstruct a research proxy, not an unpublished official EIA regional series. They use an observed regional retail price, a crude benchmark, a regional wholesale benchmark, a dated tax proxy, and a residual. All four pieces add to the observed pump price, but that identity alone does not prove the economic allocation is exact.
 (opens the full-size image)
I found no exact weekly four-way EIA breakdown for the country, Gulf Coast, Texas and California; EIA publishes the national component breakdown monthly. The Gulf Coast tax proxy is the unweighted mean of its constituent states, with the full range shown. State tables omit local taxes and some receipt-based taxes. California’s table uses the state’s posted sales-tax prepayment.
For California, the package also includes the Energy Commission’s monthly breakdown into crude, refining, distribution, carbon programs, fuel taxes, sales tax and the underground-storage fee. Its available workbook begins in May 2024. This is a better way to inspect those categories than assigning every unexplained California cent to a station. The weekly research series begins in 2019; the earlier state-specific official component inputs remain unavailable.14
The CEC file has small differences between its component sums and printed totals in three historical 2025 months. The workbook assigns each difference to a reconciliation residual. The 2026 California rows reconcile without that adjustment.
Are exports making gas prices higher?
Disrupted overseas supply can draw buyers toward U.S. fuel, but exports did not move uniformly during the initial closure. Compared with February 2026, average crude and distillate exports increased in March–May, while finished-gasoline exports decreased.
| Product | February 2026 | March–May 2026 | Change vs February | August 2026 |
|---|---|---|---|---|
| Crude oil | 4.345 | 5.116 | +17.75% | 3.992 |
| Finished motor gasoline | 0.865 | 0.779 | -9.95% | 0.845 |
| Distillate fuel oil | 1.141 | 1.530 | +34.12% | 1.733 |
Million barrels per day; March–May is weighted by calendar days. EIA monthly exports, latest observed month August 2026, released October 30. Distillate includes diesel and heating oil. EIA reports blending components in their own series.
Crude oil exports rose 17.7% in March–May from February, then fell below February’s level by August
Crude oil exports, million barrels per day: February, March–May average and August 2026
Show the numbers
| million barrels per day | Crude oil |
|---|---|
| February | 4.345 |
| March–May | 5.116 |
| August | 3.992 |
Finished gasoline exports fell 10.0% in March–May and were still 2.3% below February in August
Finished motor gasoline exports, million barrels per day: February, March–May average and August 2026
Show the numbers
| million barrels per day | Finished motor gasoline |
|---|---|
| February | 0.865 |
| March–May | 0.779 |
| August | 0.845 |
Distillate exports rose 34.1% in March–May and 51.9% by August
Distillate fuel oil exports, million barrels per day: February, March–May average and August 2026
Show the numbers
| million barrels per day | Distillate fuel oil |
|---|---|
| February | 1.141 |
| March–May | 1.530 |
| August | 1.733 |
EIA’s midyear market review describes foreign demand supporting U.S. refinery activity and product exports. The product flows show how export demand can affect Gulf Coast supply. These national series cannot isolate how many Gulf Coast cents came from exports apart from crude supply, refinery constraints, inventories and domestic demand. I found no primary causal estimate of that regional price effect.15
Did reserve releases and shipping waivers lower prices?
The records give authorized barrels, observed stock changes and reported cargo movements. A price effect would require a credible estimate of what pump prices would have been without those interventions.
The Department of Energy authorized a 172 million-barrel U.S. Strategic Petroleum Reserve release on March 11, within a 400 million-barrel international action; the two amounts should not be added. DOE said October 29 awards completed its U.S. commitment, but awards and scheduled deliveries are different. Some delivery schedules extended into November and December.16
Observed reserve stocks were 279.535 million barrels on November 6, down 135.906 million barrels from February 27. The stock change nets all inflows and outflows over the period. A fall in prices over the same interval cannot simply be assigned to the release.
The limited Jones Act shipping waiver began March 17 and was extended. The current loading deadline is November 15, 2026, at 11:59 p.m. Eastern, with vessel-availability checks and individual voyage authorization under the latest extension. The U.S. Maritime Administration (MARAD) publishes movement reports documenting cargoes moved. Their rows mix units and sometimes port legs, so I report no aggregate delivered total or pump-price effect.17
How did higher oil prices affect Texas?
Texas collected substantially more oil production tax, while the available Railroad Commission of Texas (RRC) reports do not yet provide a clean measure of the latest Permian production response. The tax result is measurable; attributing every extra tax dollar or production change to the war is not.
Texas oil production-tax collections were $4.213 billion in April–October 2026, compared with $2.979 billion in the same months of 2025: an increase of $1.234 billion. Against a flat January–March 2026 monthly baseline, the increase is $1.533 billion. Natural-gas production-tax receipts over April–October were lower than the previous year.18
Texas oil production-tax collections were higher than a year earlier in each month from April to October 2026
Texas oil production-tax collections, USD billions per month, April–October 2025 and 2026
Show the numbers
| USD billions | 2025 | 2026 |
|---|---|---|
| Apr | $0.44bn | $0.57bn |
| May | $0.41bn | $0.68bn |
| Jun | $0.41bn | $0.74bn |
| Jul | $0.43bn | $0.57bn |
| Aug | $0.45bn | $0.53bn |
| Sep | $0.44bn | $0.51bn |
| Oct | $0.41bn | $0.63bn |
Reported Permian-district oil output falls from 4.4 million barrels a day in February to 3.7 in August, but recent months are incomplete
Reported oil plus condensate, Railroad Commission districts 7C, 08 and 8A (Texas only), million barrels per day, January–August 2026
Show the numbers
| million barrels per day | Reported production |
|---|---|
| Jan | 4.24 |
| Feb | 4.42 |
| Mar | 4.36 |
| Apr | 4.34 |
| May | 4.23 |
| Jun | 4.10 |
| Jul | 4.02 |
| Aug | 3.72 |
Oil production tax is generally based on the value of produced oil, with exemptions and payment timing affecting collections. These severance taxes apply to upstream oil value, including oil outside U.S. gasoline consumption. Adding the whole Texas increase to the national pump-tax row would mix scopes and risk double-counting. Texas’s gasoline excise rate itself did not rise in the semiannual source observations used here.18
The RRC’s Texas Permian series covers districts 7C, 08 and 8A, excluding New Mexico. Reported oil plus condensate averaged 4.324 million barrels per day in January–February, versus 4.352 million in March–April, a 0.65% increase. Later reported volumes fall, but recent months are less complete. The agency explicitly warns that late and corrected reports change the history. Calling those incomplete recent values a production collapse would overstate what the documents show.19
How much did gasoline add to inflation?
Gasoline directly added 0.644 percentage points to March 2026’s monthly consumer-price increase, according to the Bureau of Labor Statistics. It subtracted 0.394 percentage points in June and added 0.042 percentage points in October.
Gasoline added 0.64 points to March’s consumer-price rise, took off 0.39 in June and added 0.04 in October
Gasoline’s direct contribution to the monthly seasonally adjusted CPI, percentage points, January–October 2026
Show the numbers
| percentage points | Contribution to monthly CPI |
|---|---|
| Jan | −0.100 |
| Feb | 0.024 |
| Mar | 0.644 |
| Apr | 0.198 |
| May | 0.269 |
| Jun | −0.394 |
| Jul | −0.105 |
| Aug | 0.140 |
| Sep | 0.337 |
| Oct | 0.042 |
These are BLS’s published effects on the seasonally adjusted monthly Consumer Price Index, or CPI, from the agency’s contribution table. March’s all-items CPI increase was 0.9% and October’s was 0.4%. The effect is gasoline’s direct contribution; it does not measure all indirect freight, food or other consequences of energy costs. The initial-release monthly effects should not be added and described as an exact annual contribution.20
When will gas prices go down?
Prices had already fallen in the latest November 9 survey, but the November EIA outlook still assumes a prolonged recovery in product supply. A sustained decline would be supported by a lower crude bill and relief in the wholesale gasoline market; cheaper crude alone does not determine the final retail price.
Three pieces of evidence would change the answer most. Revised monthly component and volume data could alter the cumulative allocation. Restored production and shipping, together with lower wholesale gasoline prices, could reduce the refining portion. Later company filings could show whether wider reported margins survived the costs excluded from the selected measures.
One source discrepancy matters. The crude cost implied by EIA’s published component table does not always equal its current composite refiner-acquisition-cost series. In May, for example, the implied figure is $97.63 per barrel, versus $104.62 in the current acquisition-cost file. EIA’s documentation does not explain the difference.21
Substituting the current acquisition-cost series and holding the combined crude-plus-refining amount fixed moves $0.595 billion from refining to crude over March–August. Crude’s share becomes 57.1%, versus 56.3% in the published-table reconstruction. The largest-component conclusion survives that check. The exact allocation remains sensitive to source vintage and, more strongly, to the baseline.
The tax increment is less precise: its calculated $0.091 billion is smaller than the approximately $0.239 billion bound from rounding the published tax percentages. The public conclusion is “roughly unchanged,” not a precise estimate of extra tax receipts.
How can I check the numbers or calculate my own bill?
Download the formula workbook, compact monthly inputs, weekly component dataset, and source register.
The linkable dataset joins observed prices, dated crude and wholesale benchmarks, tax proxies and explicit residuals for the United States, Gulf Coast, Texas and California from 2019 onward. The national monthly allocation and the regional weekly diagnostic are reported at their respective frequencies. Readers can check the arithmetic without treating an estimate as a published regional profit series.
Refresh: check the waiver on November 15, 2026, prices after the scheduled November 17 release, monthly supply after November 30, and acquisition costs after December 1. The next EIA outlook is scheduled for December 8. Check Casey’s next fiscal-quarter results when released. The full quarterly research refresh is targeted for February 15, 2027, after the available fourth-quarter company results and updated agency data are collected.
Related reading
Who earns Texas’s electricity delivery charge? traces another energy bill from what households pay to the companies and public entities that receive it.
Frequently asked questions
Why are gas prices so high?
Higher crude acquisition costs and refining spreads explain most of the 2026 increase. For March–August, the model assigns 56.3% of extra regular-price-equivalent spending to crude and 31.4% to refining, relative to February. These components include costs and profits.
How much more did drivers pay for gas in 2026?
The March–August estimate is $78.1 billion above February prices. A weekly estimate adds $34.0 billion for September 1–November 6. The combined $112.2 billion uses regular prices and EIA’s consumption proxy.
What do gas stations receive?
The distribution and marketing residual accounts for about 12.2 cents of each extra dollar in the March–August base case. That residual includes transport, storage and retail costs. The model does not isolate station net profit.
Why is gas more expensive in California than Texas?
On November 9, 2026, regular gasoline averaged $5.562 per gallon in California and $3.408 in Texas. Taxes, gasoline specifications, regional supply and shipping conditions contribute to the difference; the available data do not isolate every weekly cent.
When will gas prices go down?
EIA’s November 10, 2026 outlook forecasts U.S. regular gasoline averaging $3.73 per gallon in 2027. That forecast depends on supply recovery and continuing product-market constraints.
Sources and reconstruction notes
- Monthly source rows March–August and baseline February 2026. Formula outputs: episode_allocation.csv and Findings sheet. EIA_COMPONENTS: EIA Gasoline Pump Components History — Monthly table, Jan2019–Aug2026; each month is a source key; EIA_MGFUPUS2: EIA monthly finished motor gasoline product supplied — Data 1; MGFUPUS2; thousand barrels/day; Jan2019–Aug2026. All sources pulled November 12, 2026. ↩
- Definitions of crude, refining, distribution/marketing and taxes; timing effects described in the methodology. EIA_METHOD: EIA Methodology for Gasoline and Diesel Fuel Pump Components — Crude Oil; Refining Costs & Profits; Distribution & Marketing Costs & Profits; Taxes. All sources pulled November 12, 2026. ↩
- Data 3, weekly regular all-formulations series for U.S., PADD3, Texas and California; dates are the observation keys. EIA_RETAIL_W: EIA weekly regular gasoline prices, all formulations — Data 3; sourcekeys EMM_EPMR_PTE_NUS_DPG, R30, STX, SCA; date rows; EIA_RETAIL_PAGE: EIA Gasoline and Diesel Fuel Update — U.S. Regular Gasoline Prices table; Nov9 column. All sources pulled November 12, 2026. ↩
- The White House July statement dates the memorandum to June 17 and reports renewed vessel attacks on July 6 and 7. The policy-event CSV lists the other dated source observations. P_EIA_Q1: EIA first quarter petroleum market review — Opening paragraph and Crude oil prices; P_EIA_APR28: EIA International LNG prices rise amid Strait of Hormuz closure — Opening section; no laden LNG transits March 1-April 24; P_EIA_JUL7: EIA July STEO press release — Opening paragraphs and Global oil markets bullet; P_EIA_Q2: EIA second quarter petroleum market review — Crude oil prices and inventories; Refinery margins; Petroleum product exports. All sources pulled November 12, 2026. ↩
- November 10 release, forecast completed November 5; annual gasoline prices and conditional production/product-supply assumptions. EIA_NOV26_STEO: EIA November2026 Short-Term Energy Outlook — Forecast overview; Petroleum Products table; EIA_NOV26_PRODUCTS: EIA November2026 petroleum products outlook — U.S. refinery inputs; Petroleum Products table. All sources pulled November 12, 2026. ↩
- Weekly quantity and Monday price alignment; September 1–November 6 overlap days. The current WPSR value is in its own column. EIA_WGFUPUS2: EIA weekly finished motor gasoline product supplied — Data 1; WGFUPUS2; thousand barrels/day; throughOct30; P_WPSR_TABLE1_NOV12: EIA Weekly Petroleum Status Report Table 1, week ended November 6 2026 — Dated header 11/6/26; row-level locators in wpsr_fresh_2026_11_06.csv; EIA_RETAIL_W: EIA weekly regular gasoline prices, all formulations — Data 3; sourcekeys EMM_EPMR_PTE_NUS_DPG, R30, STX, SCA; date rows. All sources pulled November 12, 2026. ↩
- Thousand barrels/day × 1,000 × 42 × days; volume proxy includes all grades. EIA_MGFUPUS2: EIA monthly finished motor gasoline product supplied — Data 1; MGFUPUS2; thousand barrels/day; Jan2019–Aug2026; EIA_WGFUPUS2: EIA weekly finished motor gasoline product supplied — Data 1; WGFUPUS2; thousand barrels/day; throughOct30. All sources pulled November 12, 2026. ↩
- 2tab, MGRARUS_$ monthly 2026 forecasts. This is EIA’s pre-conflict price forecast. EIA_FEB26_STEO: EIA February2026 Short-Term Energy Outlook data — 2tab; MGRARUS_$, RACPUUS, MGWHUUS_$; 2026 monthly columns. All sources pulled November 12, 2026. ↩
- Exact definition and historical-vintage notes in company/company_notes.md; each quarter links to its original filing in company_sources.csv. VLO_2026Q3: Issuer investor relations release or supplement — Refining segment operating highlights; consolidated operating statistics; notes (h), (k); MPC_2026Q3: SEC filing or furnished earnings exhibit — Release page 9 per-barrel table footnote (a); page 17 Refining & Marketing Margin definition and reconciliation; PSX_2026Q23: Issuer investor relations release or supplement — Reconciliation of Refining Income Before Income Taxes to Realized Refining Margins; Q3 and Q2 columns; footnote 2; HF_2026Q3: SEC filing or furnished earnings exhibit — Refining narrative; reconciliation to adjusted refinery gross margin; consolidated rows; PBF_2026Q3: SEC filing or furnished earnings exhibit — Non-GAAP measures: gross refining margin excluding special items; three months ended September 30. All sources pulled November 12, 2026. ↩
- Latest realization and cash-flow schedules; source IDs for every 2022 and 2026 quarter are in company/producer_metrics.csv. Annual/interim cumulative checks are in cashflow_reconciliation.csv. XOM_2026_PRICES: SEC filing or furnished earnings exhibit — Investor Relations Data Summary page 5: Average Realization Data, United States, Crude ($/b); 3Q26, 2Q26, 1Q26; XOM_2026_CF3: SEC filing or furnished earnings exhibit — 10-Q page 35: Cash flow from operations and asset sales; U.S. GAAP net cash provided row; CVX_2026_Q3: SEC filing or furnished earnings exhibit — Q3 release: U.S. Upstream Liquids Realization; Attachment 3, cash flow statement; COP_2026_Q3: SEC filing or furnished earnings exhibit — Third-quarter review: total realized price; Table 2: Net Cash Provided by Operating Activities; EOG_2026: Issuer investor relations release or supplement — Key Financial Results: GAAP net cash provided; historical Wellhead Volumes and Prices table, Composite crude and condensate; cash flow historical quarterly table; FANG_2026_Q3: SEC filing or furnished earnings exhibit — Realized Average Prices, Oil ($ per Bbl) unhedged; financial update and Consolidated Statement of Cash Flows. All sources pulled November 12, 2026. ↩
- Retail source IDs are additionally resolved by the exact company/period rows in company/retailer_margins.csv. MUSA_2026Q2: SEC filing or furnished earnings exhibit — Fuel table; Retail fuel margin (cpg) and total fuel contribution; MUSA_2026Q3: SEC filing or furnished earnings exhibit — Fuel table; Retail fuel margin (cpg) and total fuel contribution; MUSA_2022Q3: SEC filing or furnished earnings exhibit — Fuel key operating metrics table; CASY_FY27Q1: SEC filing or furnished earnings exhibit — Fuel table, quarter ended July31 2026; footnote 2 excluding wholesale/terminal activity; CASY_FY23Q12: Issuer investor relations release or supplement — Fuel historical quarterly table, F2023 Q1 (Jul31) and Q2 (Oct31). All sources pulled November 12, 2026. ↩
- Brent week-ending dates and the following Monday regular-price observations; no present-day crude quote is inferred. EIA_BRENT: EIA weekly Brent spot price — Data 1; RBRTE; USD/bbl; week-ending date rows; EIA_RETAIL_W: EIA weekly regular gasoline prices, all formulations — Data 3; sourcekeys EMM_EPMR_PTE_NUS_DPG, R30, STX, SCA; date rows. All sources pulled November 12, 2026. ↩
- Ordinary least squares by crude-change sign. Sxx=Σx²−(Σx)²/n; Sxy=Σxy−ΣxΣy/n; slope=Sxy/Sxx. SE=sqrt([(Syy−slope×Sxy)/(n−2)]/Sxx); interval=slope±t(0.975, n−2)×SE. Reference intervals assume independent errors. Workbook Lag summary and statistical_inputs.csv record calculations and critical inputs. EIA_BRENT: EIA weekly Brent spot price — Data 1; RBRTE; USD/bbl; week-ending date rows; EIA_RETAIL_W: EIA weekly regular gasoline prices, all formulations — Data 3; sourcekeys EMM_EPMR_PTE_NUS_DPG, R30, STX, SCA; date rows; SCIPY_T_QUANTILE: SciPy Student t distribution reference — ppf(q, df), inverse CDF; t critical values at q=0.975, df=n−2. All sources pulled November 12, 2026. ↩
- CEC workbook Data rows 5 through 14; separate carbon/tax categories. Tax table source and state footnotes are preserved in policy CSVs. CEC_COMPONENTS: California Energy Commission gasoline price breakdown — Data rows 5 through 14, month columnsMay2024–Aug2026; CEC_METHOD: CEC estimated gasoline breakdown and margins definitions — Definition of Terms; Refiner Margin; Distribution Margin; CEC_PRICE_DRIVERS: CEC What Drives California Gasoline Prices — An Isolated Market; Why Do Prices Vary Around California?; P_EIA_FUELTAX: EIA Federal and state motor fuels taxes; Jan2019-Jul2026 — January and July sheets; gasoline columns B through E. All sources pulled November 12, 2026. ↩
- Monthly national export rates; average March–May weighted by days. No causal regional price effect identified. P_EIA_MCREXUS2: EIA U.S. exports of Crude oil — Data 1; MCREXUS2; monthly thousand barrels/day; P_EIA_MGFEXUS2: EIA U.S. exports of Finished motor gasoline — Data 1; MGFEXUS2; monthly thousand barrels/day; P_EIA_MDIEXUS2: EIA U.S. exports of Distillate fuel oil — Data 1; MDIEXUS2; monthly thousand barrels/day; P_EIA_Q2: EIA second quarter petroleum market review — Crude oil prices and inventories; Refinery margins; Petroleum product exports. All sources pulled November 12, 2026. ↩
- Announcements, award/delivery schedules and observed stocks have different meanings; inventory dates February 27 and November 6. P_DOE_MAR11: DOE initial SPR release authorization — Secretary statement first two paragraphs; P_DOE_SEP29: DOE continued SPR release commitments — RFP paragraph; prior solicitations and delivery schedule; P_DOE_OCT29: DOE emergency exchange contract awards — Opening paragraph and Under Secretary quotation; P_EIA_SPR_HISTORY: EIA weekly US ending stocks of crude oil in SPR — Data 1; WCSSTUS1 thousand barrels; P_WPSR_TABLE1_NOV12: EIA Weekly Petroleum Status Report Table 1, week ended November 6 2026 — Dated header 11/6/26; row-level locators in wpsr_fresh_2026_11_06.csv. All sources pulled November 12, 2026. ↩
- Authorization dates/loading deadline and reported completed movement workbooks; mixed-unit rows not summed. P_IRS_JONES: IRS income reporting for foreign corporations operating under Jones Act waiver — Opening two substantive paragraphs; P_CBP_AUG13: CBP CSMS 69519766 Updated Guidance 4 — First two paragraphs; vessel availability and individual voyage process; P_MARAD_MAR: MARAD completed movements under March and May waivers — Web Completed Movements sheet; rows 2-296, columns B through N; P_MARAD_AUG: MARAD completed movements under August extension — Web Completed Movements sheet; rows 2-48, columns B through N. All sources pulled November 12, 2026. ↩
- Historical all-funds spreadsheet and current revenue page; source units USD thousands. The calculation converts fiscal-report entries to calendar months. P_TX_HIST: Texas Monthly Revenue Watch historical All Funds excluding trusts — FY 2019 through FY 2026 sheets; Oil Production Tax, Natural Gas Production Tax, Motor Fuel Taxes rows; P_TX_LIVE: Texas Monthly Revenue Watch All Funds — Tax Collections by Major Tax; September and October 2026 columns; P_TX_CRUDE_RATE: Texas Comptroller Crude Oil Production Tax — Rates; Due Dates; P_TX_GASOLINE_RATE: Texas Comptroller Gasoline Tax — Rates; Due Date. All sources pulled November 12, 2026. ↩
- Texas districts 7C, 08, 8A; source extract October 20, 2026. Reported oil and condensate are combined, then divided by calendar days. P_RRC_PERMIAN: RRC Permian Basin production 2008 to current; extract October 20 2026 — Sheet1; Production Totals by Month; Area Formation PERMIAN BASIN; P_RRC_LAG: RRC July 2026 production statistics — Tables 1 and 2; preliminary reporting footnote; P_RRC_DEFINITION: RRC Permian Basin information — Definition; snapshot disclaimer; historical production links. All sources pulled November 12, 2026. ↩
- Table 6, gasoline (all types), published effect and all-items monthly change; other months have individual source rows. P_CPI_03: March 2026 Consumer Price Index — Table 6, All items and Gasoline (all types); P_CPI_06: June 2026 Consumer Price Index — Table 6, All items and Gasoline (all types); P_CPI_10: October 2026 Consumer Price Index — Table 6, All items and Gasoline (all types). All sources pulled November 12, 2026. ↩
- Published-table implied acquisition cost versus current composite acquisition-cost series; cause unresolved. EIA_COMPONENTS: EIA Gasoline Pump Components History — Monthly table, Jan2019–Aug2026; each month is a source key; EIA_RAC: EIA composite crude acquisition cost by refiners — Data 1; R0000____3; dollars/barrel. All sources pulled November 12, 2026. ↩
Supporting material
- Excel model (XLSX file) Sourced inputs, live calculations and reported outputs.
- Source and model data (CSV collection) (ZIP file) Data tables, source references and calculation exports.
- Monthly source inputs (CSV file) Download as CSV.
- Weekly components calculated (CSV file) Download as CSV.
- Source index (CSV file) Download as CSV.