Financial systems
What First Brands owed before bankruptcy
The court docket lists $11.55 billion of prepetition obligations, from term debt to supplier finance and factoring.

First Brands’ credit problem cannot be reconstructed from its term loans alone. The debtors’ revised financing table lists $11.5543 billion of prepetition obligations, spanning term facilities, asset-based lending, supplier finance, receivables factoring and inventory or lease vehicles. That is a dated disclosure total with mixed accounting and legal characteristics. It is not a verified November 2026 debt balance or a final register of allowed claims.capital
Two other numbers explain why the listed amount needs context. The $4.4 billion original debtor-in-possession facility contained only $1.1 billion of new money; the remaining $3.3 billion rolled existing debt into the DIP. Meanwhile, a peer comparison shows how financing presentation changes the apparent cushion: Dorman’s FY2024 operating-income-to-interest ratio falls from 7.37× to 3.78× in the model when disclosed receivable-sale fees are moved from operating expense to financing expense.dip, dorman
The defensible lender conclusion is narrower than “the ratios proved fraud.” A lender needed a complete financing inventory, an invoice-level collateral reconciliation and a cash-flow bridge across acquired entities. Public peer accounts showed why working capital and factoring warranted scrutiny. They left open whether First Brands had pledged particular receivables twice, or what any individual lender knew.
The procedural endpoint also changed: the court denied confirmation on August 24, 2026, and converted the remaining cases to Chapter 7 on September 1. Proposed Chapter 11 distributions must therefore not be presented as an effective recovery waterfall.conversion
Scope and decisive assumptions
This report distinguishes four kinds of evidence: company-reported amounts, creditor assertions, investigative conclusions and judicial decisions. An allegation does not become a finding because it appears in a filing. An entered financing order can document authorization or a specifically stipulated balance without resolving every dispute over collateral ownership.
The model applies six rules.
Dates, entities and obligations
- Keep the dates attached. First-day balances, January schedules, May/June disclosures and later investment marks describe different snapshots. They are not interchangeable.
- Analyze each legal entity. Joint administration does not create one collateral pool. A financing vehicle outside a reporting subgroup can still matter economically to the operating business.
- Track contingent obligations and funded debt. Undrawn letters of credit, lease-characterization disputes and accrued charges prevent the financing-table sum from being called cash borrowed.
Comparison window, missing data and scenarios
- Use a fixed prepetition comparison window. Peer operating tests use the latest full-year accounts available before the September 2025 filing. Later filings verify historical inputs or show subsequent outcomes.
- Preserve unknowns. Verified First Brands historical DSO, DIO, DPO, consolidated interest expense, conventional lease commitments and a current aggregate allowed-claims total remain unavailable in the evidence assembled here.
- Treat scenarios as assumptions. The low, base and high cases estimate how much replacement liquidity the business would need.
The review obtained the first-day declaration, the financing motion and final order, filed asset and liability schedules, disclosure statements, the civil complaint and criminal indictment, and subsequent court orders. It also read the schedules’ SOFA Global Notes and the debtors’ summary of the examiner’s work. The filed SOFA forms and the redacted examiner report were not obtained from the free routes checked. The October 26 forensic-accountant application confirms that a public redacted report exists at Dkt. 2538; its text should not be confused with the summaries reviewed here.scope
That gap limits what this report can conclude about historical cash transfers, entity-level revenue and the completeness of the investigative record. It does not prevent reconstruction of the listed facilities, primary-source peer tests or disclosed holder marks.
Finding 1 — The listed financing footprint was about $11.55 billion
The table below reconstructs the revised prepetition snapshot repeated in the June 17, 2026 disclosure. Amounts are USD millions. “Agent” identifies who administers the facility. The economic holder may differ. Legal obligors, original dates, qualifications and source locations appear in the workbook.capital, firstday
| Facility or arrangement | Revised amount, USDm | Prepetition counterparty or agent / principal vehicle |
|---|---|---|
| ABL loans and letters of credit | 226.9 | Bank of America, agent; FBG/Trico borrowers |
| ABL supplier finance/cash management | 197.3 | ABL secured finance providers |
| First-lien letter-of-credit facility | 100.0 | First-lien facilities; Jefferies Finance agent |
| First-lien USD term loans | 3,886.9 | Jefferies Finance, agent |
| First-lien EUR loans, already translated to USD | 763.0 | Jefferies Finance, agent |
| Sidecar term loan | 250.0 | Sagard / GLAS USA, agents |
| Second-lien term loan | 540.0 | Jefferies Finance, agent |
| Aequum/UMB inventory facilities | 77.8 | Aequum Capital Financial II / UMB; Broad Street/Global Assets |
| CarVal inventory facilities | 159.0 | CarVal / GLAS Trust; Carnaby Inventory II/III |
| Evolution inventory facilities | 230.0 | Evolution Credit Opportunity Master Fund II-B; Patterson/Starlight |
| Onset arrangements | 1,880.0 | Onset Financial; Carnaby Inventory IV / Carnaby FA |
| Unsecured supplier finance | 962.4 | Counterparties below |
| Third-party factoring | 2,281.0 | Counterparties below |
| Model sum | 11,554.3 | Reported financing footprint |
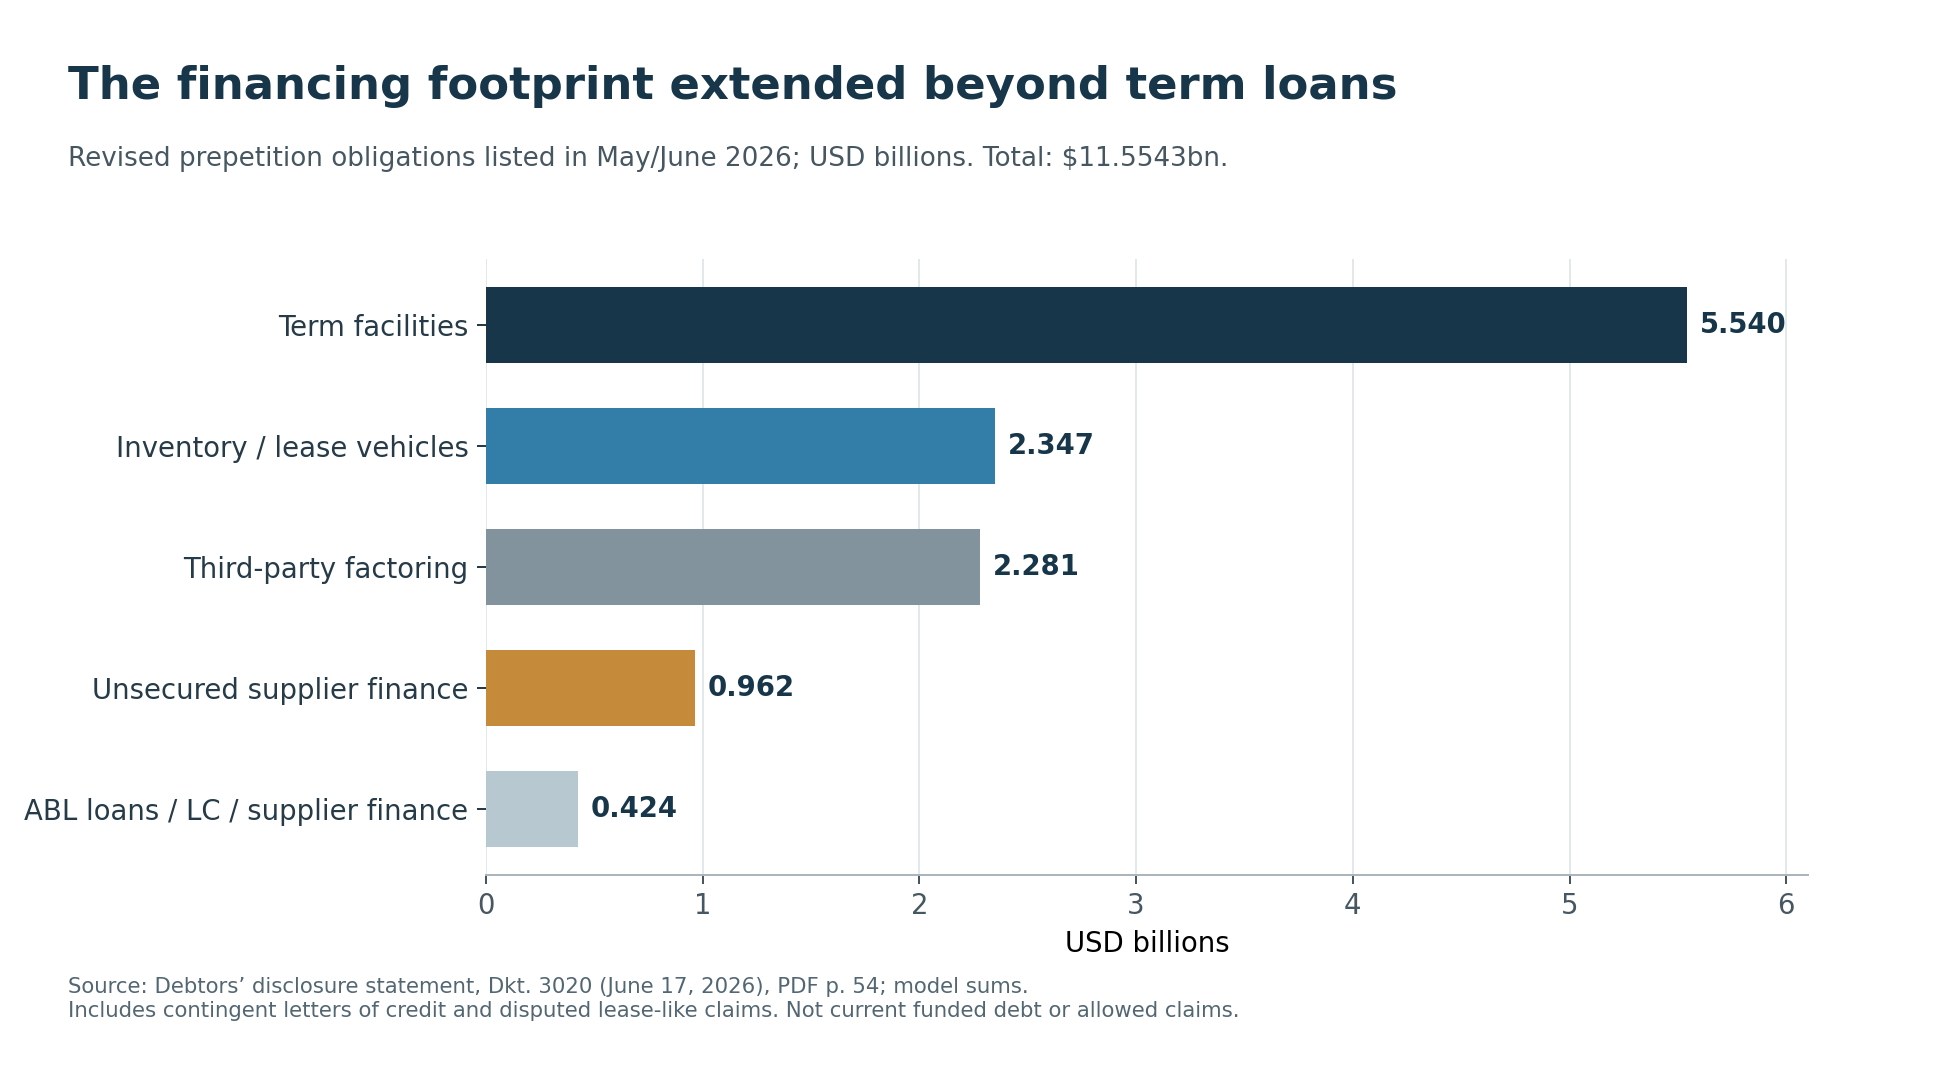
Chart 1. Model aggregation of the disclosed facilities. Source: Dkt. 3020, June 17, 2026, PDF p. 54. The total includes obligations with different legal and accounting characteristics.
The first-day table totaled $9,295.4 million but disclosed approximately an additional $2,300 million of factoring. Including that amount produces $11,595.4 million. The revised total is about $41 million lower. The revised ABL supplier-finance balance is $172.1 million lower and unsecured supplier finance is $150 million higher. Against the rounded $2.3 billion first-day factoring estimate, the revised factoring row is $19 million lower. These differences reconcile the disclosed figures. The filings leave the associated cash movements unresolved.firstday, capital
The agent names describe the prepetition facilities. WSFS replaced Jefferies as first- and second-lien administrative and collateral agent on November 3, 2025.orderbalances
Several adjustments matter. The EUR row is already translated into dollars. Onset’s $1.88 billion includes interest and fees; the debtors disputed whether the arrangements were true leases. The June disclosure records Onset’s contrary position that the arrangements were true leases or alternatively supported a perfected first-priority lien.onsetresponse The sidecar amount excludes approximately $26 million of make-whole charges. Some first-day loan balances were measured at June 30, 2025, before the petition.firstday
An independent order-based check confirms why “debt” needs qualification. Dkt. 608 stipulates $133,479,006.83 of ABL borrowings plus $93,409,474.32 of letter-of-credit availability and unpaid reimbursement obligations, totaling $226,888,481.15, which rounds to the table’s $226.9 million. It also identifies $4,625,413,695.97 of first-lien term principal; adding the $24.5 million bridge yields $4,649,913,695.97, consistent with the rounded USD and EUR term-loan rows.orderbalances
The schedules identify counterparties—and do not fully reconcile
The main LLC’s January 20 schedules place full asserted factoring loan values on that entity, avoiding duplication across subsidiaries. Four disputed, unliquidated factoring entries total $2,358.594 million, exceeding the revised aggregate by $77.594 million.schedules
| Factoring counterparty | Scheduled USDm | Dkt. 1411 PDF page / entry |
|---|---|---|
| Evolution Credit Partners Management | 13.048 | 155 / 3.111 |
| Jefferies Financial Group | 714.625 | 167 / 3.171 |
| Katsumi Servicing | 1,458.795 | 168 / 3.173 |
| Raistone Capital | 172.127 | 191 / 3.290 |
The following supplier-finance entries also belong to the schedules’ snapshot of claims. Figures are USD millions, rounded here; exact dollars and entry-level pages are in the workbook.schedules
| Unsecured supplier-finance counterparty | Scheduled USDm | Counterparty | Scheduled USDm |
|---|---|---|---|
| 1977 O’Connor | 116.073 | Customer name withheld | 84.370 |
| Fasanara | 24.298 | HFS | 233.707 |
| Interface Financial | 4.761 | Ivy American / Evergreen | 26.643 |
| Napier Park | 47.094 | Nomura | 8.931 |
| Orbian | 20.034 | Pemberton | 36.269 |
| Raistone | 4.924 | Southstate | 49.703 |
| Trade Finance Company | 208.261 | U.S. Bank | 149.997 |
| Wafra | 38.030 | Sum | 1,053.097 |
That sum exceeds the revised unsecured aggregate by $90.697 million. Secured supplier-finance entries for Bank of America, $119.454 million, and Truist, $99.993 million, total $219.447 million, versus $197.3 million in the revised table. Most unsecured entries are marked disputed; U.S. Bank’s entry lacks that checked designation, subject to global reservations.schedules
These differences are unresolved. The model does not allocate them proportionally, plug them into another category or add both snapshots. A schedule captures asserted legal obligations; a later financing table may use a different scope. Without an account-by-account bridge, apparent precision would conceal the missing reconciliation.
Leases and assets remain incomplete
Conventional leases are not captured by treating Onset as the whole lease book. The schedules exclude future operating-lease obligations and operating right-of-use balances. Their main-LLC summary is also entity-specific and contains undetermined values. It cannot support a consolidated liquidation-value calculation.schedulelimits
The result inventories the disclosed facilities and identifies the entities it covers. A credit analyst should demand a lease register, guarantees, intercompany balances and title records before converting this inventory into enterprise leverage or collateral coverage.
Finding 2 — The DIP headline overstated the cash available to sustain operations
The September 30, 2025 financing motion requested a facility containing $1.1 billion of new money and $3.3 billion of cashless roll-up. The November 9 final order authorized that structure. New money therefore represented 25% of the original $4.4 billion headline. The financing motion also provided for repayment of the $24.5 million bridge from DIP proceeds.motion, dip
For the model, $1.1 billion less that bridge produces a deliberately generous $1,075.5 million cash ceiling before fees and operating uses. It is not a claim that this amount was simultaneously unrestricted and available. Draw timing, escrow conditions and subsequent expenditure matter.
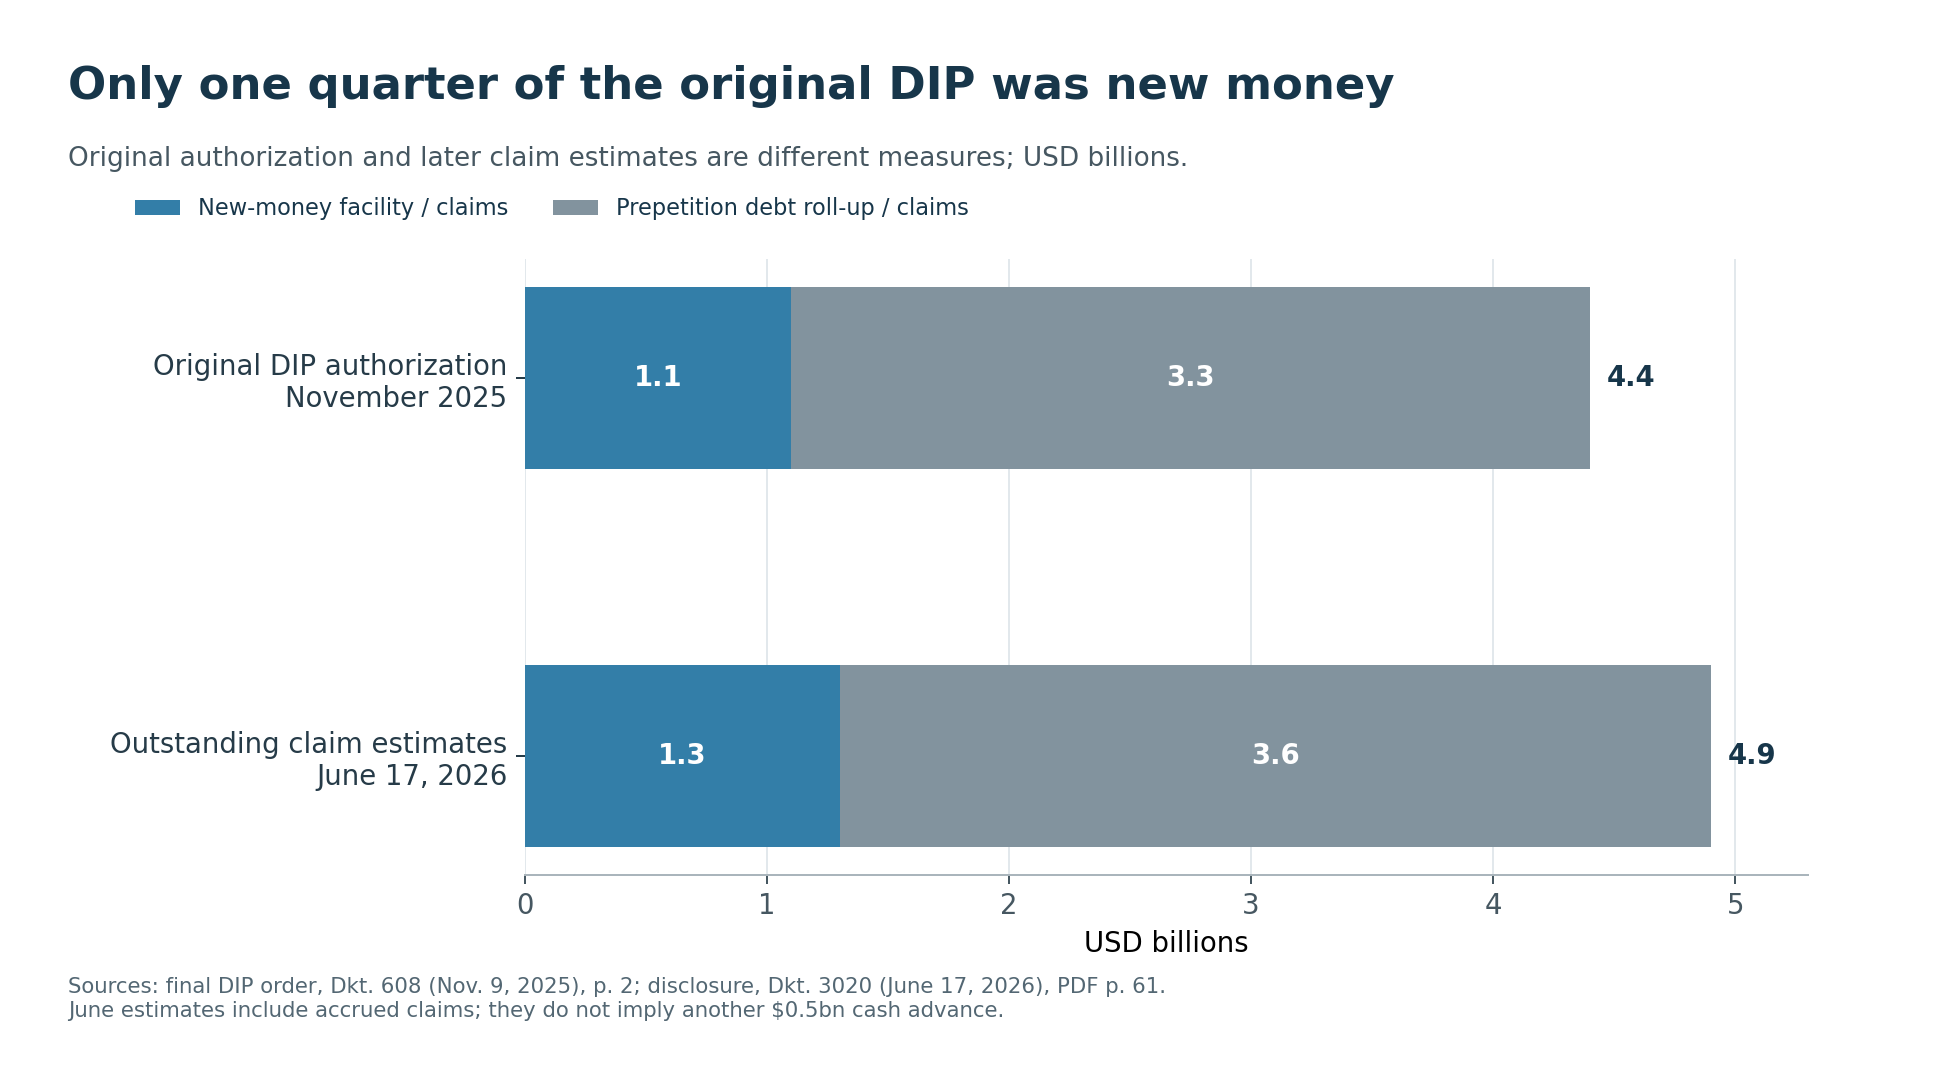
Chart 2. Original authorization versus later estimated claims. Sources: Dkt. 608, p. 2; Dkt. 3020, PDF p. 61. The two bars measure different things.
By June 17, 2026, the disclosure said the original $1.1 billion new-money commitment had been fully drawn. It estimated approximately $1.3 billion of new-money DIP claims and $3.6 billion of roll-up claims. Together those claims amount to $4.9 billion outstanding.laterdip
The later history further weakens any inference that a large DIP automatically solved liquidity. The July 29 forbearance order states that the DIP matured unpaid on June 29 and provides for default interest from that date. The order is evidence of default and forbearance; it is not a new principal commitment. A verified consolidated DIP balance as of November 12 is unknown.forbearance
The June disclosure also describes weekly operating funding from 22 participating OEMs as prepayments. Without the aggregate balance and remaining performance obligations, those receipts should not be silently classified as either permanent equity-like support or another conventional term loan.laterdip
For a lender, the relevant forecast is cash available each week after mandatory repayments, fees and operating disbursements. A large headline financing amount can coexist with a narrow cash runway when most of the facility changes the status of existing claims.
Finding 3 — Ordinary factoring explains presentation; duplicate financing requires transaction evidence
Factoring is not inherently evidence of misconduct. It can transfer a receivable to a financier, accelerate collection and reduce reported receivables. Supplier finance works from the buyer’s payable instead. The credit question is what cash, risk and legal rights move—not the label alone.
A $100 example
Assume a seller has a valid $100 customer invoice. A factor pays $97, keeping $3. If the transaction qualifies for sale accounting and there is no retained interest, the simplified entry is:
| Seller’s entry | Debit | Credit |
|---|---|---|
| Cash | $97 | — |
| Factoring expense | $3 | — |
| Accounts receivable | — | $100 |
The receivable leaves the balance sheet. Cash arrives earlier; the fee reduces profit. This example assumes the derecognition conditions are satisfied. Dorman and SMP disclose receivable-sale programs and fees within operating expenses; MPAA presents factoring costs within interest.dorman, smp, mpaa
If the arrangement is instead a secured borrowing, the simplified entry is debit cash $97 and credit borrowing $97, while the $100 receivable remains. Subsequent interest, fees and settlement depend on the contract. Similar cash receipts can therefore produce different reported debt and receivable balances.
Now consider reverse factoring. A buyer receives $100 of inventory and records $100 of trade payables. Its bank pays the supplier $97 early. If the buyer’s obligation still has the features of an ordinary trade payable, the buyer still owes $100; it does not record the supplier’s $3 discount as its own expense. Settlement reduces the payable and cash. Materially financing-like terms may require a different classification.
FASB’s ASU 2022-04 requires disclosure of supplier-finance terms, confirmed obligations, where those obligations appear and an annual roll-forward. It does not automatically move every arrangement into borrowing or prescribe one new cash-flow presentation for all programs.fasb
This matters because higher operating cash flow can reflect earlier collection or delayed supplier settlement, even if underlying operating margins stay flat. Analysts should trace gross program balances and fees alongside conventional debt, while preserving the issuer’s accounting and the analyst’s reclassification alongside it.
What changes if the same invoice finances two claims?
Extend the example: after the factor advances $97 against the $100 invoice, an ABL lender advances another $80, using an 80% advance rate against that same invoice. The financiers have advanced $177. The factor’s $100 face claim plus the ABL loan creates $180 of nominal claims against $100 of customer collections.
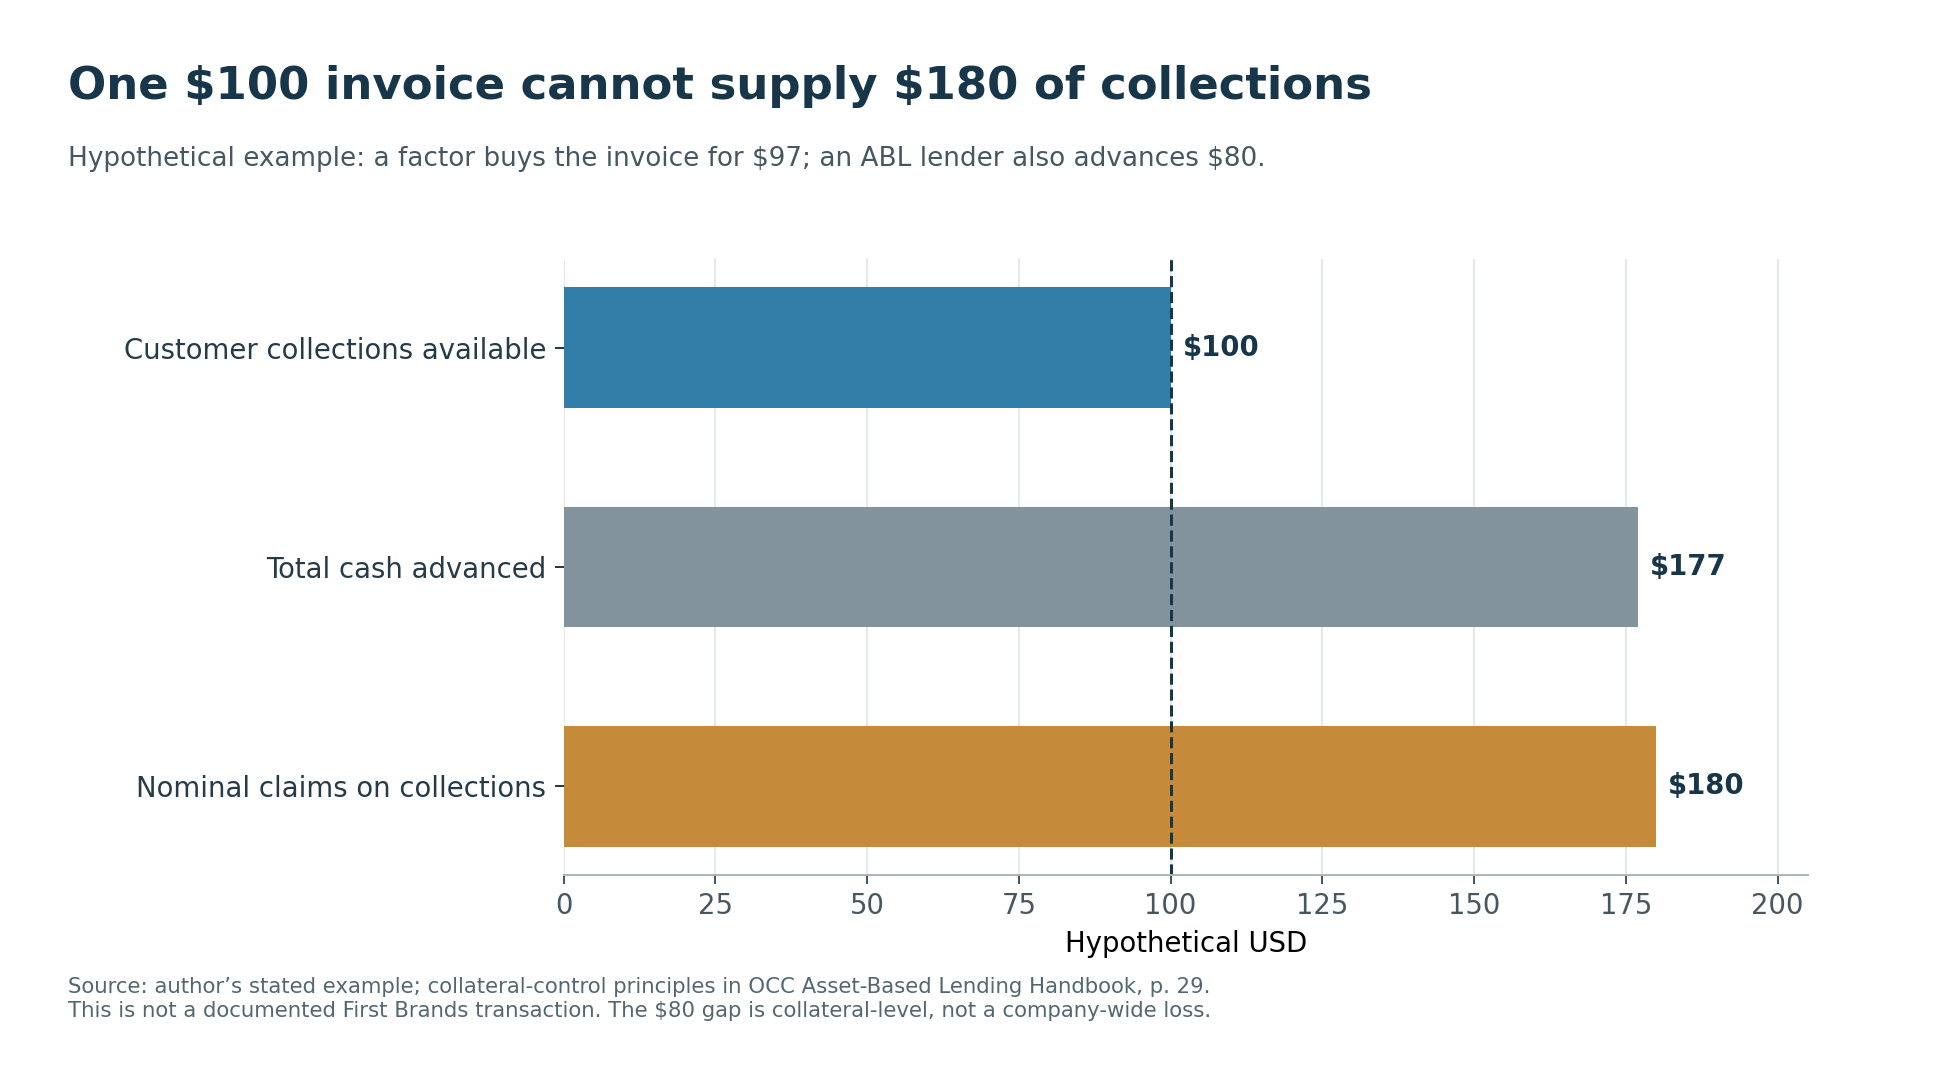
Chart 3. Author’s hypothetical arithmetic, guided by OCC collateral-control principles. This is an illustrative transaction.
The collateral-level shortfall is $80; cash advanced above the customer’s payment is $77. Neither figure automatically equals an enterprise loss. Unspent financing proceeds, other collateral, recourse, priority and recoveries can change the result. The example shows what happens when two claimants expect the same collection.
A lender looking for this problem would compare unique invoice identifiers across financing programs and legal entities; verify customers, purchase orders, shipment evidence and credit notes; confirm remittance instructions independently; and reconcile the borrowing base to the factor’s purchased-receivable ledger. Sold receivables should be excluded from an incompatible borrowing-base claim unless the legal structure expressly permits the relevant financing.
Other warning signs include the same invoice appearing in multiple certificates, payments directed to an unexpected account, collections failing to reduce the financed balance, unexplained aging resets and financing volumes inconsistent with customer-confirmed balances. These are reasons to investigate. A blanket lien search leaves open whether each invoice is valid and whether the lender has exclusive rights to it. OCC guidance specifically addresses multiple financing, collateral audits and cash control.occ
What the First Brands filings and rulings show
The debtors’ complaint in Adv. 25-03803, Dkt. 17, alleges inflated, fictitious and multiply factored invoices. Patrick James and the other moving defendants disputed that the complaint and preliminary-injunction evidence linked him to invoice manipulation or double pledging. Defense motion, pp. 9–10 The criminal indictment likewise alleges duplicate or multiple pledges and misleading records. DOJ also reported Peter Andrew Brumbergs’ January 26, 2026 guilty plea; that plea is not a merits judgment against other defendants.complaint, indictment
The examiner discussion requires similar care. The debtors’ June disclosure summarizes preliminary investigative conclusions and expressly notes that the court had issued no findings of fact or conclusions of law on them. It also says the Special Committee’s investigation remained incomplete because of liquidity constraints. The later forensic-accountant application describes open questions and unfinished work.investigation
The court did decide narrower issues. The Evolution appeal record describes a ruling denying perfected priority over DIP lenders for non-purchased receivables, with other priority questions unresolved. The district court’s July 27 disposition concerned appellate jurisdiction and leave to appeal. The September conversion order expressly preserves unresolved ownership claims to purchased-receivable cash. Neither document adjudicates every factoring transaction or proves all allegations in the complaint.evolution, conversion
Finding 4 — Prepetition peer accounts gave lenders a better set of questions
First Brands was private. This review did not obtain a verified historical consolidated balance-sheet and income-statement series sufficient to reproduce its working-capital days. Assigning it peer-like balances, treating litigation estimates as audited history or inferring receivables from annual factoring turnover would manufacture a result.
The test starts with what public peers disclosed before the filing. It then identifies the private information a term lender would have needed to compare First Brands properly. The second dataset remains unavailable in the reviewed records.
Working-capital days
The model uses average opening and closing balances and a standardized 365-day year:
DSO=365 × (average receivables) / (sales),; DIO=365 × (average inventory) / (cost of goods sold)
DPO=365 × (average trade payables) / (cost of goods sold),; CCC=DSO+DIO-DPO.
Cost of goods sold is a consistent proxy for purchases in DPO. Two-point averages cannot remove seasonality. The calculations use disclosed unreturned inventory where relevant but do not fold MPAA’s core-related contract assets into inventory.
| Latest prepetition annual period | DSO, days | DIO, days | DPO, days | Cash conversion cycle, days |
|---|---|---|---|---|
| Dorman, year ended December 31, 2024 | 100.0 | 204.1 | 62.0 | 242.1 |
| Standard Motor Products, year ended December 31, 2024 | 46.3 | 204.6 | 44.8 | 206.0 |
| Motorcar Parts of America, year ended March 31, 2025 | 45.1 | 228.9 | 89.8 | 184.3 |
| First Brands | Unknown | Unknown | Unknown | Unknown |
Sources: model recomputation from the three issuers’ annual filings, including opening balances.dorman, smp, mpaa
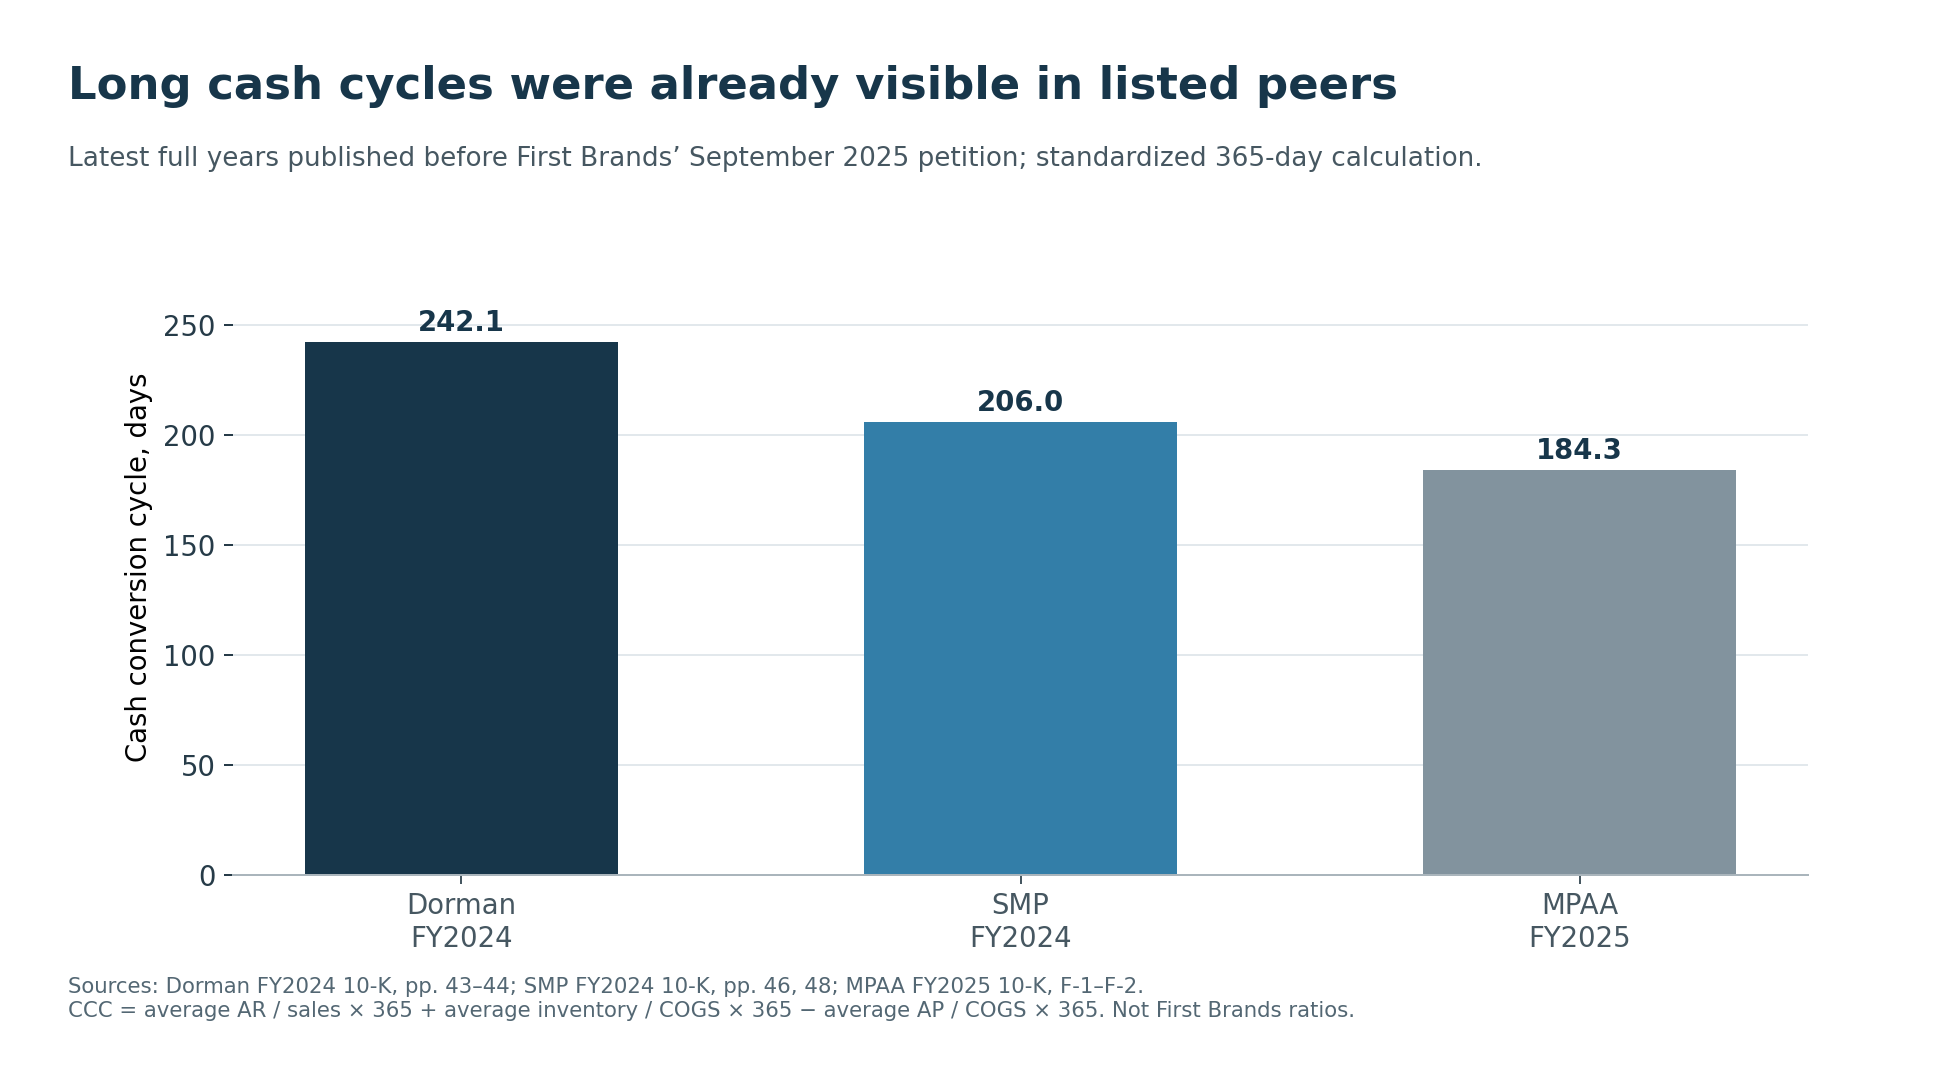
Chart 4. The chart uses the peer companies’ reported balance sheets.
The peers demonstrate that automotive replacement-parts businesses can carry substantial inventory and working-capital demands. A safe upper limit depends on the borrower. Product mix, customer terms, returns, remanufacturing cores and acquisitions affect comparability. SMP’s November 2024 Nissens acquisition additionally puts acquired year-end balances against only a partial year of acquired operating flows.smpacquisition
A properly supported First Brands comparison would require monthly entity-level receivables, inventory, payables, sales and cost of goods sold; balances sold or financed outside the consolidated statements; and consistent treatment of acquired businesses. Until then, a chart presenting First Brands beside these peers would create false comparability.
Dorman shows why reported DSO is not the whole funding cycle
Dorman disclosed receivables that would have remained outstanding without sales: $526.4 million at December 2023 and $853.6 million at December 2024. Their average is $690.0 million. Adding that to average reported receivables of $550.327 million and dividing by FY2024 sales of $2,009.197 million gives:
365 × (550.327+690.0) / (2,009.197)=225.3 days.
Reported-balance-sheet DSO is 100.0 days. The estimate adds back Dorman’s disclosed sold receivables.dormandsorestore
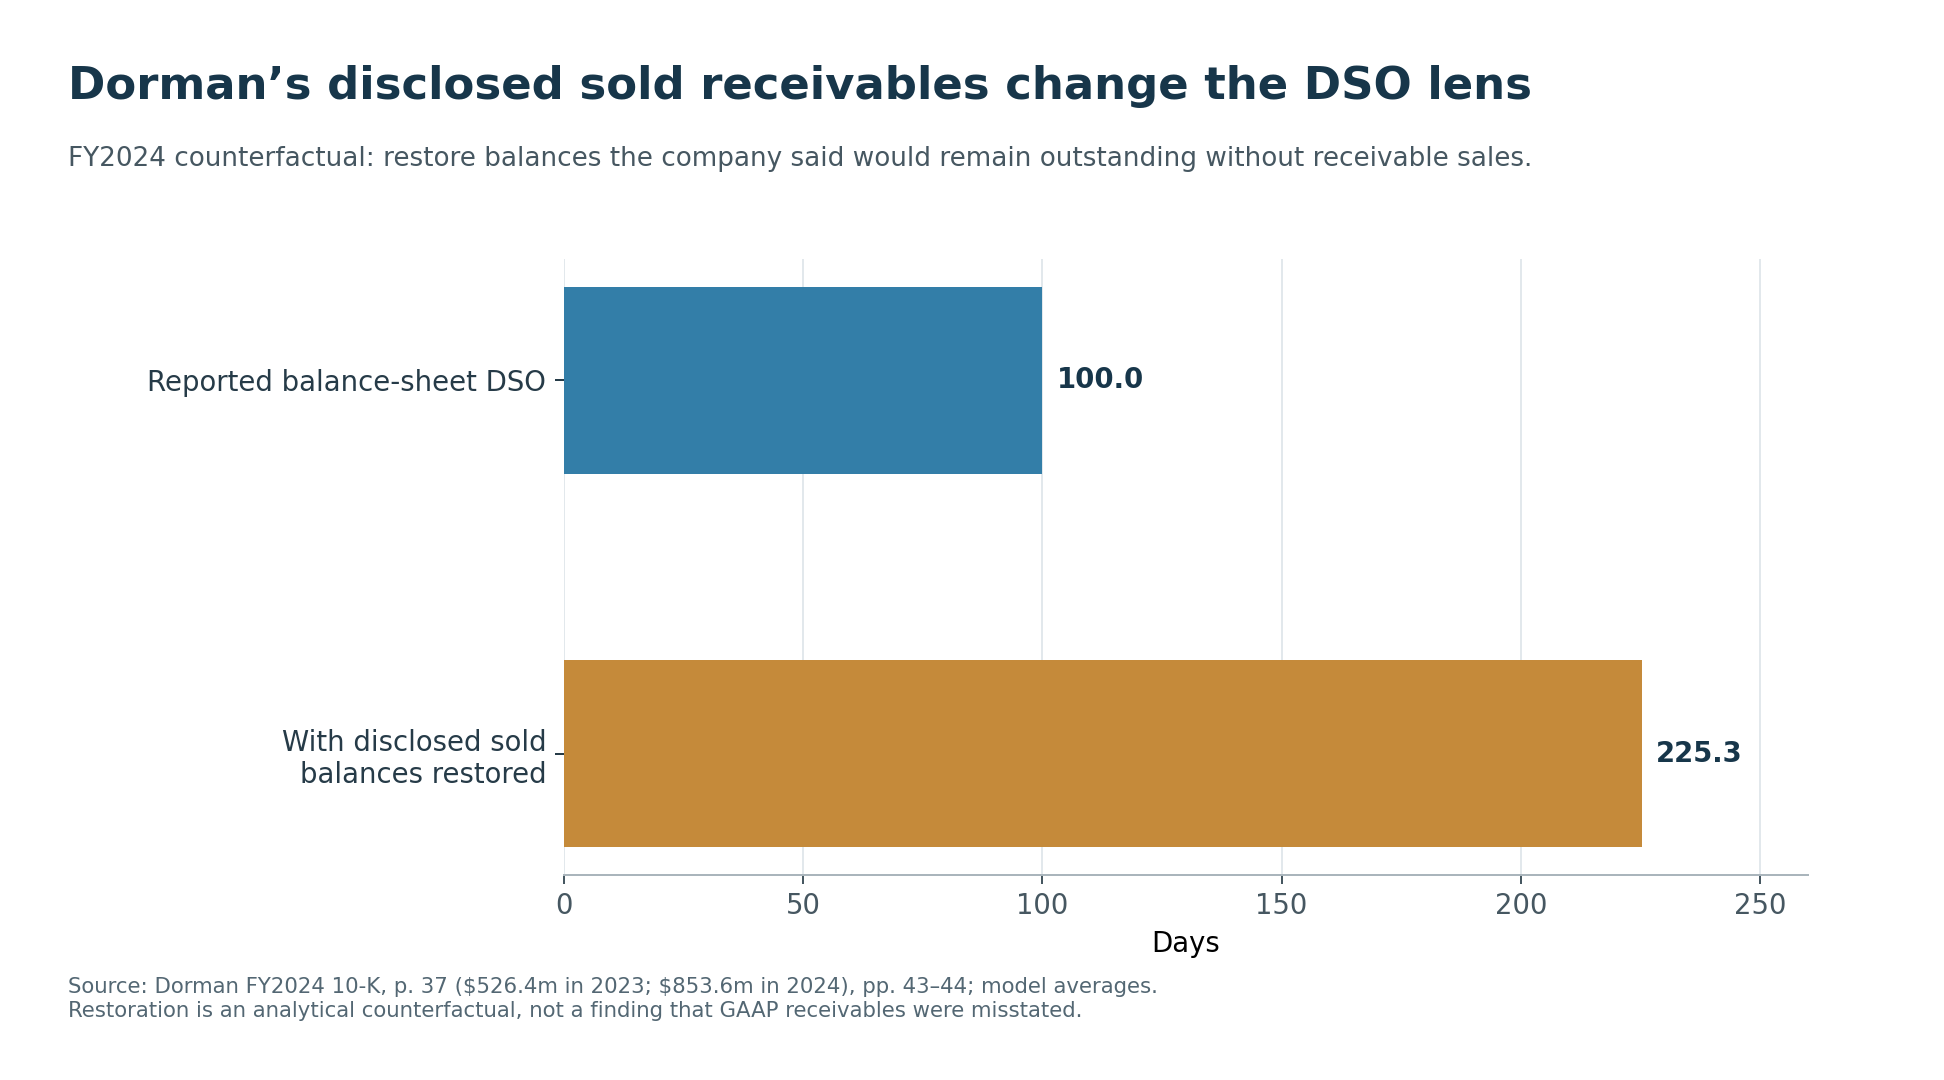
Chart 5. Source: Dorman FY2024 10-K, p. 37 and financial statements; model recomputation.
This is the question a lender could have asked First Brands: “What would receivables and the collection cycle look like before sales to factors?” Annual sales of receivables cannot answer it. An annual financing flow can turn over several times and must not simply be added to a year-end balance.
MPAA illustrates the same analytical hazard differently. Its FY2025 filing reports $643.918 million of annual receivable sales, approximately 85.0% of revenue, and a 343-day weighted-average discount period, while the model’s reported DSO is only 45.1 days. The measures describe different populations and timing. The filing also reconciles supplier-finance obligations from $1.695 million to $33.661 million, using $91.951 million of invoices confirmed and $59.985 million paid.mpaafinance
Financing-cost coverage
To compare presentation, the model starts with operating income divided by reported interest. For fees recorded in SG&A, it adds the fee back to operating income and also adds it to financing costs. Adding it only to the denominator would count the expense twice.
| Annual period | Operating income, USDm | Reported interest, USDm | Factoring fees in SG&A, USDm | Reported coverage | Reclassified coverage |
|---|---|---|---|---|---|
| Dorman FY2024 | 292.909 | 39.727 | 51.252 | 7.37× | 3.78× |
| SMP FY2024 | 80.624 | 13.512 | 48.500 | 5.97× | 2.08× |
| MPAA FY2025 | 39.923 | 55.550 | 0.000 | 0.72× | 0.72× |
Dorman and MPAA report net interest; SMP’s input is interest expense. MPAA’s $38.021 million factoring cost is already in interest. The ratios use operating income and reclassify financing fees.dorman, smp, mpaafinance
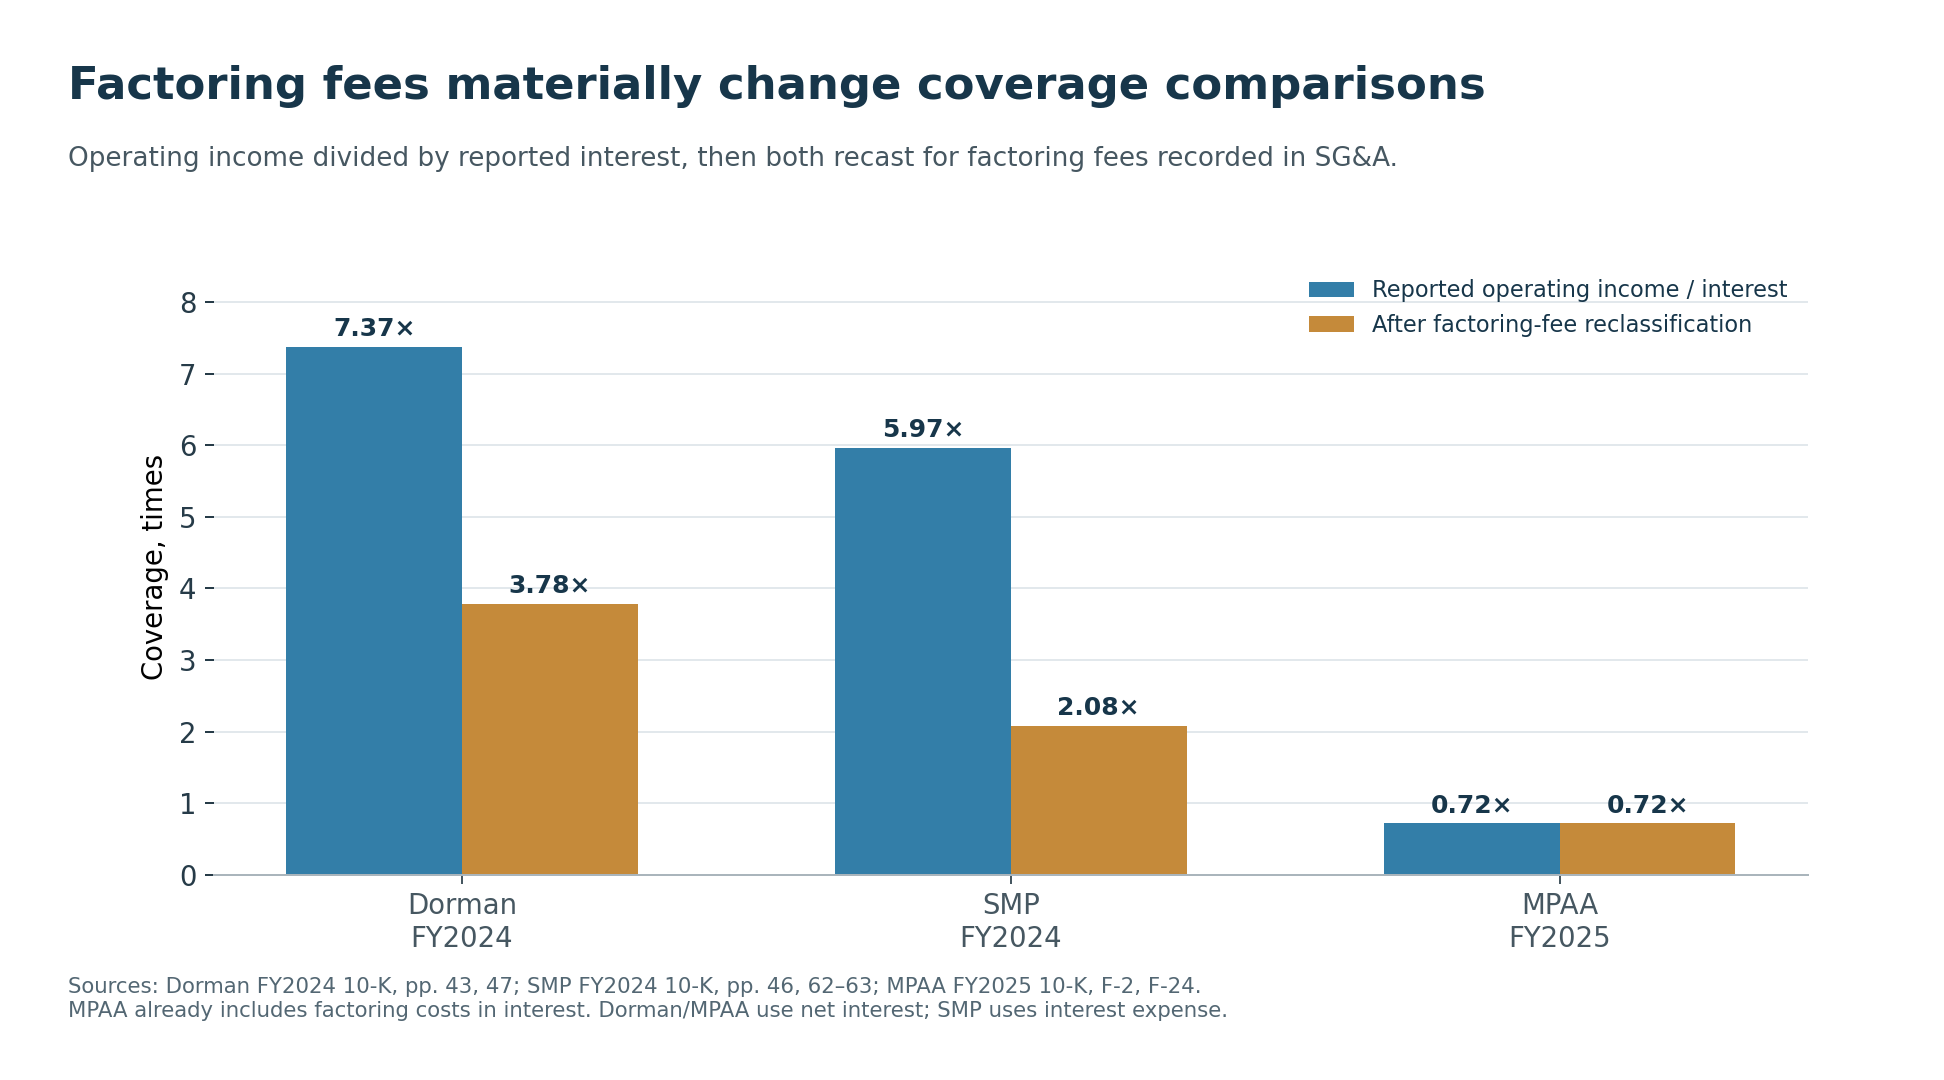
Chart 6. Reclassifying the expense leaves total profit and cash paid unchanged.
Dorman’s calculation is ($292.909m + $51.252m) / ($39.727m + $51.252m) = 3.782862×. The conclusion survives an independent input check: its earnings release confirms operating income and interest, and the following year’s 10-K repeats the historical factoring expense.dormanqa
For First Brands, the first-day declaration reports $1,133 million EBITDA, without specifying its period in the cited passage, and annual debt service above $900 million, excluding Onset. The arithmetic gives a rough upper bound below 1.26× before Onset. It is not interest coverage: debt service can include principal, and the periods are not demonstrably aligned. It should not be placed beside the peer ratios as if definitions matched.burden
The real underwriting request is a bridge from reported earnings to cash available after ordinary interest, factoring fees, supplier-finance charges, lease payments, maintenance investment and required amortization. Adjusted EBITDA can be informative, but its usefulness depends on that reconciliation.
Acquisition pace and what lenders could know
Contemporaneous primary records document a continuing acquisition program. The chronology preserves differences between a documented closing and an announcement that a transaction had completed.acquisitions, earlyacquisitions
| Date supported by the source | Acquired business | Evidence and date precision |
|---|---|---|
| January 2019 | UCI Performance Pumps | Buyer’s counsel transaction record; month only |
| February 2019 | FRAM Group Holdings | RiverPark’s contemporary lender account |
| By June 3, 2019 | Federal-Mogul wiper business | Buyer’s counsel announcement; exact closing day unavailable |
| July 31, 2020 | Brake Parts and Champion Laboratories | Buyer announcement; two acquisitions effective immediately |
| December 2, 2020 | Centric Parts | Buyer completion announcement |
| February 8, 2023 | Horizon Global | SEC 8-K, completion of acquisition |
| July 2024 | Lumileds lamps and accessories | Seller’s August 2 announcement says completed the previous month |
The chronology lists selected transactions. It documents repeated integration demands across several years without assigning unverified purchase prices.
There is also evidence of what at least one lender thought at the time. RiverPark’s second-quarter 2020 letter described a conversation with Trico’s CFO, reported favorable synergy and deleveraging performance, and said its funds supplied additional financing. This contemporary account helps avoid treating every earlier acquisition as an obvious failure. The manager described its assessment and conversations with management.riverpark
Acquisition frequency should prompt questions about integration cash, acquired payables, receivable eligibility, inventory obsolescence and changes to the guarantor group. A portfolio of brands does not by itself answer which legal entity owns customer receivables or where associated financing sits. A lender would need a transaction-by-transaction funding bridge and consolidated cash movements.
The financing motion says a contemplated $6.2 billion refinancing in July 2025 was paused in August pending quality-of-earnings work. That is a debtor’s retrospective account of the process. Polen Capital later described a July lender presentation using approximately $5.6 billion of revenue, $1.9 billion of adjusted EBITDA and 1.9× net first-lien leverage. The underlying lender packet was not obtained; the manager’s March 2026 account cannot show what every lender received or verified.refinancing, polen
These records support a testable underwriting question: did the leverage presentation include the complete economic financing perimeter and reconcile adjusted EBITDA to cash? They do not justify inventing a precise prepetition consolidated leverage ratio from incompatible snapshots or inferring an individual lender’s state of mind.
Finding 5 — Public holders marked original loans down, but holdings must be followed by instrument
The supplied dataset contains 56 instrument-and-date observations across eight vehicles, drawn from 22 primary SEC filings. The sample covers lenders that disclosed these holdings in SEC filings. Three vehicles are listed BDCs: Palmer Square Capital BDC, Prospect Capital and Great Elm Capital. The fund sample includes OBND, SRLN, Invesco Senior Loan Fund, Eaton Vance Floating-Rate Income Trust and Eaton Vance’s Floating Rate Portfolio master fund.
The comparison below uses fair value divided by principal, multiplied by 100. It does not use cost as the denominator. Different valuation dates, trades, principal changes and instrument transformations limit return comparisons.
| Holder / original first-lien category | Before, per $100 | After, per $100 | Valuation dates and scope |
|---|---|---|---|
| Palmer Square BDC, PSBD | 94.75 | 45.50 | June 30 → September 30, 2025; same principal |
| Prospect, PSEC, older 2021-acquired lot | 94.75 | 36.35 | June 30 → September 30, 2025; principal increased |
| Great Elm, GECC | 94.27 | 35.19 | June 30 → September 30, 2025; weighted June lots; principal decreased |
| Loomis Sayles Opportunistic Bond ETF, OBND | 94.67 | 0.54 | June 30 → December 31, 2025; same two original loans |
| Eaton Vance Floating Rate Portfolio, master | 98.15 | 33.30 | July 31 → October 31, 2025; principal increased |
Sources: the respective schedules of investments and model recomputation. DIP instruments are excluded from these pairs.psbd, psec, gecc, obnd, evmaster
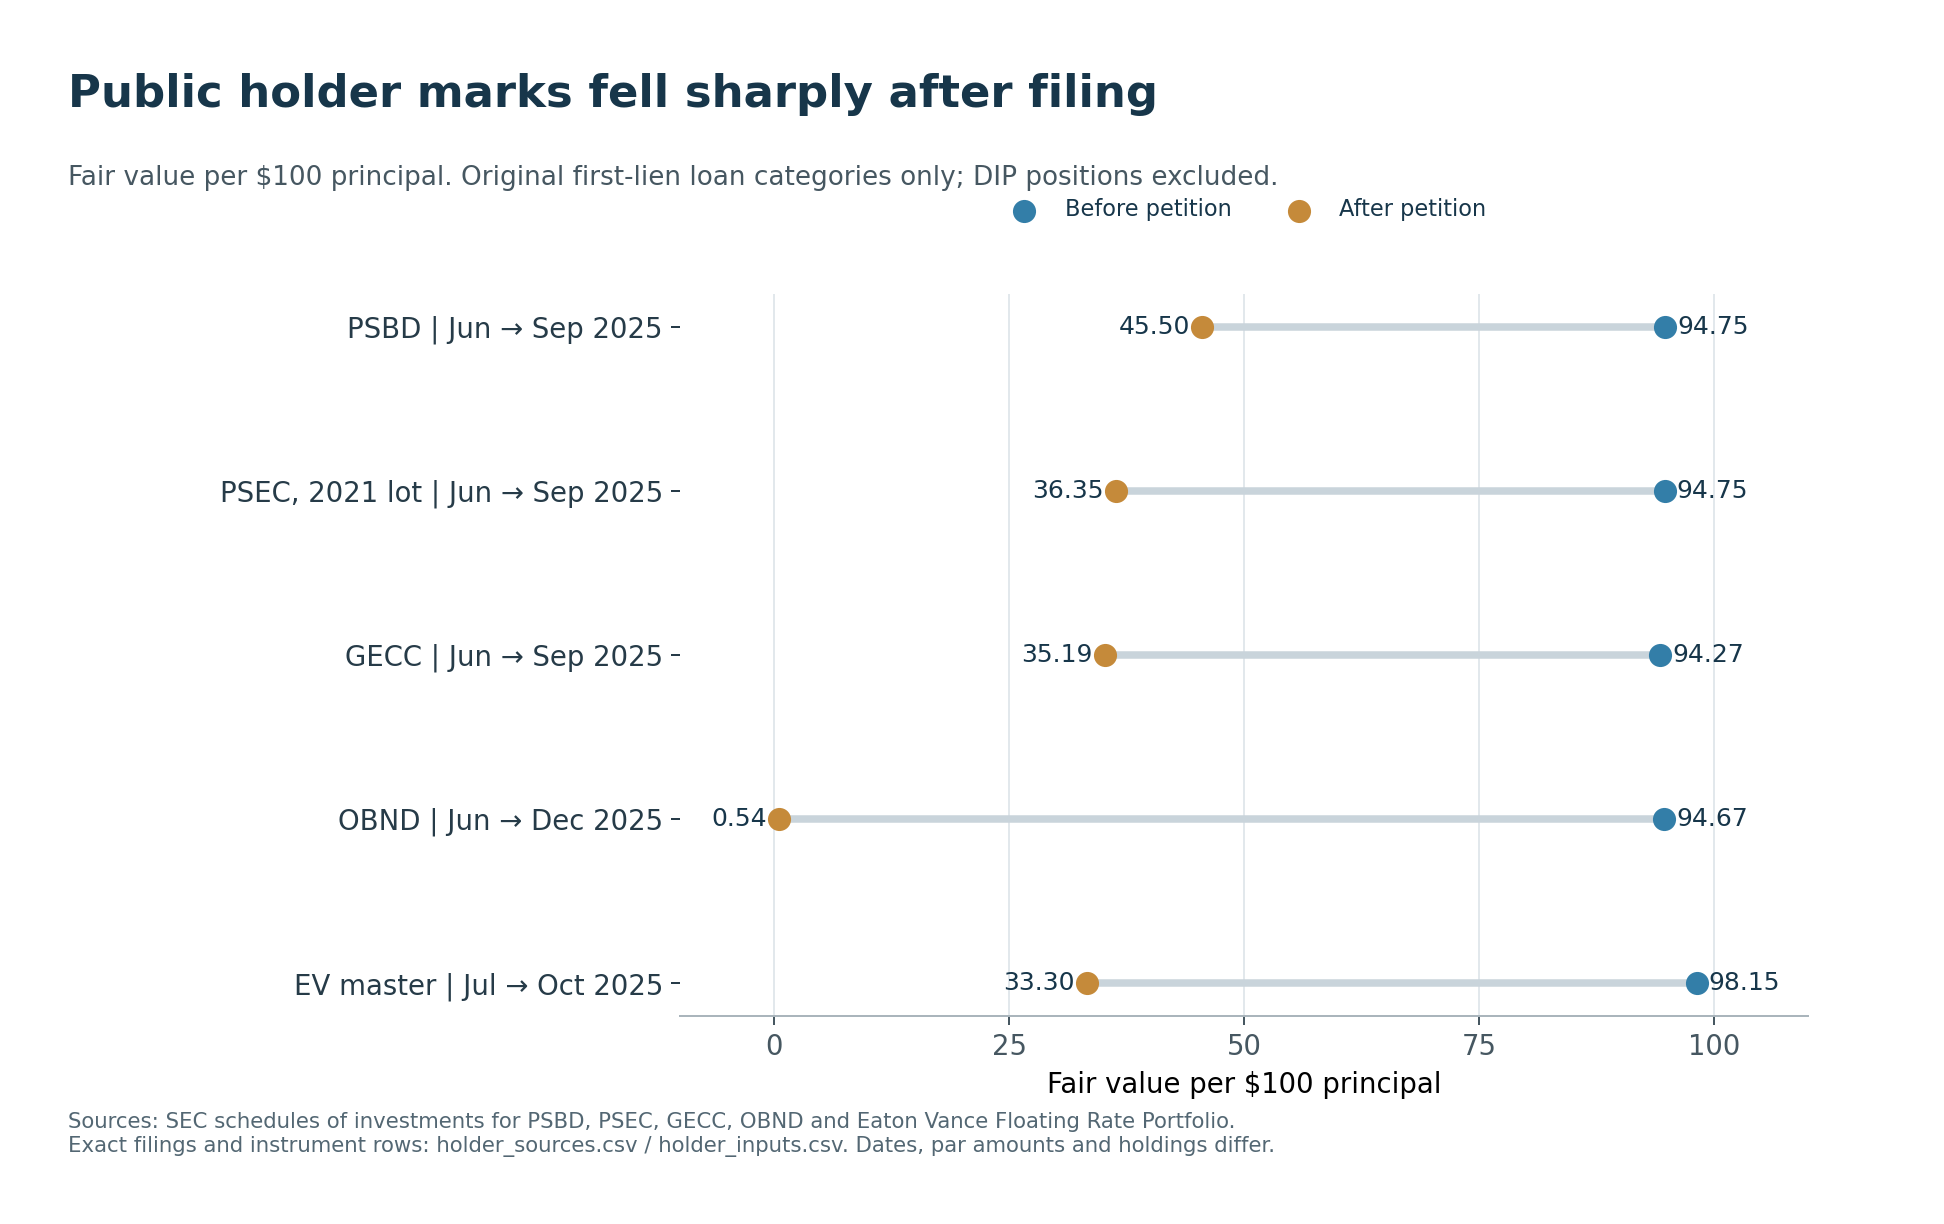
Chart 7. The dates differ across rows. The chart shows reported marks at the dates indicated.
PSBD’s first-lien position provides a relatively clean immediate comparison: principal remained $8,583,892, while fair value fell from $8,133,538 to $3,905,671. OBND’s two original loans likewise showed combined principal of $291,224, while fair value changed from $275,699 to $1,570. The longer OBND interval spans more of the restructuring.psbd, obnd
PSEC reports its First Brands holdings by acquisition lot. Its September schedule lists an older first-lien lot, a lot acquired on September 19 and a second-lien position. The older lot’s principal increased, so its price change is not a fixed-position loss calculation. Combining the two first-lien rows and calling one a subtotal would misstate the holding.psec
Subsequent reported values were much lower for several residual instruments. At September 30, 2026, PSBD’s residual first-lien position had $2,547,410 principal and $255 fair value. PSEC reported zero fair value for residual first- and second-lien positions, while its DIP A position still showed $1.124 million fair value on $6.812 million principal. GECC’s residual first- and second-lien fair values were $1,000 and $4,000, respectively.latestholders
PSEC also reported a $66.463 million realized loss in the September 2026 quarter. Its associated $66.355 million reversal of previous unrealized depreciation moves the amount from unrealized to realized accounting. This is why a simple before/after fair-value subtraction cannot substitute for a full investment roll-forward.psecloss
The dataset preserves other limits. A later filing’s omission of SRLN or Invesco exposure leaves the exit price unknown. Zero principal and zero fair value produce no meaningful price ratio. The Eaton Vance master is counted once, excluding duplicate exposure through feeder holdings. These choices prevent missing observations and fund structures from becoming invented losses or duplicated exposure.
Finding 6 — A replacement-liquidity stress can be transparent without pretending to forecast recoveries
The model tests the revised $2,281 million factoring balance plus $962.4 million unsecured supplier finance, totaling $3,243.4 million. It asks what replacement funding would be required if some of that support ceased and had to be replaced. The low/base/high withdrawal assumptions are 25%, 50% and 100%. Each stress case uses an assumed withdrawal share.capital
For each case:
Gross replacement need=3,243.4 × withdrawal share
Shortfall=replacement need-1,075.5.
All amounts below are USD millions. The ceiling deducts only the bridge from original new-money authorization; it ignores fees, operating expenditure and restrictions, making it favorable to the borrower.
| Case | Assumed withdrawal | Gross replacement need | Cash ceiling | Shortfall (+) / surplus (−) |
|---|---|---|---|---|
| Low | 25% | 810.85 | 1,075.50 | −264.65 |
| Base | 50% | 1,621.70 | 1,075.50 | 546.20 |
| High | 100% | 3,243.40 | 1,075.50 | 2,167.90 |
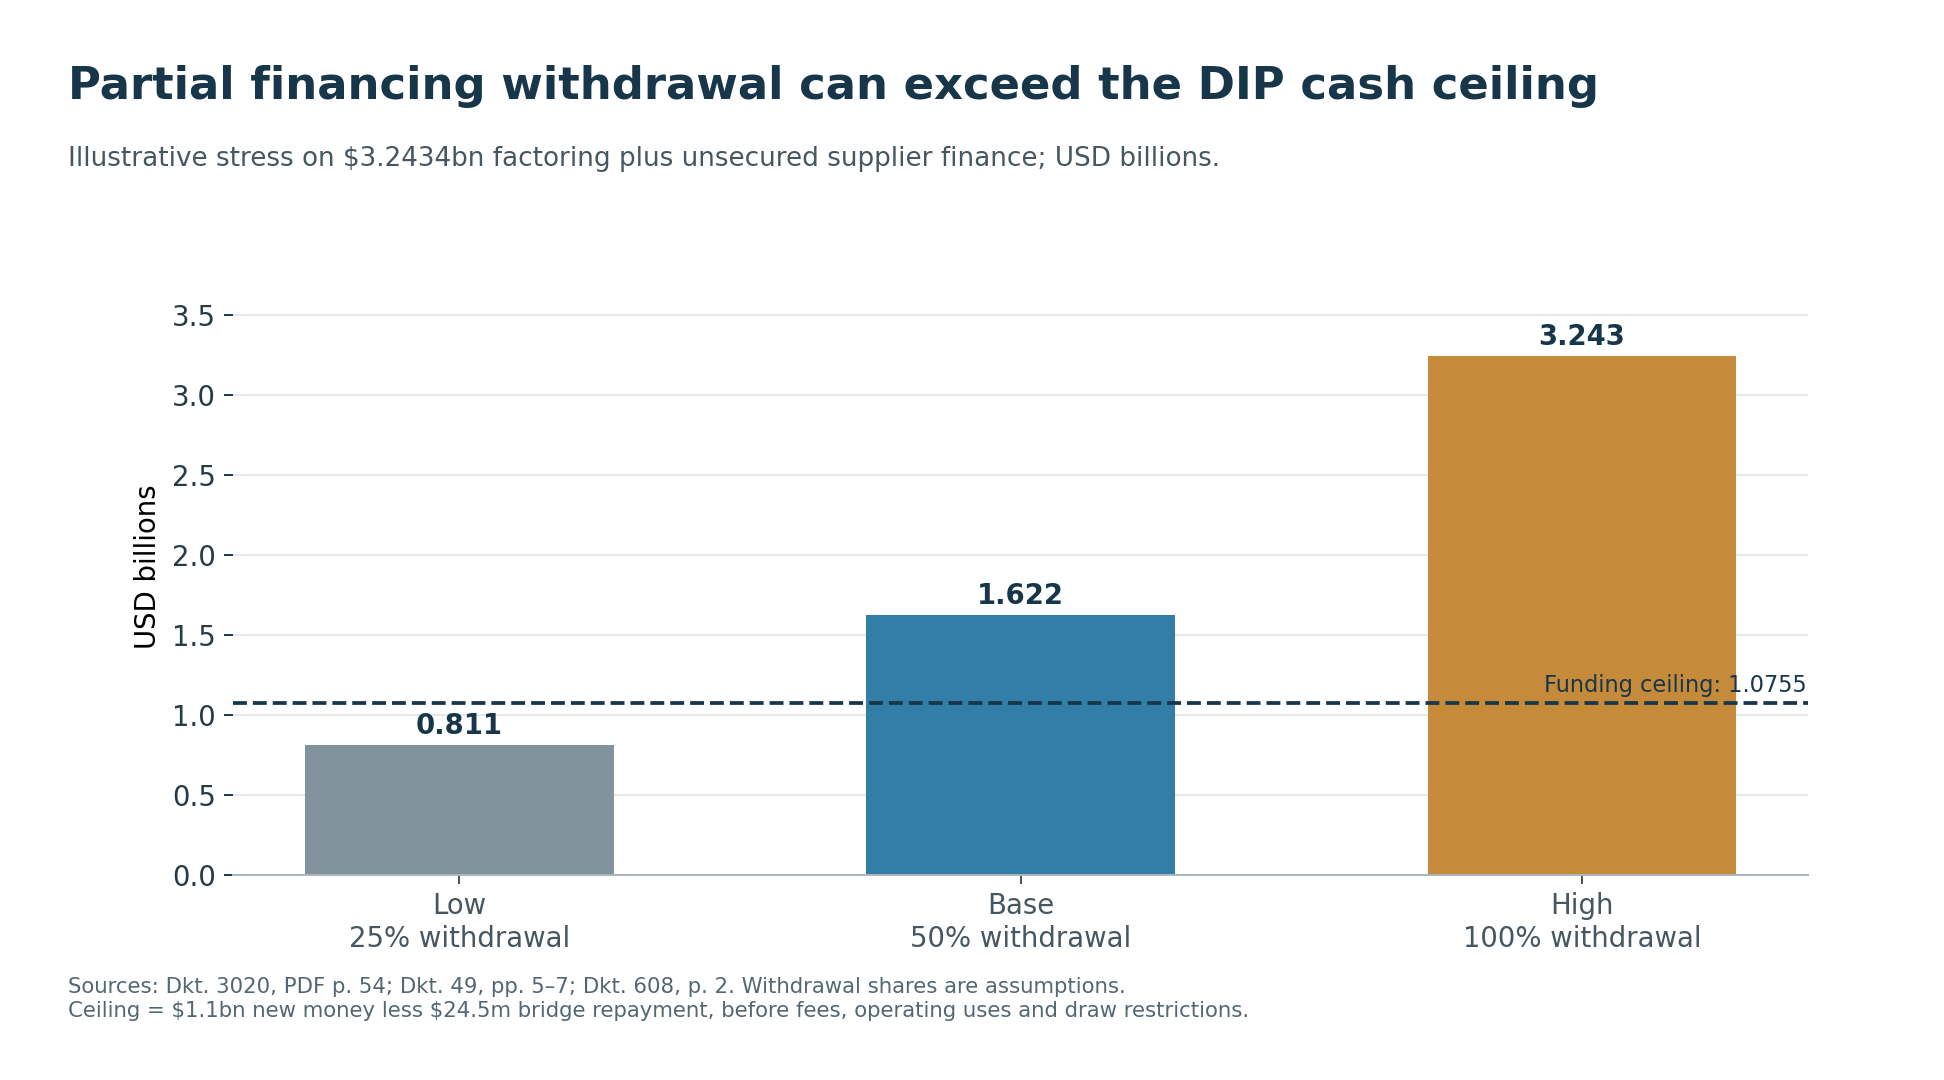
Chart 8. Historical disclosed balances and explicit stress assumptions. This is not a November 2026 funding forecast or a creditor-recovery model.
The base case exceeds that generous ceiling. The result is sensitive to both funding withdrawal and available collections: every additional 10 percentage points of withdrawal adds $324.34 million of gross need. If genuinely available collections offset 25% of the base-case need, the shortfall falls to $140.775 million; a 50% collection offset turns it into a $264.65 million surplus before other uses.
“Available” is decisive. Collections belonging to factors, trapped in controlled accounts or committed to another secured claim cannot automatically fund general operations. Faster collection may also reduce the financing balance being stressed. The workbook exposes both assumptions so readers can avoid counting a collection twice.
The conclusion is conditional: a business relying on this scale of revolving working-capital finance can face a replacement requirement larger than the cash element of a large DIP. Funding needs depend on maturity schedules, controlled cash, net collections, operating burn and remaining commitments. They cannot be inferred from the financing total alone.
Independent checks on the three headline numbers
| Headline | Check against another primary record | Result |
|---|---|---|
| $11.5543bn listed prepetition financing | Re-summed all 13 rows; compared rounded ABL and first-lien balances with exact stipulated amounts in Dkt. 608; compared factoring and supplier-finance aggregates with the filed schedules. | Arithmetic confirmed; full independent agreement unavailable. Major term/ABL components tie within rounding. Scheduled factoring and supplier-finance claims differ and remain unresolved. |
| $1.1bn new money within $4.4bn DIP | Compared the financing motion, final order and later full-draw disclosure. | Confirmed for original authorization and eventual draw. It is not unrestricted cash or the later outstanding claim balance. |
| Dorman 3.78× reclassified coverage | Checked 10-K operating income and interest against the earnings release, and historical factoring fees against the next 10-K. Recomputed the ratio. | Confirmed from matching primary inputs. The ratio reflects the analyst’s reclassification. |
The financing-footprint cross-check is deliberately not labeled an audit. Repetition in two debtor disclosures is not independent verification of every underlying claim. The schedules offer a check on the total precisely because they do not fully agree.
Evidence that would change the conclusion
The broad conclusion would weaken if a complete, independently reconciled financing register demonstrated that substantial categories were duplicative, nonrecourse to the relevant borrower or already extinguished at the measurement date. It would strengthen if bank-confirmed balances and legal-entity guarantees identified additional nonduplicative obligations. A dated reconciliation would show which obligations changed and why.
A verified historical cash-flow series could change the operating diagnosis. Monthly unfinanced receivable days, inventory aging, supplier terms and acquisition cash spending might show adequate underlying cash generation or a persistent funding gap. The public peer accounts point to questions a lender should ask. They leave First Brands’ position within the peer range unknown.
For collateral, decisive evidence would include customer-confirmed invoice balances, factor purchase ledgers, borrowing-base certificates, executed releases, account-control agreements and tracing of collections. Those records could show that apparently repeated financing was permitted and reconciled—or demonstrate incompatible claims on the same collections. The illustrative $100 example cannot substitute for them.
For litigation and recoveries, the redacted examiner report itself, remaining SOFA forms, completed investigative work, subsequent merits judgments and trustee distributions could materially change the assessment. A preliminary report, complaint, proposed plan and fund valuation each answer different questions. None should be silently promoted into a final creditor recovery.
Credit analyst checklist
Borrower, financing and receivables
- Define the borrower and the date. List operating entities, guarantors, inventory vehicles, receivable sellers and nondebtor affiliates. Identify which cash flows support the loan being analyzed.
- Rebuild financing beyond the debt footnote. Include term loans, ABL and letters of credit. Identify factoring, supplier finance and inventory finance. Add leases, guarantees and customer prepayments. Identify principal, accrued charges, contingent exposure and accounting classification.
- Reconcile overlapping schedules. Label which claims are asserted or allowed and which schedules cover an entity or the group. Keep an explicit unresolved-difference column.
- Ask for receivables before factoring. Measure outstanding sold balances at the reporting date. Compare monthly collection patterns and customer concentrations with reported DSO.
Cash flow, acquisitions and collateral
- Put fees on a common basis. Reclassify operating factoring fees consistently in both the coverage numerator and denominator. Do not add a fee twice when it already sits in interest.
- Bridge EBITDA to cash. Include cash interest, recurring financing fees, lease payments, maintenance investment, integration spending and amortization. State each period and avoid substituting debt service for interest.
- Test the acquisition program. Match every acquisition to funding, acquired working capital, ownership, guarantees and subsequent cash transfers. Check whether adjusted earnings and debt use the same consolidation perimeter.
- Validate collateral transaction by transaction. Match invoices to customers, shipments, credits, purchase ledgers and borrowing bases. Confirm lien releases and cash-control arrangements independently; investigate duplicates before advancing.
Funding scenarios and case outcomes
- Stress funding availability and timing. Model withdrawal, collection ownership, maturity, escrow, minimum liquidity and weekly operating uses. Break out new cash from rolled-up or accruing claims.
- Follow holdings through restructuring. Track principal, cost, fair value, trades, DIP allocations, nonaccruals, write-offs and recoveries by instrument. Treat an absent position as an unknown exit unless disposal proceeds are disclosed.
- Label the evidentiary status. Attribute allegations to the pleading, preliminary conclusions to the investigator and decisions to the precise court order. Update the case stage before using a proposed plan.
- Make the next decision conditional. State the missing document or reconciliation that would permit an advance, change valuation or resolve a competing claim. The committee can then identify what would change its decision.
Primary-source notes
- Debtors’ disclosure statements: Dkt. 2692, May 18, 2026, PDF pp. 44–45; Dkt. 3020, June 17, 2026, PDF p. 54 / printed p. 42, capital table and footnotes. The table lists the debtors’ reported obligations. ↩
- First-day declaration, Dkt. 22, September 29, 2025, pp. 14–15, table and footnotes 3–7; pp. 18–30, facilities and SPVs; Onset discussion and footnote 10. The EUR conversion used in the filing is $1.19 per euro. ↩
- Final DIP order, Dkt. 608, November 9, 2025, p. 2, new-money and roll-up components. Model cells: Obligation Calcs
D43:D52. ↩ - DIP financing motion, Dkt. 49, September 30, 2025, pp. 5–7, paragraph 9, including bridge repayment. ↩
- Dkt. 608, pp. 12–15, stipulated prepetition obligations; p. 9 n. 6 and p. 11 n. 7, November 3 agent succession. Exact amounts and rounding differences are preserved in Scalar Inputs and Checks. ↩
- Confirmation denial, Dkt. 3710, August 24, 2026; conversion order, Dkt. 3748, September 1, 2026, pp. 1–2 and p. 7, paragraph 3, preserving factoring ownership disputes. ↩
- Guidepost final fee application, Dkt. 3994, October 26, 2026, p. 8, paragraphs 17–19. It confirms the April 27 public redacted report at Dkt. 2538. Report not obtained; retrieval receipts accompany the package. ↩
- Main LLC schedules, Dkt. 1411, January 20, 2026, Global Notes p. 9, paragraph 21; factoring pp. 155, 167, 168, 191; supplier finance pp. 116, 129, 134, 151, 156, 164, 166–167, 186–187, 189, 191, 196, 200, 203, 205. Exact entry numbers and status flags: scheduled_financing_claims.csv. ↩
- Dkt. 1411, p. 8, paragraph 18, operating leases; pp. 20–21, SOFA revenue described as undetermined; p. 23, entity-only summary. Dkt. 1412 contains Holdings’ schedules. ↩
- Dkt. 3020, PDF p. 61, fully drawn commitment and estimated DIP claims; PDF p. 68, OEM prepayment funding. Amounts are approximate where the disclosure is approximate. ↩
- Dkt. 3506, July 29, 2026, pp. 2–8, maturity, event of default, default interest and forbearance. ↩
- FASB ASU 2022-04, September 2022, pp. 1–3 and ASC 405-50-50-3. The accounting example assumes a qualifying sale and ordinary trade-payable characteristics; it is not a transaction-specific accounting opinion. ↩
- OCC, Asset-Based Lending, Comptroller’s Handbook, especially p. 29, collateral verification and multiple financing; surrounding sections on audits and cash control. ↩
- Debtors’ complaint, Adv. 25-03803, Dkt. 17, November 3, 2025, pp. 14–16, paragraphs 49–57. Allegations only. May 29, 2026 district-court opinion, 4:26-cv-03646, Dkt. 5, pp. 1–4, addresses the discovery stay and appeal. ↩
- United States v. James, 26 Cr. 29, indictment unsealed January 29, 2026, paragraphs 11–17, allegations; DOJ announcement, January 29, 2026, also reports Brumbergs’ January 26 plea. ↩
- Dkt. 3020, PDF pp. 63–64, debtor summary of examiner’s preliminary work and explicit evidentiary reservation; PDF p. 68, incomplete Special Committee investigation. Dkt. 3994, p. 8, paragraphs 17–19. No standalone final Special Committee report was obtained. ↩
- District-court opinion, 4:26-cv-04705, Dkt. 25, July 27, 2026, pp. 1–4, describing the limited underlying ruling in Adv. 26-3006 and dismissing the appeal. ↩
- Dorman FY2024 10-K, filed February 27, 2025, p. 43 operations, p. 44 balances, p. 47 receivable-sale fees. FY2023 opening values: FY2023 10-K, February 28, 2024. Monetary inputs normalized from USD thousands to USD millions. ↩
- Dorman FY2024 10-K, p. 37, balances that would have remained outstanding without sales. Peer Calcs
D18:D23contains the restored-DSO calculation. ↩ - Dorman FY2024 earnings release, February 27, 2025, consolidated statements and supplemental reconciliation; Dorman FY2025 10-K, February 27, 2026, p. 34 and Note 1 p. 44, historical FY2024 factoring fees. Later filing used only for retrospective verification. ↩
- SMP FY2024 10-K, February 27, 2025, p. 46 operations, p. 48 balances, Note 4 pp. 62–63 factoring. Prior year: FY2023 10-K, February 22, 2024. ↩
- SMP FY2024 10-K, Note 3, “Acquisitions,” Nissens closing November 1, 2024; consolidated results include operations after acquisition. The distortion identified here is an analyst comparability inference. ↩
- MPAA FY2025 10-K, June 9, 2025, F-1 balances, F-2 operations; issuer PDF. Prior annual inputs are traced in peer_raw_inputs.csv. ↩
- MPAA FY2025 10-K, F-24–F-25, Notes 11–12, receivable discount programs and supplier-finance roll-forward. Model divides $643.918m by $757.354m sales for the 85.0% annual-flow ratio. ↩
- Dkt. 22, p. 32, paragraph 78 and footnote 12. $1,133m reported EBITDA divided by the $900m debt-service floor is 1.258889; stated debt service exceeds that floor and excludes Onset. The ratio is only a rough upper bound with a period limitation. ↩
- First Brands/TRICO, Centric announcement, December 2, 2020; Horizon Global 8-K, February 8, 2023, introductory note and Item 2.01; Lumileds completion announcement, August 2, 2024, first paragraph. ↩
- Dkt. 49, pp. 3–4, July refinancing process and August pause; The debtor describes the negotiations. ↩
- Polen Capital, “Navigating Credit Risk: Lessons from the First Brands Default,” March 2, 2026, “Aggressive Growth” / “Why We Passed.” First-person retrospective; the underlying July 2025 presentation was not obtained. ↩
- PSBD June 30, 2025 10-Q, filed August 6 and September 30, 2025 10-Q, filed November 5, Consolidated Schedules of Investments, First Brands Group LLC rows; fair-value and principal columns, with nonaccrual footnotes. ↩
- PSEC June 30, 2025 10-K, filed August 26, p. 139; September 30, 2025 10-Q, filed November 6, p. 14, First Brands instrument-level rows. ↩
- GECC June 30, 2025 10-Q, August 4 and September 30, 2025 10-Q, November 4, Consolidated Schedules of Investments, “First Brands Inc.” rows. ↩
- SSGA Active Trust June 30, 2025 N-CSR, September 8, OBND schedule p. 20; December 31, 2025 N-CSRS, March 6, 2026, OBND schedule p. 24. The filing lists the two original loans and the later DIP position. ↩
- Eaton Vance Floating Rate Portfolio, July 31, 2025 schedule filed September 26, p. 7 and unsettled-trade footnote 10, p. 20; October 31, 2025 N-CSR, December 30, p. 20. This is the master fund’s exposure. ↩
- September 30, 2026 filings: PSBD, November 4, schedule p. 5; PSEC, November 4, p. 18 and note 33 p. 26; GECC, November 2, F-26. ↩
- PSEC September 30, 2026 10-Q, realized-loss table p. 158 and explanatory reversal footnote p. 159. Values are USD millions after conversion from the filing’s USD-thousands presentation. ↩
- Jones Day, January 2019 transaction record, heading and client description; MPR Partners’ authored announcement, June 3, 2019, closing/post-closing work; First Brands buyer announcement, July 31, 2020, Brake Parts and Champion, effective immediately. ↩
- RiverPark/Cohanzick, 2Q 2020 shareholder commentary, p. 9, “Trico Group.” This document predates the bankruptcy by five years; The filing gives the manager’s assessment. ↩
- Dkt. 3020, PDF p. 70, summarizing Onset’s answer in Adv. 26-03005, Dkt. 16. This is the debtors’ description of Onset’s opposing position; the underlying answer was not directly obtained. ↩
Supporting material
- Excel model ↗Sourced inputs, live calculations and reported outputs.
- Source and model data (CSV collection) ↗Data tables, source references and calculation exports.