Can Chegg finance its own reinvention?
A financial case study of Chegg’s transition from academic subscriptions to skilling: what the cash-flow improvement buys, and what a durable recovery still requires.
Can Chegg’s cash-flow improvement finance its skilling transition?
Debt retirement and lower investment buy time, but do not by themselves establish a durable recovery. H1 2026 free cash flow improved because a capex reduction exceeded the decline in operating cash flow. The case measures how much new revenue and contribution would need to replace the contracting academic business, then tests liquidity under declared assumptions. June pro forma cash after debt repayment is kept distinct from actual current cash.
Evidence: Chegg Q2 2026 Form 10-Q · Chegg announces full repayment of convertible notes
Read this alongside Who owns the cash flow?.
Chegg paid off its remaining convertible debt in September 2026. The harder question is whether the business can now finance its own reinvention. First-half free cash flow improved even as operating cash flow fell: lower capital spending made up the difference. S4 S2
This case follows the money from the shrinking academic business to the skilling pivot. My conclusion is conditional: cost reductions and debt retirement buy time, but a durable recovery requires new contribution to replace what the legacy business is losing. A reproducible cash bridge and three liquidity stress paths show where that condition becomes a spending decision.
Scope and assumptions
Public-source case study as of October 12, 2026. Latest financial statements used cover June 30, 2026; September 1 debt repayment is a subsequent event. Reported results, management guidance and author scenarios are labeled separately. The approximately $38m reference is June cash and investments pro forma for repayment, not an observed September or October cash balance. Product contribution margins, quarterly paths and reserve floor are illustrative. This is operating and financial analysis, not a stock valuation or a claim of work performed for Chegg.
The business that financed the business
Chegg’s original economic attraction was straightforward: students paid for help with academic work, and a large digital library could serve many customers without rebuilding each answer from scratch. That model depended on students reaching Chegg and deciding its paid service was more useful than the alternatives. A change in either step could weaken the economics before it appeared as a cash shortage.
The company’s annual filing identifies generative AI and changes in Google’s search experience as competitive and traffic risks. That is Chegg’s assessment; the filing does not isolate how much of the decline came from each cause. The accounting evidence establishes a contraction, not a clean causal experiment about AI. S1
Management’s response is a two-business plan: manage Academic Services for cash and build Chegg Skilling into the growth engine. That is a capital-allocation strategy as much as a product pivot. Cash from an older business would finance the time needed to establish a different customer base, distribution model and recurring demand. S5
A transition of this kind has two clocks. The legacy operation loses contribution as revenue falls. The replacement operation needs investment before its contribution becomes large enough to support the company. Paying off debt improves the balance sheet, but it does not synchronize those clocks. The test is whether the replacement business can become economically significant before the legacy funding source weakens too far.
| Reported revenue · $m | FY2024 | FY2025 |
|---|---|---|
| Academic Services | 543.615 | 308.254 |
| Chegg Skilling | 73.959 | 68.654 |
| Total | 617.574 | 376.908 |
Full-year product-line revenue; do not compare these annual totals directly with the quarterly figures below. S1
A larger share is not the same as replacement growth
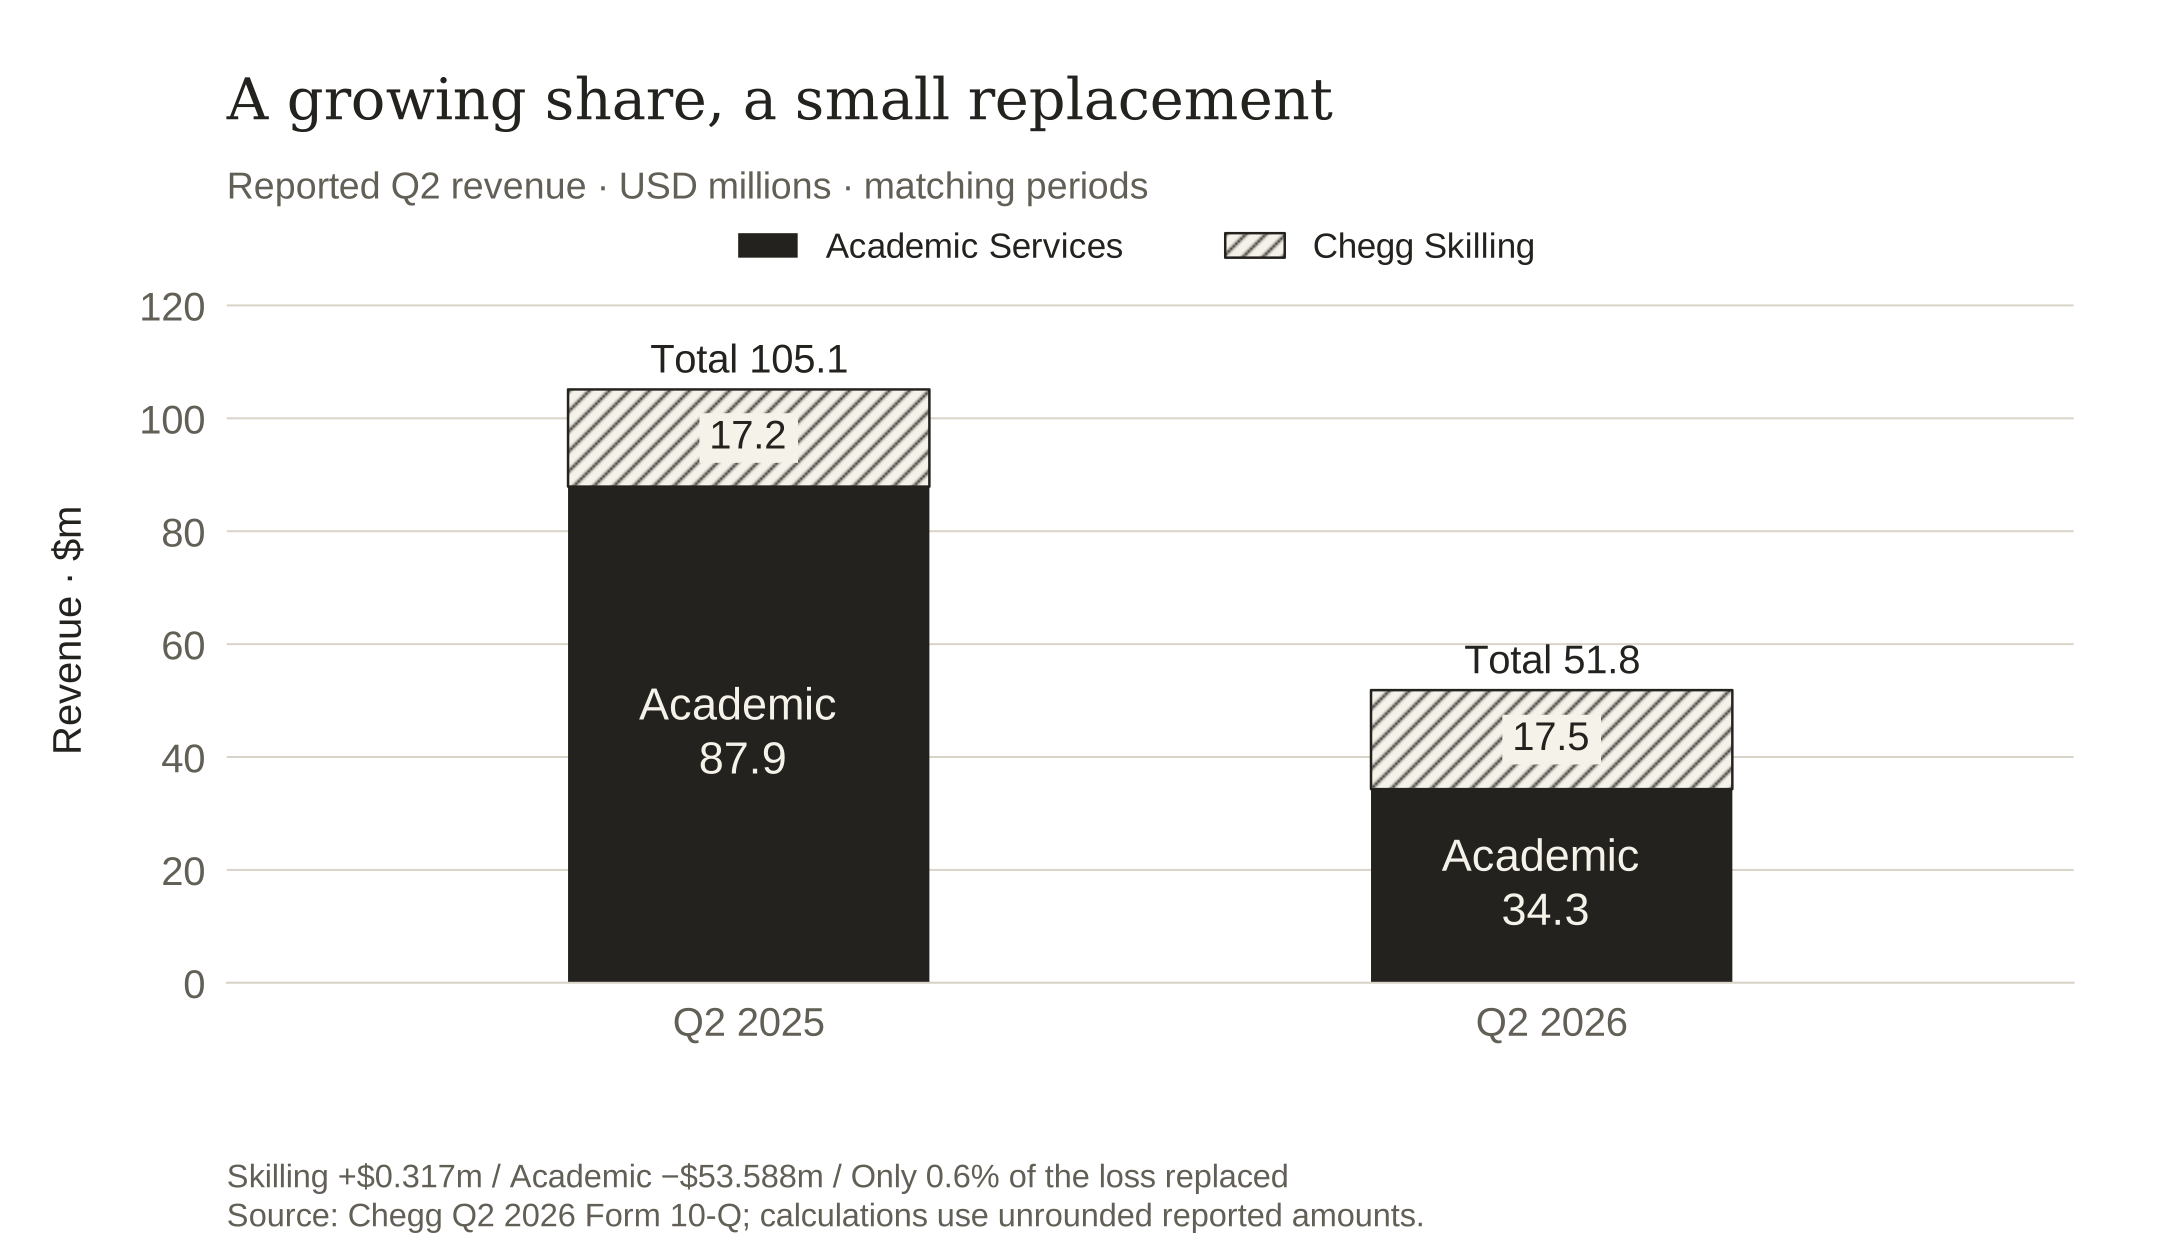
The second-quarter comparison exposes the size problem. Skilling added $0.317m year over year while Academic Services lost $53.588m. The gain replaced about 0.6% of the lost revenue. Skilling’s share of the total nevertheless rose from 16.4% to 33.8%. Most of that change in mix came from a smaller denominator. These are calculations from the reported product-line revenues, not estimates of customer behavior. S2
There are encouraging signs, but they should be measured at their own scale. In the first quarter of 2026, Chegg reported 9% skilling growth and discussed enterprise and channel partnerships. A distribution agreement can open access to customers; it does not establish how much revenue those customers will generate, what delivery will cost, or whether they will renew. S6
For an operating review, I would keep two separate measures: the skilling business’s absolute growth and the dollars of legacy contribution it replaces. A growing percentage of company revenue answers a mix question. It can look healthy while total revenue and total contribution continue falling. The distinction matters when deciding how much fixed cost the new business can support.
This also changes the standard for a successful pivot. A smaller but profitable company could be a viable outcome; restoring Chegg’s former revenue is not a necessary condition. The necessary condition is a cost base and investment budget that the remaining businesses can fund. That is why the next step is to examine cash generation rather than treating a revenue-share chart as proof of recovery.
Why free cash flow improved while operations weakened
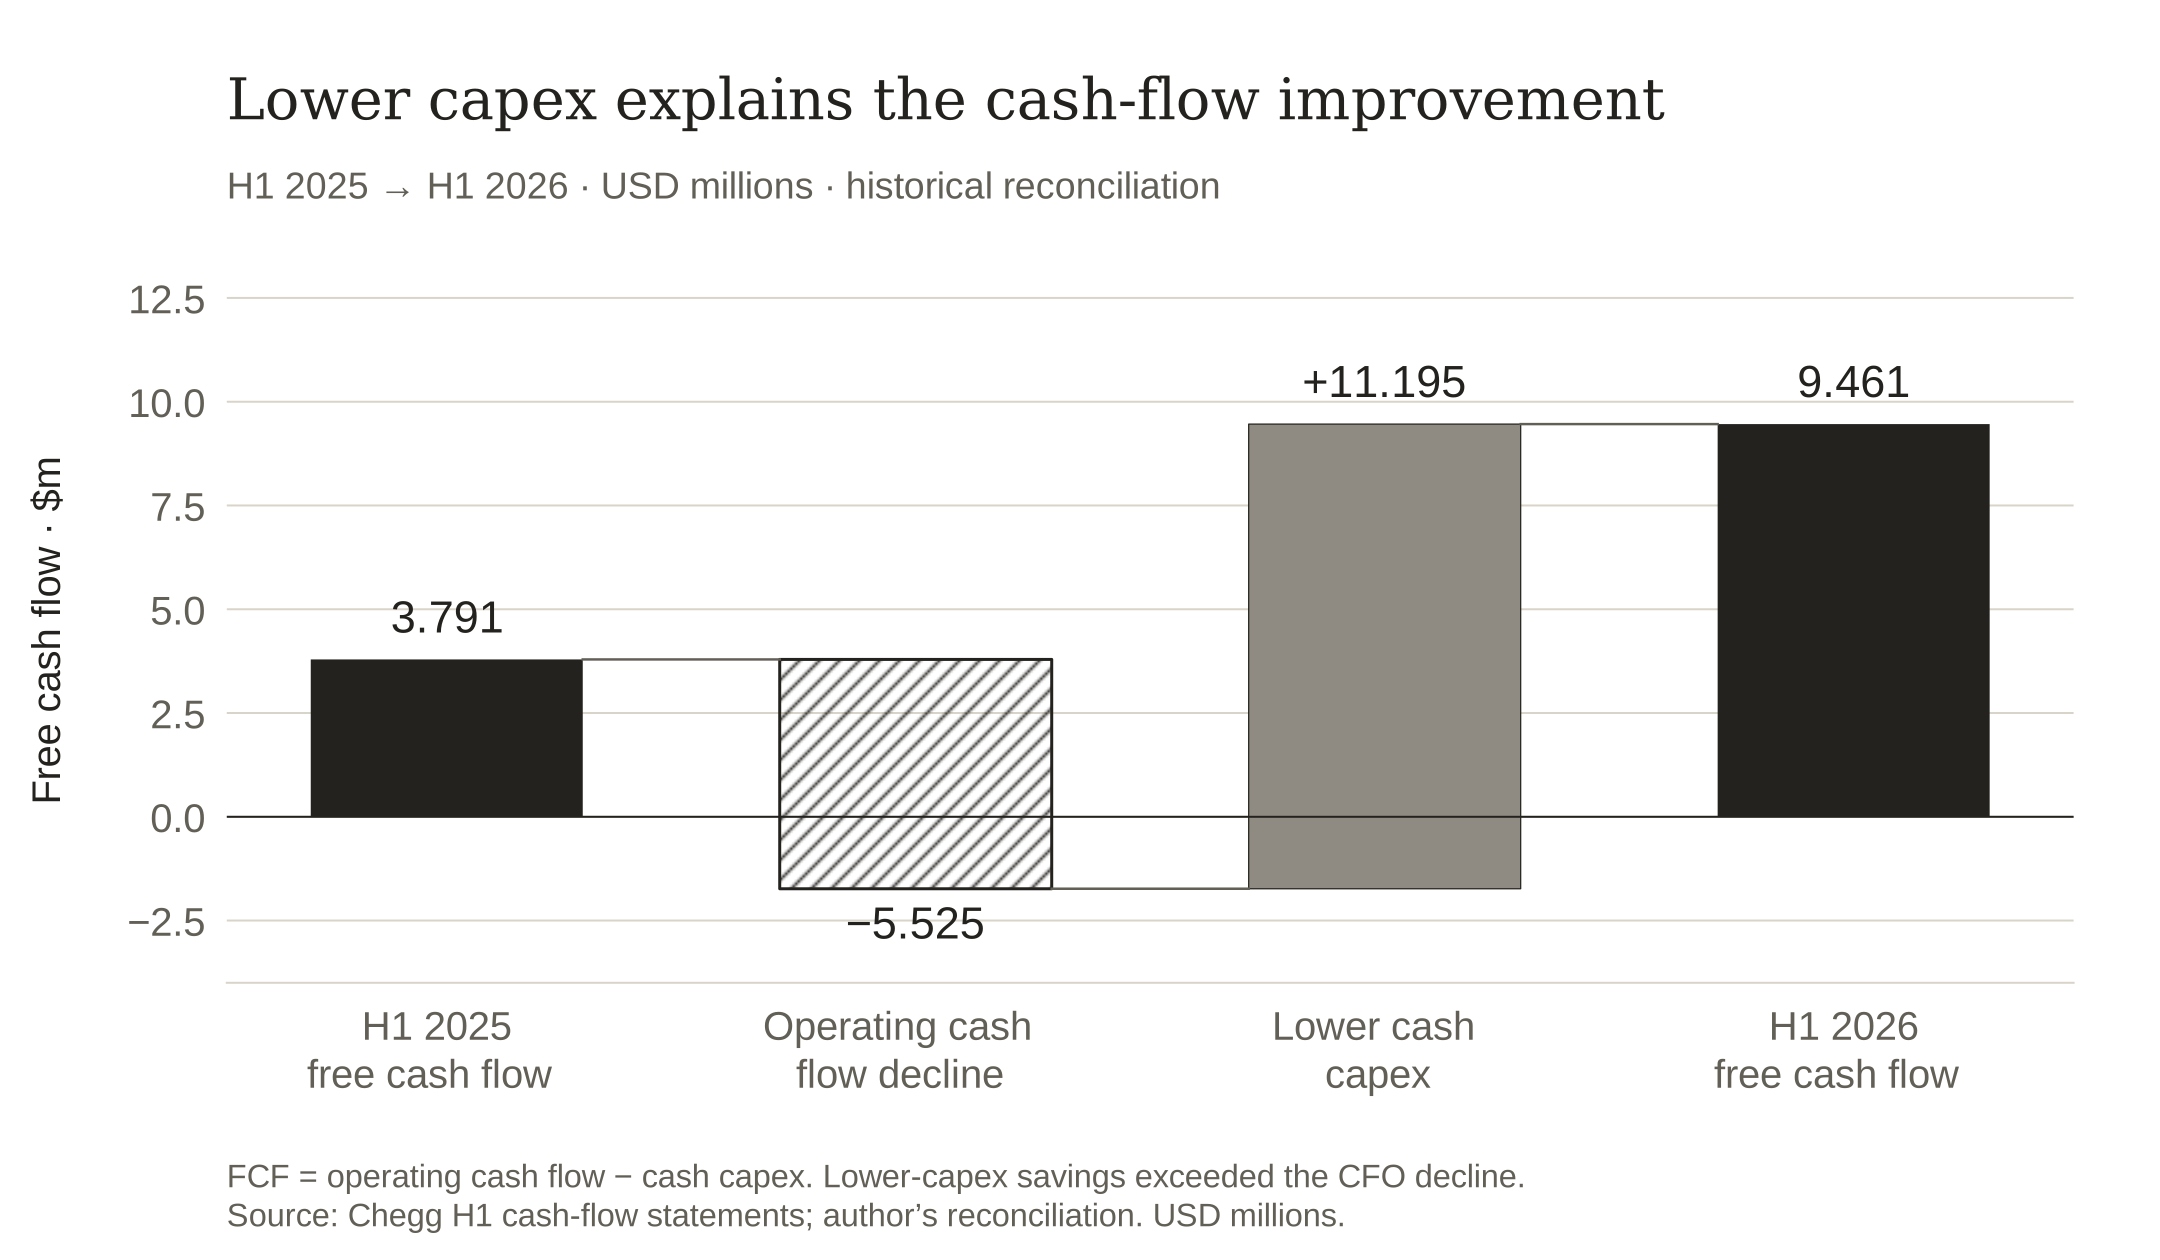
Free cash flow is operating cash flow less cash purchases of property and equipment under Chegg’s definition. The first-half comparison therefore has a simple explanation: operating cash flow fell by $5.525m, while cash capital expenditure fell by $11.195m. The second movement more than offset the first, lifting free cash flow by $5.670m. S2 S3
At the previous year’s cash capex, the same H1 2026 operating cash flow would have produced negative $1.734m of free cash flow. That counterfactual isolates the spending effect. It does not argue that Chegg should have repeated the earlier budget, or that the lower budget was necessarily insufficient.
This is a real cash improvement. Avoiding unnecessary development or content spending can make a smaller business more efficient. But a spending reduction has a different persistence profile from stronger customer economics. Once an investment budget has been reduced, repeating the same dollar saving requires another reduction. The bridge explains the improvement; it does not establish that the improvement can recur.
Chegg capitalizes eligible content and internal-use software costs, so capital spending is relevant to a digital product’s future capabilities, not just physical equipment. The annual filing also describes asset abandonments as products were streamlined. Those disclosures make the quality of the remaining investment a useful question. They do not prove that lower capex will damage the product. S1
The operating question is consequently more specific than ‘Is free cash flow positive?’ It is ‘Can positive cash flow persist at a level of investment that maintains retention, product reliability and a competitive skilling offer?’ Answering that requires operational evidence alongside the financial statements. A cash saving is valuable; a durable cash engine needs a reason customers keep paying.
| Measure | H1 2025 | H1 2026 |
|---|---|---|
| Revenue | 226.507 | 115.111 |
| Adjusted EBITDA | 42.375 | 24.507 |
| Operating cash flow | 19.686 | 14.161 |
| Cash capex | 15.895 | 4.700 |
| Free cash flow | 3.791 | 9.461 |
Comparable six-month periods. EBITDA and free cash flow use Chegg’s non-GAAP definitions; cash capex is cash paid, not asset additions including accruals. S2 S3
EBITDA is only the beginning of the cash bridge
Adjusted EBITDA is useful for seeing the operating earnings management chooses to emphasize. It is an incomplete spending budget. Non-cash charges, excluded restructuring items, customer-payment timing, taxes and capital investment create differences between that measure and cash available to allocate.
Start the reconciliation from GAAP net loss. Adding depreciation, stock compensation and the other cash-flow adjustments produces $26.644m before changes in operating assets and liabilities. Those changes consume a net $12.483m, leaving $14.161m of operating cash flow. Subtract $4.700m of cash capex to reach $9.461m of free cash flow. Each step comes from the cash-flow statement. S2
Some releases of cash offset other uses within working capital; it would be wrong to treat the net amount as one recurring customer-collection problem. Management separately disclosed $14.4m of first-half severance payments. Those payments are already inside reported operating cash flow and free cash flow. Subtracting them again would double-count the outflow. S3
There is an equally common error in the opposite direction: adding back restructuring expenses to describe underlying earnings, then assuming the resulting earnings are spendable cash. A cost can be excluded from adjusted EBITDA and still have to be paid. A turnaround review should show both the recurring cost target and the cash cost of reaching it.
The model below therefore keeps an earnings proxy, cash conversion and capex as separate steps. It does not attempt to forecast GAAP net income from incomplete disclosures. That restraint makes the decision easier to inspect: readers can change the assumed cost reductions or payment drag without pretending they have reconstructed Chegg’s internal budget.
| Step | Cash-flow bridge |
|---|---|
| GAAP net loss | −2.723 |
| Depreciation and amortization | +26.992 |
| Share-based compensation | +5.035 |
| Other reconciliation adjustments, net | −2.660 |
| Before operating asset/liability changes | 26.644 |
| Operating asset/liability changes, net | −12.483 |
| Operating cash flow | 14.161 |
| Cash capex | −4.700 |
| Free cash flow | 9.461 |
The downloadable model retains every operating asset/liability line and reconciles the grouped subtotal. Stock compensation is non-cash in this bridge; that does not make its dilution economically free. S2
Debt-free does not mean $72 million to spend
Chegg confirmed on September 1 that it had repaid the remaining convertible notes at maturity and had no outstanding debt. The announcement described approximately $38m of cash and investments after giving pro forma effect to the repayment against June 30 balances. It did not report a September cash balance. S4
That period distinction protects the whole analysis. The June balance sheet’s $72.314m of unrestricted cash and short-term investments cannot be carried forward as if the principal repayment never happened. Equally, the pro forma amount cannot be relabeled as cash on hand in October. Operations, taxes, investment values and other cash movements could have changed it between those dates.
The cash-flow statement supplies another useful distinction. Cash including restricted balances rose during H1, partly because investments matured or were sold. Turning an investment into cash increases the cash line without creating operating value. The model reconciles the reported cash movement, but the decision uses cash and investments together rather than counting investment maturities as a second source of liquidity.
Debt repayment removes a financing obligation. It also uses liquid assets. In this case the notes carried a zero coupon, so I do not assume that retiring them creates a recurring interest saving equal to the principal repaid. Nor does debt-free status eliminate leases, taxes, supplier payments or other liabilities. The remaining question is how much liquidity the operating transition needs to preserve.
| Definition | USD millions | Period / treatment |
|---|---|---|
| Cash and cash equivalents | 44.623 | June 30; excludes restricted cash |
| Short-term investments | 27.691 | June 30 |
| Cash plus investments | 72.314 | June 30; sum of the two lines |
| Remaining note principal | 33.860 | June 30; paid at September maturity |
| Cash plus investments less principal | 38.454 | Arithmetic pro forma only |
| Reference liquidity used in the stress test | 38.000 | Rounded management pro forma disclosure |
The model uses $38m as a disclosed reference point, not observed current cash. Principal differs from the $33.845m net carrying value because of issuance costs. S2 S4
How fast would skilling have to grow?
A replacement-growth calculation gives the strategy a measurable hurdle. Take the Q2 2026 revenue base and suppose Academic Services loses another 30% in a comparable quarter. That removes $10.2945m. With no change elsewhere, Skilling would need 58.7% growth from its $17.534m base simply to hold total revenue flat. This is an illustrative scenario, not management guidance.
Revenue is only the first hurdle. Suppose, for analysis, that each academic revenue dollar contributes 70 cents before shared operating costs and each skilling dollar contributes 45 cents. The skilling growth needed to preserve that contribution becomes 91.3%. The required growth is higher because the replacement revenue contributes less cash per dollar under these assumptions.
Chegg does not disclose the product-line contribution margins used here. The point is the relationship, not a claim that these are its actual unit economics. If the margins were equal, the revenue and contribution hurdles would coincide. A higher skilling contribution margin lowers the hurdle; delivery-intensive growth raises it. The downloadable inputs expose both margins so readers can test their own view.
The formula is simple: required skilling growth equals academic revenue lost divided by the skilling revenue base. For contribution replacement, multiply that ratio by the academic-to-skilling contribution-margin ratio. Fixed-cost reductions can make up part of the gap. That is why growth, margin and cost reduction must be evaluated together rather than as three disconnected success stories.
| Assumed academic decline | Revenue lost · $m | Skilling growth for flat revenue | Skilling growth for flat contribution |
|---|---|---|---|
| 20% | 6.863 | 39.1% | 60.9% |
| 30% | 10.295 | 58.7% | 91.3% |
| 40% | 13.726 | 78.3% | 121.8% |
Q2 2026 reported revenue bases; author-assumed 70% academic / 45% skilling contribution margins. These are comparable-period decline scenarios, not sequential rates or forecasts. No fixed-cost changes are included.
A four-quarter stress test with every assumption visible
The next calculation asks how much room a reference balance buys when the transition is slower or faster. It begins with $38m of liquidity and uses the midpoints of management’s Q3 guidance—$43.5m of revenue and $1.5m of adjusted EBITDA—as a calibration point. Management’s guidance remains an August outlook; the model’s earnings proxy is not a reported EBITDA result. S3
I allocate that starting revenue to $26m of Academic Services and $17.5m of Skilling, then apply the same assumed contribution margins. Implied shared cash operating costs are $24.575m: $26m × 70% + $17.5m × 45% − $1.5m. That makes the first quarter reconcile before the paths diverge.
Each quarter subtracts $0.5m for net cash-conversion effects and $3m of cash capex. The first also pays $1.2m of assumed residual severance, roughly the June restructuring liability. The timing and conversion drag are assumptions; the model does not claim these are scheduled company payments. Debt repayment is already reflected in the reference opening balance and is never deducted again.
The three paths then change academic revenue, skilling revenue and operating costs sequentially. They deliberately omit seasonality, acquisition spending, fresh borrowing, litigation recoveries, buybacks and changes in investment value. Model quarters 1–4 are hypothetical steps, not estimates of specific reported quarters. Repeating a weak-quarter calibration across a year is a stress choice, not a normalized annual forecast.
That matters because management expects meaningful second-half free cash flow. A deliberately pressured path can differ from that outlook without disproving it. The model shows what would happen under declared conditions. It cannot establish the probability of those conditions or the actual cash balance Chegg will report.
| Input | Assumed value / basis |
|---|---|
| Opening liquid resources | $38.0m; June pro forma reference |
| Reserve floor | $25.0m; author’s illustrative policy |
| Starting revenue | $43.5m; Q3 guidance midpoint |
| Starting earnings proxy | $1.5m; EBITDA guidance midpoint |
| Product contribution margins | Academic 70%; skilling 45%; assumptions |
| Starting cash operating costs | $24.575m; calibrated residual |
| Cash capex | $3.0m each quarter; assumption |
| Other cash-conversion drag | $0.5m each quarter; assumption |
| Residual severance | $1.2m in model quarter 1; timing assumed |
The $25m floor is not a disclosed covenant, company policy or insolvency threshold. All scenarios share the same opening balance and first-quarter calibration.
Costs must move before the cash cushion disappears
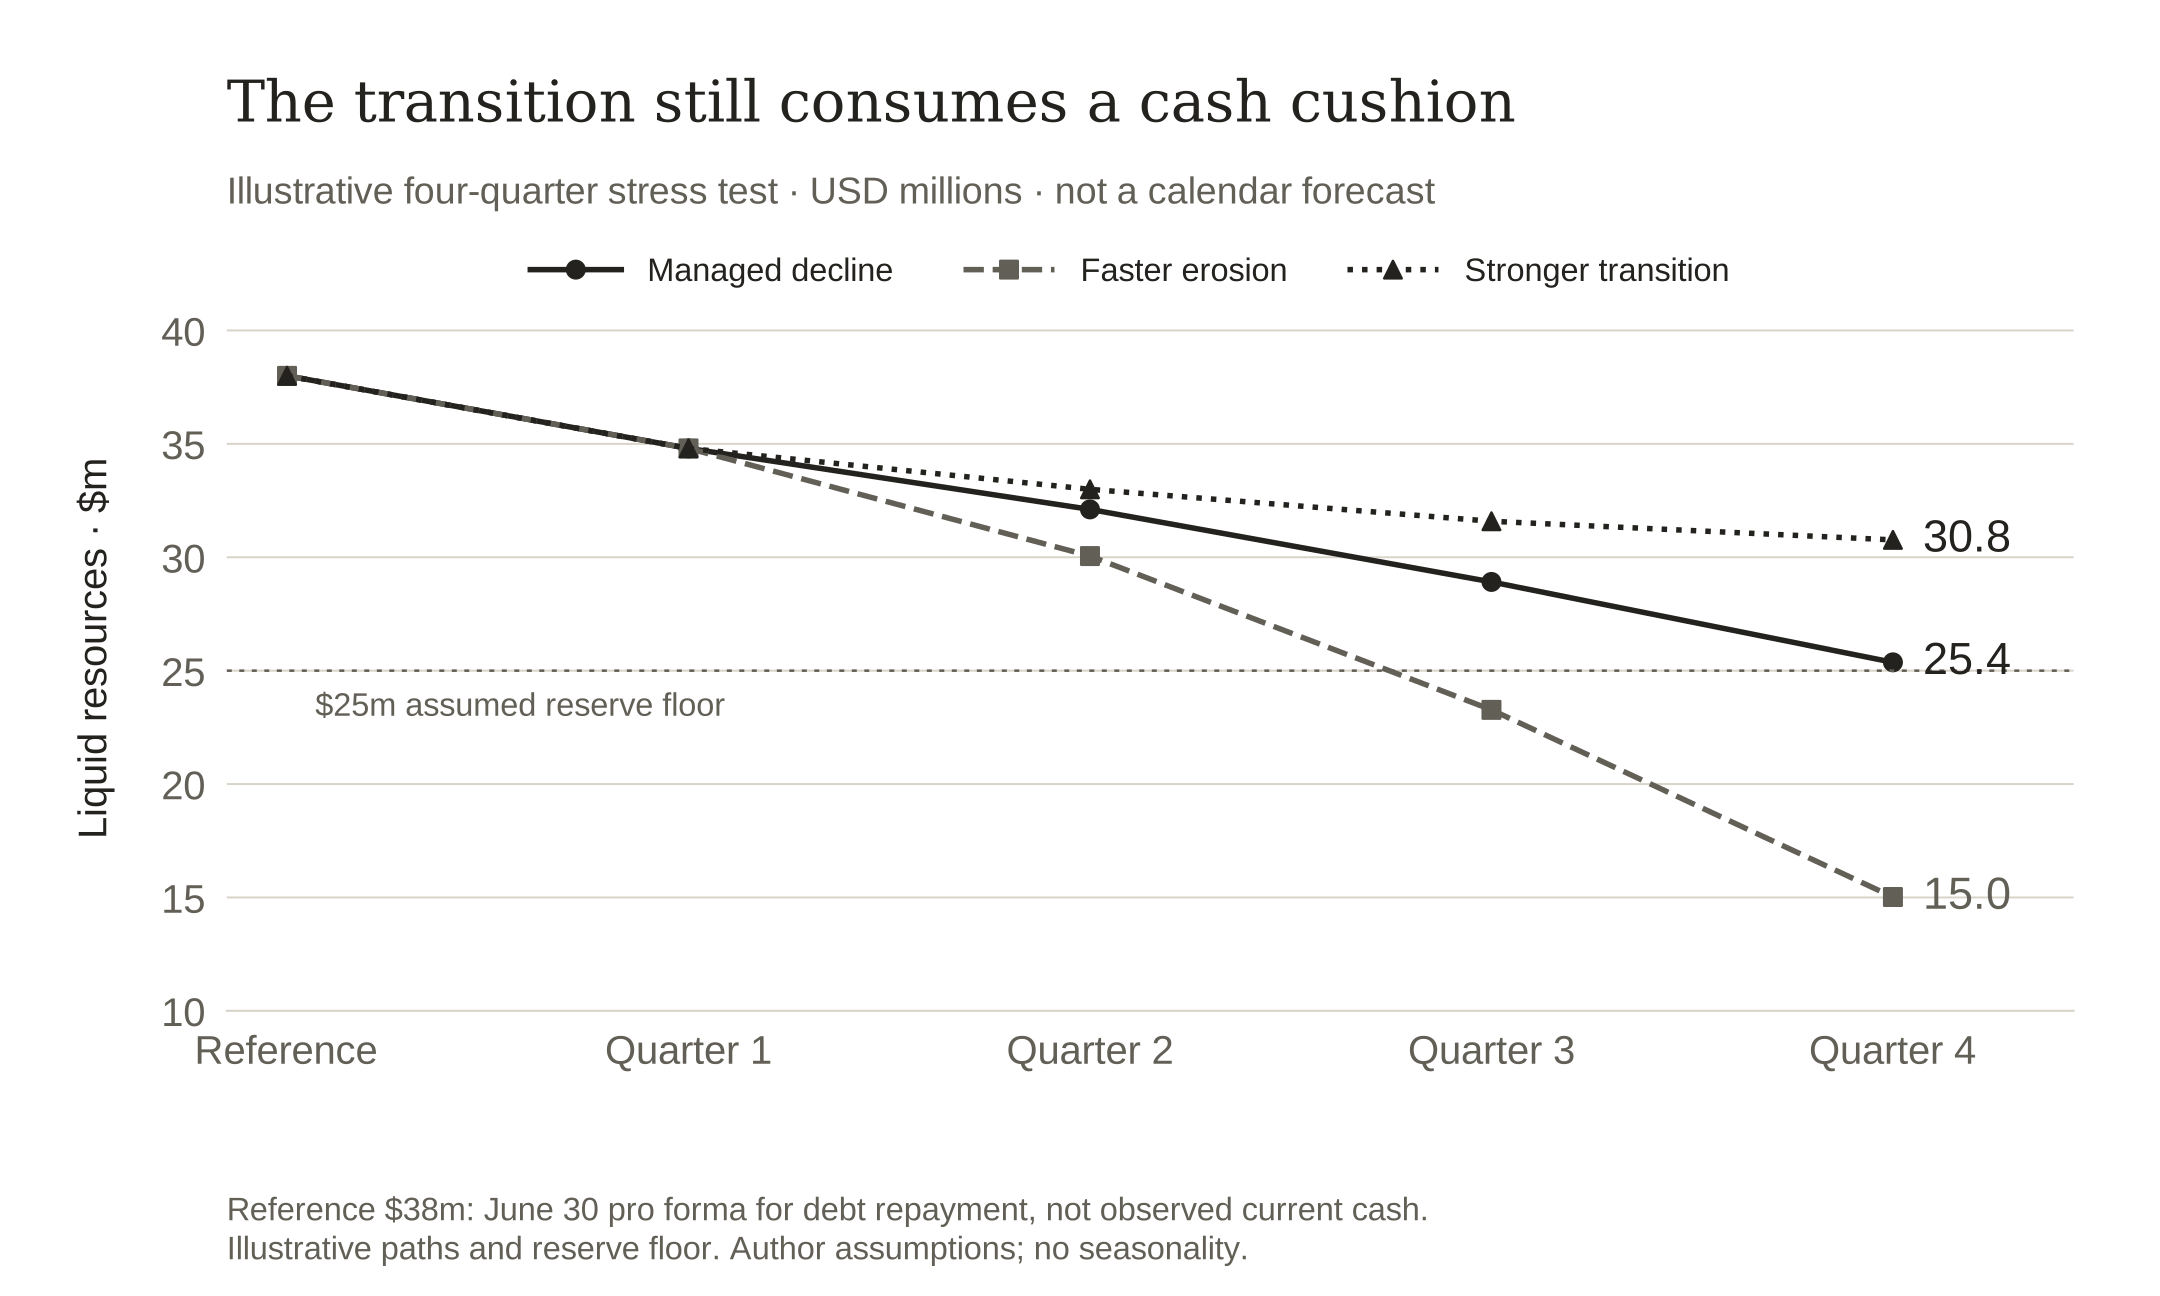
In the managed-decline path, academic revenue falls 10% sequentially after the starting quarter, skilling grows 5%, and cash operating costs fall 3%. After four model quarters, liquidity is $25.4m—only $0.4m above the illustrative floor. The model’s final-quarter earnings proxy is approximately zero. A controlled contraction can therefore consume much of the cushion even without a dramatic one-time shock.
In the faster-erosion path, academic revenue falls 20% sequentially, skilling grows 2%, and the same 3% cost reductions continue. Liquidity falls below the $25m floor in model quarter 3 and ends at $15.0m. The result describes a policy breach, not a prediction of insolvency. It says that waiting for the final cash balance to deteriorate would leave less room to change the operating plan.
The stronger-transition path combines 10% academic declines, 10% skilling growth and 5% cost reductions. Ending liquidity is $30.8m. Even that path consumes $7.2m over the four quarters under the common cash assumptions. Better operating earnings do not immediately mean positive free cash flow when investment and cash payments remain.
A useful sensitivity is direct and inspectable. Each extra $1m of quarterly capex or conversion drag reduces four-quarter ending liquidity by $4m, holding the operating paths fixed. An $8m incremental investment paid at the start reduces every later balance by $8m. In the managed-decline path, that would turn a thin cushion into a material reserve breach.
These outcomes do not select the right strategy by themselves. Cost reductions may eventually weaken retention or delivery, while spending can create valuable future contribution. The model makes that trade-off visible: a proposed investment needs a plausible cash return, payment schedule and downside response, not just an attractive growth narrative.
| Path | Academic decline / qtr | Skilling growth / qtr | Opex reduction / qtr | Ending liquidity · $m |
|---|---|---|---|---|
| Managed decline | 10% | 5% | 3% | 25.4 |
| Faster erosion | 20% | 2% | 3% | 15.0 |
| Stronger transition | 10% | 10% | 5% | 30.8 |
Illustrative sequential rates, distinct from the comparable-period replacement-growth table. Ending liquidity is a model output, not company guidance.
The decision: earn the right to spend the reserve
My operating conclusion is to treat the remaining liquidity as a transition reserve and fund skilling in stages. That is an analytical recommendation under this case’s conditions, not a claim about Chegg’s internal plans. Debt retirement is accomplished; the next capital decision should be tied to recurring contribution and the downside cash path.
The first gate would test demand quality. Separate signed partnerships, enrolled learners, recognized revenue and cash collected. Track renewal or repeat purchase by customer cohort, including whether enterprise distribution creates profitable incremental customers. A strong aggregate growth rate can hide expensive delivery or revenue that does not recur.
The second gate would test economics after delivery. Include instructors or coaches, curriculum maintenance, platform costs, partner economics and the customer-acquisition expense needed to sustain growth. A contribution target should match the service actually sold. Revenue replacing a higher-margin legacy product may require a larger new business than the headline growth rate suggests.
The third gate would test cash timing. Before releasing a new investment tranche, update a near-term cash schedule with actual payments and collections, preserve an explicit reserve, and test weaker academic demand. Reserve size should follow liabilities, volatility and committed spending; the $25m used here is only a device for showing the decision.
Under those gates, a buyback or discretionary project competes with the option to keep funding the transition through a weak period. The relevant comparison is the expected value of the allocation against the lost flexibility. A securities-repurchase authorization is permission to spend, not an available cash balance or proof that spending is the best use of funds.
What would change the conclusion
The next results should be read as evidence about the transition’s pace, not just as a beat or miss against one quarterly guide. Reported liquidity after the debt repayment would replace the pro forma reference. Recurring cash generation at a stable investment level would make the funding case stronger. A rising revenue share alone would not.
I would become more confident if skilling adds enough absolute contribution to cover continued academic erosion, customer cohorts retain that contribution, and positive operating cash flow persists after restructuring payments settle. I would become less confident if liquidity is maintained mainly by further investment cuts, temporary working-capital releases or business contraction that has not yet reached the cost base.
The public evidence leaves important gaps: product-line contribution margins, cohort retention, partnership conversion, normalized development needs and a current post-repayment cash balance. The model names those gaps instead of filling them with precise-looking estimates. Its value is that a reader can see which observation would change the decision, then rerun the calculation when that observation arrives.
- Replacement: compare skilling’s incremental dollars and contribution with the legacy dollars and contribution lost.
- Cash quality: separate operating improvement from capex reductions and temporary releases of working capital.
- Investment quality: connect spending to retention, reliable delivery and customer payback.
- Liquidity: use the newly reported post-repayment balance and actual commitments, not the June pro forma amount.
A cash improvement that needs a second act
Chegg has accomplished real financial repair. The case also shows why the next stage needs a stricter test than debt-free status or positive free cash flow. The historical improvement came from lower investment exceeding a fall in operating cash flow; the replacement business has not yet matched the scale of legacy revenue lost. A sustainable transition needs recurring skilling contribution, a cost base that adjusts in time, and investment that preserves the product’s ability to earn. Until those are demonstrated together, liquidity is the resource that gives the company room to find them.
Assumptions
- USD millions unless stated; cash-capex and free-cash-flow definitions follow Chegg’s reconciliations.
- The four-quarter model is an explicit stress test with no seasonality, not a calendar forecast.
- Contribution margins, cost trajectories and reserve floor are author assumptions; no double-counted debt repayment or severance.
Sources
- Chegg FY2025 Form 10-K
Chegg / SEC EDGAR · Year ended 2025-12-31 · Audited annual filing
Verified Oct 12, 2026
FY2024/FY2025 product-line revenues; AI/search risk discussion; Note 2 capitalization policy; Note 5 content and internal-use software assets.
Company risk attribution is not an independent estimate of AI's causal impact. Book asset values do not measure future product quality.
- Chegg Q2 2026 Form 10-Q
Chegg / SEC EDGAR · 2026-08-06 · Unaudited quarterly filing
Verified Oct 12, 2026
Q2 product-line revenues; H1 operating cash flows and cash capex; cash/restricted-cash reconciliation; June balance sheet; Note 6 debt principal and carrying amount.
June 30 balances precede the September debt repayment. Product-line revenues are disclosed; the contribution margins used in the model are not.
- Chegg Q2 2026 earnings release
Chegg Investor Relations · 2026-08-06 · Company results and outlook
Verified Oct 12, 2026
Adjusted EBITDA reconciliation; H1 free-cash-flow reconciliation; severance payments; capital-spending target; Q3 revenue and EBITDA guidance.
Adjusted EBITDA and free cash flow are company-defined non-GAAP measures. Q3 guidance is management's August outlook, not a reported result or this article's forecast.
- Chegg announces full repayment of convertible notes
Chegg Investor Relations · 2026-09-01 · Subsequent-event disclosure
Verified Oct 12, 2026
Confirms repayment of remaining $33.9m principal and no outstanding debt. Approximately $38m cash and investments is explicitly June 30 pro forma for repayment.
Does not disclose actual September 1 or September 30 cash. Debt-free status does not remove operating leases and other liabilities.
- Chegg FY2025 earnings release
Chegg Investor Relations · 2026-02-09 · Company results and strategy
Verified Oct 12, 2026
Full-year revenue and adjusted EBITDA; management's two-business strategy: grow skilling and manage legacy academic services for cash.
Strategic targets are management expectations, not proof of future growth or independent market sizing.
- Chegg Q1 2026 earnings release
Chegg Investor Relations · 2026-05-06 · Company results and outlook
Verified Oct 12, 2026
Q1 revenue, skilling growth and profitability; discussion of enterprise/channel partnerships and AI-focused offerings.
Quarterly growth and named distribution partnerships do not establish long-run retention, unit margins or customer acquisition payback.
Supporting material
- Reproduce the Chegg case study
Reported inputs and sources, standard-library Python model, quarterly CSVs, executed notebook and figure code. Edit the assumptions and rerun the stress paths.